RF_PH_19_SUDHA.pdf
Media
- extracted text
-
RF_PH_19_SUDHA
pH- (^1.
ANALYSIS
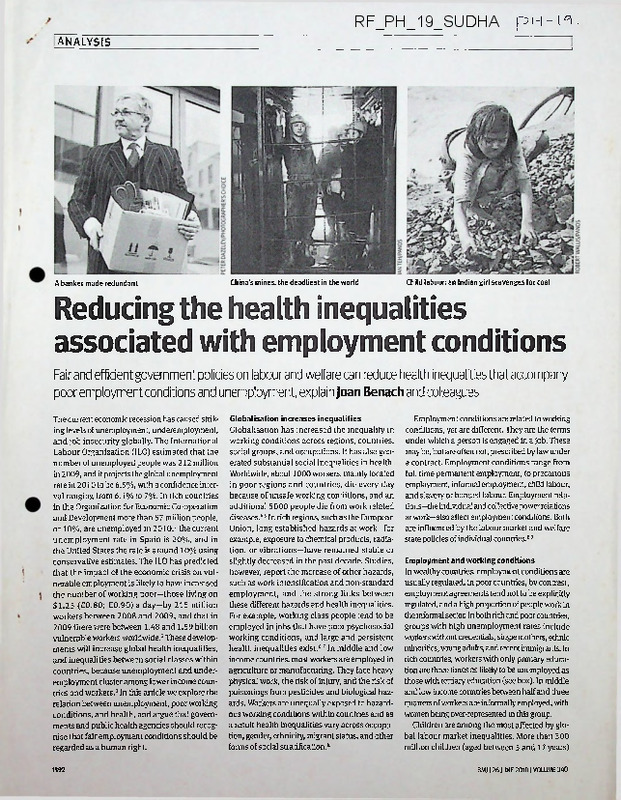
A banker made redundant
China’s mines: the deadliest in the world
Child labour: an Indian girl scavenges for coal
Reducing the health inequalities
associated with employment conditions
Fair and efficient government polides on labour and welfare can reduce health inequalities that accompany
poor employment conditions and unemployment, explain Joan Benach and colleagues
The cunent economic recession has caused strik
ing levels of unemployment, underemployment,
and job insecurity globally. The International
Labour Organization (ILO) estimated that the
number of unemployed people was 212 million
in 2009, and it projects the global unemployment
rate in 2010 to be 6.5%, with a confidence inter
val ranging from 6.1% to 7%. In rich countries
in the Organization for Economic Co-operation
and Development more than 57 million people,
or 10%, are unemployed in 2010,' the current
unemployment rate in Spain is 20%, and in
the United States the rate is around 10% using
conservative estimates. The ILO has predicted
that the impact of the economic crisis on vul
nerable employment is likely to have increased
the number of working poor—those living on
$1.25 (£0.80; €0.90) a day-by 215 million
workers between 2008 and 2009, and that in
2009 there were between 1.48 and 1.59 billion
vulnerable workers worldwide.2 These develop
ments will increase global health inequalities,
and inequalities between social classes within
countries, because unemployment and under
employment cluster among lower income coun
tries and workers.’ In this article we explore the
relation between unemployment, poor working
conditions, and health, and argue that govern
ments and public health agencies should recog
nise that fair employment conditions should be
regarded as a human right.
1392
Globalisation increases inequalities
Globalisation has increased the inequality in
working conditions across regions, countries,
social groups, and occupations. It has also gen
erated substantial social inequalities in health.
Worldwide, about 1000 workers, mainly located
in poor regions and countries, die every day
because of unsafe working conditions, and an
additional 5000 people die from work related
diseases.4 5 In rich regions, such as the European
Union, long established hazards at work—for
example, exposure to chemical products, radia
tion, or vibrations—have remained stable or
slightly decreased in the past decade. Studies,
however, report the increase of other hazards,
such as work intensification and non-standard
employment, and the strong links between
these different hazards and health inequalities.
For example, working class people tend to be
employed in jobs that have poor psychosocial
working conditions, and large and persistent
health inequalities exist.67 In middle and low
income countries, most workers are employed in
agriculture or manufacturing. They face heavy
physical work, the risk of injury, and the risk of
poisonings from pesticides and biological haz
ards. Workers are unequally exposed to hazard
ous working conditions within countries and as
a result health inequalities vary across occupa
tion, gender, ethnicity, migrant status, and other
forms of social stratification.8
Employment conditions are related to working
conditions, yet are different. They are the terms
under which a person is engaged in a job. These
may be, but are often not, prescribed by law under
a contract. Employment conditions range from
full time permanent employment, to precarious
employment, informal employment, child labour,
and slavery or bonded labour. Employment rela
tions—the individual and collective power relations
at work—also affect employment conditions. Both
are influenced by the labour market and welfare
state policies of individual countries.8 ’
Employment and working conditions
In wealthy countries, employment conditions are
usually regulated. In poor countries, by contrast,
employment agreements tend not to be explicitly
regulated, and a high proportion of people work in
the informal sector. In both rich and poor countries,
groups with high unemployment rates include
workers without credentials, single mothers, ethnic
minorities, young adults, and recent immigrants. In
rich countries, workers with only primary educa
tion are three times as likely to be unemployed as
those with tertiary education (see box). In middle
and low income countries between half and three
quarters ofworkers are informally employed, with
women being over-represented in this group.
Children are among the most affected by glo
bal labour market inequalities. More than 300
million children (aged between 5 and 17 years)
BMI126 JUNE 20101 VOLUME 340
ANALYSIS
A German worker dies when scaffolding collapses
The Calcutta stock exchange
A worker sprays crops in Indonesia
are economically active, and over two thirds
are child labourers. Between 12 and 28 million
people globally are enslaved. Most of them are
in Asia, and at least 2.4 million people, mainly
women and girls, are in forced labour as a result
of human trafficking.8
Most of the data that show a link between ill
health and job insecurity, underemployment and
precarious employment, informal employment,
child labour, and forced labour come from wealthy
countries; little research has been conducted in
middle and low income countries.8 The box shows
some of the evidence linking employment condi
tions and health by employment type.
the welfare state, the greater the extent to which
they can maintain their way of living when they
do not have a job. Where social safety nets are
adequate workers can exit the labour market if they
need to and avoid turning to hazardous work or
adverse working environments. Although workers
and employers have a shared interest and respon
sibility in maintaining a healthy working environ
ment, only the employer controls the terms and
conditions of service, and their over-riding concern
is to maximise profits?1 The key to understanding
employment relations and the impact they have on
the health ofworkers is to realise the importance of
the bargaining power that workers have; a leverage
which allows them to push for a stronger welfare
state and better working conditions.8 22
In private market economies, labour unions and
pro-labour social movements are the most effective
institutional means to ensure safety at work.22 23
The relative power of employers, workers, and dif
ferent types of employees has a profound influence
on health and safety at work across welfare state
regimes. Research has shown the important role
played by the psychosocial work environment,
including the amount of control and participation
employees have in the workplace.24 For example,
analyses on three cohorts of middle aged civil servants in England, Japan, and Finland found that
there were significant grade differences in physi
cal functioning in all cohorts and in both men and
women. Those with low socioeconomic status had
worst health. However, the differences in health
among non-manual workers were smaller in the
Finnish cohort, suggesting that more equitable
Employment relations
The more support and protection people have from
EVIDENCE ON EMPLOYMENTCONDITIONS AND HEALTH
UNEMPLOYMENT
• A study in the European Union
identified unemployment as one of
the 10 most important contributors
to thetotal burden of disease in
the 1990s.10 In Britain it has been
estimated that the direct effect
of reducing unemployment has
prevented up to 2500 premature
deathsayear, but the indirect
effects of being employed are
thoughtto be far greater.11
• Unemployment increases rates of
depression, particulady in young
people who have neverworked and
who are usually the worst hit when
jobs are scarce. Parasuicide rates
in young men who are unemployed
are 9.5 to 25 times higherthan in
employed young men.12
• Unemployed people are more likely
to be ill, especially those who have
neverworked or have only had jobs
that are badly paid.”
BMJ126 JUNE 20101 VOLUME 340
PRECARIOUS EMPLOYMENT
• Job insecurity and downsizing have
negative effects on self reported
morbidity and mental health.
These effects tend to increase with
chronic exposure, and their impact
is more detrimental among manual
workers.1*15
• Temporary workers are exposed to
more work hazards than workers
on permanent contracts These
hazards may include being in
painful and tiring positions,
having to listen to intense noise,
carrying out repetitive movements,
and exposure to psychosocial
stressors.16
• Job precariousness has a
detrimental impacton self
reported health and mental
health.” How precarious a job
is will be affected by the labour
market and power relations in the
workplace.18
INFORMAL WORKERS
1 Informal workers are often more
exposed to dangerous work
environments, have higher risk
for occupational injuries or
diseases, and less favourable
health indicators than those
holding formal jobs.8
■ Informal work is associated
with individuals rating their
health as poor, and it also affects
how those people living in the
same house as an informal worker
rate their health.”
1 Workers with no social security
have worse health indicators
than workers with some form
of social security through their
employment.20
CHILD LABOURERS8
• More than one third of all
child labourers are engaged in
hazardous work.
• Exposure to hazards atwork
may be especially harmful to
children. They are extremely
vulnerable to biological or
chemical agents because their
immune system is immature,
and they are not as capable
as adults of supporting heavy
workloads.
BONDED AND SLAVE LABOURERS8
• People in forced labour and
slaves are exposed to the worst
hazards, although information
on these situations is extremely
limited.
1393
ANALYSIS
Human conveyor belts haul coal in China
A13 year old unpaid apprentice in Bangladesh
A jeans factory in China
welfare regimes may help reduce the health gap.25
The political tradition of a country is a key
determinant of its labour laws, regulations, and
level ofsocial protection. Globally, the world may
be divided into different types of labour markets,
according to national incomes and countries’ politi
cal economy. “ These labour markets reflect the role
of the state and, in wealthy countries, there is evi
dence that the relative power of labour institutions
is linked to population health.27 Wealthy countries
with strong labour institutions, such as Sweden,
tend to have the least harmful forms ofemployment
relations, whereas equally wealthy but less labour
friendly countries, such as the United States, have
higher occupational fatality rates.22 28 Only a few
countries have policies for integrating employment
policies into economic and social policies. These
include the Netherlands and Denmark.25 Inter
national institutions such as the United Nations,
World Trade Organization, North American Free
Trade Agreement, Association of Southeast Asian
Nations, or the Southern Common Market should
recognise fair employment conditions—that is, free •
dom from coercion, job security, a fair income, job
protection, respect and dignity, workplace partici
pation and enrichment, and lack of alienation—as
universal human rights.8
ments to protect the health of their population is
by investing in policies and practices that keep
people employed, help those who lose their jobs
cope with the negative effects of unemployment,
and getting unemployed people back into work
as soon as possible.11 Analyses also show that the
beneficial effects of unemployment compensation
are not equally distributed across different gender,
family role, and social class categories—for exam
ple, the mediating role of social class in determin
ing the impact ofunemployment on mental health
differs depending on sex and family roles?3 There
fore unemployment insurance should be universal
and achieve a substantial degree of income replace
ment to guarantee a healthy standard of living for
all groups.
Governments can take action in several ways.
They can make a large economic investments—
for example, a “stimulus package,” and regulate
the financial sector. They can also promote active
labour policies, such as government led job crea
tion, and pursue active labour market policies
such as retraining and job placement.25 Govern
ments can also expand social protection through
measures such as unemployment insurance, and
income support.32 Research in 26 European coun
tries suggests every $10 per person investment in
active labour market programmes reduces the effect
of unemployment on suicides by 0.03 8%.
five labour market and social policies to reduce
employment related health inequalities.
Enacting such policies should be a central
objective for governments. Multinational institu
tions, such as the ILO and WHO, can encourage
this by setting out initiatives that prioritise the
adoption of fair employment policies. At every
level decision makers need to take on board the
views of unions, social movements, and affected
communities. International political, economic,
and public health institutions should recognise
fair employment conditions as universal human
rights?' Healthy, fair employment will not occur if
left to the market alone. It must be made a public
health priority.
Joan Benadi director of the Health Inequalities Research Group
(GREDS). Employment Conditions Knowledge Network (EMCONET).
UniversitatPompeuFabra. Barcelona. Spain
joanbenadr@upf.edu
Cartes Muntaner professor,BloombecgFacultyofNursingand Dalia
Lara Schcolof Pubic Health. Univavty of Toronto, Canada
Haejoo Chungassistant professor, Department of Healthcare
Management. College of Health Sciences. Korea University, Republic
of Korea
Orielle Solar undersecretaryfor public health. Ministry of Health. Chile
Vilma Santana associate professor. Institute of Collective Health.
Federal Universityof Bahia. Brazil
Sharon Friel associate prdesscr. Department of Epidemiology and
Public Health. University Colege London. United Kingdom
Tanja AJ Houweling seniorresearch fellow. Department of
Epidemiologyand Public Health. University College London, UKi
Michael Marmot professor. Department of Epidemiologyand Public
Health. UniversityCollege London. UK
Full authoraffiliations are in the version on bmj.com.
Accepted: 14 March 2010
Contributors and sources: JB and CM planned the paper, and
wrote the first draft HC, OS, VS. MC, SF, TH. and MM reviewed the
manuscript and contributed to the paper.
Prevenance and peer review: Not commissioned and peer reviewed
Competing interests: All authors have completed the Unified
Competing Interest form at www.ianje.orgta_disdosure.pdf
and declare and dedare (1) The haw no financial support for the
submitted vwrk from anyone other than their employer, (2) They
have no financial relationships with commercial entities that might
haw an interest in the submitted work (3) They have no spouses.
partners, or children with relationships with commercial entities
that might have an interest in the submitted wok (4) They have no
non-finandal interests that may be relevant to the submitted work.
Government policies
An important social effect ofeconomic crises is the
rapid increase in unemployment. This increase has
direct and indirect effects onthehealthofworkers.
Direct effects include the generation of uncertainty,
poverty, and social exclusion that can lead to men
tal health problems.17 2’ Indirectly, the pressure on
workers increases. The threat of losing their jobs
becomes a powerful disciplinary mechanism that
is more powerful the higher the level ofunemploy
ment?" The social and population health impact of
the present economic crisis will vary depending on
which social policies are adopted in response.3132
Research suggests that the best way for govem-
1394
The role of health professionals
Health professionals play a crucial role in deal
ing with the health consequences of people who
are unemployed, underemployed, or working in
adverse environment or under less than optimal
conditions. They must also be able to identify the
employment and work related determinants lead
ing to ill health in their patients. Health profession
als can also assist in providing evidence to clarify
the employment and work related health effects
of the cunent crisis. They should also advocate
for governments to adopt fairer and more effec-
BMJ126 JUNE 20101 VOLUME 340
analysis;
bmj.com archive
O News: Doctors are one of the "linchpins" in closing the UK health inequalities gap
(BM/2010;340:c3060)
O Observations: Crocodile tears for health inequality (BM/2010;340:c2970)
bmj.com/video
O Professor Michael Marmot, chair of the World Health
Organization’s commission on social determinants of health,
discusses the effect of the world's financial crisis on global
health in a BMJ video at http://www.bmj.com/video/
bmj.com poll
This week's poll asks: "Is offering unemployment advice part of
a family doctor's remit?"
O Cast your vote on bmj.com
Organization for Economic Co-operation and
Development. Unemployment in OECD countries to
approach 10% in 2010, says OECD, www.oecd.org/docu
mentprint/0,3455,en_2649_33927_43136377 1_1_1
_1.00.html
International Labour Office. Global Employment Trends
January 2010. http://www.ilo.org/wcmsp5/groups/
public/--ed_emp/—emp_elm/—trends/documents/
publication/wcms_120471.pdf
WHO Commission on Social Determinants of Health.
Commission on Social Determinants of Health Final
Report Closing the Gap in a Generation: Health Equity
through Action on the Social Determinants of Health.
WHO, 2008.
Hamalainen P, Takala J, Leena K. Global estimates of fatal
occupational accidents. SafSci2006;44:137-56.
Hamalainen P, Takala J, Leena K. Global estimates of fatal
work-related diseases. AmJIndMed2007;50:28-41.
Parent-Thirion A, Fernandez Macias E, Hurley], Vermeylen
G. Fourth European Working Conditions Survey: European
Foundation for the Improvement of Living and Working
Conditions, 2007.
Marmot M, Siegrist J, TheorellT. Health and the
psychosocial environment at work. In: Marmot M,
Wilkinson RG, eds. Social determinants ofhealth. Oxford
University Press, 1999:105-31.
Benach J, Muntaner C, Solar 0, Santana V, Quinlan M,
EMCONETNetwork employment, work and health
inequalities: a global perspective. (Forthcoming, 2010).
Esping-Andersen G, Regini M. Why deregulate labour
markets? Oxford University Press, 2001.
Diderichsen F, Dahlgren G, V5gero D. Analysis ofthe
proportion ofthe total disease burden caused byspecific
riskfactors. National Institute for Public Health, 1997.
Mitchell R, Doriing D, Shaw M. Inequalities in life and
death: what ifBritain were more equal?1he Policy Press,
2000.
Doriing D. Unemployment and health. BMJ
2009;338:b829.
Bartley M, Sacker A, Clarke P. Employment status,
employment conditions, and limiting illness: prospective
evidence from the British household panel survey 19912001. J Epidemiol Community Health 2004; 58:501 -6.
Bosma H, Marmot MG, Hemingway H, Nicholson AC,
Brunner E, Stansfeld SA. Low job control and risk of
coronary heart disease in Whitehall II (prospective cohort)
study. BMJ 1997;314:558-65.
Feme JE. Is job insecurity harmful to health?/ R Soc Med
2001;94:71-6.
Virtanen M, Kivimaki M, Joensuu M, Virtanen P, Elovainio
M, Vahtera J. Temporary employment and health: a review.
IntJ Epidemiol 2005;34:610-22.
Artazcoz L, Benach J, Borrell C, Cortes I. Social inequalities
in the impact of flexible employment on different domains
of psychosocial health. J Epidemiol Community Health
2005;59:761-7.
Vwes A, Amable M, Ferrer M, Moncada S, Uorens C,
MuntanerC, Benavides FG, Benach J. The Employment
Precariousness Scale (EPRES): Psychometric properties of
a new tool for epidemiological studies among waged and
salaried workers. OccEnvMed 2010 (in press).
BMJ 126 JUNE 20101 VOLUME 340
19 Giatti L, Barreto SM, Cesar CC Household context
and self-rated health: the effect of unemployment
and informal work./ Epidemiol Community Health
2008;62:1079-85.
20 Giatti L, Barreto SM, Cesar CC. Informal work,
unemployment and health in Brazilian metropolitan
areas, 1998 and 2003. Cad Saude Publico
2008;24:2396-406.
21 Muntaner C, Lynch JW, Hillemeier M, Lee JH, David R,
Benach J, et al. Economic inequality, working-class
power, social capital, and cause-specific mortality in
wealthy countries. IntJ Health Serv 2002;32:629-56.
22 Chung H, Muntaner C Political and welfare state
determinants of population health. SocSci Med
2006;63:829-42.
23 Silver BJ. Forces oflabor. Cambridge University Press,
2003.
24 Marmot M, Siegrist J, TheorellT. Health and the
psychosocial environment at work In: Marmot M,
Wilkinson RG, eds. Social determinants of health. Oxford
University Press, 2006:97-130.
25 Sekine M, ChandolaT, Martikainen P, Marmot M,
Kagamimori S. Socioeconomic inequalities in physical
and mental functioning of British, Finnish, and Japanese
civil servants: role of job demand, control, and work
hours. Soc Sci Med 2009;69:141 7-25.
26 Chung H, Muntaner C, Benach J; EMCONET Network
Employment relations and global health: a typological
study of world labor markets. Int J Health Serv
2010;40:229-53.
27 Egan M, Petticrew M, Ogilvie D, Hamilton V, Drever F.
“Profits before people"? A systematic review of the
health and safety impacts of privatising public utilities
and industries in developed countries./Epidemiol
Community Health 2007;61:862-70.
28 Concha-Barrientos M, Nelson DI, Fingerhut M, DriscollT,
Leigh J. The global burden due to occupational injury. Am
J Ind Med 2005;48:470-81.
29 Wilthagen T, Tros F. The concept of “fiexicurity:" a new
approach of regulating employment and labor markets
.Transfer: European Review ofLabor and Research
2004;10:166-186
30 Shapiro C, Stiglitz J E. Equilibrium unemployment as a
worker discipline device. Am Econ Rev 1984:74:433-44.
31 Stuckler D, Basu S, Suhrcke M, Coutts A, McKee M. The
public health effect of economic crises and alternative
policy responses in Europe: an empirical analysis, lancet
2009;374:315-23.
32 Levinson M. The economic collapse. Dissent 2009:61 -5.
33 Artazcoz L, Benach J, Borrell C, Cortes I. Unemployment
and mental health: Understanding the interactions
among gender, family roles, and social class. Am J Public
Health 2004;94:82-8.
34 Benach J, Muntaner C, Solar 0, Santana V, Quinlan M.
Conclusions and Recommendations for the Study of
Employment Relations and Health Inequalities. Int J
Heo/fh Serv 2010;40:315-22.
Qte this as: BMJ 2010;340:c2154
FROM BMJ.COM
Things to be afraid of
Julian Sheatherowns up to a fearof doctors.
“lama doctor myself—of philosophy,
granted—and I work with doctors dayin and
day out. But put me in a patient's cap and
wheel me before a medic and some traitor
part of me will gibber and quake,” he says. “It
is not, I should stress, a fearof diagnosis, not
a fearof bad news. It is a fearof doctors.”
Joe Knight is concerned that media scares
adverselyaffectteenagers like him: “Everyday
the government slaps yet more absurd age
restrictions on the last few activities where we
can breaka sweat and have fun. For example,
a school ice skating trip had to be abandoned
because the months ofcareful planning dearly
weren’t enough to prove that a small group of
fourteen year old kids could safely navigate
a skating session without someone dying or
losing a vital limb.”
Meanwhile, Andrew Burd struggles to define
cosmetic surgery. “I have spent a considerable
amount oftime over the years considering
theword ’cosmetic’and puttingthis into
some sort of context,” he writes. “My first
realisation aboutthe sensitivity of the term was
overhearing the heated theatre coffee room
conversations of my seniors talking about
territory, training, cowboys, etc. That was some
30 years ago, and nothing much has changed.”
Joe Collier blogs aboutTamiflu stockpiling:
"Because offour key clauses in the pricing
contract drawn up between government
and the drugs industry, we in the United
Kingdom stand to lose little or nothing. The
four particular clauses form part of the 2009
Pharmaceutical Price Regulation Scheme.
The scheme is an agreement between the UK
government and each of the drug companies
that sells brand name medicines to the NHS.
In brief, the scheme states that, taking into
account all the drags a company will sell to the
NHS in the forthcoming year, there will be an
agreed target maximum amount the NHS will
pay.”
O Read these blogs and others at
httpy/blogshmj.com/bmj
See FEATURE,p1386
1395
pH201 1
Health inequities
In general, the global reporting of health indicators focuses on national averages. However, data on the
distribution of health and health services within countries and between population subgroups are equally
important. Such data help to identify health inequities — unfair and avoidable differences in health and
health service provision - that arise for example from socioeconomic factors (such as level of education,
occupation and household wealth or income), from geographical location, and from ethnicity and gender.
This section presents data from 93 countries using three health indicators - percentage of births
attended by skilled health personnel, measles immunization coverage among I-year-olds, and under-five
mortality rate - disaggregated according to urban or rural residence, household wealth and maternal
educational level.
The main sources of the data are the Demographic and Health Surveys (DHS) and Multiple Indicator
Cluster Surveys (MICS) conducted between 2000 and 2010. For disaggregation by household wealth, the
total population is classified into wealth quintiles based on relative differences in household wealth within
the country rather than on an absolute wealth criterion. Although the estimates are subject to normal
sample variability (which are usually indicated by confidence intervals), only the point estimates are shown
in this section.
The data presented refer to ratios and differences between the most-advantaged and least-advantaged
groups. However, these measures do not reflect the situation across all population groups (such as groups
falling into the middle of wealth or education distributions) for which other measures are used.
Source:
WORLD HEALTH STATISTICS 2011
© World Health Organization 2011
For more information please visit:
http://www.who.int/whosis/whostat/en/
139
8. Health inequities
.J
Births attended by skilled health personnel,J> (%)
s
1
98
100
1.0
2 j
i
93
100
1.1
7
1.2
16
78
100
1.3
22
83
89
1.1
5 1
5
33
7.4
29
1
1
2008-2009
2006
99
92
100
98
1.0
1.1
6
2005
98
99
1.0
2006
81
97
I
| Ratio highest-lowest
I
.
Educational level of mother'
Highest
s
S
1
Afghanistan
Albania'-'
Algeria ’
Andorra
Angola
Antigua and Barbuda
Argentina
Armenia1
Australia
Austria
Azerbaijan
Bahamas
Bahrain
Bangladesh
Barbados
Belarus"
Belgium
Belize"
Benin
Bhutan
Bolivia (Plurinational State of)
Bosnia and Herzegovina"
Botswana
Brazil
Brunei Darussalam
Bulgaria
Burkina Faso
Burundi"
Cambodia
Cameroon
Canada
Cape Verde1
Central African Republic"
Chad
Chile
China
Colombia
Comoros
Congo
Cook Islands
Costa Rica
CSte d'Ivoire"
Croatia
Cuba
Cyprus
Czech Republic
Democratic People's Republic of Korea
Democratic Republic of the Congo
Denmark
Djibouti"
j
Ratio highest-lowest
■|
Difference highest-lowest
2
Difference highest-lowest
Wealth quintile
Place of residence
•V5
1
■
2007
13
37
2.8
23
5
51
10.3
46
2005
100
100
1.0
0
100
100
1.0
0
2006
2006
93
74
99
86
LI
12
7 :
12
56
97
1.7
42
72
98
1.4
26
2008
2006
51
100
88
100
1.7
1.0
38
0
38
99
99
100
2.6
1.0
61
0
40
91
2.3
51
2003
2005
2005
2004
31
32
39
44
88
75
70
84
2.9
2.4
1.8
1.9
57
43
31
40
39
25
21
29
91
55
90
95
2.3
22
4.3
3.2
52
30
69
65 I
33
30
22
23
95
84
80
92
2.9
2.8
3.6
4.0
2005
2006
2004
64
35
g
91
83
46
1.4
2.4
7.1
27
48
39
2?
4
89
55
3.3
15.4
62
52
34
9
88
67
2.6
72
55
57 '
2005
77
97
1.3
20
72
99
1.4
27
67
97
1.4
30
2005
74
97
1.3
23
67
98
1.5
32
62
93
1.5
2006
40
84
2.1
44
29
95
3.3
66
47
87
1.8
40
2007
63
91
1.4
28
59
98
1.7
39
59
89
1.5
29 ,
2006
40
95
2.3
54
140
:
621
54
58
69
30 i
201 1
.A
Under-five mortality rate* (probability of dying by age 5 per 1000 live births)
Measles immunization coverage among 1-year-olds’0 (%)
Wealth quintile
Place of residence
Educational level of mother'
‘ Educational level of mother'
Wealth quintile
95
100
1.1
5
100 (100)
1.0
^0
67
0.8
-13
72
(62)
44
64
1.5
20
50
10
2.0
43
93
52
1.8
41
13
2.2
15
42
26
1.6
16
52
23
2.2
29
9
64
52
1.2
12
63
41
1.5
1.2
16
77
63
1.2
14
86
43
=
s
e
0
28
0.8
-11
83
1.7
34
46
55
1.2
74
90
■
.
s
lowest
Difference lowest-highest
|
Ratio lowest-highest
I
Highest
S
si
1.2
Difference lowest-highest
=
■■=
58
Ratio lowest-highest
=
5
68
Highest
3
I
_
?
22
s
3
1
g
Lowest
j
Ratio highest-lowest
I :
■£j
i
:Highest
=
-S
to
1
!
2
I
to
s
2
Difference highest-lowest
i
Place of residence
1
82
88
1.1
6
80
89
1.1
9
99
98
1.0
-1
100
98
1.0
-2
79
57
91
68
12
12
12
11
48
76
1.6
28
57
82
1.5
26
27
145
26
116
1.0
1.3
1
30
151
83
1.8
68
143
78
1.8
65
87
80
85
74
1.0
09
-2
-6
88
72
88
76
1.0
1.1
0
4
89
87
1.0
-3
99
55
1.8
44
116
31
3.7
85
134
44
3.1
91
^53
73
1.4
20
78
77
58
85
79
73
1.1
1.0
12
7
3
14
48
77
70
52
71
79
82
83
1.5
1.0
12
1.6
23
3
13
31
54
74
64
46
80
87
91
79
1.5
1.2
1.4
1.7
26 202
178
13
27 i 111
169
33
136
137
76
1.5
1.3
1.5
119
1.4
65 206
190
41
35 ' 127
189
50
144
128
43
88
1.4
1.5
3.0
2.2
62
62
84
101
198
195
136
186
108
55
53
93
1.8
3.5
2.6
2.0
90
140
83
92
87
90
1.0
3
19
38
2.0
18
44
199
208
53
126
179
0.8
1.6
1.2
-9
73 223
28 . 176
112
187
2.0
0.9
187
111
-11 ■ 200
107
143
1.7
1.4
80
57
76
85
1.1
57
76
1.3
78
94
12
56
73
1.3
8
38
4.6
9
69
90
1.3
20
49
84
1.7
16
69
98
1.4
17
51
85
1.7
36
30 f 18
54
3.0
21
70
86
1.2
16 '
33
23
1.4
10
39
16
2.4
23
51
20
2.5
30
36
44
75
1.7
31
136
108
1.3
28
135
85
1.6
51
202
101
2.0
101
29
80
95
1.2
16
34
49
77
1.6
28
177
122
1.5
55
184
97
1.9
87
209
112
1.9
97
73
95
0.8
-22
141
8. Health inequities
Dominica
Dominican Republic
Ecuador
Egypt
El Salvador
Equatorial Guinea
Eritrea
Estonia
Ethiopia
Fiji
Finland
France
Gabon
Gambia"
Georgia"
Germany
Ghana
Greece
Grenada
Guatemala
Guinea
Guinea-Bissau"
Guyana •
Haiti
Honduras
Hungary
Iceland
India
Indonesia
Iran (Islamic Republic of)
Iraq*
Ireland
Israel
Italy
Jamaica"
Japan
Jordan
Kazakhstan"
Kenya
Kiribati
Kuwait
Kyrgyzstan"
Lao People's Democratic Republic"
Latvia
Lebanon
Lesotho1
Liberia
2007
94
96
1.0
2
89
98
1.1
9
86
97
1.1
12
2008
72
90
1.2
18
55
97
1.8
42
60
87
1.5
28
2002
10
65
6.2
54
6
85
14 7
79
12
88
7.3
2005
3
45
16.6
42
1
27
29.7
26
2
58
24.0
55
2000
2006
2005
69
43
98
93
83
99
1.3
1.9
1.0
24
40
1
67
28
95
97
89
99
1.4
3.1
1.0
30
60
3 :
84
49
93
85
1.1
1.7
9 .
36
2008
43
84
2.0
41
24
95
3.9
70
36
78
2.2
42
2005
2006
2006
2005-2006
2005-2006
26
27
82
15
50
81
69
89
47
90
3.1
2.6
1.1
3.0
1.8
55
42
7 ;
15
19
64
5
60
4.0
1.5
10.5
3.0
73
59
29
61
65
33
28
84
80
2.6
2.9
51
52 j
9
33
87
79
93
68
99
37
60
96
6.6
.2.6
51
59
2005-2006
2007
37
63
73
88
2.0
1.4
25
19
44
89
96
4.6
2.2
69
52 •
26
31
75
87
29
2.8
2006
78
95
1.2
17
79
96
1.2
2005
94
99
1.0
4
2007
2006
2008-2009
99
100
37
99
100
75
1.0
1.0
2.0
98
100
21
100
100
82
1.0
1.0
3.9
2 i'
0
61
94
99
1.1
5
38
20
73
3.7
54
2006
2006
96
11
100
68
1.0
6.2
4
57
93
3
100
81
1.1
27.1
78
3
63
18.5
59 ,
2009
2007
54
32
88
79
1.6
2.5
35
47
35
26
90
81
2.6
3.2
55
56
40
36
80
75
2.0
2.1
41
39
Libyan Arab Jamahiriya
Lithuania
Luxembourg
142
31
40
36
1
o i
49^
56
17
201 1
Under-five mortality rate1’ (probability of dying by age 5 per 1000 live births)
Measles immunization coverage among l-year-olds “ (%)
Place of residence
Educational level of motherj
1...............
Wealth quintile
15 :
CK
S
Q
Difference highest-lowest
lowest
Highest
Ratio highest-lowest
Difference highest—
lowest
Rural
Urban
Ratio rural—
urban
Lowest
'Highest
Lowest
Highest
Ratio lowest-highest
81
78
1.0
-3
73
87
1.2
14
53
83
1.6
30
37
37
1.0
1
53
28
1.9
25
57
29
2.0
28
98
98
1.0
0
97
99
1.0
2
98
99
1.0
1
36
29
1.3
8
49
19
2.6
30
44
26
1.7
18
^9
94
1.2
15
80
95
1.2
15
77
96
1.2
19
117
86
1.4
31
100
65
1.5
35
121
59
2.1
62
32
65
2.0
33
25
53
2.1
28
30
63
2.1
33
135
98
1.4
37
130
92
1.4
38
139
54
2.6
85
37
93
61
91
1.6
1.0
24
-3
34
95
71
91
2.1
1.0
37
-3
42
92
64
95
1.5
1.0
22
2
100
150
45
88
96
24
1.1
1.6
1.9
12
54
21
93
55
1.7
38
158
72
2.2
86
.................................
112
140
87
66
1.3
2.1
25
74
88
93
1.1
5
88
95
1.1
7
86
93
1.1
7
91
75
1.2
16
103
43
103
67
1.5
35
49
72
96
56
86
55
83
95
62
84
1.1
12
1.0
1.1
1.0
6
11
-1
6
-2
42
70
94
50
85
57
90
100
67
86
1.4
1.3
1.1
1.3
1.0
15
20
6
17
0
48
72
68
87
1.4
1.2
20
15
102
16
5
71
217
113
1.9 104
3
................................. :
16
........... .....................
36
125
55 . 2.3
70
14 • 50
20
2.5
30
2.1
1.3
1.1
1.5
1.0
1.5
1.5
1.5
92
68
86
133
250
34
78
29
194
52
81
204
253
50
114
43
123
55
65
20
1.9
2.8
57
35
54
73
72
82
1.3
1.1
18
10
40
63
85
85
2.1
1.3
45
22
41
49
80
83
2.0
1.7
39
34
94
60
61
38
1.5
1.6
33
22
118
77
106
78
46 . 94
49
38
2.2
2.5
57
56
60
76
1.3
16
60
79
1.3
19 '
41
41
1.0
0
................................. . 49
37
1.3
12
95
88
0.9
-7
25
36
0.7
-11
91
99
83
95
100
90
1.0
1.0
1.1
4
0
7
92
100
76
96
99
94
1.0
1.0
1.2
4
-1
18
85
95
1.1
10 .
79
92
1.2
13
27
43
86
22
30
75
1.2
1.4
1.1
5
30
27
1.1
3
12 :.................................
11
98
69
1.4
29
86
59
1.5
27
50
35
1.4
15
.................................
38
54
1.4
17
33
60
1.8
27
31
55
1.8
24
78
56
90
77
1.2
1.4
13
20
68
45
92
86
1.4
1.9
24
41
58
78
1.3
20
110
146
89
132
1.2
1.1
21
15
107
138
27 1 76
21
151
88
119
0.9
1.3
-12
33
143
60
39
32
1.7
3.0
2.4
i
■
Difference lowest-highest
-S
=3
=
i
Difference lowest-highest
|
=
OS
s
I
i Ratio lowest-highest
|
Difference rural-urban .
g
;
s
Ratio highest-lowest
Educational level of mother"
Highest
Place of residence
Lowest
Wealth quintile
.................................
80
117
1.3
1.2
8. Health inequities
w;
B irths attended by skilled health personn el,b(%)
Saint Vincent and the Grenadines
Samoa1
San Marino
Sao Tome and Principe1
Saudi Arabia
j
■a
it I1 .
|
!
1
Madagascar
Malawi
Malaysia
Maldives
Mali
Malta
Marshall Islands
Mauritania11
Mauritius
Mexico
Micronesia (Federated States of)
Monaco
Mongolia*
Montenegro1*
Morocco
Mozambique
Myanmar
Namibia
Nauru
Nepal
Netherlands
New Zealand
Nicaragua
Niger
Nigeria
Niue
Norway
Oman
Pakistan
Palau
Panama
Papua New Guinea
Paraguay
Peru1
Philippines
Poland
Portugal
Qatar
Republic of Korea
Republic of Moldova'
Romania
Russian Federation
Rwanda
Saint Kitts and Nevis
Saint Lucia
Educational level of mother”
Wealth quintile
Place of residence
1
I
8
i
I
|
V
f
1
If
~
76
ro
.2
2008-2009
2004
39
53
82
84
2.1
1.6
2009
2006
94
38
99
80
2007
39
90
2005
2005
2003-2004
2003
99
98
40
34
2006-2007
.
|
I
8
S
S
1
1
■
i
i .
42
31
22
47
90
85
4.1
1.8
68
38
23
43
76
83
3.3
2.0
53 :
41 '
■ i
g
2.1
42
90
35
99
86
1.1
2.5
9
51
86
44
99
92
1.2
2.1
13
48
2.3
51
21
95
4.6
75
45
92
2.0
100
100
85
81
1.0
1.0
2.2
2.4
1
2
46
47
98
98
30
25
100
100
95
89
1.0
1.0
3.2
3.6
2
3
66
64
49
31
94
95
1.9
3.0
46
74
94
1.3
20
60
98
1.6
38
50
92
1.8
42
2006
19
52
2.8
33
5
58
12.0
53
11
53
4.7
41
2001
2006
2008
83
8
28
97
71
65
12
8.5
2.4
13 .
62
38
78
5
8
99
59
86
1.3
11.8
10.3
22
54
77
77
13
12
98
81
77
1.3
6.1
6.6
21 I
67
65
2006-2007
30
60
2.0
30
16
77
4.8
61
27
74
2.8
47
2009
2008
61
98
94
99
1.5
1.0
33 .
1
54
97
100
100
1.9
1.0
46
2 |
55
90
93
99
1.7
1.1
39
10
2005
99
100
1.0
0
99
100
1.0
100
100
1.0
-1
2007-2008
49
70
1.4
21
43
71
1.7
28
39
82
2.1
43
2009
78
94
1.2
17
66
95
1.4
29
2008-2009
75
89
1.2
14
74
93
1.3
19
73
88
1.2
15
144
47™
63 1
201 1
Under-five mortality rate «(probability of dying by age 5 per 1000 live births)
Measles immunization coverage among 1-year-olds '-'(%)
Place of residence
Place of residence.
Educational level of mother' |
Educational level of mother"
Wealth quintile
Ratio urban-rural
Difference urban-rural
Lowest
Highest
Ratio highest—
lowest
Difference highest-lowest
Lowest
Highest
Ratio highest-lowest
Difference highest—
lowest
Lowest
Highest
Ratio lowest-highest
Difference lowest-highest
Lowest
Highest
Ratio lowest-highest
Difference lowest-highest
68
78
87
87
1.3
1.1
20
9
51
67
91
88
1.8
1.3
40
21
48
72
87
94
1.8
1.3
84
39
22 i 164
63
116
1.3
1.4
21
48
106
183
48
111
2.2
1.6
98
58
72 i 183
54
86
1.8
2.1
44
97
95
66
94
76
1.0
1.2
-2
10
96
68
94
78
1.0
1.2
-2
11
90
66
95
90
1.1
1.4
5
24
28
234
23
158
1.2
1.5
5
76
28
233
21
124
1.4
1.9
8
110
47
223
12
102
3.8
2.2
35
122
^/9
72
0.9
-7
67
79
1.2
12
70
80
1.1
10
127
114
1.1
14
144
87
1.6
57. 118
89
1.3
29
86
82
86
71
90
84
94
91
1.0
1.0
1.1
1.3
4
3
8
20
88
(83)
83
61
91
(78)
98
96
1.0
0.9
1.2
1.6
3
-4
15
36
69
31
2.2
38
88
66
96
99
1.1
1.5
9
34
69
192
38
143
1.8
1.3
31
49
78
196
26
108
3.0
1.8
52
88
63
201
27
86
2.3
2.3
36
115
82
86
1.0
4
70
95
1.4
25
57
91
1.6
34
76
60
1.3
16
92
30
3.1
63
79
54
1.5 '
25
85
89
1.1
4
73
95
1.3
21
78
99
1.3
21
84
47
1.8
36
98
47
2.1
51
93
32
2.9
60
74
42
34
77
72
59
1.0
1.7
1.8
3
30
25
76
32
17
94
74
75
1.2
2,3
4.3
18
41
58
69
43
19
73
84
69
1.0
2.0
3.6
3
42
50
55
231
191
34
139
121
1.6
1.7
1.6
21
91
70
64
206
219
19
157
87
3.3
1.3
2.5
72
45
49 , 222
132 210
25
92
107
2.9
2.4
2.0
47
130
103
56
69
1.2
13
36
76
2.1
39
51
81
1.6
31
100
78
1.3
21
121
60
2.0
61
102
62
1.6
40
77
82
76
87
1.0
1.1
-2
5 .
75
71
79
91
1.0
1.3
3
20 '
65
33
77
89
1.2
2.8
12
57
35
46
21
28
1.7
1.7
14
19
34
59
17
17
2.0
3.4
17
41
136
30
4.5
106
92
88
1.0
-4
(91)
91
1.0
0
30
20
1.5
9
29
17
1.7
12 1
90
92
1.0
2
89
92
1.0
3
142
87
1.6
55
161
84
1.9
77
174
43
4.0
131
67
48
0.7
-19
65
67
1.0
3
17
3
5.7
14
23
7
3.3
16
86
82
0.9
-4
79
84
1.1
5
69
74
0.9
-5
90
28
3.2
62
138
49
2.8
89
86
95
1.1
1
■
re
<5
Si "S ,
; CC
i| => .]
9
145
1
§; §
.S?
S
Id
IS
OS
CO
1
Rural
■
Urban
Wealth quintile
8. Health inequities
Member State
Year
Births attended by skilled health personnelab (%)
:
Place of residence
I
.I
Wealth quintile
Educational level of mother*
I
1
g
s
1
to
J
i
i
•e
Ratio hig
2005
2005
33
99
85
99
2.5
1.0
51
0
20
98
89
100
4.4
1.0
69
2
42
88
2.1
3 !
45
2008
33
67
2.0
34
28
71
2.5
43
36
73
2.0
37 .
2006
2003
15
85
65
94
4.5
LI
51
9
11
77
7.2
66
25
73
3.0
48
2006
2006-2007
82
70
95
88
12
1.3
13
18
81
51
96
92
1.2
1.8
15 '
42
75
57
95
84
1.3
1.5
20
27 I
2006
2005
2005-2006
2005-2006
2009-2010
2006
88
81
97
98
21
40
98
89
99
98
59
93
1.1
1.1
1.0
1.0
2.9
2.3
9
8
3
0
38
54
78
70
93
95
11
30
99
91
100
100
69
97
1.3
1.3
1.1
1.0
6.5
3.3
21
21
7
5
58
67
81
89
14
44
99
100
50
89
1.2
1.1
3.7
2.0
18
11
36
45
2006
2006
2003
2000
98
100
1.0
2
69
97
90
98
1.3
1.0
21 !
2
97
98
1.0
2
93
97
1.0
5
2006
2007
38
98
80
99
2.1
1.0
43
1
28
97
77
99
2.7
1.0
48
2
26
100
76
99
2.9
1.0
50
-1
2004-2005
47
83
1.8
36
39
90
2.3
51
40
89
2.2
49
2006
2007
100
72
100
87
1.0
1.2
0
15
100
55
100
90
1.0
1.6
0
35
51
86
1.7
35
2002
2006
2007
2005-2006
82
26
31
58
99
62
83
94
1.2
2.3
2.7
1.6
17
35
52
36
58
17
27
46
100
74
91
95
1.7
42
57
64
49
42
27
24
35
94
2.3
2.3
3.1
2.3
52
34
49
46
146
.
ts
g
3
4.3
3.4
2.1
■&>
I
Highest
Highest
Thailand*
The former Yugoslav Republic of Macedonia'
Timor-Leste1
Togo*
Tonga
Trinidad and Tobagor*
Tunisia*
Turkey1
Turkmenistan
Tuvalu
Uganda
Ukraine
United Arab Emirates
United Kingdom
United Republic of Tanzania
United States of America
Uruguay
Uzbekistan*
Vanuatuw
Venezuela (Bolivarian Republic of)
Viet Nam'
Yemen*
Zambia
Zimbabwe
I
1
i
1
Senegal
Serbia*
Seychelles
Sierra Leone
Singapore
Slovakia
Slovenia
Solomon Islands
Somalia*
South Africa'
Spain
Sri Lanka
Sudan
Suriname*
Swaziland
Sweden
Switzerland
Syrian Arab Republic*
Tajikistan*
■
§
1
61
73
81
2011
10
69
95
1.4
71
89
77
85
1.1
1.0
6
-4
71
87
81
84
1.1
1.0
-3
58
65
1.1
6
56
68
1.2
13
23
68
40
59
1.8
0.9
17
-9
22
...
47
80
91
82
95
1.0
1.0
4
89
93
1.0
...
4
80
84
82
93
1.0
1.1
91
90
96
88
66
61
94
96
96
89
74
67
1.0
1.1
1.0
1.0
1.1
1.1
3
6
0
2
9
6
89
89
96
80
54
57
97
96
99
93
75
72
1.1
1.1
1.0
1.2
1.4
1.3
9
8
3
13
21
15
90
71
59
50
96
92
76
82
1.1
1.3
1.3
1.6
(98)
(85)
0.9
-13
26
160
91
1.8
69
183
64
2.8
119 7 152
60
2.5
92
...
56
168
167
1.0
1
136
57
134
51
1.0
1.1
2
6
39
105
38
107
1.0
1.0
-2
24
83
19
70
1.3
1.2
13
21
26
17 ' 87
32
143
10
61
73
2.6
1.4
2.0
...
14
50
100
30
73
75
1.3
19
48
2.0
25
'
3
9
211
145
1.5
66
170
130
1.3
40
118
101
1.2
17 :: 150
95
1.6
55
22
20
1.1
16
26
70
87
150
52
62
2.4
35
88
145
64
2.3
81
1.7
1.4
20
27
97
169
99
84
1.0
1.2
2
15
92
82
0.9
-10
91
80
0.9
-11
74
88
1.2
106
70
1.5
36
133
88
1.5
45
67
77
1.1
10
66
73
1.1.
7
64
82
1.3
18
...
147
20
115
19
1.3
1.1
32
1
172
23
108
9
1.6
2.7
64
164
15 ••
91
1.8
73
78
90
1.2
12
65
91
1.4
26
65
90
1.4
25
138
108
1.3
31
137
93
1.5
44
160
76
2.1
84
98
53
97
50
1.0
0.9
0
-3
97
41
98
(51)
1.0
1.2
1
10
30
21
1.2
1.2
1.7
1.7
51
27
42
49
59
32
72
(28)
81
59
84
63
94
80
89
72
12
1.4
1.1
1.1
14
22
5
8
64
52
88
54
98
86
94
74
1.5
1.6
1.1
1.4
33
33
7
20
49
60
82
30
93
81
90
71
1.9
1.4
1.1
2.3
44
21
8
41
36
86
139
72
16
57
132
64
2.2
1.5
1.1
1.1
53
118
124
72
16
37
110
57
3.3
3.2
1,1
1.3
37
81
14
15
66
29
2.3
38
144
69
105
68
1.4
1.0
147
19'
29
7
8
Difference highest—
lowest
8. Health inequities
RANGES OF COUNTRY VALUES
Minimum
Median
Maximum
148
■Urban
i Rural
Ratio urban-rural
'
3 8? £
Measles immunization coverage among 1-year-olds1 (%)
Difference urban-rural
Under-five mortality rate1-” (probability of dying by age 5 per 1000 live births)
Position: 1268 (12 views)