Statistics with STATA UPDATED VERSION 9
Item
- Title
-
Statistics
with STATA UPDATED VERSION 9 - extracted text
-
Fitting Curves
Basic regression and correlation methods assume linear relationships. Linear models provide
reasonable and simple approximations for many real phenomena, over a limited range of values.
But analysts also encounter phenomena where linear approximations are too simple; these call
for nonlinear alternatives. This chapter describes three broad approaches to modeling nonlinear
or curvilinear relationships:
1. Nonparametric methods, including band regression and lowess smoothing.
2. Linear regression with transformed variables (“curvilinear regression”), including Box-Cox
methods.
3. Nonlinear regression.
Nonparametric regression serves as an exploratory' tool because it can summarize data
patterns visually without requiring the analyst to specify a particular model in advance.
Transformed variables extend the usefulness of linear parametric methods, such as OLS
regression (regre s s), to encompass curvilinear relationships as well. Nonlinear regression,
on the other hand, requires a different class of methods that can estimate parameters of
intrinsically nonlinear models.
The following menu groups cover many of the operations discussed in this chapter. The
final topic, nonlinear regression, requires a command-based approach.
Graphics - Two way
Statistics - Nonparametric analysis - Lowess smoothing
Data - Create or change variables - Create new variable
Statistics - Linear regression and related
Example Commands
.
boxcox y xl x2 x3,
model(Ihs)
Finds maximum-likelihood estimates of the parameter A (lambda) for a Box-Cox
transformation ofy, assuming that/*’ is a linear function of*/, x2, andx3 plus Gaussian
constant-variance errors. The model (Ihs) option restricts transformation to the left
hand-side variable Other options could transform right-hand-side (x) variables by the
same or different parameters, and control further details of the model. Type help
boxcox for the syntax and a complete list of options. The Base Reference Manual gives
technical details.
21
216
Statistics with Stata
. graph twoway mband y x, bands(10)
scatter y x
||
Produces a v versusx scatterplot with line segments connecting the cross-medians (median
x, median j’ points) within 10 equal-width vertical bands. This is one form of “band
regression. Typing mspline in place of mband in this command would result in the
cross-medians being connected by a smooth cubic spline curve instead of by line segments.
. graph twoway lowess y x, bwidth(.4)
||
scatter y x
Draws a lowess-smoothed curve with a scatterplot ofy versus x. Lowess calculations use
a bandwidth of .4 (40% of the data). In order to calculate and keep the smoothed values as
a new variable, use the related command lowess .
.
lowess y x, bwidth(.3)
gen(newvar)
Draws a lowess-smoothed curve on a scatterplot ofy versus x, using a bandwidth of 3
(30% of the data). Predicted values for this curve are saved as a variable named newvar
The lowess command offers more options than graph twoway lowess, including
fitting methods and the ability to save predicted values. See help lowess for details^
nl exp2 y x
Uses iterative nonlinear least squares to fit a 2-parameter exponential growth model,
predicted y = bx b2 x
The term exP2 refers to a separate program that specifies the model itself. You can write
a program to define your own model, or use one of the common models (including
exponential, logistic, and Gompertz) supplied with Stata. After nl, use predict to
generate predicted values or residuals.
. nl log4 y x, init(B0=5, Bl=25, B2=.lz B3=50)
Fits a 4-parameter logistic growth model (log4 ) of the form
predicted v = b 0 + b, /(I + exp(-Z>, (,v - b 5)))
Sets initial parameter values for the iterative estimation process at b- = S b =25 b
and/>3 = 50.
.
’
i
’
2
.1.
regress Iny xl sqrtx2 invx3
Performs cun ilinear regression using the xariables Iny, xl, sqrtx2, and invx3. These
variables were previously generated by nonlinear transformations of the raw variables v,
x2, and x3 through commands such as the following:
.
generate Iny = In(y)
. generate sqrtx2 = sqrt(x2)
- generate invx3 = l/x3
■t i
1
When, as in this example, they variable was transformed,
transformed, the
the predicted
predicted values
values generated
generated
by predict yhat, or residuals generated by predict e, resid, will be also in
transformed units. For graphing or other purposes, we might want to return predicted
values or residuals to raw-data units, using inverse transformations such as
replace yhat = exp(yhat)
/
-
Fitting Curves
217
Band Regression
Nonparametric regression methods generally do not yield an explicit regression equation. They
are primarily graphic tools for displaying the relationship, possibly nonlinear, between^ and
x. Stata can draw a simple kind of nonparametric regression, band regression, onto any
scatterplot or scatterplot matrix. For illustration, consider these sobering Cold War data
(missile.dta) from MacKenzie (1990). The observations are 48 types of long-range nuclear
missiles, deployed by the U.S. and Soviet Union during their arms race, 1958 to 1990:
Contains data from C:\data\missile.dta
obs:
48
vars:
6
size:
1,392 (99.9% of memory free)
variable n ame
missile
country
year
type
range
CEP
storage
type
display
format
value
label
soviet
byte
%15s
%8.0g
%8.0g
%8.0g
float
*8.0g
«9.0g
strlo
byte
Sorted by:
country
type
Missiles (MacKenzie 1990)
16 Jul 2005 14:57
variable label
Missile
US or Soviet missile?
Year of first deployment
ICBM or submarine-launched?
Range in nautical miles
Circular Error Probable (miles)
ye a r
Variables in missile.dta include an accuracy measure called the “Circular Error Probable”
(CEP). CEP represents the radius of a bulls eye within which 50% of the missile’s warheads
should land. Year by year, scientists on both sides worked to improve accuracy (Figure 8.1).
. graph twoway mband CEP year, bands(8)
scatter CEP year
I I
I I
> ytitle("Circular Error Probable, miles")
Figure 8.1
CXI
E T"
of
i
A
2
CL -r-
2
I
I
iij
ro
I IO
O
legend(off)
’
o
1960
1970
1980
Year of first deployment
1990
218
Statistics with Stata
Ml
h:
4
Si
Figure 8.1 shows CEP declining (accuracy increasing) over time. The option bands (8)
instructs graph twoway mband to divide the scatterplot into 8 equal-width vertical bands
an raw me segments connecting the points (median x, mediany) within each band. This
curve traces how the median of CEP changes with year.
Nonparametric regression does riot require theanalyst to specifya relationship’s functional
form in advance. Instead, it allows us to explore the data with an “open mind.” This process
often uncovers interesting results, such as when we view trends in U.S. and Soviet missile
accuracy separately (Figure 8.2). The by (country) option in the following command
produces separate plots for each country, each with overlaid band-regression curve and
scatterplot. Within the by ( ) option are suboptions controlling the legend and note.
• graph twoway mband CEP year, bands(8)
scatter CEP year
11
11
, ytitie("Circular Error Probable, miles")
by(country, legend(off) note(""))
U.S.
Figure 8.2
U.S.S.R.
CM
</)
(D
h
I
E
of
.g
oZ
2
t
iij
o in
6
o
I
1960
H]
J
■
I
1
1970
1980
1990 1960
1970
1980
1990
Year of first deployment
The
. shapes of the
me two
two curves
curves in
in Figure
figure 8.2
8.2 differ
differ substantially.
substantially. U.S. missiles became much
more accurate in the 1960s, permitting a shift to smaller warheads. Three or more small
warheads would fit on the same size missile that formerly carried one large warhead The
accur^y of Sowet missiles improved more slowly, apparently stalling during the late 1960s to
ear y 70s, and remained a decade or so behind their American counterparts. To make up for
t is accuracy disadvantage, Soviet strategy emphasized larger rockets carrying high-yield
warheads. Nonparametric regression can assist with a qualitative description of this sort or
serve as a preliminary to fitting parametric models such as those described later.
We can add band regression curves to any scatterplot by overlaying an mband (or
msplxne ) plot. Band regression’s simplicity makes it a convenient exploratory tool, but it
possesses one notable disadvantage — the bands have the same width across the range ofx
values, although some of these bands contain few or no observations. With normally
distributed variables, for. example, data density decreases toward the extremes. Consequently,
Fitting Curves
219
the left and right endpoints of the band regression curve (which tend to dominate its
appearance) often reflect just a few data points. The next section describes a more
sophisticated, computation-intensive approach.
Lowess Smoothing
The lowess and graph twoway lowess commands accomplish a form of
nonparametric regression called lowess smoothing (for locally weighted scatterplot smoothing).
In general the lowess command is more specialized and more powerful, with options that
control details of the fitting process, graph twoway lowess has advantages of
simplicity, and follows the familiar syntax of the graph twoway family. The following
example uses graph twoway lowess to -plot CEP againstye<"ar for U.S. missiles only
(country
== 0).
z
J==0).
1
. graph twoway lowess CEP year if country
II
II
I
I"of
ro
n
g
CL x-
2
, legend(off) ytitle("Circular Error Probable, miles”)
Figure 8.3
4 *
CXI
I
0, bwidth(.4)
scatter CEP year
Y
iij
ro
♦
^4 \
Im
O
*
♦
♦4
4
4
O
1960
1970
1980
Year of first deployment
1990
A graph very similar to Figure 8.2 would result if we had typed instead
lowess CEP year if country == 0, bwidth(.4)
Like Figure 8.2, Figuie 8.3 (next page) shows U.S. missile accuracy improving rapidly
during the 1960s and progressing at a more gradual rate in the 1970s and 1980s. Lowesssmoothed values of CEP are generated here with the name IsCEP. The bwidth (. 4) option
specifies the lowess bandwidth: the fraction of the sample used in smoothing each point. The
default is bwidth (. 8). The closer bandwidth is to 1, the greater the degree of smoothing.
Lowess predicted (smoothed) y values for n observations result from n weighted
regressions. Let k represent the-half-bandwidth, truncated to an integer. For eachy/, a
220
Statistics with Stata
smoothed value y/ is obtained by weighted regression involving only those observations within
the interval from i = max(l, i - k) through i = min(z + k, n). The jth observation within this
internal receives weight
according to a tricube function:
^ = (l-|Wy|3)3
where
uj = (xi-xj)/
A stands for the distance between x, and its furthest neighbor within the interval. Weights
equal 1 forx,=xy, but fall off to zero at the interval’s boundaries. See Chambers et al. (1983)
or Cleveland (1993) for more discussion and examples of lowess methods.
lowess options include the following.
mean
For running-mean smoothing. The default is running-line least squares
smoothing.
noweight
Unweighted smoothing. The defaultis Cleveland’s tricube weighting function.
bwidth( )
Specifies the bandwidth. Centered subsets of approximately bwidth x n
observations are used for smoothing, except towards the endpoints where
smaller, uncentered bands are used. The default is bwidth (. 8).
logit
Transforms smoothed values to logits.
adjust
Adjusts the mean of smoothed values to equal the mean of the original y
variable; like logit, adjust is useful with dichotomous y.
gen (newvar)
Creates newvar containing smoothed values ofy.
nograph
Suppresses displaying the graph.
plot( )
Provides a way to add other plots to the generated graph; see help
plot_option.
rlopts ()
Affects the rendition of the reference line; see help cline__options .
■ I
I
Because it requires n weighted regressions, lowess smoothing proceeds slowly with large
samples.
In addition to smoothing scatterplots, lowess can be used for exploratory time series
smoothing. The file ice.dta contains results from the Greenland Ice Sheet 2 (GISP2) project
described in Mayewski, Holdsworth, and colleagues (1993) and Mayewski, Meeker, and
colleagues (1993). Researchers extracted and chemically analyzed an ice core representing
more than 100,000 years of climate history, ice.dta includes a small fraction of this
information: measured non-sea salt sulfate concentration and an index of “Polar Circulation
Intensity” since AD 1500.
Fitting Curves
1
Contains data from C:\data\ice.dta
obs:
271
vars:
3
size:
5,962 (99.9% of memory free)
variable name
storage display
type 'format
year
sulfate
PCI
Sorted by:
value
label
int
%ty
double %10.0g
double %6.0g
221
Greenland ice (Mayewski 1995)
14 Jul 2005 1 4 : 57
variable label
Year
S04 ion conce tration, ppb
Polar Circula ion Intensity
year
To retain more detail from this 271-point time series, we smooth with a relatively narrow
bandwidth, only 5% of the sample. Figure 8.4 graphs the results. The smoothed curve has been I
drawn with “thick” width, to visually distinguish it from the raw data. (Type help
linewidthstyle for other choices of line width.)
. graph twoway lowess sulfate year, bwidth(.OS) clwidth(thick)
||
line sulfate year, cipattern(solid)
I I
r ytitle("SO4 ion concentration, PPb")
legend(label(1 "lowess smoothed") label (2 "raw data"))
o
o
Figure 8.4
CM
S-o
Q.IO
o
ro
h
c°
o
c
o
O
W
j
JJ
o -I____
1500
1600
—
1700
Year
lowess smoothed
1800
1900
2000
raw data I
Non-sea salt sulfate (SO 4 ) reached the Greenland ice after being injected into the
atmosphere, chiefly by volcanoes or the burning of fossil fuels such as coal and oil. Both the
smoothed and raw curves in Figure 8.4 convey information. The smoothed curve shows
oscillations around a slightly rising mean from 1500 through the early 1800s. After 1900, fossil
fuels drive the smoothed curve upward, with temporary setbacks after 1929 (the Great
Depression) and the early 1970s {combined effects of the U.S. Clean Air Act, 1970; the Arab
oil embargo, 1973; and subsequent oil price hikes). Most of the sharp peaks of the raw data
222
Statistics with Stata
rJ;- ’■
have been identified with known volcanic eruptions such as Iceland’s Hekla (1970) or Alaska’s
Katmai (1912).
After smoothing time series data, it is often useful to study the smooth and rough (residual)
series separately. The following commands create two new variables: lowess-smoothed values
of sulfate (smooth) and the residuals or rough values (rough) calculated by subtracting the
smoothed values from the raw data.
. lowess sulfate year, bwidth(.OS) gen(smooth)
label variable smooth "SO4 ion concentration (smoothed)’’
. gen rough = sulfate - smooth
. label variable rough "SO4 ion concentration (rough)"
Figure 8.5 compares the smooth and rough time series in a pair of graphs annotated using
the text ( ) option, then combined.
. graph twoway line smooth year, ylabel(0(50)150) xtitle(’”')
ytitle ("Smoothed”) text(20 1540 ’’Renaissance")
text (20 1900 "Industrialization”)
text(90 1860 "Great Depression 1929")
text (150 1935 "Oil Embargo 1973") saving(fig08_05a, replace)
. graph twoway line rough year, ylabel(0(50)150) xtitle<"")
ytitle("Rough") text(75 1630 "Awu 1640", orientation(vertical ))
text(120 1770 "Laki 1783", orientation(vertical))
text(90 1805 "Tambora 1815", orientation(vertical))
text(65 1902 "Katmai 1912", orientation(vertical))
text(80 1960 "Hekla 1970", orientation(vertical))
yline(0) saving(fig08_05b, replace)
. graph combine fig08_05a . gph fig08_05b. gph, rows(2)
Figure 8.5
S
Oil Embargo 1973
■o o
<D
Great Depression 1929
£
o
w8
Renaissance
Industrialization
o
1500
1600
1800
1700
8
1900
2000
co
CO
o
5
o
CD
£
CM
CD
ro
.Q
D
<5
E
4
a°
o
o
ro
o
1500
1600
1700
1800
1900
2000
Fitting Curves
223
—
Regression with Transformed Variables — 1
I
I
By subjecting one or more variables to nonlinear transfonnation, and then including the
transformed variable(s) in a linear regression, we implicitly fit a curvilinear model to the
underlying data. Chapters 6 and 7 gave one example of this approach, polynomial regression,
which incorporates second (and perhaps higher) powers of at least one x variable among the
predictors. Logarithms also are used routinely in many fields. Other common transformations
include those of the ladder of powers and Box-Cox transfonnations, introduced in Chapter 4.
Dataset tornado.dta provides a simple illustration involving U.S. tornados from 1916 to
1986 (from the Council on Environmental Quality, 1988).
Contains data from C:\data\tornado.dta
obs:
71
vars :
size :
4
994 (99.9% of memory free)
variable name
storage
type
display
format
int
int
int
float
%8.0g
%8.0g
%8.0g
%9.0g
year
tornado
lives
avlost
Sorted by:
value
label
U.S. tornados 1916-1986
(Council on Env. Quality 1988)
16 Jul 2005 14:57
variable label
Year
Number of tornados
Number of lives lost
Average lives lost/tornado
year
The number of fatalities decreased over this period, while the number of recognized
tornados increased, because of improvements in warnings and our ability to detect more
tornados, even those that do little damage. Consequently, the average lives lost per tornado
{avlost) declined with time, but a linear regression (Figure 8.6, following page) does not well
describe this trend. The scatter descends more steeply than the regression line at first, then
levels off in the mid-1950s. The regression line actually predicts negative numbers of deaths
in later years. Furthermore, average tornado deaths exhibit more variation in earlv years than
later — evidence of heteroskedasticity.
224
Statistics with Stata
graph twoway scatter avlost year
•
I I
I I
Ifit avlost year, cipattern(solid)
, ytitle("Average number of lives lost") xlabel(1920(10)1990)
xtitle(I”") legend(off) ylabel (0(1)7) yline(0)
Figure 8.6
<0 -
w
_oin -
</)
(D
*o
<D
n
Eco □
c
0)
O)CM <u
0)
o
1920
1930
1940
1950
1960
1970
1980
1990
The relationship becomes linear, and heteroskedasticity vanishes if we work instead with
logarithms of the average number of lives lost (Figure 8.7):
.
generate loglost = In(avlost)
. label variable loglost "In(avlost)"
.
regress loglost year
Source
ss
|
df
MS
Number of obs =
F( 1,
69) =
Prob > F
R-squared
Adj R-squared =
Root MSE
Model |
Residual |
115.895325
43.8807356
1
69
115.895325
.63595269
Total
159.77606
70
2.28251515
Coef.
Std. Err
t
P>|t |
- .0623418
120.5645
.004618
9.01C312
-13.50
13.38
0.000
0.000
-------------- +
|
loglost |
------- +
year |
_cons |
. predict yhat2
(option xb assumed;
[95% Conf.
- . 0715545
102.5894
fitted values)
.
label variable yhat2 "In(avlost)
.
label variable loglost
=
"In(avlost)”
120.56
.06year"
71
1=2.24
•:. logo
0.7214
."9747
Interval]
- .053129
138 . 5395
Fitting Curves
225
• graph twoway scatter loglost year
I I mspline yhat2 year, cipattern(solid) bands(50)
I I , ytitle("Natural log(average lives lost)")
xlabel (1920 (10) 1990) xtitle ('”' ) legend(off) ylabel(-4 (1) 2)
yline (0)
Figure 8.7
CM
4
9
*
</)
0)0 0)
CD
ro
oV ro
O)
o
u.
9
t
4 1
* e
€
-
CT
z
t
co -
-
1920
1930
1940
1950
1960
1970
1980
1990
The regression model is approximately
predicted \n(avlosr) = 120.56 - .06year
Because we regressed logarithms of lives lost on year, the model’s predicted values are also
measured in logarithmic units. Return these predicted values to their natural units (lives lost)
by inverse transformation, in this case exponentiating (e to power) yhat2:
. replace yhat2 = exp(yhat2)
(71 real changes r.ade;
Graphing these inverse-transformed predicted values reveals the curvilinear regression model,
which we obtained by linear regression with a transformed y variable (Figure"8.8). Contrast
Figures 8.7 and 8.8 with Figure 8.6 to see how transformation made the analvsis both simpler
and more realistic.
[S
I
Statistics with Stata
226
• graph twoway scatter avlost year
I I mspline yhat2 year, cipattern(solid) bands(50)
I I 1 ytitle("Average number of lives lost") xlabel(1920(10)1990)
xtitle
"■’‘(""
(""J legend(off) ylabel (0 (1) 7) yline(0)
Figure 8.8
(D
w
o
~~ io V)
(D
Q
-Q
E
=c -
I
0)
D)
(Q
OOJ -
<
o
1920
!
1930
1940
1950
1960
1970
1980
1990
The boxcox command employs maximum-likelihood methods to fit curvilinear models
involving Box-Cox transformations (introduced in Chapter 4). Fitting a model with Box-Cox
transformation of the dependent variable ( model (Ihs) specifies left-hand side) to the
tornado data, we obtain results quite similar to the model of Figures 8.7 and 8.8. The nolog
option in the following command does not affect the model, but suppresses display of log
likelihood after each iteration of the fitting process.
. boxcox avlost year, model(Ihs)
i
xodiuoer cz ohs
LR chi2(1)
Prob > chi2
Log likelihood = -7.7185533
|
avlost
/theta
ii
Coe f .
S-_d. Err.
z
P> I z |
-.0560959
:f46726
-0.87
0.386
Estimates of scale-variant parameters
Coef .
Notrans
I
year |
cons |
/sigma
•-
nolog
3^.
|
-.0661891
127.9713
.8301177
71
92.28
3.0 00
[95% Conf. Interval]
- .1828519
. 07066
?
Fitting Curves
Test
HO :
Restricted
log likelihood
theta = -1
theta = 0
theta = 1
-84.92S"rl
-8.09416“=
-101.50385
LR statistic
chi 2
154.42
0.75
187.57
227
P-Value
Prob > chi2
0.000
0.386
0.000
The boxcox output shows theta = -.056 as the optimal Box-Cox parameter for
transforming avlost, in order to linearize its relationship withyear. Therefore, the left-handside transformation is
alvlost( ~ .056
056 )} = (alvlosf056 - I)/-.056
Box-Cox transformation by a parameter close to zero, such as -.056, produces results similar
to the natural-logarithm transformation we applied earlier to this variable “by hand ” It is
therefore not surprising that the boxcox regression model
predicted alvlosf - 056 ’ = 127.97 - .07year
resembles the earlier model (predicted \n(avlost) = 120.56 - Myear) drawn in Figures 8.7 and
8.8. The boxcox procedure assumes normal, independent, and identically distributed errors
It does not select transformations with the aim of normalizing residuals, however.
boxcox can fit several types of models, including multiple regressions in which some or
all of the right-hand-side variables are transformed by a parameter different from they-variable
transformation. ItIt cannot apply different transformations to each separate right-hand-side
predictor. To do that, we return to a “by hand” cun ilinear-regression approach, as illustrated
in the next section.
Regression with Transformed Variables — 2
Fora multiple-regression example, we will use data on living conditions in 109 countries found
in dataset nations.dta (from World Bank 1987; World Resources Institute 1993).
i
'-ont-sxns data from C: \data\nations . dta
obs:
109
vars:
15
size:
4,033 (99.9% of memcry free)
variable name
country
pop
birth
death
chldmort
infmort
life
food
energy
gnpcap
gnpgro
urban
___
storage
type
str8
float
byte
byte
byte
int
byte
int
int
int
float
byte
di sp1ay
ft mat
*?s
*r.0g
? = . 0g
* 5 . 0g
*= . 0g
*= .0g
* 8 . 0g
* = . 0g
%=. 0g
%8.0g
%3.0g
% 8.0g
value
label
Data on 109 nations,
16 Jul 2005 14:57
ca .
1985
variable label
Country
1985 population in millions
Crude birth rate/1000 people
Crude death race/1000 people
Child (1-4 yr) mortality 1985
Infant (<1 yr) mortality 1985
Life expectancy at birth 1985
Per capita daily calories 1985
Per cap energy consumed, kg oil
Per capita GNP 1985
Annual GNP growth % 65-85
% population urban 1985
228
Statistics with Stata
school1
school/
schools
byte
byte
%8 . Cc
%8.Cg
%8.0g
Primary enrollment % age-group
Secondary enroll % age-group
Higher ed. enroll % age-group
Relationships among birth rate, per capita gross national product (GNP), and child mortality
aJ^n°n^eaT,t jS T"be 56611 ?lear'y 'n the scatterPlot matrix of Figure 8.9. The skewed gnpcap
and chldmort distributions also present potential leverage and influence problems.
f
T"
11 n O T*
O C*
O
Ta
O /A ZA •'X
1
*■! w • « —
4.1— —
— _ _ «a
1
•
••
—
• graph matrix gnpcap chldmort birth, half
Figure 8.9
Per
capita
GNP
1985
40 .
>
Child (1-4
yr)
mortality
1985
20 f
I
!
I
68
40 Ik * *
Crude
birth
rate/1000
people
20 .A!
’i
I
I!
I
I
f
0
0
10000
20000
20
40
fn.Perimen'inrW,it,h,laddeir"°f‘P?WerS transforrnations reveals that the log of gnpcap and
the square root of chldmort have distributions
--------- i more symmetrical, with fewer outliers or
potential leverage points, than the raw variables. More importantly, these transformations
largely eliminate the nonlinearities: cornjipare the raw-data scatterplots in Figure 8.9 with their
transformed-variables counterpans in Figure 8.10, on the following page,
17
Fitting Curves
229
. generate loggnp = loglO(gnpcap)
label variable loggnp "Log-10 of per cap GNP"
.
generate srmort = sqrt(chldmort)
.
graph matrix loggnp srmort birth, half
label variable srmort "Square root child mortality"
Figure 8.10
Log-10
of per
cap GNP
6 •
4
Square
root
child
mortality
• X' >..
.. ••/A.
2
w
68
■
40
Crude
birth
rate/1000
people
•
•M
/
20
i
o
2
3
4
0
4
2
6
We can now apply linear regression using the transformed variables:
regress birth loggnp srmort
Source |
SS
df
MS
Model
Residual
|
|
15837.9603
4238.18646
2
106
7918.98016
39.9828911
Total
|
20076.1468
108
185.890248
------------ +
Number of obs =
F( 2,
106) =
Prob > F
R-squared
=
Adj R-squared =
Root MSE
birth |
Coef.
Std. Err.
t
P> 111
loggnp |
srmort I
_cons I
-2.353738
5.577359
26.19488
1.686255
.533567
6.362687
-1.40
10.45
4 .12
0.166
0.000
0.000
[95% Conf.
-5.696903
4.51951
13.58024
109
198.06
0.0000
0.7889
0.7849
6.3232
Interval]
.9894259
6.635207
38.80953
Unlike the raw-data regression (not shown), this transformed-variables version finds that per
capita gross national product does not significantly affect birth rate once we control for child
mortality. The transformed-variables regression fits slightly better: R2& = .7849 instead of
.6715. (We can compare R 2a across models here only because both have the same
untransformed y variable.) Leverage plots would confirm that transformations have much
reduced the curvilinearity of the raw-data regression.
iSMr
i!
230
Statistics with Stata
Conditional Effect Plots
Conditional effect plots trace the predicted values ofy as a function of onex variable, with
other .v variables held constant at arbitrary values such as their means, medians, quartiles, or
extremes. Such plots help with interpreting results from transformed-variables regression.
Continuing with the previous example, we can calculate predicted birth rates as a function
°f loggnp* with srmort held at its mean (2.49):
generate yhatl = _b[_cons] + _b[loggnp]*loggnp + _b[srmort]*2.49
. label variable yhatl "birth = f(gnpcap | srmort = 2.49)
The _b[vY7/7z<7/ne] terms refer to the regression coefficient on varname from this session’s most
recent regression. _b[_cons] is they-intercept or constant.
Fora conditional effect plot, graphy/ztzr/ (after inverse transformation if needed, although
it is not needed here) against the untransformed x variable (Figure 8.11). Because conditional
effect plots do not show the scatter of data, it can be useful to add reference lines such as the
.v variable’s 10th and 90th percentiles, as shown in Figure 8.11.
. graph twoway line yhatl gnpcap, sort xlabel(,grid) xline(230 10890)
Figure 8.11
co
CM
II
■E
O
&
o
C CM
CTCO
II
€
z tco
3
0
5000
10000
Per capita GNP 1985
15000
20000
Similarly, Figure 8.12 depicts predicted birth rates as a function Qfsrmort, with loggnp held
at its mean (3.09):
. generate yhat2 = _b[_cons] + _b[loggnp}*3.09 + _b[snnort]★srmort
. label variable yhat2 "birth = f(chldmort | loggnp = 3.09)"
. graph twoway line yhat2 chldmort, sort xlabel(,grid) xline(0 27)
.
Fitting Curves
231
Figure 8.12
o
<o
Ss
II
Q.
cn
CD
o
—o
•C ’T
o
E
2
■s
ii o
r- CO
X3
8
I
o
10
20
30
Child (1-4 yr) mortality 1985
40
How can we compare the strength ofdifferentx variables’ effects? Standardized regression
coefficients (beta weights) are sometimes used for this purpose, but they imply a specialized
definition of strength” and can easily be misleading. A more substantively meaningful
comparison might come from looking at conditional effect plots drawn with identicaly scales.
This can be accomplished easily by using graph combine, and specifying common jp-axis
scales, as done in Figure 8.13. The vertical distances traveled by the predicted values curve.
particularly over the middle 80% of the x values (between 10th and 90th percentile lines),
provide a visual comparison of effect magnitude.
. graph combine fig08_ll.gph fig08_12.gph, ycommon cols(2) scale(1.25)
°
CD -I'
6?
Figure 8.13
o
co
O
cxi10
H
•E
o
II
Q.
CD
CD
O
E
^.o
—o
■E
o
E
2
gro
I
g
" o
E0
E
o
8
cm
0
5000 10000 15000 20000
Per capita GNP 1985
0
10
20
30
40
Child (1-4 yr) mortality 1985
k 1I
232
Statistics with Stata
Combining several conditional effects plots into one image with common vertical scales,
as done in Figure 8.13, allows quick visual comparison of the strength of different effects’
F igure 8.13 makes obvious how much stronger is the effect of child mortality on birth rates —
as separate plots (Figures 8.11 and 8.12) did not.
-
]
Nonlinear Regression — 1
r
Variable transformations allow fitting some curvilinear relationships using the familiar
techniques of intrinsically linear models. Intrinsically nonlinear models, on the other hand,
require a different class of fitting techniques. The> inl' command performs nonlinear
regression by iterative least squares. This section introduces it using a dataset of simple
examples, nonlin.dta:
Contains data from C:\data\nonlin.dta
obs:
100
vars :
size :
5
2, 100 (99.9% of memory free)
storage
type
display
format
y3
byte
float
float
float
%9.0g
%9.0g
%9.0g
%9.0g
y4
float
%9.0g
variable name
X
yi
y2
I
-
Sorted by:
value
label
Nonlinear model examples
(artificial data)
16 Jul 2005 14:57
variable label
Independent variable
yl = 10 * 1.03Ax + e
y2 = 10 * (1 - ,95Ax) + e
y3 = 5 + 25/(1+exp (-.1*(x-50)))
+ e
y4 = 5 +
25*exp (-exp(-.1*(x-50))) + e
x
The nonlin.dta data are imanufactured,
"
with y variables defined as various nonlinear
^.C,2°nS °f X’ P1“sir^ndo^Gaussian errors. yl, for example, represents the exponential
growth process yl =
~ 10 x 1.03 x.. ]Estimating these parameters from the data, nl obtains yl
= 11.20 x 1.03 x, which is reasonably close to the true model.
.
h
h
nl exp2 yl x
(obs = 100)
Iteration
Iteration
Iteration
Iteration
0:
1:
2:
3:
residual SS =
residual SS =
residual SS =
residual SS =
Source
SS
27625.96
26547.42
26138.3
26138.29
df
MS
Model |
Residual |
667018.255
26138.2933
2
98
333509.128
266.717278
Total
693156.549
100
6931.56549
------- +
|
Number of obs =
F( 2,
98) =
Prob > F
=
R-squared
=
Adj R-squared =
Root MSE
Res .' dev.
=
100
1250.42
0.0000
0.9623
0.9615
16.33148
840.3864
r
Fitting Curves
2-param. exp.
growth curve, yl=bl*b2''x
yi
bl
b2
233
f
i
Coef.
Std. Err.
t
P> 111
[95% Conf. Interval]
11.20416
1.028838
1.146682
.0012404
9 . 77
829.41
0.000
0.000
8.928602
1.026376
13.47971
1.C31299
(SE's, P values. Cl’s, and correlations are asymptotic approximations)
The predict command obtains predicted values and residuals for a nonlinear model
estimated by nl . Figure 8.14 graphs predicted values from the previous example, showing
the close fit (R2 = .96) between model and data.
predict yhatl
.
(option yhat assumed; fitted values)
graph twoway scatter yl X
I|
line yhatl x, sort
.
I I
,
legend(off) ytitle("yl = 10
1.03Ax + e")
xtitle("x")
Figure 8.14
o
o
CXI
o
IO
0)
co
2§
o
ii
io
o
0
20
40
x
60
80
100
I
The exp2 part of our nl exp2 yl x command specified a particular exponential
growth function by calling a brief program named nlexp2.ado. Stata includes several such
programs, defining the following functions:
exp3
exp2
3- parameter exponential: y =
+ b , b2 r
2- parameter exponential: y = b, b2 x
exp2a 2-parameter negative exponential: y = b^\ ~ b2 x)
I
log4
log3
4- parameter logistic; b0 starting level and (b0 + b,) asymptotic upper limit:
y = ^o + Z>i/(l +exp(-Z?2(x -Z?3)))
3- parameter logistic; 0 starting level and b , asymptotic upper limit:
v = Z?, /(I +exp(-6,(x -b^))
2
p•
234
Statistics with Stata
4-parameter Gompertz; bQ starting level and (Z>0+ b,) asymptotic upper limit:
y = b0 +b} exp(-exp(-/>2 (x -b3)))
gom3
3-parameter Gompertz; 0 starting level and b, asymptotic upper limit:
y = bx exp(-exp(-Z>2 (x -b.)))
nonlin.dta contains examples corresponding to exp2 (y’l), exp2a (r2), log4
and
gom4 (y4) functions. Figure 8.15 shows curves fit by nl to y2, y3, and y4.
gom4
8 i
in
Figure 8.15
co
ID
CM
O
o
11
<o™
>^in
CM
>»
m
o
0
20
40
0
20
40
x
60
80
10C
60
80
100
0
20
40
x
60
80
100
o
co
O
o
o
J
'rt 3 i
X
Users can write further nlfunction programs of their own. Here is the code for the
nlexp2 . ado program defining a 2-parameter exponential growth model:
*! version 1.1.3 12junl998
program define nlexp2
version 6
if ••' i • "=="?•• {
global S_2 "2-param. exp. growth curve, $S_E_depv=bl*b2A'2
global S_1 "bl b2"
/*
*/
Approximate initial values by regression of log Y on X.
local exp "('e(wtype)’ 'e(wexp)’]"
tempvar Y
quietly {
gen ' Y ’ = log ('e (depvar) •) if e (sample)
reg ' Y’ '2' 'exp' if e(sample)
}
global bl = exp(_b[_cons])
global b2 = exp(_b['2’])
exit
)
replace '1’ = $bl* ($b2)A'21
end
7
Fitting Curves
235
This program finds some iapproximate initial values of the parameters to be estimated,
storing these as “global macros” named bl
b2 .. IIt then
*
‘
-1 and
—2 L2
calculates
an initial set of
predicted x alues. as a “local macro” named 1 , employing the initial parameter estirateTand
the model equation:
replace
'1 '
=
$bl ’*
(Sb2)A '2 '
Subsequent iterations of nl will return to this line, calculating new predicted values
(replacing the contents of macro 1 ) as they refine the parameter estimates bl and b2 . In
Stata programs, the notation $bl means “the contents of global macro bl.” Similarly,the
notation ' 1' means “the contents of local macro 1
Before attempting to write your own nonlinear function, examine nllog4.ado
nlgom4 .ado , and others as examples, and consult the manual or help nl for
explanations. Chapter 14 contains further discussion of macros and other aspects of Stata
programming.
Nonlinear Regression — 2
Our second example involves real data, and illustrates some steps that can help in research.
Dataset lichen.dta concerns measurements of lichen growth observed on the Norwegian arctic
island of Svalbard (from Werner 1990). These slow-growing symbionts are often used to date
rock monuments and other deposits,, so their growth rates interest scientists in several fields.
Contains data from C:\data\lichen.dta
obs:
11
vars:
8
s^ze:
variable nare
locale
point
date
age
rshort
I
pshort
plong
572
storage
type
strl
in t
float
float
Lichen growth (Werner 1990)
14 Jul 2005 14:57
(99.9* of memoryfree)
display
format
*31s
*9s
%8.0o
VS.Og
*9. Qz
^9. Cg
%8.0g
%8.0g
value
label
variable label
Locality and feature
Control point
Date
Age in years
P.hizocarpon short axis; mm
Rhizocarpon long axis :mm
P.minuscula short axis: mm
P.minuscula long axis imm
Sorted by:
Lichens characteristically exhibit a period ofrelati vely fast early growth, gradually slowing,
as suggested by the lowess-smoothed curve in Figure 8.16.
8 fill
11
236
Statistics with Stata
Figure 8.16
40
E 30
E
.w
TO
O)
-2 20
s
Q-
3
.§
S 10
0
0
Ht
J
100
200
Age in years
300
400
Lichenometncians seek to summarize and compare such patterns by drawing growth curves.
Their growth curves might not employ an explicit mathematical model, but we can fit one here
to illustrate the process of nonlinear regression. Gompertz curves are asymmetrical S-curves
which have been widely used to model biological growth:
y = b, exp(- exp(- b 2 (.v - b 3)))
I'
I?
f
f I
They might provide a reasonable model for lichen growth.
If we intend to graph a nonlinear model, the data should contain a good ranee of closelv
spacedx values. Actual ages ofthe 11 lichen samples in lichen.dta range from 28 to 346 years.
We can create 89 additional artificial observations, with “ages” from 0 to 352 in 4-vear
increments, by the following commands:
. range newage 0 396 100
obs was 11, now 100
. replace age = newage[_n-l1 ]
(89 real changes made)
I
1’.'
.
The first command created a new variable, newage, with 100 values ranging from 0 to 396 in
4-year increments. In so doing, we also created 89 new artificial observations, with missing
values on all variables except newage. The replace command substitutes the missing
artificial-case age values with newage values, starting at 0. The first 15 observations in ouV
data now look like this:
list rlong age newage in 1/15
I ■
s ? '■
3
if age >=
1.
2.
I
I
I
I
3.
I
4.
I
rlong
age
newage I
------------- I
1
5
12
14
28
56
79
80
0 I
4 I
8 I
12
|
Fitting Curves
5.
I
I
I
6.
8.
9.
10.
I
I
I
I
I
I
I
ii.
12 .
13 .
14 .
15 .
13
80
16
8
80
89
89
346
346
20
10
34
34
25.5
237
I
28
32
. 36
I
I
I
I
40 I
44 I
48 I
52 I
56 I
131
0
4
8
12
summarize rlong age newage
Variable
Obs
Mean
Std. Dev.
Min
Max
r .one
age
newage
11
100
100
14.86364
170.68
198
11.31391
104.7042
116.046
1
0
0
34
352
396
Wenow could drop newage. Only the original 11 observations have nonmissing rlong
values, so only they will enter into model estimation. Stata calculates predicted values for any
observation with nonmissing _v values, however. We can therefore obtain such predictions for
both the 11 real observations and the 89 artificial ones, which will allow us to graph the
regression curve accurately.
Lichen growth starts with a size close to zero, so we chose the gom3 Gompertz function
rather than gom4 (which incorporates a nonzero takeoff level, the parameter b0). Figure 8.16
suggests an asymptotic upper limit somewhere near 34, suggesting that 34 should be a good
guess or starting value of the parameter b,. Estimation of this model is accomplished by
init(Bl=34)
nl gom3 rlong age,
nolog
(obs = 11)
Source
SS
rlong
Coef.
Std. Err.
t
P>l t|
[95% Conf.
Interval]
34.36637
.0217685
88.79701
2.267186
.0060806
5.632545
15.16
3.58
15.76
0.000
0.007
0.000
29.13823
. 0077465
75.80834
39.59451
.035"?04
101."657
df
MS
Number of obs =
F( 3,
8) =
Mede
3633.16112
3
1211.05371
Prob > F
F.esrdua
77.0888815
8
9.63611018
R-squared
Adj R-squared =
Total
3710.25
11
337.295455
Root MSE
Res. dev.
=
3-parameter Gompertz function, rlong=bl*exp(-exp(-b2*(age-b3)))
bl
b2
b3
(SE's.
i
|
|
P values.
CI ’ s.
11
125.68
0.0000
0.9792
0.9714
3.104208
52.63435
and correlations are asymptotic approximations)
A nolog option suppresses displaying a log of iterations with the output. All three parameter
estimates differ significantly from 1.
I
SI
a .
238
Statistics with Stata
I i
I
H
We obtain predicted values using predict, and graph these to see the regression curve,
he yline option is used to display the lower and estimated upper limits (0 and 34.366) of
this curve in Figure 8.17.
. predict yhat
(option yhat assumed; fitted values)
. graph twoway scatter rlong age
II mspline yhat age, cipattern(solid) bands(50)
II , legend(off) yline(0 34.366)
ytitle("Rhizocarpon long axis. inm") xlabel (0 (100) 400, grid)
o
Figure 8.17
Eo
Eo w
s
O)
OO _
c"
o
Q.
3O
N
lco _
tr*-
o
0
100
200
Age in years
300
400
Especially when working with sparse data or a relatively complex model, nonlinear
regression programs can be quite sensitive to their initial parameter estimates. The init
option with nl permits researchers to suggest their own initial values if the default values
supplied by an ^function program do not seem to work. Previous experience with similar data,
or publications by other researchers, could help supply suitable initial values. Alternatively,
we could estimate through trial and error by employing generate to calculate predicted
values based on arbitrarily-chosen sets of parameter values and graph to compare the
resulting predictions with the data.
7
7
I
--------- '
'•^5^
' '
-
'
.
1
zi: >
-
■ V-
•
Robust Regression
Stata’s basic regress and anova commands perform ordinary least squares (OLS)
regression. The popularity ofOLS derives in part from its theoretical advantages given “ideal”
data. If errors are normally, independently, and identically distributed (normal i.i.d.), then OLS
is more efficient than any other unbiased estimator. The flip side of this statement often gets
overlooked: if errors are not normal, or not i.i.d., then other unbiased estimators might
outperform OLS. In fact, the efficiency of OLS degrades quickly in the face of heavy-tailed
(outlier-prone) error distributions. Yet such distributions are common in many fields.
OLS tends to track outliers, fitting them at the expense of the rest of the sample. Over the
long run, this leads to greater sample-to-sample variation or inefficiency when samples often
contain outliers. Robust regression methods aim to achieve almost the efficiency of OLS with
ideal data and substantially better-than-OLS efficiency in non-ideal (for example, nonnormal
errors) situations. “Robust regression” encompasses a variety ofdifferent techniques, each with
advantages and drawbacks for dealing with problematic data. This chapter introduces two
v arieties ofrobust regression, rreg and qreg, and briefly compares their results with those
of OLS ( regress ).
rreg and qreg resist the pull ofoutliers, giving them better-than-OLS efficiency in the
face of nonnormal, heavy-tailed error distributions. They share the OLS assumption that errors
are independent and identically distributed, however. As a result, their standard errors, tests,
and confidence intervals are not trustworthy in the presence of heteroskedasticity or correlated
errors. To relax the assumption of independent, identically distributed errors when using
regress or certain other modeling commands (although not rreg or qreg ), Stata offers
options that estimate robust standard errors.
For clarity, this chapter focuses mostly on two-variable examples, but robust multiple
regression or 7V-way ANOVA are straightforward using the same commands. Chapter 14
returns to the topic of robustness, showing how we can use Monte Carlo experiments to
evaluate competing statistical techniques.
Several of the techniques described in this chapter are available through menu selections:
Statistics - Nonparametric analysis - Quantile regression
Statistics - Linear regression and related - Linear regression - Robust SE
23£
1K
I
240
Statistics with Stata
Example Commands
. rreg y xl x2 x3
Performs robust regression of y on three predictors, using iteratively reweighted least
squares with Huber and biweight functions tuned for 95% Gaussian efficiency. Given
appropriately configured data, rreg can also obtain robust means, confidence intervals,
difference of means tests, and ANOVA or ANCOVA.
i.
p
.
rreg y xl x2 x3, nolog tune(6) genwt(rweight)
iterate(10)
Performs robust regression of v on three predictors. The options shown above tell Stata not
to print the iteration log, to use a tuning constant of 6 (which downweights outliers more
steeply than the default 7), to generate a new variable (arbitrarily named rweight) holding
the final-iteration robust weights for each observation, and to limit the maximum number
of iterations to 10.
. qreg y xl x2 x3
Performs quantile regression, also known as least absolute value (LAV) or minimum Llnorm regression, ofy on three predictors. By default, qreg models the conditional .5
quantile (approximate median) ofy as a linear function of the predictor variables, and thus
provides “median regression.”
jil
. qreg y xl x2 x3, quantile(.25)
Performs quantile regression modeling the conditional .25 quantile (first quartile) of y as
a linear function ofxl, x2, and.vd.
. bsqreg y xl x2 x3, rep(100)
Performs quantile regression, with standard errors estimated by bootstrap data resampling
with 100 repetitions (default is rep (20)).
I
. predict e, resid
Calculates residual values (arbitrarily named e) after any regress, rreg, qreg, or
bsqreg command. Similarly, predict yhat calculates the predicted values of y.
Other predict options apply, with some restrictions.
regress y xl x2 x3, robust
Performs OLS regression of v on three predictors. Coefficient variances, and hence
standard errors, are estimated by a robust method (Huber/White or sandwich) that does not
assume identically distributed errors. With the cluster () option, one source of
correlation among the errors can be accommodated as well. The User's Guide describes
the reasoning behind these methods.
Regression with Ideal Data
To clarify the issue of robustness, we will explore the small (n
robust l.dta\
Contains data from C:\data\robustl.dta
obs :
20
vars :
size:
10
880 (99.9% of memory free)
20) contrived dataset
Robust regression examples 1
(artificial data)
17 Jul 2005 09:35
-
Robust Regression
variable name
storage
type
x
el
yi
e2
y2
x3
e3
y3
e4
y4
float
float
float
float
float
float
float
float
float
float
display
format
value
label
241
variable label
%9.0g
%9.0g
%9.0g
%9.0g
%9.0g
%9.0g
%9.0g
%9.0g
%9.0g
%9.0g
Normal X
Normal errors
yl = 10 + 2*x + el
Normal errors with 1 outlier
y2 = 10 + 2*x + e2
Normal X with 1 leverage obs .
Normal errors with 1 extreme
y3 = 10 + 2*x3 + e3
Skewed errors
y4 = 10 + 2*x + e4
Sorted by:
The variables x and el each contain 20 random values from independent standard normal
distributions, yl contains 20 values produced by the regression model:
yi 10 + 2x + el
The commands that manufactured these first three variables are
clear
set obs 20
.
generate x = invnorm(uniform() )
.
generate el = invnorm(uniform())
.
generate yl = 10 + 2*x + el
With real data, coding mistakes and measurement errors sometimes create wildly incorrect
values. To simulate this, we might shift the second observation’s error from-0.89 to 19.89:
. generate e2 = el
. replace e2 = 19.89 in 2
.
generate y2 = 10 + 2*x + e2
Similar manipulations produce the other variables in robustl.dta.
yl and x present an ideal regression problem: the expected value of yl really is a linear
function ofx, and errors come from normal, independent, and identical distributions—because
we defined them that way. OLS does a good job of estimating the true intercept (10) and slope
(2), obtaining the line shown in Figure 9.1.
.
I
I
.
regress yl x
Source |
ss
Model |
Residual |
134.059351
22.29157
1
18
134.059351
1.23842055
Total
|
156.350921
19
8.22899586
yi
I
Coef.
Std. Err.
t
P>| t|
[95% Conf. Interval]
x I
cons |
2.048057
9.963161
.1968465
.2499861
10.40
39.85
0.000
-0.000
1.634498
9.43796
predict yhatlo
df
MS
Number of obs =
F( 1,
18) =
Prob > F
R-squared
Adj R-squared =
Root MSE
20
1C3.25
0.3000
0.8574
0.3495
1.1128
2.461616
10.48836
I
II
242
Statistics with Stata
• graph twoway scatter yl x
I I
line yhatlo x, cipattern(solid) sort
I I
, ytitleC'yl = 10 + 2*x + el") legend (order (2)
label(2 "OLS line") position(ll)
ring(0) cols(l))
Figure 9.1
OLS line |
04
<D
cxi o
O
ii
co
I
<0
-2
li
-1
1
2
-^.obtains robust regression
estimanteserTheefirsfWei8htedfeaStS^Ukre^
have Cook’s D value^ZatiX0.
oTs18
°bSerVati0n USing a Huber
t
. rreg yl
which doXelhts
x
Huber iteration 1:
Huber iteration 2:
Biweight iteration 3:
Biweight iteration 4 :
Biweight iteration 5:
I
0
Normal X
maximum difference in iweights = .35774407
maximum difference in weights
== .02181578
.
maximum difference in weights = .14421371
maximum difference in weights = .01320276
maximum difference in weights = .00265408
Robust regression estimates
Number of obs =
F(
lz
18) =
Prob > F
20
79.96
0.0000
yl
I
Coe f .
Std. Err.
t
P>|t I
[95% Conf
Interval]
x
cons
I
|
2.047813
9.936163
. 2290049
.2908259
8 . 94
34.17
0.000
0.000
1.566692
9.325161
2.528935
10.54717
Robust Regression
243
’ 5.'
This “ideal data” example includes no serious outliers, so here rreg is unneeded. The
rreg intercept and slope estimates resemble those obtained by regress (and are not far
from the true values 10 and 2), but they have slightly larger estimated standard errors. Given
normal i.i.d. errors, as in this example, rreg theoretically possesses about 95% of the
efficiency of OLS.
-
rreg and regress both belong to the family of M-estimators (for maximum
likelihood). An alternative order-statistic strategy called L-estimation fits quantiles ofv, rather
than its expectation or mean. For example, we could model how the median (.5 quantile) of v
changes with x. qreg , an Ll-type estimator, accomplishes such quantile regression and
provides another method with good resistance to outliers:
. qreg yl x
Iteration
1:
WLS sum of weighted deviations =
17.711531
Iteration
Iteration
1 : sum of abs. weighted deviations =
2 : sum of abs. weighted deviations =
17.130001
16.858602
Median regression
Raw sum of deviations
Min sum of deviations
Number of obs =
46.84
16.8586
20
(about 10.4)
Pseudo R2
0.6401
I
Coef.
Std. Err.
t
P>l t |
[95% Conf.
Interval]
x I
cons |
2.139896
9.65342
.2590447
. 3564108
8.26
27.09
0.000
0.000
1.595664
8.904628
2.684129
10.40221
yi
Although qreg obtains reasonable parameter estimates, its standard errors here exceed those
of regress (OLS) and rreg. Given ideal data, qreg is the least efficient of these three
estimators. The following sections view their performance with less ideal data.
Y Outliers
The variable^ is identical toj^f, but with one outlier caused by the “wild” error of observation
#2. OLS has little resistance to outliers, so this shift in observation #2 (at upper left in Figure
9.2) substantially changes the regress results:
.
regress y2 x
Source
I
SS
df
MS
Number of obs =
Ff
Model
Residual
|
|
18.764271
348.233471
1
18
18.764271
19.3463039
Total
|
366.997742
19
19.3156706
y2
I
Coef.
Std. Err.
t
P>l t|
x I
cons |
.7662304
11 .1579
. 7780232
. 9880542
0.98
11.29
0 ..338
0.000
---- +
1,
18)
=
20
0.97
Prob > F
= 0.3378
R-squared
= 0.0511
Adj R-squared = -0.0016
Root MSE
= 4.3984
[95% Conf.
-.8683356
9.082078
Interval]
2.400796
13.23373
.
■
244
|
Statistics with Stata
. predict yhat2o
(option xb assumed; fitted values)
label variable yhat2o "OLS line (regress) *'
.
tThA ^erDr2ai?eSj116
’ntercePt (frorn9-93610 11 • 1579) and lessens the slope (from 2.048
r° i-a i - R ^aS dropped from ■85’7410.0511. Standard errors quadrupled, and the OLS slope
(solid line m Figure 9.2) no longer significantly differs from zero.
The outlier has little impact on rreg, however, as shown by the dashed line in Figure 9.2.
e ro ust coefficients barely change, and remain close to the true parameters 10 and 2- nor do
the robust standard errors increase much.
.
rreg y2 x, nolog genwt(rweight2)
Robust regression estimates
Number of obs =
F( 1,
17) =
Prob > F
=
19
63.01
0.0000
i
Coef.
Std. Err.
t
P>|t |
(95% Conf.
Interval]
x I
cons |
1.979015
10.00897
.2493146
.3071265
7.94
32.59
0.000
0.000
1.453007
9.360986
2.505023
13.65695
y2
--------- +_
. predict yhat2r
(option xb assumed; fitted values)
label variable yhat2r "robust regression (rreg)”
.
• graph twoway scatter y2 x
I I line yhat2o x, cipattern(solid) sort
I I line yhat2r x, cipattern(longdash) sort
I I , ytitle(”y2 = 10 + 2*x + e2”)
legend(order(2 3) position(l) ringtO) cols(l) margin(sides))
Figure 9.2
OLS regression (regress)
robust regression (rreg)
CXi
o
CM CM
<D
CM
+m
o *“
ii
o
-2
-•a
-1
0
Normal X
T
2
Robust Regression
245
The nolog option above caused Stata not to print the iteration log.
genwt {rweight2) option saved robust weights as a variable named nveight2.
The
W'
.
predict resid2r,
.
list y2 x resid2r rweight2
11 .
12 .
13 .
14 .
15 .
I
I
I
I
I
I
I
I
I
I
I
I
I
I
I
I
I
I
I
16.
17 .
18.
19 .
20 .
I
I
I
I
I
1.
2.
3.
4.
5.
6.
7.
8.
9.
10 .
resid
y2
x
res id!r
rweight2 I
--------- I
5.37
26.19
5.93
8.58
6.16
-1 . 97
-1 85
-1 "4
-1 36
-1 . 07
-.7403C-!
19.84221
- . 6 3 54 5 11
1.2624 94
-1.731421
94644465 |
. I
73 |
84 1
.’25"631 |
---------- I
9.80
8.12
10.40
9.35
11.16
-0 .69
-0 55
-0 4 9
-C 42
0.33
1.156554
-.8005C = 5
1.360’5
.17222
.4979552
.5-2-3631
.9375=391
.=2616386
9 9'712 388
9“5=1674
11 . 40
13.26
10.88
9.58
12.41
0 . 44
0.69
0 . "8
0 . n9
1.26
.5202664
1.885513
-.67259=2
-1.9923=9
-.092525"
.9736:863
.6=04=366
.955-2=33
.64644918
.99913568
---------- I
14 . 14
12.66
12.74
12.70
14.19
1.27
1.47
1.61
1.31
2.12
1.6176=5
-.25811=9
- .4551811
-.8909839
-.01447=“
.-588-073
.9933=589
.9"95“817
.9230-041
.9999-651
I ■
I
!
I
I
I
I
I
|
j
I
I
i
i
j
l
I
Residuals near zero produce weights near one; farther-out residuals get progressively lower
weights. Observation #2 has been automatically set aside as too influential because of Cook’s
D > 1 • rreg assigns its n\ eight2 as “missing." so this observation has no effect on the final
estimates. The same final estimates, although not the correct standard errors or tests, could be
obtained using regress with analytical weights (results not shown):
. regress y2 x [aweight = rweight2]
Applied to the regression of y2 on x, qreg also resists the outlier’s influence and
performs better than regress, but not as well as rreg. qreg appears less efficient than
rreg , and in this sample its coefficient estimates are slightly farther from the true values of
10 and 2.
qreg y2 x,
nolog
Median regression
Raw sum of deviaziors
56.65
Min sum of deviations 36.20036
y2 I
----- +
x I
cons I
Number of obs =
20
(about 10.88)
Pseudo R2
0.3613
Coe f .
Stc. Err .
t
P> I 11
[95% Conf.
Interval]
1.821428
10.115
.41:5944
.50=8526
4 . 44
19.88
'0.000
0.000
.9588014
9.045941
2.684055
11.18406
246
Statistics with Stata
Monte Carlo researchers have also noticed that the standard errors calculated by qreg
sometimes underestimate the true sample-to-sample variation, particularly with smaller
samples. As an alternative, Stata provides the command bsqreg. which performs the same
median or quantile regression as qreg , but employs bootstrapping (data resampling) to
estimate the standard errors. The option rep ( ) controls the number of repetitions? Its
default is rep (20), which is enough for exploratory work. Before reaching “final”
conclusions, we might take the time to draw 200 or more bootstrap samples. Both qreg and
bsqreg fit identical models. In the example below, bsqreg also obtains similar standard
errors. Chapter 14 returns to the topic of bootstrapping.
.
bsqreg y2 x,
rep(50)
(fitting base model,
(bootstrapping
I
)
i
Median regression, bootstrap(50) SEs
Raw sum of deviations
56.68 (about 10.88)
Min sum of deviations 36.20036
I
Number of obs =
20
Pseudo R2
0.3613
I
Coef.
Std. Err.
t
P>| t
[95* Conf.
Interval]
x I
cons |
1.621428
10.115
.4084728
.4774718
4 . 46
21.18
0.000
0.000
. 9632587
9.111869
2.679598
11.11813
y2
X Outliers (Leverage)
rreg, qreg.and bsqreg deal comfortably with ^-outliers, unless the observations with
unusual y values have unusual x values (leverage) too. The yd and x3 variables in robust.dta
present an extreme example of leverage. Apart from the leverage observation (#2) these
variables equaly/ and*.
4
I'
|(
The high leverage of observation #2, combined with its exceptional v3 value, make it
influential: regress and qreg both track this outlier, reporting that the “best-fittins” line
has a negative slope (Figure 9.3).
.
regress y3 x3
ss
Source |
df
MS
Number of obs =
F( 1,
18) =
Prcb > F
R-squared
Adj R-squared =
Root MSE
Model
Residual
|
|
139.306724
227.691018
1
18
139.306724
12.649501
Total
|
366.997742
19
19.3156706
73
I
Coef.
Std. Err.
t
P> I t I
x3 |
cons |
-.6212248
10.80931
.1871973
.8063436
-3.32
13.41
0.004
0.000
------------ +
Rl
.
label variable yhat3o "OLS regression
3.5566
[95% Conf. Interval]
-1.014512
9.115244
. predict yhat3o
I
20
11.01
0.0038
0.3796
0.3451
(regress)”
- . 227938
12.50337
Robust Regression
.
247
qreg y3 x3, nolog
Median regression
Raw sum of deviations
56.68 (about 10.88)
Min sum of deviations 56.19466
¥3 I
Coef.
Std. Err.
t
x3 |
cons I
-.6222217
11.36533
. 347103
1 . 419214
-1.79
8.01
Number of obs =
20
Pseudo R2
(95% Conf.
0.090
0.000
0.0086
Interval]
-1.351458
8.383676
. 1070146
14.34699
. predict yhat3q
label variable yhat3q "median regression
I
(qreg)"
. rreg y3 x3, nolog
Robust regression estimates
Number of obs =
F( 1,
17) =
Prob > F
19
63.01
0.0000
y3 i
Coef.
Std. Err.
t
P>! ti
[95% Conf. Interval]
x3 |
cons |
1.979015
10.00897
.2493146
.3071265
7.94
32.59
0.000
0.000
1.453007
9.360986
2.505023
10.65695
. predict yhat3r
label variable yhat3r "robust regression (rreg)"
.
. graph twoway scatter y3 x3
I I line yhat3o x3, cipattern(solid) sort
I I line yhat3r x3, cipattern(longdash) sort
I I line yhat3q x3, cipattern(shortdash) sort ,
ytitle(My3 = 10 + 2*x + e3") legend(order(4 3 2) position(5)
ring(0) cols(l) margin(sides)) ylabel (-30(10)30)
Figure 9.3
° J
CO
o
CM
co o
<D v- -
04
+° "
O
ll
O
04 ~
median regression (qreg)
robust regression (rreg)
OLS regression (regress)
9“
-20
-15
-10
-5
Normal X with 1 leverage obs.
0
■
248
Statistics with Stata
igure 9.3 illustrates that regress and qreg are not robust against lexerage (.voutliers). The rreg program, however, not only downweights large-residual observations
(which by itself gives little protection against leverage), but also automatically sets aside
observations with Cook’s D (influence) statistics greater than 1. This happened when we
regressed y3 on aJ; rreg ignored the one influential observation and produced a more
reasonable regression line with a positive slope, based on the remaining 19 observations.
Setting aside high-influence observations, as done by rreg , provides a simple but not
toolproofway to deal with leverage. More comprehensive methods, termed bounded-influence
regression, also exist and could be implemented in a Stata program.
The examples in Figures 9.2 and 9.3 involve single outliers, but robust procedures can
handle more. Too many severe outliers, or a cluster of similar outliers, might cause them to
break down. But in such situations, which are often noticeable in diagnostic plots, the analvst
must question whether fitting a linear model makes sense. It might be worthwhile to seek an
explicit model for what is causing die outliers to be different.
Monte Carlo experiments (illustrated in Chapter 14) confirm that estimators like rr:
rreg
and qreg generally remain unbiased, with better-than-OLS efficiency, when applied
I to
heavy-tailed (outlier-prone) but symmetrical error distributions. The next section illustrates
what can happen when errors have asymmetrical distributions.
i 1
1
I
i
Asymmetrical Error Distributions
■-
r
The variable e4 in robustl.dta has a skewed and outlier-filled distribution: e4 equals el (a
standard normal variable) raised to the fourth power, and then adjusted to have 0 mean. These
skewed errors, plus the linear relationship with x, define the variable v4 = 10 + 2r + e4.
Regardless of an error distribution's shape, OLS remains an unbiased estimator. Over the lon<>
run, its estimates should center on the true parameter values.
.
regress y4 x
Source |
ss
of
MS
Model |
Residual I
155.870363
402.341 909
It
22 ** *
Total |
558.212291
19
29.3795943
y4
I
x I
cons |
2.208388
9.975681
• Z Z
i —
c •
Number of obs =
Ff 1,
18) =
Prob > F
=
R-squared
=
Adj R-squared =
Root MSE
38 3
20
6.97
0.0166
0.2792
0.2392
4.7278
Std. Err
t
p> 111
[95% Conf.
Interval]
. 8362 = 62
1.062046
2.64
9.39
0.017
0.000
.4514157
7.744406
3.96536
12.20696
The same is not true for most robust estimators. Unless errors are symmetrical, the median
me fit by qreg, or the biweight line fit by rreg, does not theoretically coincide with the
expected-j, line estimated by regress . So long as the errors’ skew reflects only a small
fraction of their distribution, rreg might exhibit little bias. But when the entire distribution
is skewed, as with e4, rreg will downweight mostly one side, resulting in noticeably biased
^-intercept estimates.
Robust Regression
rreg y4 x,
249
nolog
Robust regression
Number of obs =
20
F( 1,
18) = 1319.29
Prob > F
= 0.0000
a = 273
7'69
X
cons
Std. Err
t
P> 111
[95% Conf.
Interval]
.0537435
.0692515
36.32
109.55
0.000
0.000
1.839163
7.333278
2.064984
7.620061
Although the rreg y-intercept in Figure 9.4 is too low, the slope remains parallel to the
OLS line and the true model. In fact, being less affected by outliers, the rreg slope (1.95)
is closer to the true slope (2) and has a much smaller standard error than that of regress .
This illustrates the tradeoff of using rreg or similar estimators with skewed errors: we risk
getting biased estimates of the v-intercept. but can still expect unbiased and relatively precise
estimates of other regression coefficients. In many applications, such coefficients are
substantively more interesting than they-intercept, making the tradeoffworthwhile. Moreover,
the robust t and F tests, unlike those of OLS, do not assume normal errors.
ID J
CM ”
Figure 9.4
true model
OLS regression (regress)
robust regression (rreg)
O
04 "
co
<D
,
^tD
-
o
I
-2
-1
0
Normal X
1
2
Robust Analysis of Variance
I
rreg can also perform robust analysis of variance or covariance once the model is recast in
regression form. For illustration, consider the data on college faculty salaries infaculty.dta.
Contains data from C: data\faculty.dta
obs:
226
J
vars:
6
size:
2,938
College faculty salaries
17 Jul 2005 09:32
(99.9% of memoryfree)
250
Statistics with Stata
1
variable name
Wi
rank
gender
female
assoc
full
pay
storage
type
byte
byte
byte
byte
byte
float
display
format
value
label
%8.0g
*8.0g
*8 . Cg
%8.0g
%8.0g
%9. Og
rank
sex
variable label
Academic rank
Gender (dummy variable)
Gender (effect coded)
Assoc Professor (effect coded)
Full Professor (effect coded)
Annual salary
Sorted by:
Faculty salaries increase with rank. In this sample, men have higher average salaries:
.
table gender rank,
|
|
I
Gender
(dummy
variable)
Male
Female
contents(mean pay)
Academic rank
Assist
Assoc
I
29280
I 28711.04
38622.22
38019.35
52084.9
47190
An ordinary (OLS) analysis of variance indicates that both rank and gender significantly
affect salary. Their interaction is not significant.
anova pay rank gender rank*gender
!i
Number of obs =
226
Root MSE
= 5108.21
■
Source |
------- +
Model I
I
rank |
gender I
rank*gender I
Partial SS
df
1.5560e + 10
5
7.6124e+09
127361829
87997720.1
Residual
Total
R-squared
=
Adj R-squared =
MS
0.7305
0.7244
F
Prob > F
3.1120e+09
119.26
0.0000
2
1
2
3.8062e+09
127361829
43998860.1
145.87
4.88
1.69
0.0000
0.0282
0.1876
5.7406et-09
220
26093824.5
2.1300e+10
225
94668810.3
But salary is not normally distributed, and the senior-rank averages reflect the influence of
a few highly paid outliers. Suppose we want to check these results by performing a robust
analysis of variance. TWe
” need effect-coded versions of the rank and gender variables, which
this dataset also contains.
.
tabulate gender female
Gender |
(dummy | Gender (effect coded)
variable) |
"I
1 I
Total
Male |
Female |
14 9
0
0 I
77 |
149
77
|
149
77 |
226
Total
/
Robust Regression
251
tabulate rank assoc
Academic I
rank |
Assoc Professor
-1
Assist |
Assoc |
Full |
64
0
0 '
Total |
64
(effect coded)
0
1
I
Total
0
0
57
0 I
105 |
0 I
64
105
57
57
105 |
226
tab rank full
Academic I
rank |
-------- +
Full Professor
-1
(effect coded)
0
1
I
Total
Assist |
Assoc |
Full |
64
0
0
0
105
0
0 I
0 I
57 |
64
105
57
Total |
64
105
57 |
226
^faculty.dta did not already have these effecKoded variables (female, assoc, and fall) we
could create them from gender and rank using a series of generate and replace
statements. We also need two interaction terms representing female associate professors and
.
generate femassoc = female*assoc
.
generate femfull = female* full
Males and assistant professors are “omitted categories” in this example. Now we can
duplicate the previous ANOVA using regression:
.
regress pay assoc full
i
I
ss
df
MS
5."406e-0?
22 0
3 . 1120e + 09
26093824.5
2.1300e-rl :
225
94668810 3
c ce _
-.al
assoc |
full I
female I
femassoc I
femfull
cons
.
i
=. =. k "a * '
( 2)
Std. Err.
t
P> 11 |
-663.8995
10652.92
-1011.174
709.5864
-1436.277
38984.53
543.84 99
783.9227
457.6938
543.8499
783.9227
457.6938
-1.22
13.59
-2.21
1.30
-1.83
85.18
0.223
0.000
0.028
0.193
0.068
0.000
assoc = 0.0
full = 0.0
F(
Number of obs
F(
5,
220)
Prob > F
R-squared
Adj R-squared
Root MSE
C oef.
test assoc full
( 1)
I
female femassoc femfull
2,
220) =
Prob > F =
145.87
0.0000
[95% Conf.
-1735.722
9107.957
-1913.199
-362.2359
-2981.236
38082.51
=
=
=
=
=
226
119.26
0.0000
0.7305
0.7244
5108.2
Interval]
407.9229
12197.88
-109.1483
1781.409
108.6819
39886.56
252
Statistics with Stata
I
II
II I
test female
( 1)
I
female =
F(
11 'i
o. :■
1,
222) =
Proc > F =
4.88
0.02=2
test femassoc femfull
( 1)
( 2)
femassoc = :. o
femfull = C . 0
2,
221) =
Prob > F =
F(
1.69
0.1876
regress followed by the appropriate test commands obtains exactly the same R 2
and F test results that we found earlier using anova . Predicted values from this regression
equal the mean salaries.
. predict predpayl
(oprion xb assumed; fizzed values
.
label variable predpayl "OLS predicted salary”
table gender rank, contents(mean predpayl)
i
Gender
(dummy
variable)
I
I
I
rar. •:
Assisz
Assoc
Full
Male I
292:3
Female I 2 8 711.;-:
2.22
9.05
52084.9
47190
Predicted values (means). R ~. and F tests would also be the same regardless of which
categories we chose to omit from the regression. Our “omitted categories," males and assistant
professors, are not really absent. Their information is implied by the included categories: if
a faculty member is not female, he must be male, and so forth.
To perform a robust analysis of variance, apply rreg to this model:
I
rreg pay assoc full female femassoc femfull,
Robust regression
Number of obs =
F( 5,
220) =
Prob > F
!
pay I
*
assoc
full
female
femassoc
femfull
_cons
I
|
I
|
|
|
nolog
Coef.
-315.6463
9"65.296
-749.4949
197.7833
-913.348
38331.87
Std. Z
458
38
660
48
385.5’78
458.1588
660.4048
385.5778
t
P> r|
-0.69
14.79
-1.94
0.43
-1.38
99.41
0.492
0.000
0.053
0.666
0.168
0.000
226
138.25
0.0000
[95% Conf. Interval]
-1218.588
8463.767
-1509.394
-705.1587
-2214.878
37571.97
587.2956
11066.83
10.40395
1100.725
388.1815
39091.77
T
Robust Regression
253
test assoc full
( 1)
( 2)
assoc = 0.0
full = 0.0
F(
2,
220) = 182.67
Prob > F = .
0.0000
test female
(
female = 0.0
F(
220) =
1,
Prob > F =
3.78
0.0532
test femassoc femfull
( i)
( 2)
femassoc = 0.0
femfull = 0.0
2,
220) =
Prob > F =
F(
1.16
1.3144
rreg downweights several outliers, mainly highly-paid male full professors. To see the
robust means, again use predicted values:
. predict predpay2
(option xb assumed; fitted values)
label variable predpay2 "Robust predicted salary"
.
I
i
table gender rank,
Gender
(dummy
variable)
j
|
|
contents(mean predpay2)
Academic rank
.Assist
Assoc
Male ■ 28916.15
Female i 28848.29
385 6
93
51
Full
49760.01
46434.32
I
The male-female salaty gap among assistant and full professors appears smaller if we use
XTsUZ’ e”"rely vanish’ h°wever’and ,1"8ender 8ap
I
I
I
J
ass“i*“
With effect coding and suitable interaction terms, regress
duplicate ANOVA
ANOVA
regress can
can duplicate
exactly, rreg can do parallel analyses, testing for differences among robust means instead
of ordinary means (as regress and anova do). Used in similar fashion, qreg opens
the third possibility of testing for differences among medians. For comparison, here is a
quantile regression version of the faculty pay analysis:
254
Statistics with Stata
■ <Ireg pay assoc full female femassoc femfull, nolog
Median regression
Raw sum of deviations
Min sum of deviations
I
pay |
assoc
full
female
femassoc
femfull
_cons
|
|
|
|
|
|
Number of obs =
1738010 (about 37360)
798870
Coef.
Std. Err.
-760
10335
-623.3333
-156.6667
-691.6667
38300
440.1693
615.7735
365.1262
440.1693
615.7735
365.1262
t
-1.73
16.78
-1.71
-0.36 .
-1.12
104.90
Pseudo R2
P> 111
0.086
0.000
0.089
0.722
0.263
0.000
226
0.5404
[95% Conf. Interval]
-1627.488
9121.43
-1342.926
-1024.155
-1905.236
37580.41
107.4881
11548.57
96.2594
710.8214
521.9031
39019.59
test assoc full
( 1)
( 2)
assoc = 0.0
full = 0.0
2,
220) =
Prob > F =
F(
208.94
0.0000
test female
( 1)
i
female = 0.0
F(
.
femassoc =0.0
femfull = 0.0
2,
220) =
Prob > F =
F(
i
j!
fi
. label variable predpay3 "Median predicted salary"
table gender rank, contents(mean predpay3)
Gender
(dummy
variable)
■
i
1.60
0.2039
. predict predpayS
(option xb assumed; fitted values)
.
i
2.91
0.0892
test femassoc femfull
( 1)
( 2)
i
i
1,
220) =
Prob > F =
I
Academic rank
I
I Assist
Assoc
Full
Male |
Female |
28500
28950
38320
36760
49950
47320
Predicted values from this quantile regression closely resemble the median salaries in each
subgroup, as we can verify directly:
Robust Regression
255
3
. table gender rank, contents(median pay)
Gender
(dummy
variable)
I
Academic rank
I
I Assist
Assoc
Full
Male |
Female |
28500
28950
38320
36590
49950
46530
greg thus allows us to fit models analogous to Af-way ANOVA or ANCOVA, but
involving .5 quantiles or approximate medians instead of the usual means. In theory, .5
quantiles and medians are the same. In practice, quantiles are approximated from actual sample
data values, whereas the median is calculated by averaging the two central values, ifa subgroup
contains an even number of observations. The sample median and .5 quantile approximations
then can be different, but in a way that does not much affect model interpretation.
Further rreg and greg AppIications
Diagnostic statistics and plots (Chapter 7) and nonlinear transformations (Chapter 8) extend the
usefulness of robust procedures as they do in ordinary regression. With transformed variables,
rreg or greg fit curvilinear regression models, rreg can also robustly perform simpler
types of analysis. To obtain a 90% confidence interval for the mean of a single variable,^, we
could type either the usual confidence-interval command ci :
.
ci y, level(90)
Or, we could get exactly the same mean and interval through a regression with no x variables:
.
regress y, level (90)
Similarly, we can obtain robust mean with 90% confidence interval by typing
.
rreg y,
level(90)
greg could be used in the same way, but keep in mind the previous section’s note about how
a .5 quantile found by greg might differ from a sample median. In any of these commands,
the level ( ) option specifies the desired degree of confidence. If we omitthis option, Stata
automatically displays a 95% confidence interval.
I
To compare two means, analysts typically employ a two-sample t test (ttes t) or one-way
analysis of variance (oneway or anova ). As seen earlier, we can perform equivalent tests
(yielding identical t and F statistics) with regression, for example, by regressing the
measurement variable on a dummy variable (here cal led grow/?) representing the two categories:
.
regress y group
A robust version of this test results from typing the following command:
.
rreg y group
greg performs median regression by default, but it is actually a more general tool. It can
fit linear models for any quantile of y, not just the median (.5 quantile). For example,
I
256
I''
I
Statistics with Stata
commands such as the following analyze how the first quartile (.25 quantile) of y changes with
x.
!
•
qreg y x,
quant(.25)
Assuming constant error variance, the slopes of the .25 and .75 quantile lines should be roughly
the same, <Ireg thus could perform a check for heteroskedasticity or subtle kinds of
nonlinearity.
Robust Estimates of Variance — 1
’I
i
Both rreg and qreg tend to perform better than OLS ( regress
r _
or anova ) in the
presence of outlier-prone, nonnormal errors. All of these procedures share the; common
assumption that errors follow independent and identical distributions, however. If
If the
the
distributions of errors vary across x values or observations, then the standard errors calculated
by anova , regress , rreg , or qreg probably will understate the true sample-tosample variation, and yield unrealistically narrow confidence intervals.
regress and some other model fitting commands (although not rreg or qreg) have
an option that estimates standard errors without relying on the strong and sometimes
implausible assumptions of independent, identically distributed errors. This option uses an
approach derived independently by Huber, White, and others that is sometimes referred to as
a sandwich estimator of variance. The artificial dataset (robust2.dtd) provides a first example.
Contains data from C: .data\robust2.dta
obs:
500
vars :
size:
variable name
i
It
k
12
24,500
storage
type
(99.9% of memory free)
display
format
x
e5
y5
float
float
float
%9.0g
%9. Og
%9.0g
e6
float
%9. Og
y6
float
%9. Og
e7
y7
float
float
%9. Og
%9.0g
e8
float
%9. Og
y8
float
%9. Og
group
e9
byte
float
%9. Og
%9. Og
y9
float
%9 . Og
Sorted by:
Robust regression examples 2
(artificial data)
17 Jul 2005 09:03
value
label
variable label
Standard normal X
Standard normal errors
y5 = 10 + 2*x + e5 (norma1
i.i.d. errors)
Contaminated normal errors:
95% N(0, 1) , 5% (N(0, 10)
y6 = 10 + 2xx + e6
(Contaminated normal errors)
Centered chi-square(1) errors
y7 = 10 + 2*x + e7 (skewed
errors)
Normal errors, variance
increases with x
y8 = 10 + 2*x + e8
(heteroskedasticity)
Normal errors, variance
increases with x, mean &
variance increase with cluster
y9 = 10 + 2*x + e9
(heteroskedasticity &
correlated errors)
J
Robust Regression
257
-
When we regress on x, we < obtain
*
a significant positive slope. A scatterplot shows strong
heteroskedasticity, however (Figure 9.5). Variation around
x. Because errors <*do not appear to be identically distributed at all values ofx, the standard
errors, confidence intervals, and tests printed by regress are untrustworthy. rreg or
qreg would face the same problem.
regress y8 x
.
Source |
SS
df
MS
Model |
Residual I
1607.35658
5975.19162
1
498
1607.35658
11.9983767
Total |
7582.5482
499
15.1954874
|
Coef.
Std.
X I
cons I
1.819032
10.06642
y8
Number of obs =
F ( 1,
498) =
Prob > F
R-squared
Adj R-squared =
Root MSE
Err.
t
P> 111
[95% Conf.
Interval]
.1571612
.154919
11.57
64.98
0.000
0.000
1.510251
9.762047
2.127813
10.3708
Figure 9.5
UD
CXI
Is
CD
2 io
g>
co
I
Jo
CM
O
ii
>.
o
-4
I
I
I
500
133.96
0.0000
0.2120
0.2104
3.4639
0
Standard normal x
2
4
258
Statistics with Stata
More credible standard errors and confidence inten’als for this OLS regression can be
obtained by using the robust option:
regress y3 x,
robust
Regression with robust standard errors
i
y8 |
Coef .
Robust
Std. Err
x |
cons |
1.819032
10.06642
.1987122
. 1561S4-5
N’umbe r of obs =
F(
1,
4 98) =
Prob > F
R-squared
Root MSE
9.15
64.45
1 . 000
:. ooo
500
83.80
0.0000
0.2120
3.4639
[95_ Conf.
Interval]
1.428614
9.759561
2.209449
10.37328
Although the fitted model remains unchanged, the robust standard error for the slope is 27%
larger(.199 vs. .157) than its nonrobustcounterpart. With the robust option, the regression
output does not show the usual ANOVA sums of squares because these no longer have their
customary interpretation.
The rationale underlying these robust standard-error estimates is explained in the User 's
Guide. Briefly, we give up on the classical goal of estimating true population parameters (p’s)
for a model such as
T^Po + Pi-^ + e,
Instead, we pursue the less ambitious goal of simply estimating the sample-to-sample variation
that our b coefficients might have, if we drew many random samples and applied OLS
repeatedly to calculate b values for a model such as
yi = b0 + bixi + ei
We do not assume that these b estimates will con\ erge on some “true” population parameter.
Confidence intervals formed using the robust standard errors therefore lack the classical
interpretation of having a certain likelihood (across repeated sampling) of containing the true
value of p. Rather, the robust confidence intervals have a certain likelihood (across repeated
sampling) of containing b, defined as the value upon which sample b estimates converge. Thus,
we pay for relaxing the identically-distributed-errors assumption by settling for a less
impressive conclusion.
Robust Estimates of Variance — 2
Another robust-variance option, cluster, allows us to relax the independent-errors
assumption in a limited way, when errors are correlated within subgroups or clusters ofthe data.
The data in attract.dta describe an undergraduate social experiment that can be used for
illustration. In this experiment, 51 college students were asked to individually rate the
attractiveness, on a scale from 1 to 10. of photographs of unknown men and women. The
rating exercise was repeated by each participant, given the same photos shuffled in random
order, on four occasions during evening social events. Variable ratemale is the mean rating
each participant gave to all the male photos in one sitting, and ratefem is the mean rating given
i
Robust Regression
259
to female photos, gender records the participant’s (rater’s) own gender, and bac his or her
blood alcohol content at the time, measured by Breathalyzer.
Contains data from C:\data\attract.dta
obs:
204
vars :
size :
8
5,508 (99.9% of memory free)
variable name
storage
type
display
format
byte
byte
float
float
byte
float
float
float
% 9 . 3g
*9.0g
*9.0g
*9. 3g
%9.0g
5 9.3-g
9 . 3g
%9.0g
id
gender
bac
genbac
relstat
drinkfrq
ratefem
ratemale
Sorted by:
value
label
Perceived attractiveness and
drinking (D. C. Hamilton 2003)
18 Jul 2005 17:27
variable label
Participant number
Participant gender (female)
Blood alchohol content
gender*bac interaction
Relationship status (single)
Days drinking in previous week
Rated attractiveness of females
Rated attractiveness of males
sex
rel
id
Although the data contain 204 observations, these represent only 51 individual participants.
It seems reasonable to assume that disturbances (unmeasured influences on the ratings) were
correlated across the repetitions by each individual. Viewing each participant’s four rating
sessions as a cluster should yield more realistic standard error estimates. Adding the option
cluster (id) to a regression command, as seen below, obtains robust standard errors across
clusters defined by id (individual participant).
.
regress
ratefem bac gender genbac,
cluster(id)
Regression with robust standard errors
Number of obs F( 3,
50) =
Prob > F
=
R-squared
Root MSE
I
N’umber of clusters
(id)
= 51
I
bac
gender
genbac
_cons
I
i
|
|
|
Coef.
Robust
Std. Err.
t
P> 111
2.896"41
-.72998=5
.2080535
6.48676-
.8543378
. 3383096
1.708146
.229689
3.39
-2.16
0.12
28.24
0.001
0.036
0.904
0.000
204
7.75
0.0002
0.1264
1.1219
[95% Conf. Interval]
1 . 180753
-1.409504
-3.222859
6.025423
4.612729
-.0504741
3.638967
6.94811
Blood alcohol content (bac) has a significant positive effect: as bac goes up, predicted
attractiveness rating of female photos increases as well. Gender (female) has a negative effect:
female participants tended to rate female photos as somewhat less attractive (about .73 lower)
than male participants did. The interaction ofgender and bac is weak (.21). The intercept- and
slope-dummy variable regression model, approximately
predicted ratefem
= 6.49 + 2.90bac - .ligender + .2\genbac
260
Statistics with Stata
can be reduced for male participants (gender = 0) to
= 6.49 + 2.90bac - (.73 x 0) + (.21 x 0 x hoc)
predicted ratefem
= 6.49 + 2.90bac
and for female participants (gender = 1) to
= 6.49 + 2.90bac - (.73 x 1) + (.21 x 1 x bac)
predicted ratefem
= 6.49 + 2.90bac - .73 + .2\bac
= 5.76 + 3.1 \bac
The slight difference between the effects of alcohol on males (2.90) and females (3.11) equals
the interaction coefficient, .21.
Attractiveness ratings for photographs of males were likewise positively affected by blood
alcohol content. Gender has a stronger effect on the ratings ofmale photos: female participants
tended to give male photos much higher ratings than male participants did. For male-photo
ratings, the gender x bac interaction is substantial (-4.36), although it falls short of the 05
significance level.
.
regress ratemal bac gender genbac,
cluster(id)
Regression with robust standard errors
Number of obs =
F(
3,
50) =
Prob > F
R-squared
Root MSE
Number of clusters (id) = 51
I
ratemale I
Coef.
Robust
Std. Err.
bac ;
gender
genbac
ccr.s
4.246042
2.443216
-4.364301
3.626043
2.261792
.-c2=?43.5736=9
.25C-4153
t
P> 111
1.88
5.39
0.066
0.000
0.228
0.000
9
201
10.96
0.0000
0.3516
1.3931
[95* Conf. Interval]
-.2969004
1.53353
-11.54227
3.125049
8.788985
3.352902
2.813663
4.131037
The regression equation for ratings of male photos by male participants is approximately
predicted ratemale = 3.63 ~ 4.25bac - (2.44 * 0) - (4.36 x 0 x bac)
= 3.63 + 4.25Z>ac
and for rating of male photos by female participants,
predicted ratemale = 3.63 + 4.25/mc + (2.44 x 1)
(4.35 x 1 x bac)
= 6.07 -O.llfoc
The difference between the substantial alcohol effect on male
participants (4.25)
(4.25) and
male participants
and the
the near
near
zero alcohol effect on females (-0.11) equals the interaction coefficient, -4.36. In this sample,
males’ ratings of male photos increase steeply, and females’ ratings of male photos remain
virtually steady, as the rater’s bac increases.
Figure 9.6 visualizes these results in a graph. We see positive
relationships
positive rating-bac
rating-bac relationships
across all subplots except for females rating males. The graphs also show other gender
differences, including higher bac values among male participants.
II
Robust Regression
259
to female photos, gender records the participant’s (rater’s) own gender, and bac his or her
blood alcohol content at the time, measured by Breathalyzer.
Contains data from C:\data\attract .dta
cbs :
204
vars :
size :
8
5, 508
variable name
id
gender
bac
genbac
relstat
drinkfrq
ratefem
ratemale
Sorted by:
(99.9% of memory free)
storage
type
byte
byte
float
float
byte
float
float
float
Perceived attractiveness and
drinking (D. C. Hamilton 2003)
18 Jul 2005 17:27
display
format
value
label
%9.
%9.:g
%9..-g
%9. Oa
%9.0g
%9.:g
%9.0g
sex
variable label
Participant number
Participant gender (female)
Blood alchohol content
gender*bac interaction
Relationship status (single)
Days drinking in previous week
Rated attractiveness of females
Rated attractiveness of males
rel
id
Although the data contain 204 observations, these represent only 51 individual participants
It seems reasonable to assume that disturbances (unmeasured influences on the ratines) were
correlated across the repetitions by each individual. Viewing each participant's four ratine
sessions as a cluster should yield more realistic standard error estimates. Addin° the option
cluster (rd) to a regression command, as seen below, obtains robust standard errors across
clusters defined by id (individual participant).
.
regress ratefem bac gender genbac,
cluster(id)
Regression with robust standard errors
I
Number of clusters
I
r a t e f er.
bac
gender
genbac
_cons
I
I
j
I
j
(id)
Number of obs =
F(
3,
50) =
Prob > F
R-squared
Root MSE
= 51
Coef .
Robust
Std. Err
t
P> 111
2.896741
- . 7299888
.2080538
6.486767
. 8 54 337 8
.3383096
1.708146
.229689
3.39
-2.16
0.12
28.24
0.001
0.036
0.904
0.000
[95% Conf.
1.180753
-1.409504
-3.222859
6.025423
204
7.75
0.0002
0.1264
1.1219
Interval]
4 . 612729
- . 0504741
3.638967
6.94811
Blood alcohol content (bac) has a significant positive effect: as bac goes up predicted
attractiveness rating of female photos increases as well. Gender (female) has a negative effect
female participants tended to rate female photos as somewhat less attractive (aboLt .73 lower)
tan male participants did. The interaction ofgender and bac is weak (.21). The intercept- and
slope-dummy variable regression model, approximately
predicted ratefem
6.49 + 2.90/mc - .Tigender + .21ge/;/jac
I
260
Statistics with Stata
can be reduced for male participants (gender = 0) to
= 6.49 + 2.90bac - (.73 x 0) + (.21 x 0 x frac)
predicted ratefem
= 6.49 + 2.90bac
and for female participants (gender = 1) to
predicted ratefem
6.49 + 2.90bac- (.73 x ]) + (.21 x ] x bac)
6.49 + 2.90^c-.73 + .21^c
- 5.76 + 3.11 bac
The slight difference between the effects of alcohol on males (2.90) and females (3.11) equals
the interaction coefficient, .21.
Attractiveness ratings for photographs of males were likewise positively affected by blood
a cohol content. Gender has a stronger effect on the ratings ofmale photos: female participants
tended to give male photos much higher ratings than male participants did. For male-photo
ratings, the gender x bac interaction is substantial (-A36). although it falls short of the 05
significance level.
regress ratemal bac gender genbac,
cluster(id)
Regression with robust standard errors
Number of clusters
Number of obs =
F( 3,
50) =
Prob > F
=
R-squared
Root. MSE
(id) = 51
I
ratemale |
Coef.
Robust
Std. Err.
t
P> 111
|
|
|
|
4.246042
2.443216
-4.364301
3.628043
2.261792
.4529047
3.573689
.2504253
1.88
5.39
-1.22
14.49
0.066
0.000
0.228
0.000
bac
gender
genbac
_cons
201
10.96
0.0000
0.3516
1.3931
[95% Conf. Interval]
-.2969004
1.53353
-11.54227
3.125049
8.788985
3.352902
2.813663
4.131037
The regression equation for ratings of male photos by male participants is approximately
predicted ratemale = 3.63 + 4.25bac + (2.44 x 0) - (4.36 x 0 * bac)
= 3.63 + 4.25bac
and for rating of male photos by female participants,
predicted ratemale = 3.63 + 4.25bac -n (2.44 x 1)
(4.36 x ] x bac)
— 6.07 - 0.1 \bac
The difference between the substantial alcohol effect on male participants (4.25) and the near
zero alcohol effect on females (-0.11) equals the interaction coefficient, -4.36. In this sample,
males’ ratings of male photos increase steeply, and females’ ratings of male photos remain
virtually steady, as the rater’s bac increases.
Figure 9.6 visualizes these results in a graph. We see positive rating-bac relationships
across all subplots except for females rating males. The graphs also show other gender
differences, including higher bac values among male participants.
f
Robust Regression
cn
Female raters
j8>
E
o
CO -
o
t- - 8
co
Figure 9.6
Male raters
CQ o> -
CD -
V
<0
0) •n C
<D
> co
i
- '
261
o
O
,p 9*
'
CM
<
co
<V
Female raters
Male raters
CD
E oo
I
I
i
co <o
co
OJ
c
♦.a
(D
> co O
CM -
ro__
<
o
.1
.2
•3
.4 0
.1
Blood alcohol content
.2
.3
.4
i
OLS regression with robust standard errors, estimated by regress with the robust
option, should not be confused with the robust regression estimated by rreg . Despite
similar-sounding names, the two procedures are unrelated, and solve different problems.
I
I
I
■
£ V: ' • ■ •
-
Logistic Regression
The regression and ANOVA methods described in Chapters 5 through 9 require measured
dependent or v variables. Stata also offers a full range of techniques for modeling categorical
ordinal, and censored dependent variables. A list of some relevant commands follows. For
more details on any ot these, type help command.
binreg
Binomial regression (generalized linear models).
blogit
Logit estimation with grouped (blocked) data.
Probit estimation with grouped (blocked) data.
bprobi t
clogi t
cloglog
cnreg
Conditional fixed-effects logistic regression.
Complementary log-log estimation,
Censored-normal regression, assuming that r follows a Gaussian distribution but
is censored at a point that might vary from observation to observation.
constraint
dprobit
glm
glogit
Defines, lists, and drops linear constraints.
Probit regression giving changes in probabilities instead of coefficients.
Generalized linear models. Includes option to model logistic, probit, or
complementary log-log links. Allows response variable to be binary or
proportional for grouped data.
Logit regression for grouped data.
gprobit
Probit regression for grouped data.
heckprob Probit estimation with selection.
hetprob
Heteroskedastic probit estimation.
intreg
Interval regression, where r is either point data, interval data, left-censored data,
or right-censored data.
logistic Logistic regression, giving odds ratios.
logit
Logistic regression
odds ratios.
mlogi t
nlogi t
Multinomial logistic regression, with polytomousy variable.
Nested logit estimation.
ologit
Logistic regression with ordinaly variable.
oprobit
Probit regression with ordinal y variable.
Probit regression, with dichotomousy variable.
probit
262
similar to logistic , but giving coefficients instead of
i
11 II
Logistic Regression
263
roiogit
Rank-ordered logit model for rankings (also known as the Plackett-Luce model,
exploded logit model, or choice-based conjoint analysis).
s cob i t
Skewed probit estimation.
svy: logit Logistic regression with complex survey data. Survey ( svy ) versions of
many other categorical-variables modeling commands also exist.
tobit
Tobit regression, assumingy follows a Gaussian distribution but is censored at a
known, fixed point (see cnreg for a more general version).
I
xtciogiog Random-effects and population-averaged cloglog models. Panel ( xt) versions
of logit, probit, and population-averaged generalized linear models (see
help xtgee ) also exist.
After most model-fitting commands, predict can calculate predicted values or
probabilities.
predict also obtains appropriate diagnostic statistics, such as those
described for logistic regression in Hosmer and Lemeshow (2000). Specific predict
options depend on the type of model just fitted. A different post-fitting command,
predictnl , obtains nonlinear predictions and their confidence intervals (see help
predictnl).
Examples of several of these commands appear in the next section. Most of the methods
for modeling categorical dependent variables can be found under the following menus:
Statistics - Binary outcomes
Statistics - Ordinal outcomes
Statistics - Categorical outcomes
Statistics - Generalized linear models (GLM)
Statistics - Cross-sectional time series
Statistics - Linear regression and related - Censored regression
I
After the Example Commands section below, the remainder of this chapter concentrates on
an important family of methods called logit or logistic regression. We review basic logit
methods for dichotomous, ordinal, and polytomous dependent variables.
Example Commands
. logistic y xl x2 x3
Performs logistic regression of {0,1} variable y on predictors xl, x2, and x3. Predictor
variable effects are reported as odds ratios. A closely related command,
. logit y xl x2 x3
I
performs essentially the same analysis, but reports effects as logit regression coefficients.
The underlying models fit by logistic and logit are the same, so subsequent
predictions or diagnostic tests will be identical.
264
.
Statistics with Stata
Ifit
Presents a Pearson chi-squared goodness-of-fit test for the fitted logistic model- observed
versus expected frequencies of r = 1, using cells defined by the covariate (x-variable)
patterns. When a arge number of.v patterns exist, we might want to group them according
to estimated probabilities. Ifit, group(10) would perform the test with 10
approximately equal-size groups.
Istat
Presents classification statistics and classification table. Istat, Iroc , and Isens
(see below) are particularly useful when the point of analysis is classification. These
commands all refer to the previously-fit logistic' model.
Iroc
Graphs the receiver operating characteristic (ROC) curve, and calculates area under the
curve.
.
Isens
Graphs both sensitivity and specificity versus the probability cutoff.
■ predict phat
Generates a new variable (here arbitrarily namedphat) equal to predicted probabilities that
y- 1 based on the most recent logistic model.
. predict dX2, dx2
Generates a new variable (arbitrarily named dX2), the diagnostic statistic measuring
change in Pearson chi-squared, from the most recent logistic analysis.
. mlogit y xl x2 x3, base(3) rrr nolog
Perfonns multinomial logistic regression of multiple-category variable y on three x
vanabJe5. Option base (3) specifiesy = 3 as the base category for comparison; rrr
calls for relative risk ratios instead of regression coefficients; and nolog suppresses
display of the log likelihood on each iteration.
• Predict P2, outcome(2)
Generates a new variable (arbitrarily named P2) representing the predicted probability that
)
based on the most recent mlogit analysis.
. glm success xl x2 x3, family(binomial trials) eform
Performs a logistic regression via generalized linear modeling using tabulated rather than
individual-observation data. The variable success gives the number of times that the
outcome of interest occurred, and trials gives the number of times it could have occurred
for each combination of the predictors xl, x2, and x3. That is, success/trials would equal
the proportion of times that an outcome such as “patient recovers” occurred. The eform
option asks for results in the form of odds ratios (“exponentiated form”) rather than logit
coefficients.
. cnreg y xl x2 x3, censored(cen)
Performs censored-normal regression ofmeasurement variable^ on three predictorsxl,x2,
and x3. If an observation’s true y value is unknown due to left or right censoring, it is
replaced for this regression by the nearest y value at which censoring occurs. The
censoring variable cen is a {-1,0,1} indicator of whether each observation’s value ofy has
been left censored, not censored, or right censored.
1
1
Logistic Regression
265
Space Shuttle Data
Our main example for this chapter, shuttle.dta, involves data covering the first 25 flights of the
U.S. space shuttle. These data contain evidence that, if properly analyzed, might have
persuaded NASA officials not to launch Challenger on its last, fatal flight in 1985 (that was
25th shuttle flight, designated STS 51 -L). The data are drawn from the Report ofthe Presiden
tial Commission on the Space Shuttle Challenger Accident (1986) and from Tufte (1997).
Tufte’s book contains an excellent
excellent discussion
discussion about
about data
data and
and analytical
analytical issues.
issues. His
His comments
comments
regarding specific shuttle flights are included as a string variable in these data.
Contains data from C:\data\shuttle.dta
obs:
25
vars:
g
size:
1,675 (99.9% of memory free)
variable name
storage
type
display
format
value
label
flbl
flight
month
day
year
distress
temp
damage
byte
byte
byte
int
byte
byte
byte
%8.0g
%8.0g
%8.0g
%8.0g
%8.0g
%8.0g
%9.0g
comments
str55
%55s
dlbl
I
I
First 25 space shuttle fliahts
20 Jul 2005 10:40
variable label
Flight
Month of launch
Day of launch
Year of launch
Thermal distress incidents
Joint temperature, degrees F
Damage severity index (Tufte
1997)
Comments (Tufte 1997)
Sorted by:
I
I
I
I
J
•
list flight-temp, sepby(year)
+
I
flight
I
1. I
STS-1
2. I
STS-2
I3. I
STS-3
4 . I
STS-4
5. I
STS-5
I6. I
STS-6
7. I
STS-7
8. I
STS-8
9. I
STS-9
I10. I STS_41-E
11. I STS_41-C
12 . I STS_41-D
13. I STS_41-G
14 . I STS 51-A
I15 . I STS_51-C
16 . I STS_51-D
17 . I STS_51-B
18 . I STS_51-G
19. I ■STS_51-F
20. I ;STS_51-I
21 . I STS_51-J
;
22 . I STS
61-A
i
month
day
year
date
distress
4
11
12
12
1981
1981
7772
7986
none
1 or 2
3
6
11
22
27
11
1982
1982
1982
8116
8213
8350
none
none
4
6
8
11
4
18
30
28
1983
1983
1983
1983
8494
8569
8642
8732
1 or 2
none
none
none
67
72
73
70
2
4
8
10
11
3
6
30
5
8
1984
1984
1984
1984
1984
8799
8862
9008
9044
9078
1 or 2
3 plus
3 plus
none
none
57
63
1
4
4
6
7
8
10
.10.
24
12
29
17
29
27
3
30
1985
1985
1985
1985
1985
1985
1985
19.8.5
9155
9233
9250
9299
9341
9370
9407
--9-434
3
3
3
3
1
1
plus
plus
plus
plus
or 2
or 2
none
3 plus
temp
i
66 I
70 !
I
69 I
80 I
68 I
78
67
I
I
I
I
I
I
I
I
I
53 I
67 I
75 I
70 I
81 I
76 I
79 I
75 I
lb
4/
266
I
Statistics with Stata
:r
23.
24 .
25.
I STS_61-B
|--------I STS_61-C
I STS 51-L
11
26
1985
9461
1 or 2
1
1
12
28
1986
1986
9508
9524
3 plus
76 |
__|
58 |
31 I
This chapter examines three of the shuttle.dta variables:
distress
The number of “thermal distress incidents,” in which hot gas blow-through or
charring damaged joint seals of a flight’s booster rockets. Bum-through of a
ooster joint seal precipitated the Challenger disaster. Many previous flights had
experienced less severe damage, so the joint-seals were known to be a source of
possible danger.
temp
The calculated joint temperature at launch time, in degrees Fahrenheit
Temperature depends largely on weather. Rubber O-rings sealing the booster
rocket joints become less flexible when cold.
date
Date, measured in days elapsed since January 1,1960 (an arbitrary starting point)
date is generated from the month, day, and year of launch using the mdy (monthday-year to elapsed time; see help dates ) function:
generate date = mdy(month,
.
day, year)
label variable date "Date (days since 1/1/60)"
Launch date matters because several changes over the course of the shuttle program might
have made it riskier. Booster rocket walls were thinned to save weight and increase payloads
and joint seals were subjected to higher-pressure testing. Furthermore, the reusable shuttle
hardware was aging. So we might ask, did the probability ofbooster joint damage (one or more
distress incidents) increase with launch date?
distress is a labeled numeric variable:
.
tabulate distress
Thermal
distress
incidents
I
I
I
Freq.
Percent
Cum.
none |
1 or 2 |
3 plus |
9
6
8
39.13
26.09
34.78
39.13
65.22
100.00
Total |
23
100.00
Ordinarily, tabulate displays the labels, but the nolabel option reveals that the
underlying numerical codes are 0 = “none”, 1 = “1 or 2”, and 2 = “3 plus.”
.
tabulate distress,
Thermal
distress
incidents
nolabel
I
I
I
Freq.
Percent
Cum.
0 I
1 I
2 I
9
6
8
39.13
26.09
34.78
39.13
65.22
100.00
Total |
23
100.00
Logistic Regression
267
■■
We can use these codes to create a new dummy variable, any, coded 0 for no distress and 1 for
one or more distress incidents:
. generate any = distress
(2 missing values generated)
. replace any = 1 if distress
(8 real changes made)
2
label variable any "Any thermal distress"
To see what this accomplished,
.
tabulate distress any
Thermal
distress
incidents
I Any thermal distress
I
I
0
1 I
+
none I
9
0 I
1 or 2 |
0
6 I
3 plus |
0
8 I
------ +.
Total |
9
14
Total
e
=
|
23
Logistic regression models how a {0,1} dichotomy such as any depends on one or more*
variables. The syntax of logit resembles that of regress and most other model-fitting
commands, with the dependent variable listed first.
I
.
logit any date,
Iteration 0:
icc
Iteration 1:
leg
Iteration 2:
leg
Iteration 3:
log
Logit estimates
coef
likelihood = -15.394543
likelihood = -13.01923
likelihood = -12.991146
likelihood = -12.991096
Number of cbs
LR chi2.1)
Prob > chi2
Pseudo ?,2
I
I
I
Log likelihood = -12.991096
any |
---- +
date |
cons I
Coef.
Sea. brr.
z
'-> I z I
1'020907
e.13116
.: Gillos
9.517217
-1. 91
.05“
• r -
(95% Conf.
-6.93e-06
-3 6. ■’8456
23
4.81
0.0283
0.1561
Interval]
.00418S4
.5222396
The logit iterative estimation procedure maximizes the logarithm of the likelihood
function, shown at the output’s top. At iteration 0, the log likelihood describes the fit of a
model including only the constant. The last log likelihood describes the fit of the final model,
L =-18.13116+ .0020907</ate
|-10
where L represents the predicted logit, or log odds, of any distress incidents:
I
L = ln[P(a/y’ = 1) / P(any = 0)]
[! 0.2]
An overall %2 test at the upper right evaluates the null hypothesis that all coefficients in the
model, except the constant, equal zero,
X2 =-2(ln$£I-InS£f)
[10-3]
where In j is the initial or iteration 0 (model with constant only) log likelihood, and In
is
the final iteration’s log likelihood. Here,
268
J
Statistics with Stata
x2 =-2[-15.394543 - (-12.991096)]
= 4.81
The probability of a greater X2, with 1 degree of freedom (the difference in complexity between
initial and final models), is low enough (.0283) to reject the null hypothesis in this example.
Consequently, date does have a significant effect.
Less accurate, though convenient, tests are provided by the asymptotic z (standard normal)
statistics displayed with logit results. With one predictor variable, that predictor’s ’
statistic and the overall X2 statistic test equivalent hypotheses, analogous to the usual t and F
statistics in simple OLS regression. Unlike their OLS counterparts, the loeitz approximation
and X tests sometimes disagree (they do here). The X2 test has more general validity.
Like Stata’s other maximum-likelihood estimation procedures, logit displays a pseudo
R with its output:
pseudo R 2 = 1 - In
For this example,
/ In ££<
[10.4]
pseudo R 2
1 -(-12.991096)/(-15.394543)
= .1561
Although they provide a quick way to describe or compare the fit of different models for the
same dependent variable, pseudo R 2 statistics lack the straightforward explained-variance
interpretation of true R 2 in OLS regression.
After logit,the predict command(with no options) obtains predicted probabilities.
Phat = 1 /(1 + e £)
[10.5]
Graphed against date, these probabilities follow an S-shaped logistic curve as seen in Figure
I
’’I
7
Logistic Regression
269
. predict Phat
label variable Phat "Predicted P(distress >= 1)"
.
graph twoway connected Phat date, sort
Figure 10.1
i
r
I
r
£L
7500
I
8000
8500
Date (days since 1/1/60)
9000
9500
The coefficient given by logit ( .0020907) describes date's effect on the logit or log
odds that any thermal distress incidents occur. Each additional day increases the predicted log
odds of thermal distress by .0020907. Equivalently, we could say that each additional day
multiplies predicted odds of thermal distress by e <’?20907 = 1.0020929; each 100 days therefore
multiplies the odds by (e ■ 0 )
= 1.23. (e ~ 2.71828, the base number for natural
logarithms.) Stata can make these calculations utilizing the _b\yarname] coefficients stored
after any estimation:
display exp(_b[datej)
.
display exp(_b[date])A100
. z. J25359
Or. we could simply include an or (odds ratio) option on the logit command line. An
alternative way to obtain odds ratios employs the logistic command described in the next
section, logistic fits exactly the same model as logit, but its default output table
displays odds ratios rather than coefficients.
I
270
II
is
Statistics with Stata
Using Logistic Regression
Here is the same regression seen earlier, but using logistic instead of logit:
logistic any date
Logit estimates
Number of obs
LR chi2(l)
Prob > chi2
Pseudo R2
Log likelihood = -12.9^1396
23
4 . 81
0.028?
0.1561
I
any
I
Odds Racio
Std. Err.
z
P> I z |
[95% Conf.
Interval]
date
I
1.0022 93
.0010725
1 . 95
0.051
.9999931
1.00419“
Note the identical log likelihoods and x2 statistics. Instead ofcoefficients (6), logistic
displays odds ratios (e'1). The numbers in the “Odds Ratio” column of the logistic output
are amounts by which the odds favoring r = 1 are multiplied, with each 1 -unit increase in that
x variable (if other x variables’ values stay the same).
After fitting a model, we can obtain a classification table and related statistics by typins
Is tat
Logistic model
for any
-e
Classified !
+
1
Total
-D
Total
12
2
4
16
c,
7
14
9
Classified + if predicted Pr:
True D defined as anv !=
Sensitivity
Specificity
Positive predictive
Negative predictive
I-
False
False
False
False
+
+
-
rate
rate
rate
rate
for
for
for
for
true true I
classc
class: red
Correctly classified
i
?r v
Pr •
S5
! X "O
= £1
Pr i
Pr (
+ i
Pr( -|
Pr(~C|
Pr( D|
-)
44.44%
14.29%
25.03%
28.57%
73.91%
By default, Istat employs a probability of .5 as its cutoff (although we can change this
by adding a cutoff ( ) option). Symbols in the classification table have the following
meanings:
D
The event of interest did occur (that is,y = 1) for that observation. In this example,
D indicates that thermal distress occurred.
The event of interest did not occur (that is, y = 0) for that observation. In this
example, -D corresponds to flights having no thermal distress.
Logistic Regression
271
The model's predicted probability is greater than or equal to the cutoff point.
Since we used the default cutoff, + here indicates that the model predicts a .5 or
higher probability of thermal distress.
The predicted probability is less than the cutoff. Here, - means a predicted
probability of thermal distress below .5.
Thus for 12 flights, classifications are accurate in the sense that the model estimated at least
a .5 probability of thermal distress, and distress did in fact occur. For 5 other flights the model
predicted less than a .5 probability, and distress did not occur. The overall ’“correctly
dass^ed” rate is therefore 12 + 5= 17 out of 23, or 73.91%. The table also gives conditional
probabilities such as "sensitivity” or the percentage of observations with P i .5 eiven that
thermal distress occurred (12 out of 14 or 85.71%).
After logistic or logit, the followup command predict calculates various
prediction and diagnostic statistics. Discussion of the diagnostic statistics can be found in
Hosmer and Lemeshow (2000).
predict newvar
Predicted probability thaty = I
predict newvar,
xb
Linear prediction (predicted log odds that v = 1)
predict newvar,
stdp
predict newvar, dbeta
Standard error of the linear prediction
A5 influence statistic, analogous to Cook’s D
predict newvar,
Deviance residual for jth x pattern, dj
deviance
predict newvar, dx2
predict newvar, ddeviance
predict newvar,
hat
predict newvar, number
I
predict newvar,
resid
predict newvar,
rstandard
Change in Pearson %2, written as A^2 or Ax2p
Change in deviance x2, written as AD or Ax2 D
Leverage of the y'th x pattern, hj
Assigns numbers to x patterns, j = 1,2,3 ... J
Pearson residual forjth x pattern, rj
Standardized Pearson residual
Statistics obtained by the dbeta , dx2 , ddeviance , and hat options do not
measure the influence of individual observations, as their counterparts in ordinary regression
do. Rather, these statistics measure the influence of “covariate patterns”; that is, the
consequences of dropping all observations with that particular combination ofx values.’ See
Hosmer and Lemeshow (2000) for details. A later section of this chapter shows these statistics
in use.
Does booster joint temperature also affect the probability of any distress incidents? We
could investigate by including temp as a second predictor variable .
272
Statistics with Stata
J
.
logistic any date
temp
Logit estimates
Log likelihood =
1.35 : "48
any I Odds Ratio
date
temp
|
|
Number of obs
LR chi2(2)
Prob > chi2
Pseudo R2
1.00297
. 84083 2 9
23
8.09
0.0175
0.2627
Std. Err.
z
P> I z I
[95% Conf. Interval]
.0013675
.0987887
2.17
-1 . 48
0.030
0.140
1.000293
.6678848
1.005653
1.058561
The classification table indicates that including temperature as a predictor improved our
correct classification rate to 78.26%.
Istat
Logistic model for any
- . rue
D
Classified |
+
I
I
Total
-D
Total
12
3
6
15
8
14
9
23
Classified + if predicted Pr-Di
True D defined as any != 0
Sensitivity
Specificity
Positive predictive value
Negative predictive value
False
False
False
False
*
ce ce D
*
= ccted - rate for classi ted -
Correctly classified
.5
Pr( +| D)
Pr( -HD)
Pr( D| + )
?r(-D| -)
85.71%
66.67%
80.00%
75.00%
?r( +|-D)
Pr( -I D)
Pr
+)
33.33%
14.29%
20.00%
25.00%
rr( D| -)
78.26%
.According to the fitted model, each 1-degree increase in joint temperature multiplies the
odds of booster joint damage by .84 (in other words, each 1-degree warming reduces the odds
o damage by about 16%). Although this effect seems strong enough to cause concern, the
asymptotic z test says that it is not statistically significant (z = -1.476, P = .140) A more
definitive test, however, employs the likelihood-ratio %2. The Irtest’ command compares
nested models estimated by maximum likelihood. First, estimate a “full” model containing all
variables of interest, as done above with the logistic any date temp command.
Next, type an estimates store command, giving a name (such as full) to identify this
first model:
.
estimates
store full
Now estimate a ireduced
'
' model,
- including only a subset of the x variables from the full
model. (Such reduced models are said to be “nested.”) Finally, a command such as> Irtest
Jy
Logistic Regression
273
full requests a test ofthe nested model against the previously stored/z/Z/ model. For example
(using the quietly prefix, because we already saw this output once),
- quietly logistic any date
. Irtest full
likelihood-ratio test
(Assumption: . nested in full)
LR chi2 (1)
=
Prob > chi2 =
3.28
0.0701
This Irtest command tests the recicent (presumably nested) model against the model
previously saved by estimates store
---- .It employs a general test statistic for nested
maximum-likelihood models,
X2 =-2(ln^, - lnSP0)
[10.6]
where In 0 is the log likelihood for the first model (with all x variables), and In a
likelihood for the second model (with a subset ofthosex variables). Compare the resulting test
statistic to a
distribution with degrees of freedom equal to the difference in complexity
(number ofx variables dropped) between models 0 and 1. Type help Irtest formore
about this command, which works with any of Stata’s maximum-likelihood estimation
procedures (logit, mlogit, stcox, and many others). The overall X 2 statistic routinely
given by logit or logistic output (equation [10.3]) is a special case of [10.6],
I
I
The previous Irtest example performed this calculation:
X2 =-2[-12.991096-(-11.350748)]
= 3.28
with 1 degree of freedom, yielding P = .0701; the effect of temp is significant at a = 10
G>ven the small sample and fetal consequences of a Type II error, a = .10 seems a more prudent
cutoff than the usual a = .05.
H
Conditional Effect Plots
I
I
I
Conditional effect plots help m understanding what a logistic model implies aboutprobabilities.
The idea behind such plots is to draw a curve showing how the model’s prediction ofy changes
as a function of one x variable, while holding all other x variables constant at chosen values
such as their means, quartiles, or extremes. For example, we could find the predicted
probability of any thermal distress incidents as a function of temp, holding date constant at its
25th percentile. The 25th percentile of date, found by summarize date, detail is
8569 — that is, June 18, 1983.
’
.
quietly logit any date temp
■
generate LI = _b[_cons]
■
generate Phatl = 1/(1 + exp(-Ll))
.
label variable Phatl "P(distress >= 1
+ _b[date]*8569 + _b[temp]* temp
|
date = 8569)"
LI is the predicted logit, and Phatl equals the correspondingpredicted probability that distress
a 1, calculated according to equation [10.5], Similar steps find the predicted probability of any
distress with date fixed at its 75th percentile (9341, or July 29, 1985):
274
generate L2 - _b[_cons]
-
+ _b[date]*9341 + _b [ temp] ★temp
generate Phat2 = 1/(1 + exp(-L2))
.
label variable Phat2 "P(distress >= 1
.
J
I
i!
Statistics with Stata
|
date = 9341)"
thetwolC/n|n0Lgraph thu relationshiP between ,emP and the probability of any distress, for
he two levels Of date, as shown m Figure 10.2. Using median splines with many vertical bands
(graph twoway mspline, bands (50)) produces smooth curves in this figure
approximating the smooth logistic functions.
. graph twoway mspline Phatl temp, bands(50)
II
mspline Phat2 temp, bands(50)’
II
, ytitle("Probability of thermal distress")
ylabel(0(.2)1, grid) xlabel(, grid)
legend(label (1 "June 1983") label (2 "July 1985")
rows(2) position(7) ring(0))
i
Figure 10.2
1
r■
1
COCO -
1
ri
I
°
30
— June 1983
-- July 1985
40
50
60
Joint temperature, degrees F
70
80
Among earlier flights (date =8569, left curve), the probability of thermal distress goes from
very low, at around 80c F, to near 1, below 50° F. Among later flights (date = 9341, right
curve) however, the probability of any distress exceeds .5 even in warm weather, and climbs
towaid 1 on flights below 70° F. Note that Challenger's launch temperature, 31° F, places it
at top left in Figure 10.2. This analysis predicts almost certain booster joint damage.
Diagnostic Statistics and Plots
L
As mentioned earlier, the logistic regression influence and diagnostic statistics obtained by
predict refer not to individual observations, as do the OLS regression diagnostics of
Chapter 7. Rather, logistic diagnostics refer to x patterns. With the space shuttle data,
however, each x pattern is unique — no two flights share the same combination of date and
Logistic Regression
275
temp (naturally, because no two were launched the same day). Before using predict we
quietly refit the recent model, to be sure that model is what we think:
quietly logistic any date temp
.
. predict Phat3
(option p assumed; Pr(an'y))
label variable Phat3 "Predicted probability"
.
. predict dX2, dx2
(2 missing values generated)
.
label variable dX2 "Change in Pearson chi-squared"
. predict dB, dbeta
(2 missing values generated)
label variable dB "Influence"
.
. predict dD, ddeviance
(2 missing values generated)
label variable dD "Change in deviance"
1
Hosmer and Lemeshow (2000) suggest plots that help in reading these diagnostics. To
graph change in Pearson versus probability of distress (Figure 10.3), type:
graph twoway scatter dX2 Phat3
.
o
Figure 10.3
T5 CO
S?
ro
.±
I
I
O <D
s
OT
ro
0
1
o
U)
1
O 04
I
o
0
.2
•4
.6
Predicted probability
.8
1
I
Two poorly fit x patterns, at upper right and left, stand out. We can identify these two
flights (STS-2 and STS 51-A) if we include marker labels in the plot, as seen in Figure 10.4.
I
276
Statistics with Stata
■ graph twoway scatter dX2 Phat3f
mla.be! (flight)
mlabsize (small)
o
Figure 10.4
• STS-2
—
o co
<6
□
I
O CD
c
o
w
ro
• STS.51-A
<D
.£
CD
CD
C
GJ
5-
• STS_51-J
• STS»£TS-3
o
-^?8STS-41-G
P61-C
0
.2
4.
.6
Predicted probability
list flight any date temp dX2 Phat3 if dX2
i
«
I
0
r.
2.
4.
14 .
25.
+ -I
flight
I -I
STS-2
I
STS-4
I STS 51-A
I STS 51-L
any
date
temp
dX2
1
7986
8213
9078
9524
70
80
67
31
9.630337
0
T
.8
5.899742
> 5
Phat3 |
-------- I
.1091805 |
.0407113 |
.8400974 |
.9999012 |
Flight STS 51-A experienced no 1*thermal distress, despite a late launch date and cool
tempcmure (see Figure 10.2). The model predicts a .84 probability of distress for this flight*
A l points along the up-to-right curve in Figure 10.4 have any = 0, meaning no thermal distress.
top the up-to-left (any- 1) curve, flight STS-2 experienced thermal distress despite being one
°
leSt
and launched in slightly milder weather. The model predicts only a . 109
probability of distress. (Because Stata considers missing values as “high” numbers, it lists the
two missing-values flights, including Challenger, among those with dX2 > 5.)
Similar findings result fromplotting<7£> versus predicted probability, as seen in Figure 10.5.
Again, flights STS-2 (top left) and STS 51-A (top right) stand out as poorly fit. Figure 10.5
i ustrates a variation on the labeled-marker scatterplot. Instead of putting the flight-number
labels near the markers, as done earlier in Figure 10.4, we make the markers themselves
invisible and place labels where the markers would have been in Figure 10.5.
1
Logistic Regression
277
. graph twoway scatter dD Phat3, msymbol(i) mlabposition (0)
mlabel(flight) mlabsize(small)
Figure 10.5
STS-2
io
STS_51-A
o
c
■u
.£
STS_51-J
<D
O)
STS 51-F
STS^S-9
O
STS_41-G
STS-3
STS-1
o
~STS 61-C
0
I
I
.2
.4
.6
Predicted probability
.8
1
dB measures an x pattern’s influence in logistic regression, as Cook’s D measures an
individual observation’s influence in OLS. For a logistic-regression analogue to the OLS
diagnostic plot in Figure 7.7, we can make the plotting symbols proportional to influence as
one in Figure 10.6. Figure 10.6 reveals that the two worst-fit observations are also the most
influential.
. graph twoway scatter dD Phat3 [aweight = dB] , msymbol(oh)
Figure 10.6
I
\
i
o
S
.£
<D
05
ro ™
JZ
I
O
0
£
o
o
<£>
°o
O
Q,
o
O
0
.2
.4
.6
Predicted probability
.8
1
•I
278
Statistics with Stata
m t
and lnfluentlal observat>ons deserve special attention because they both
contradict the main pattern of the data and pull model estimates in their contrary direction Of
course, simply removing such outliers allows a “better fit” with the remaining data — but this
is circular reasoning. A more thoughtfill reaction would be to investigate what makes the
outliers unusual. Why did shuttle flight STS-2, but not STS 51-A, experience booster joint
damage? Seeking an answer might lead investigators to previously overlooked variables or to
otherwise respecify the model.
Logistic Regression with Ordered-Category y
.J
1
j
r
IIn
i
logit and logistic fit only models that have two-category {0,!}y variables. We need
other methods for models in which v takes on more than two categories. For example,
ologit Ordered logistic regression, where vis an ordinal (ordered-category) variable. The
numerical values representing the categories do not matter, except that higher
numbers mean “more. For example, the y categories might be {1 = “poor ” 2 =
“fair,” 3 = “excellent”}.
mlogit Multinomial logistic regression, where y has multiple but unordered categories
such as {1 — Democrat.” 2 = “Republican,” 3 = “undeclared”}.
If j is {0,1}, logit (oi logistic), ologit, and mlogit all produce essentially
the same estimates.
_ We earlier simplified the three-category ordinal variable distress into a dichotomy, any.
logit and logistic require {0,1} dependent variables. ologit, on the other hand,
is designed for ordinal variables like distress that have more than two categories,
The
numerical codes representing these categories do not matter, so long as higher numerical values
mean more” of whatever is being measured. Recall that distress has categories 0 = “none.”
1
1 or 2,” and 2 - “3 plus” incidents of booster-joint distress.
Ordered logistic regression indicates that date and temp both affect distress, with the same
signs (positive for date, negative for temp) seen in our earlier analyses:
.
ologit distress date temp,
nolog
Ordered logit estimates
Log likelihood =
-18.79706
distress |
Number of obs
LR chi2(2)
Prob > chi2
Pseudo R2
23
12.32
0.0021
0.2468
---------- +
date |
temp |
Coef.
Std. Err.
z
P>|z|
[95% Conf.
Inter’.-
.003286
-.1733752
.0312662
.0=34473
2.60
-2.08
0.009
0.038
. 0008043
- .336929
-.0098215
|
|
16.42813
18.12227
9.554813
9."22293
------- + .
cutl
cut2
(Ancillary parameters)
Likelihood-ratio tests are more accurate than the asymptotic z tests shown. First, have
estimates store preserve in memory the results from the full model (with two
predictors) just estimated. Arbitrarily, we can name this model A.
1
I
Logistic Regression
.
279
estimates store A
Next, fit a simpler model without temp, store its results as model B, and ask for a likelihood
ratio test of whether the fit of reduced model B differs significantly from that of the full model
model A:
.
quietly ologit distress date
estimates store B
.
Irtest B A
likelihood-ratio test
(Assumption: B nested ir. A)
LR chi2(1) =
Prob > chi2 =
6.12
0.0133
The Irtest output notes its assumption that model B is nested in model A — meaning
that the parameters estimated in B are a subset of those in A, and that both models are estimated
rom the same pool of observations (which can be tricky when the data contain missins values)
This likelihood-ratio test indicates that B’s fit is significantly poorer. Because the presence of
temp as a predictor in model A is the only difference, the likelihood-ratio test thus informs us
that/ewp’s contribution is significant. Similar steps find that date also has a significant effect.
.
quietly ologit distress temp
estimates store C
.
Irtest C A
likelihood-ratio test
(Assumption: C nested ir. A)
LR chi2(l) =
Prob > chi2 =
10.. 33
0.0013
The estimates store and Irtest commands provide flexible tools for comparing
nested maximum-likelihood models. Type help Irtest and help estimates for
details, including more advanced options.
I
The ordered-logit model estimates a score, S, as a linear function of date and temp:
•S'
= .003286dure - . 1733752/emp
Predicted probabilities depend on the value of S, plus a logistically distributed disturbance u
relative to the estimated cut points:
I
I
P(distress=“none")
= P(S+u < _cutl)
P^distress-' 1 or 2”)
= PCcutl <S+u s _cut2) = P(16.42813 <S+u < 18.12227)
P(distress-‘3 plus”)
= P(_cut2 <S+u)
= P(S+u < 16.42813)
= P( 18.12227 <S+u)
After ologit, predict calculates predicted probabilities for each category of the
dependent variable. We supply predict with names for these probabilities. Fo* example'
none could denote the probability of no distress incidents (first category of distress)- onetwo
the probability of 1 or 2 incidents (second category of distress)- and threeplus the probability
of 3 or more incidents (third and last category of distress)-.
.
quietly ologit distress date temp
• predict none onetwo threeplus
(option p assumed; predicted probabilities)
This creates three new variables:
F
280
.
Statistics with Stata
describe none onetwo threeplus
variable name
s torage
type
none
onetwo
threeplus
display
format
float
float
float
value
label
%9.0g
%9.0g
%9.0g
variable label
Pr (distress
Pr(distress
Pr(distress
0)
1)
2)
Predicted probabilities for Challenger's last flight, the 25th in these data, are unsettling:
list flight none onetwo threeplus if flight
.
25
+
I
I
25.
flight
none
cr.etwo
I STS 51-L
. 0000754
. 00:3 34 6
threep~s |
-------- I
.99959 |
Our model, based on the analysis of 23 pre-Challenger shuttle flights, predicts little chance (P
= .000075) of Challenger experiencing no booster joint damage, a scarcely ereater likelihood
of one or two incidents (P = .0003), but virtual certainty (P = .9996) of three or more damage
incidents.
See Long (1997) or Hosmer and Lemeshow (2000) for more on ordered logistic regression
and related techniques. The Base Reference Manual explains Stata’s implementation.
Multinomial Logistic Regression
When the dependent variable’s categories have no natural ordering, we resort to multinomial
logistic regression, also called polytomous logistic regression. The mlogi t command makes
this straightforward. If y has only bvo categories, mlogi t fits the same model as
logistic. Otherwise, though, an mlogit model is more complex. This section presents
an extended example interpreting mlogit results, using data (NWarctic.dta} from a suney
of high school students in Alaska’s Northwest Arctic borough (Hamilton and Seyfrit 1993).'
Contains data from C:\data\NWarctic.dta
obs:
259
vars :
size:
variable name
life
ties
kot z
3
2,590 (99.9% of me.-.cry free)
storage
type
display
format
value
label
byte
float
byte
%8.0g
%9.0g
%8.0g
migrate
kot z
NW Arctic high school students
(Hamilton & Seyfrit 1993)
20 Jul 2005 10:40
variable label
Expect to live most of life?
Social ties to community scale
Live in Kotzebue or smaller
village?
Variable life indicates where students say they expect to live most of the rest of their lives:
in the same region (Northwest Arctic), elsewhere in Alaska, or outside of Alaska:
.
tabulate life, plot
J
T
Logistic Regression
Expect to I
live most I
of life? 1
--------- +
same •
other AK |
leave AK I
Total I
281
Freq.
92 l
120- |
47 |
259
Kotzebue (population near 3.000) is the Northwest Arctic’s regional hub and largest city.
More than a third of these students live in Kotzebue. The rest live in smaller villages of 200
to 700 people. The relatively cosmopolitan Kotzebue students less often expect to stay where
they are, and lean more towards leaving the state:
tabulate
Expect to !
live most I
of life? |
life kotz,
chi2
Live in Kotzebue or
smaller village?
village
Kotzebue I
Total
same I
other AK |
leave AK I
75
80
11
17 j
40 I
36 |
92
120
47
Total 1
166
93
259
46.2992
Pr = 0.000
Pearson chi2(2)
=
mlogit can replicate this simple analysis (although its likelihood-ratio chi-squared need
not exactly equal the Pearson chi-squared found by tabulate ):
. mlogit life kotz, nolog base(l)
rrr
Multinomial logistic regression
Number of obs
LR chi2(2)
Prob > chi2
Pseudo R2
Leg likelihood = -244.64465
259
46.23
0.0000
0.0863
life
RRR
Std. Err.
z
P> i z |
[95% Conf. Interval]
kotz
2.205882
.7304664
2.39
0.017
1.152687
4.221369
|
kotz |
1 4 . 4385
6.307555
6.11
0.000
6.132946
33.99188
other AK
leave AK
I
I
(Outcome life
same is the comparison group)
base (1) specifies that category 1 ofy (life = “same”) is the base category for comparison.
The rrr option instructs mlogit to show relative risk ratios, which resemble the odds
ratios given by logistic .
Referring back to the tabulate output, we can calculate that among Kotzebue students
the odds favoring “leave Alaska” over “stay in the same area” are
/’(leave AK) //’(same) = (36/93) / (17/93)
= 2.1176471
282
Statistics with Stata
il
Among other students the odds favoring “leave Alaska” over “same area” are
II
/’(leave AK) / /’(same) =(11/166)/ (75/166)
= .1466667
Thus, the odds favoring “leave Alaska" oxer “same area" are
14.4385 times higher for Kotzebue
students than for others:
2.1176471 / .1466667 = 14.4385
mlogittlPller 3 ratl° °f tW° °ddS’ eqUa,S the reIative risk rat>o (14.4385) displayed by
■ •J2finJT.ILtheir,el^1Ve nSk rati.° f°r categ°ryy °Os and predictor.rt, equals the amount by
which predicted odds favoringy=j(compared with y = base)
.
.. ----- ) are multiplied, per 1 -unit increase
inxx.,c'’
‘
other things *bemg
equal. In other words, the relative risk ratio rrr/t is a multiplier such
that, if—
all1 a variables except a\. stay the same,
^=7 I^a)
X
_
P(y =j\xk + \)
piv = base | x,)
= base | xk +1)
ties is a continuous scale indicating the strength of students’ social ties to family and
community. We include ties as a second predictor:
.
mlogit life kotz ties,
nolog base(l)
Multinomial logistic regression
Number of obs
LR chi2(4)
Prob > chi2
Pseudo R2
Log likelihood = -221.77969
I
RRR
Std. Err.
z
P> i z i
[95% Conf
Interval]
|
|
|
2.214184
.4=12466
.7724996
.07991=4
2.25
-4 .41
0.0 0 0
1.117483
.3465911
4.337193
. 6654 4 92
|
kotz |
ties |
14.64604
.230262
7.146 = 24
. 059??5
5.60
-5.72
0.000
0.000
5.778907
.1392531
38.13955
.38075
kotz
ties
leave AK
259
91.96
0.0000
0.1717
life |
other AK
7
rrr
(Outcome life
rc -z
ABymptotiez tests here indicate that the four relative risk ratios, describing two* variables’
e ects, all differ significantly from 1.0. Ifay variablehas/categories, then mlogit models
the effects of each predictor (x) variable with J- 1 relative risk ratios or coefficients, and hence
also employs J- I ztests—evaluatingtwoormore separate null hypotheses for each predictor.
1 'elihood-ratio tests evaluate the overall effect of each predictor. First, store the results from
the rull model, here given the name full:
.
estimates
store full
Then fit a simpler model with one of the.r variables omitted, and perform a likelihood-ratio test
For example, to test the effect of ties, we repeat the regression with ties omitted:
.
quietly mlogit life kotz
estimates
store
no ties
Irtest no__ties full
1
7
Logistic Regression
likelihood-ratio test
(Assumption: no_ties nested in full)
LR chi2 (2)
Prob > chi2 =
283
45.73
0.0000
The effect of ties is clearly significant. Next, we run a similar test on the effect of kotz:
.
quietly mlogit life ties
.
estimates store no_kotz
.
Irtest no kotz full
likelihood-ratio test
(Assumption: no_kotz nested in full)
I
LR chi2 (2)
=
Prob > chi2 =
39.05
0.0000
If our data contained missing values, the three mlogit commands just shown might have
analyzed three overlapping subsets of observations. The full model would use only
observations with nonmissing life, kotz, and ties values; the <tote-only model would bring back
in any observations missing just their ties values; and the hes-only model would bring back
observations missing just kotz values. When this happens, Stata returns an error messages
saying “obsen ations differ.” In such cases, the likelihood-ratio test would be invalid. Analysts
must either screen observations with if qualifiers attached to modeling commands, such as
I
. mlogit life kotz ties, nolog base(l) rrr
. estimates store full
. quietly mlogit life kotz if ties < .
. estimates store no__ties
.
Irtest no^ties full
. quietly mlogit life ties if kotz < .
. estimates store no^kotz
.
Irtest no kotz full
or simply drop all observations having missing values before proceeding:
.
drop if life >=
.
|
kotz >=
.
|
ties >=
Dataset NSVarctic.dta has already been screened in this fashion to drop observations with
missing values.
Both kotz and ties significantly predict life. What else can we say from this output'’ To
interpret specific effects, recall that life = “same” is the base category. The relative risk ratios
tell us that:
I
Odds that a student expects migration to elsewhere in Alaska rather than staying in the
same area are 2.21 times greater (increase about 121 %) among Kotzebue students (kotz=\),
adjusting for social ties to community.
Odds that a student expects to leave Alaska rather than stay in the same area are 14.85
times greater (increase about 1385%) among Kotzebue students (kotz=\), adjusting for
social ties to community.
Odds that a student expects migration to elsewhere in Alaska rather than staying are
multiplied by .48 (decrease about 52%) with each 1-unit (since ties is standardized, its units
equal standard deviations) increase in social ties, controlling for Kotzebue/village
residence.
/
284
Statistics with Stata
Odds that a student expects to leave Alaska rather than staying are multiplied by .23
(decrease about 77%) with each 1-unit increase in social ties, controlling for
Kotzebue/village residence.
predict can calculate predicted probabilities from mlogit. The outcome (#)
option specifies for which v category we want probabilities. For example, to get predicted
probabilities that life = “leave AK” (category 3),
. quietly mlogit life kotz ties
. predict PleaveAK, outcome(3)
(cpticr. p assumed; predicted prerabi
-y)
label variable PleaveAK "P(life = 3
|
kotz ,
ties)"
Tabulating predicted probabilities for each value of the dependent variable shows how the
model fits:
table life,
contents(mean PleaveAK)
row
Expect to I
live most I
of life?
| mean(PleaveAK)
i
'■ i
same i
ether AK i
leave AK |
.0811267
.1770225
.3892264
Total
.1814672
I
A minority of these students (47/259 = 18%) expect to leave Alaska. The model averages only
a .39 probability of leaving Alaska even for those who actually chose this response — reflecting
the fact that although our predictors have significant effects, most variation in migration plans
remains unexplained.
Conditional effect plots help to visualize what a model implies regarding continuous
predictors. We can draw them using estimated coefficients (not risk ratios) to calculate
probabilities:
. mlogit life kotz ties, nolog base(l)
Multinomial logistic regression
Number of obs
LR chi2(4)
Prob > chi2
Pseudo R2
_cg likelihood = -221.77969
life
I
Coef.
Std.
z
P> I z I
[95% Conf.
259
91.96
0.0000
0.1717
Interval]
other AK
I
I
I
I
+
leave AK
I
kotz I
ties I
cons I
kotz
ties
cons
.794884
-.7334513
.206402
.3486=68
.1664104
. 1726153
2.28
-4 . 41
1 . 19
0.023
0.000
0.232
.1110784
-1.05961
-.1322902
1 .47869
-.407293
. 5450942
2.697733
-1.468537
-2.115025
.4813959
.2565991
. 3756163
5.60
-5.72
-5.63
0.000
0.000
0.000
1.754215
-1.971462
-2.851611
3.641252
-.9656124
-1.378439
(Outcome life-=same is the. comparison groupj_
7
Logistic Regression
285
The following commands calculate predicted logits, and then the probabilities needed for
conditional effect plots. L2villag represents the predicted logit of life = 2 (other Alaska) for
village students. LSkotz is the predicted logit of life = 3 (leave Alaska) for Kotzebue students,
and so forth:
. generate L2villag = .206402 +.794884*0
. generate L2kotz = .206402 +.794884*1
7334513*ties
7334513*ties
. generate L3villag = -2.115025 +2.697733*0 -1.468537*ties
. generate L3kotz = -2.115025 +2.697733*1 -1.468537*ties
Like other Stata modeling commands, mlogit saves coefficient estimates as macros.
For example, [2]_b[kotz] refers to the coefficient on kotz in the model’s second (life = 2)
equation. Therefore, we could have generated the same predicted logits as follows. L2v will
be identical to L2villag defined earlier, L3k the same as L3kotz, and so forth:
I
I
. generate L2v = [ 2] b[_cons] + [2]_b[kotz]*0 +[2]_b[ties]* ties
. generate L2k = [2] _b[_cons] +[2]_b[kotz]*1 +[2]_b[ties]*ties
. generate L3v = [3] b[_cons] + [3]_b[kotz]*0 + [3]_b[ties]* ties
. generate L3k = [3] b[_cons] + [3]_b[kotz]*1 + [3]_b[ties]* ties
From either set of logits, we next calculate the predicted probabilities:
. generate Plvillag = 1/(1 +exp(L2villag) +exp(L3villag) )
. label variable Plvillag "same area"
. generate P2villag = exp (L2villag) / (1+exp (L2villag) +exp (L3villag) )
. label variable P2villag "other Alaska"
. generate P3villag = exp (L3villag) / (1+exp (L2villag) +exp (L3villag) )
. label variable P3villag "leave Alaska"
. generate Plkotz = 1/(1 +exp(L2kotz) +exp(L3kotz))
label variable Plkotz "same area"
. generate P2kotz = exp(L2kotz)/(1 +exp(L2kotz) +exp(L3kotz))
. label variable P2kotz "other Alaska"
. generate P3kotz = exp(L3kotz)/(1 +exp(L2kotz) +exp(L3kotz))
. label variable P3kotz "leave Alaska"
286
Statistics with Stata
i
Figures 10.7 and 10.8 show conditional effect plots for village and Kotzebue students
separately.
. graph twoway mspline Plvillag ties, bands(50)
II mspline P2villag ties, bands(50)
I I mspline PSvillag ties, bands(50)
II , xlabel(-3(1)3) ylabel(0(.2) 1) yline(0 1) xline(0)
legend(order(2 3 1) position(12) ring(0)
... label(l "same area")
label (2 elsewhere Alaska") label(3 "leave Alaska") cols(l))
ytitle("Probability")
Figure 10.7
-- elsewhere Alaska
■ ••• leave Alaska
— same area
co
r
1.
o —
-3
-2
-1.
0
1
Social ties to community scale
2
3
7
Logistic Regression
287
. graph twoway mspline Plkotz ties, bands(50)
I I mspline P2kotz ties, bands(50)
I I mspline P3kotz ties, bands(50)
I I , xlabel (-3(1)3) ylabel (0(.2)1) yline(0 1) xline(0)
legend(order(3 2 1) position(12) ring(0) label (1 "same area")
label (2 "elsewhere Alaska") label (3 "leave Alaska")^
)
ytitle("Probability”)
cols (1))
Figure 10.8
.... leave Alaska
-- elsewhere Alaska
same area
i
f
-3
!
I
I
-2
-1
0
1
Social ties to community scale
2
3
The plots indicate that among village students, social ties increase the probability of staying
rather than moving elsewhere in Alaska. Relatively few village students expect to leave Alaska.
In contrast, among Kotzebue students, he.v particularly affects the probability of leaving Alaska,
rather than simply moving elsewhere in the state. Only if they feel very strong social ties do
Kotzebue students tend to favor staying put.
11
Survival and Event-Count Models
This chapter presents methods for analyzing event
Survival analysis encompasses several
related techniques that focus on times until the event of interest occurs. Although the event
could be good or bad, by convention we refer to that event as a “failure.” The time until failure
is survival time.” Survival analysis is important in biomedical research, but it can be applied
equally well to other fields from engineering to social science — for example, in modeling the
time until an unemployed person gets a job, or a single person gets married. Stata offers a full
range of survival analysis procedures, only a few of which are illustrated in this chapter.
We also look briefly at Poisson regression and its relatives. These methods focus not on
survival times but, rather, on the rates or counts of events over a specified interval of time.
Event-count methods include Poisson regression and negative binomial regression. Such
models can be fit either through specialized commands, or through the broader approach of
generalized linear modeling (GLM).
Consult the Survival Analsysis and Epidemiological Tables Reference Manual for more
m ormation about Stata’s capabilities. Type help st to see an online overview. Selvin
(1995) provides well-illustrated introductions to survival analysis and Poisson regression I
have borrowed (with permission) several of his examples. Other good introductions to survival
analysis include the Stata-oriented volume by Cleves, Gould and Gutierrez (2004), a chapter
in Rosner (1995), and comprehensive treatments by Hosmer and Lemeshow (1999) and Lee
(1992). McCullagh and Nelder (1989) describe generalized linear models. Long (1997) has
a chapter on regression models for count data (including Poisson and negative binomial), and
also has some material on generalized linear models. An extensive and current treatment of
generalized linear models is found in Hardin and Hilbe (2001).
Stata menu groups most relevant to this chapter include:
4
Statistics — Survival analysis
Graphics - Survival analysis graphs
Statistics - Count outcomes
Statistics - Generalized linear models (GLM)
Regarding epidemiological tables, not covered in this chapter, further information can be
round by typing help epi tab or exploring the menus for
Statistics - Observational/Epi. analysis.
►•
288
4
IW
I
Survival and Event-Count Models
289
Example Commands
Most of Stata’s survival-analysis (st* ) commands require that the data have previously been
identified as survival-time by issuing an stset command (see following), stset need
only be run once, and the data subsequently saved.
stset timevar, failure(failvar)
.
Identifies single-record survival-time data. Variable timevar indicates the time elapsed
before either a particular event (called a “failure”) occurred, or the period of observation
ended (“censoring”). Variable/az/vw indicates whether a failure (failvar= 1) or censoring
(failvar = 0) occurred at timevar. The dataset contains only one record per individual. The
dataset must be stset before any further st* commands will work. If we
subsequently save the dataset, however, the stset definitions are saved as well,
stset creates new variables named_^t,_d,_t, andjO that encode information necessary
for subsequent st* commands.
.
stset timevar,
failure(failvar)
id(patient) enter(time start)
Identifies multiple-record survival-time data. In this example, the variable timevar
indicates elapsed time before failure or censoringj/m/var indicates whether failure (1) or
censoring (0) occurred at this time, patient is an identification number. The same
individual might contribute more than one record to the data, but always has the same
identification number, start records the time when each individual came under observation.
stdes
Describes survival-time data, listing definitions set by stset and other characteristics
of the data.
I
I
.
stsum
Obtains summary statistics: the total time at risk, incidence rate, number of subjects, and
percentiles of survival time.
. ctset time nfail ncensor nenter, by(ethnic sex)
Identifies count-time data. In this example, the variable time is a measure of time; nfail is
the number of failures occurring at time. We also specified ncensor (number of censored
observations at time) and nenter (number entering at time), although these can be optional.
ethnic and sex are other categorical variables defining observations in these data.
I
.
cttost
Converts count-time data, previously identified by a ctset command, into survival-time
form that can be analyzed by st* commands.
sts graph
Graphs the Kaplan-Meier survivor function. To visually compare two or more survivor
functions, such as one for each value of the categorical variable sex, use the by () option,
.
sts graph, by(sex)
To adjust, through Cox regression, for the effects ofa continuous independent variable such
as age, use the adjustforf) option,
.
sts graph, by(sex)
adjustfor(age)
Note, the by() and adjustfor() options work similarly with the other sts
commands sts list, sts generate , and sts test.
I
290
.
Statistics with Stata
sts list
Lists the estimated Kaplan—Meier survivor (failure) function.
.
sts test sex
Tests the equality of the Kaplan-Meier survivor function across categories of se.v.
sts generate survfunc = S
Creates a new variable arbitrarily namedsurvfunc, containing the estimated Kaplan-Meier
survivor function.
.
stcox xl x2 x3
Fits a Cox proportional hazard model, regressing time to failure on continuous or dummv
variable predictors xl-x3.
. stcox xl x2 x3, strata(x4) basechazard(hazard) robust
Fits a Cox proportional hazard model, stratified by x4. Stores the group-specific baseline
cumulative hazard function as a new variable named hazard. (Baseline survivor function
estimates could be obtained through a basesur (survive) option.) Obtains robust
standard error estimates. See Chapter 9 or, for a more complete explanation of robust
standard errors, consult the User’s Guide.
stphplot, by(sex)
Plots -ln(-ln(survival)) versus ln(analysis time) for each level of the categorical variable
sex, from the previous stcox model. Roughly parallel curves support the Cox model
assumption that the hazard ratio does not change with time. Other checks on the Cox
assumptions are performed by the commands s tcoxkm (compares Cox predicted curves
with Kaplan-Meier observed survival curves) and stphtest (performs test based on
Schoenfeld residuals). See help stcox for syntax and options.
j
.
streg xl x2, dist(weibull)
Fits Weibull-distribution model regression of time-to-failure on continuous or dummv
variable predictors xl and x2.
. streg xl x2 x3 x4, dist(exponential) robust
xFits
Ito exponential-distribution
^Apunciiudi-uisinouiion model
model regression
regression of
ot time-to-failure
time-to-failure on continuous or dummy
predictors xl-x4. Obtains heteroskedasticity-robust standard error estimates. In addition
to Weibull and exponential, other dist() specifications for streg include lognormal,
log-logistic, Gompertz, or generalized gamma distributions. Type help streg for
more information.
'
.
stcurve, survival
After streg , plots the survival function from this model at mean values of all the v
variables.
.
stcurve, cumhaz at(x3=50, x4=0)
After streg, plots the cumulative hazard function from this model at mean values of.v/
and x2f x3 set at 50, and x4 set at 0.
. poisson count xl x2 x3, irr exposure(x4)
J
Performs Poisson regression of event-count variable count (assumed to follow a Poisson
distribution) on continuous or dummy independent variablesxl-x3. Independent-variable
effects will be reported as incidence rate ratios ( irr ). The exposure () option
identifies a variable indicating the amount of exposure, if this is not the same for all
observations.
.
Survival and Event-Count Models
291
Note: A Poisson model assumes that the event probability remains constant, regardless of
how many times an event occurs for each observation. If the probability does not remain
constant, we should consider using nbreg (negative binomial regression) or gnbreg
(generalized negative binomial regression) instead.
glm count xl x2 x3,
link(log)
family(poisson) lnoffset(x4)
eform
Performs the same regression specified in the poisson example above, but as a
generalized linear model (GLM). glm can fit Poisson, negative binomial, logit’ and many
other types of models, depending on what link() (link function) and family ()
(distribution family) options we employ..
Survival-Time Data
Survival-time data contain, at a minimum, one variable measuring how much time elapsed
before a certain event occurred to each observation. The literature often tenns this event of
interest a “failure,” regardless of its substantive meaning. When failure has not occurred to an
observation by the time data collection ends, that obsenation is said to be “censored.” The
stset command sets up a dataset for survival-time analysis by identifying which variable
measures time and (if necessary) which variable is a dummy indicating whether the observation
failed or was censored. The dataset can also contain any number of other measurement or
categorical variables, and individuals (for example, medical patients) can be represented by
more than one observation.
To illustrate the use of stset, we will begin with an example from Selvin (1995:453)
concerning 51 individuals diagnosed with HIV. The data initially reside in a raw-data file
(aids.raw) that looks like this:
1
2
1
1
37
0
34
42
(rows 4-50 omitted)
51
81
0
29
The first column values are case numbers (1,2,3,..., 51). The second column tells how many
months elapsed after the diagnosis, before that person either developed symptoms of AIDS or
the study ended (1, 17, 37,...). The third column holds a 1 if the individual developed AIDS
symptoms (failure), or a 0 if no symptoms had appeared by the end of the study (censoring).
The last column reports the individual’s age at the time of diagnosis.
We can read the raw data into memory using infile , then label the variables and data
and save in Stata format as file aidsl.dta:
• infile case time aids age using aids .raw, clear
(51 observations read)
I
I
label variable case "Case ID number"
.
label variable time "Months since HIV diagnosis"
.
label variable aids "Developed AIDS symptoms"
.
label variable age "Age in years"
292
v:
■I
II
I
I
r
J
ii
i'
Statistics with Stata
label data "AIDS
(Selvin 1995:453)"
compress
case was float now byte
time was float now byte
aids was float now byte
age was float now byte
save aidsl
file c:\data\aidsl.dt~ saved
The next step is to identify which variable measures time and which indicates failure/
censoring. Although not necessary with these single-record data, we can also note which
variable holds individual case identification numbers. In an stset command, the firstnamed variable measures time. Subsequently, we identify with failure () the dummy
representing whether an observation failed (1) or was censored (0). After using stset, we
save the data again to preserve this infonnation.
.
stset time,
fallure(aids)
id:
failure event:
obs. time interval:
exit on or before:
51
0
51
51
25
3164
id(case)
case
aids != 0 & aids <
(time[_n-l], time]
failure
Lotal obs.
exclusions
cbs. remaining, representing
subj ects
failures in single failure-per-subject data
total analysis time at risk, at risk from t =
earliest observed entry t =
last observed exit t =
. save, replace
file c:\data\aidsl.dta saved
0
0
97
stdes yields a brief description of how our survival-time data are structured. In this
simple example we have only one record per subject, so some of this information is unneeded.
3;
Survival and Event-Count Models
293
s tdes
failure
analysis time
d
= 1 5s
id
ase
Category
no.
no.
of subjects
of records
failures
--I
max
mean
51
51
1
1
1
1
0
62.03922
0
1
0
67
0
97
0
0
3164
62.03922
1
67
97
25
.4901961
0
0
1
(first) entry time
(final) exit time
subjects with gap
time on gap if gap
time at risk
per subject ------min
median
total
The stsum command obtains summary statistics. We have 25 failures out of 3,164
person-months, giving an incidence rate of 25/3164 = .0079014. The percentiles of survival
time derive from a Kaplan-Meier survivor function (next section). This function estimates
about a 25% chance of developing AIDS within 41 months after diagnosis, and 50% within 81
months. Over the observed range of the data (up to 97 months) the probability of AIDS does
not reach 75%, so there is no 75th percentile given.
stsum
failure _d:
analysis time _t:
id:
aids
time
case
I
I time at risk
incidence
rate
no. of
subjects
3164
.0079014
51
total
-- Survival time
25%
50%
41
—i
75%
81
If the data happen to include a grouping or categorical variable such as sex (0 = male, 1 =
female), we could obtain summary statistics; on survival time separately for each group by a
command of the following form:
stsum,
by(sex)
Later sections describe more formal methods for comparing survival times from two or more
groups.
I
l
Count-Time Data
Survival-time (st) datasets like aidsl .dta contain information on individual people or things,
with variables indicating the time at which failure or censoring occurred for each individual.
A different type of dataset called count-time ( ct) contains aggregate data, with variables
counting the number of individuals that failed or were censored at time t. For example,
diskdriv.dta contains hypothetical test information on 25 disk drives. All but 5 drives failed
before testing ended at 1,200 hours. -----------------
w
I
294
Statistics with Stata
Contains data from C:'.dataXdiskdr
dta
obs :
6
vars :
3
size :
48 ($9.9% cf rr.e-cry free)
variable name
storage
type
display
f ormat
int
byte
byte
*2.0g
*?.0g
* 9.0g
hours
failures
censored
value
label
Count-time data on disk drives
21 Jul 2005 09:34
variable label
Hours of continuous operation
Number cf failures observed
Number still working
Sorted by:
list
I hours
I
1. I
200
2. I
400
3. I
600
4. I
800
5. I
1000
I
6. I
1200
failures
censored
8
3
0
+
To set up a count-time dataset, we specify the time variable, the number-of-failures
variable, and the number-censored variable, in that order. After ctset , the cttost
command automatically converts our count-time data to survival-time format.
.
I
j /
ctset hours failures censored
dataset name : C:\data\diskdriv.dta
time : hours
no. fail:
failures
no. lost:
censored
no. enter:
(meaning all enter at time 0)
cttost
(data are
st;
failure event:
obs. time interval:
exit on or before:
weight:
6
0
6
25
20
19400
failures ! = C i failures < .
(0, hours]
failure
[fweight=w
total obs.
exclusions
physical obs. remaining, equal to
weighted obs., representing
failures in single record/single failure data
total analysis time at risk, at risk from t =
0
earliest observed entry t =
0
last observed exit t =
1200
Survival and Event-Count Models
295
list
1.
2.
3.
4.
5.
6.
I hours
I----------I
1200
I
200
I
400
600
I
I
800
I -I
1000
+-----------
failures
—+
w
st
d
t
0
1 •
1
1
5
2
3
4
8
1
1
1
1
1
0
1
1
1
1
1200
200
400
600
800
1
3
1
1
1000
to |
---(
0 I
0 I
0 I
0 I
0 I
---I
0 I
s tdes
failure d:
analysis time t:
weight:
failures
hours
[ fweight=w]
unweighted
total
Category
no. of subjects
no. of records
I---------unweighted
mean
6
6
max
1
1
1
1
0
700
0
200
0
700
0
1200
0
0
4200
700
200
700
1200
5
.8333333
0
1
1
(first) entry time
(final) exit time
subjects with gap
time on gap if gap
time at risk
per subject ----unweighted
min
median
failures
The cttost command defines a set of frequency weights, w, in the resulting s t-fonnat
dataset, jst*' commands automatically recognize and use these weights in any survival-time
analysis, so the data now
---- are
—viewed
------ J as containing 25 observations (25 disk drives) instead of
the previous 6 (six time periods).
-
stsum
failure time:
failure/censor:
weight:
hours
failures
[fweight=w]
i
I
time at risk
incidence
rate
no. of
subjects
total |
19400
.0010309
25
I--- Survival zime
25%
50*
600
800
75*
1000
I
Kaplan—Meier Survivor Functions
Let n, represent the number of observations that have not failed, and are not censored, at the
beginning of time period t. d, represents the number of failures that occur to these observations
unng time period t. The Kaplan-Meier estimator of surviving beyond time t is the product of
survival probabilities in t and the preceding periods:
1
<
I
296
Statistics with Stata
S(t)
n {(«
di)i«,}
[ii.i]
For example, in the AIDS data seen earlier, one of the 51 individuals developed symptoms only
one month after diagnosis. No observations were censored this early, so the probability of
“surviving” (meaning, not developing AIDS) beyond time = 1 is
S(l)= ( 51 -1) 51 =.9804
A second patient developed symptoms at time = 2, and a third at time = 9:
S(2)= .9804 x (50-1)/50
.9608
S(9)= .9608 x ( 49-1)/49= .9412
Graphing S(t) against t produces a Kaplan-Meier survivor curve, like the one seen in Figure
11.1. Stata draws such graphs automatically with the sts graph command. For example,
use aids, clear
(AIDS (Selvir.
sts graph
failure _d
analysis time _t
id
= ids
■ ime
2 = se
Figure 11.1
Kaplan-Meier survival estimate
o
X
Il :
i ,
H
to
o
I
8
o
in
CM
o
o
o
0
20
40
analysis time
60
80
100
For a second example of sun-ivor functions, we turn to data in smoking 1 .dta, adapted from
Rosner (1995). The observations are 234 former smokers, attempting to quit. Most did not
succeed. Variable days records how many days elapsed between quitting and starting up again.
The study lasted one year, and variable smoking indicates whether an individual resumed
I
7
Survival and Event-Count Models
297
smoking oeiore
before me
the eno
end or
of inis
this study {smoking=
(smoking= I1,, “failure ”) or not (smoking = 0, “censored").
MiioKing
With new data, we should begin by using stset to set the data up for survival-time analysis:
Contains data from C:\data\smokingl.dta
obs:
234
vars:
8
size:
3,744 (99.9% of memory free)
variable name
storage
type
id
days
smoking
age
sex
cigs
co
minutes
int
int
byte
byte
byte
byte
int
int
display
format
%9.0g
%9.0g
%9.0g
%9.0g
%9.0g
%9.0g
%9.0g
%9.0g
value
label
sex
Smoking (Rosner 1995:607)
21 Jul 2005 09:35
variable label
Case ID number
Days abstinent
Resumed smoking
Age in years
Sex (female)
Cigarettes per day
Carbon monoxide x 10
Minutes elapsed since last cig
Sorted by:
stset days, failure(smoking)
failure event:
obs. time interval:
exit on or before:
234
0
234
201
18946
smoking != 0 & smoking < .
(0, days]
failure
total obs.
exclusions
obs. remaining, representing
failures in single record/single failure data
total analysis time at risk, at risk from t =
earliest observed entry t =
last observed exit t =
0
0
366
The study involved 110 men and 124 women. Incidence rates for both sexes appear to be
similar:
stsum, by(sex)
failure
analysis time
d:
t:
smoking
days
I
sex
I time at risk
-----+
Male |
8813
Female |
10133
total |
18946
incidence
rate
no. of
subjects
.0105526
.0106582
110
124
4
4
15
15
68
91
.0106091
234
4
15
73
— Survival time
25%
50%
—I
75%
Figure 11.2 confirms this similarity, showing little difference between the survivor
functions of men and women. That is, both sexes returned to smoking at about the same rate.
The survival probabilities of nonsmokers decline very steeply during the first 30 days after
quitting. For either sex, there is less than a 15% chance of surviving beyond a full year.
FI
298
Statistics with Stata
sts graph,
by(sex)
failure
analysis time
d:
t:
smoking
days
Figure 11.2
Kaplan-Meier survival estimates, by sex
o J .
m
o
s-
o
s-
o
§.
o'
0
100
200
analysis time
sex = Male
<
300
sex = Female
We can also formally test for the equality of survivor functions using a log-rank test,
Unsurprisingly, this test finds no significant difference (P = .6772) between the smoking
recidivism of men and women.
sts test sex
failure
analysis time
d:
t:
V.l
smoking
days
Log rank test for equality of survivor functions
I
I
Events
observed
Events
expected
Male
|
Female |
93
108
95.88
105.12
Total
201
201.00
sex
chi2(l) =
Pr>chi2 =
J
400
0.17
0.6772
w
Survival and Event-Count Models
299
Cox Proportional Hazard Models
Regression methods allow us to take survival analysis further and examine the effects of
multiple continuous or icategorical predictors. One widely-used method known as Cox
regression employs a proportional hazard
hazard rate for fai lure at time t is defined
--- Themodel,
as
probability of failing between times t and t + Ar
h(t)
[11.2]
(Az) (probability of failing after time t)
‘
h(l)
=
or, equivalently,
InfT/fy]
“f,he
<*.) a. dme.„d
^oWexp(p1.v1 +p2x 2 + . •. + P,x,)
effee.s of
[11.3a]
Inf^oW] + Pi-^i + P2x2 -r
+ ...
... +
+p
P x.xx.
[11.3b]
Baseline hazard” means the hazard for an observation with all ,r
variables equal to 0. Cox
regrasion estimates this hazard nonparametrically and obtains maximum-likelihood estimates
of the P parameters m [11.3], Stata’s stcox procedure ordinarily reports hazard “
hazard rate681™3168 °f eXp(P)’ TheSe indicate PWort.onal changes relative to the baseline
I
Does age affect the onset of AIDS symptoms? Dataset aids.dta contains information that
helps answer this questton. Note that with stcox , unlike most other Stata model-fitting
commantk we list only theindependentvariab1^). The survival-analysis dependent variables^
timevanables, and censoring variables are understood automatically with s tset data.
’
.
use aids
(AIDS (Selvin 1995:453))
I
stcox age,
I
failure _d:
analysis time
id:
nolog
aids
time
case
Cox regression -- Breslow method for ties
No. of subjects =
No. of failures =
Time at risk
Log likelihood
I
I
51
25
3164
LR ch 12(1i
Prob > chi2
-86.576295
t I Ha z. Ratio
age |
Number of obs
1.084557
51
5.00
0.0254
Std. Err.
z
P> I Z |
[95% Conf
Interval]
. 0378623
2.33
0.020
1.01283
1.161363
IP
I
I
300
Statistics with Stata
is 1.084557). This ratio differs significantly (P = .020) from 1. If we wanted to state our
findings for a five-year difference in age, we could raise the hazard ratio to the fifth power:
display exp(_b[age] ) A5
1.5005865
Thus, the hazard of AIDS onset is about 50% higher when the second person is five years older
than the first. Alternatively, we could learn the same thing (and obtain the new confidence
interval) by repeating the regression after creating a new version of age measured in five-year
units. The nolog noshow options below suppress displayofthe iteration log and the stdataset description.
. generate age5 = age/5
.
label variable age5 "age in 5-year units"
.
stcox age5, nolog noshow
Cox regression
Breslow method for ties
No. of subjects =
No . of failures =
Time at risk
51
25
3164
Log likelihood
s'
[I
r
r
LR chi2(1)
Prob > chi2
-E6.576295
5.90
0.0254
t I Haz. Ratio
Std. Err.
z
P> I z |
[95% Conf. Intervalj
1.500587
.2619305
2.33
0.020
1.065815
age5 I
I
Number of obs
2.112711
Like ordinary regression, Cox models can have more than one independent variable.
Dataset heart.dta contains survival-time data from Selvin (1995) on 35 patients with very high
cholesterol levels. Variable time gives the number of days each patient was under observation.
coronary indicates whether a coronary event occurred during this time (coronary = 1) or not
(coronary = 0). The data also include cholesterol levels and other factors thought to affect heart
disease. File heart.dta was previously set up for survival-time analysis by an st set time,
failure (coronary) command, so we can go directly to st analysis.
describe patient - ab
variable name
patient
time
coronary
weight
sbp
chol
cigs
ab
storage
type
display
format
byte
int
byte
int
int
int
byte
byte
%9. Zz
%9
%9
%9
%9
%9 7
%9 7
%9.2g
value
label
variable label
Patient ID number
Time in days
Coronary event (1) or r. o n e (0)
Weight in pounds
Systolic blood pressure
Cholesterol level
Cigarettes smoked per day
Type A (1) or B (0) personality
Survival and Event-Count Models
301
s tdes
d:
t:
failure
analysis time
coronary
time
Category
no .
no.
mean
35
35
1
1
1
0
2580.. 629
0
773
0
2875
0
0
0
90322
2580.629
773
2875
3141
8
. 2285714
0
0
of subjects
of records
(first) entry time
(final) exit time
subjects with gap
time on gap if gap
time at risk
I
per subject ---min
median
total
failures
max
Cox regression finds that cholesterol level and cigarettes both significantly increase the
hazard of a coronary event. Counterintuitively, weight appears to decrease the hazard. Systolic
blood pressure and A/B personality do not have significant net effects,
stcox
weight sbp chol cigs ab,
Cox regression
no ties
No . of subjects =
No . of failures =
Time at risk
Log likelihood
t
I
|
|
|
I
I
35
8
90322
Number of obs
Ratio
3rd.
.9349336
1.012947
1.032142
1.203335
3.04969
35
LR chi2(5)
Prob > chi2
-17.263231
Haz .
weight
sbp
chol
cigs
ab
noshow nolog
p
'9
. 0 3 0 5184
. 03 38061
. 1071031
2.08
1.14
n
13 . 97
0.0155
.?"6?919
. 943808’
1.0“5067
1.01 070'’
.44“6492
n-jo
.99670
1.432676
20.77655
After estimating the model, s tcox can also generate new variables holding the estimated
baseline cumulative hazard and survivor functions. Since "baseline” refers to a situation with
all a- variables equal to zero, however, we first need to recenter some variables so that 0 values
make sense. A patient who weighs 0 pounds, or has 0 blood pressure, does not provide a useful
comparison. Guided by the minimum values actually in our data, we might shift weight so that
0 indicates 120 pounds, sbp so that 0 indicates 100, and chol so that 0 indicates 340:
.
summarize patient -
ab
Variable
I
Obs
Mean
Std. Dev.
Min
Max
patient
time
coronary
weight
sbp
I
|
|
|
|
35
35
35
35
35
18
2580.629
. 2285714
170.0857
129.7143
10.24695
616.0796
.426043
23.55516
14.28403
1
773
0
120
104
35
3141
1
225
154
--------------- +
302
Statistics with Stata
-
I i;
I
II
chol |
cigs |
ab |
369.2857
17.14286
.5142857
35
35
35
I
343
0
0
645
40
1
. replace weight = weight - 120
(35 real changes made)
. replace sbp = sbp (35 real changes made)
100
. replace chol = chol
(35 real changes made)
i;
51.32284
13.07702
.5070926
.
summarize patient -
340
ab
Variable |
--------- +
patient I
time |
coronary |
weight |
sbp |
Obs
Mean
Std. Dev.
Min
Max
35
35
35
35
35
18
2580.629
.2285714
50.08571
29.71429
10.24695
616.0796
.426043
23.55516
1 4 . 28403
1
773
0
0
4
35
3141
1
105
54
chol |
cigs |
ab |
35
35
35
29.28571
17.14286
.5142857
51.32284
13.C7702
.5070926
3
0
0
305
40
1
Zero values for all the x variables now make more substantive sense, To create new
variables holding the baseline survivor and cumulative hazard function estimates, we repeat the
regression with basesurv () and basechaz () options:
stcox weight sbp chol cigs ab,
basechaz(hazard)
Cox regression
noshow nolog basesurv(survivor)
no ties
No. of subjects =
No. of failures =
Time at risk
=
35
8
90322
’-.'•jr.ber
IP ch 12(5)
Log likelihood
t
I
|
weight I
sbp I
chol I
cigs I
ab I
-17.263231
Ratio
Std. Err.
.9349336
1.012947
1.032142
1.203335
3.04969
.0305184
.0338061
.0139984
.1071031
2.985616
Haz.
-2.06
0.39
2.33
2.0 5
1 . 14
P> ! Z ,
[95= Co
0.039
0.700
0.020
0.038
0.255
. 0 / O95X 3
. 33 O '
. 9488087
1.005067
1.010707
.4476492
1.081421
1.059947
1.432676
20.7^655
*■» /• c
t
ter-.-= 1
z*
-'V <
Note that recentering three x variables had no effect on the hazard ratios, standard errors,
and so forth. The command created two new variables, arbitrarily named survivor and hazard.
To graph the baseline survivor function, we plot sun ivor against time and connect data points
with in a stairstep fashion, as seen in Figure 11.3.
7
Survival and Event-Count Models
303
graph twoway line survivor time, connect(stairstep)
sort
Figure 11.3
1------- i
I
CD
CD
o
>
f
O)
<D
CD
500
I
4 .
1000
1500
2000
Time in days
2500
3000
“rt” he
OA6 survivor funct,on — which depicts survival probabilities for patients bavins
0 weight (120 pounds), “0” blood pressure (100), “0" cholesterol (340), 0 cigarettes per day
and a type B personality — declines with time. Although this decline looks precipitous at the
Xes^f th* nred r PrOba^,lty 'T2"7 °nly falls frOm 1 t0 about
Given less favorable
s of the predictor variables, the survival probabilities would fall much faster.
The same baseline sun ivor-function graph could have been obtained another way, without
The alternative, shown mP.gure 11.4, employs an sts graph command with
aajustfor () option listing the predictor variables:
7?
304
.
Statistics with Stata
sts graph,
adjustfor(weight sbp chol cigs ab)
failure
analysis time
d:
t:
coronary
time
Survivor function
adjusted for weight sbp chol cigs ab
o
o
Figure 11.4
1
in
d
o
in
d
m
oi
d
o
o
6
0
1000
analysis time
2000
3000
Figure 11.4, unlike Figure 11.3, follows the usual survivor-function convention of scaling
the vertical axis from 0 to 1. Apart from this difference in scaling. Figures 11.3 and 11,4 depict
the same curve.
Figure 11.5 graphs the estimated baseline cumulative hazard against time, using the variable
{hazard) generated by our stcox command. This graph shows the baseline cumulative
hazard increasing in 8 steps (because 8 patients “failed** or had coronary events), from near 0
to .033.
f
r
Survival and Event-Count Models
305
• graph twoway connected hazard time, connect(stairstep) sort
msymbol(Oh)
<j
Figure 11.5
E
ro
N
nj
XZ oj
(D O
I
cn
ra
>
EP
g
5^
o
500
1000
1500
J
p
2000
Time in days
2500
3000
Exponential and Weibull Regression
Cox regression est.mates the baseline survivor function empirically without reference to any
theoretical distribution. Several alternative “parametric” approaches begin instead from
assumptions that survival times do follow a known theoretical distribution Possible
distribution famihes include the exponential, Weibull, lognormal, log-logistic, Gompertz or
generalized gamma. Models based on any of these can be fit through the streg command.
Such models have the same general form as Cox regression (equations [11.2] and fl 1.3]) but
efine the baseline hazard h 0 (/) differently. Two examples appear in this section.
If failures occur randomly, with a constant hazard, then survival times follow an
exponential distribution and could be analyzed by exponential regression. Constant hazard
means that the individuals studied do not “age,” in the sense that they are no more or less likely
to tail late in the period of observation than they were at its start. Over the lone term, this
^sumption seems unjustified formachines or livingorganisms, but it might approximately hold
if the period observation covers a relatively small fraction oftheir life spans. An exponential
model implies that logarithms of the survivor function, ln(5(z)), are linearly related to t.
uz
u C.°nd K°mrnOn Parametric approach, Weibull regression, is based on the more general
Weibull distribution. This does not require failure rates to remain constant, but allows them
fineT/functb oftoW Sm°Othly
time' The We'bu11 model implies that ln(-ln(S«)) a
Graphs provide a useful diagnostic for the appropriateness of exponential or Weibull
models. For example, returning to aids.dta, we construct a graph (Figure 11.6) of ln(S(/))
versus time, after first generating Kaplan-Meier estimates of the survivor function 5(r). The
l
306
Statistics with Stata
v-axis labels in Figure 11.6 are given a fixed two-digit, one-decimal display format (%2.1 f) and
oriented horizontally, to improve their readability.
use aids, clear
<AILS (Selvin 1995:453))
Sts gen S = S
generate logS = ln(S)
.
I
I
. graph twoway scatter logS time,
ylabel(-.8(.1)0, format(%2.If)
angle(horizontal) )
Figure 11.6
-0.0
-0.1
-0.2
-0.3
co
O)
-0.4
-0.5
-0.6
-0.7
-0.8
I
0
20
40
60
Months since HIV diagnosis
80
100
The pattern in Figure 11.6 appears somewhat linear, encouraging us to try an exponential
regression:
streg age, dist(exponential) nolog noshow
Expc ner.
recressicn
i =
No. of subjects =
No. of failures =
Time at risk
Log likelihooc
t
i
51
25
3164
-ember of obs
1= chi2(l)
?rob > chi2
-59.996976
I Haz. Ratio
age |
log relative-hazard form
1.074414
51
4.34
0.0372
Std. Err.
z
P> z
[95% Conf.
Interval]
. 0349626
2.21
0.027
1.008028
1.145172
The hazard ratio (1.074) and standard error (.035) estimated by this exponential regression
do not greatly differ from their counterparts (1.085 and .03 8) in our earlier Cox regression. The
similarity reflects the degree of correspondence between empirical and exponential hazard
Survival and Event-Count Models
307
functions. According to this exponential model, the hazard of an HIV-positive individual
developing AIDS increases about 7.4% with each year of age.
After streg,the stcurve commanddrawsagraphofthemodels ’ cumulative hazard,
survival, or hazard functions. By default, stcurve draws these craves holding all x
variables in the model at their means. We can specify other x values by using the at ()
option. The individuals in aids.dta ranged from 26 to 50 years old. We could graph the
survival function at age = 26 by issuing a command such as
stcurve, surviv at(age=26)
.
A more informative graph uses the atl () and at2 () options to show the survival curve at
two different sets of x values, such as the low and high extremes of age:
. stcurve, survival atl(age=26) at2(age=50) connect(direct direct)
Figure 11.7
Exponential regression
I
w
0
20
40
60
analysis time
age=26
80
100
age=50
Figure 11.7 shows the predicted survival curve (for transition from HIV diagnosis to AIDS)
falling more steeply among older patients. The significant age hazard ratio greater than 1 in
our exponential regression table implied the same thing, but using stcurve with atl ()
.....
and' at2 () values
gives a strong visual interpretation of this effect. These options work in
similar manner with all three types of stcurve graphs:
s tcurve,
s tcurve, hazard
Survival function.
Hazard function.
stcurve,
Cumulative hazard function.
survival
cumhaz
Instead of the exponential distribution, streg can also fit survival models based on the
Weibull distribution. A Weibull distribution might appear curvilinear in a plot of ln(5(/))
versus t, but it should be linear in a plot of ln(-ln(S(/))) versus ln(t), such as Figure 11.8. An
exponential distribution, on the other hand, will appear linear in both plots and have a slope
<______
!
308
Statistics with Stata
equal to 1 in the ln(-ln(5(/))) versus ln(r) plot. In fact, the data points in Figure 11.8 are not
tar from a line with slope I, suggesting that our previous exponential model is adequate.
.
generate loglogs = ln(-ln(S))
.
generate logtime = In(time)
.
graph twoway scatter loglogS logtime, ylabel(,angle(horizontal))
Figure 11.8
0
••
-1
W
O)
■§> -2
p
-3
-4
0
1
2
3
4
logtime
5
I
Although we do not need the additional complexity of a Weibull model with these data,
results are given below for illustration.
streg age, dist(weibull)
noshow nolog
Weibull regression — log relative-hazard form
No. of subjects =
No. of failures =
Time at risk
Log likelihood
51
25
3164
Number of obs
LR chi2(l)
Prcb > chi2
-59.778257
t I Ha z. Ratio
51
4.63
0.0306
Std. Err.
z
P> I z I
[95% Conf. Interval;
|
1 . 079477
.0363529
2.27
0.023
1.010531
1.15312“
/ln_p |
----- +
P I
1/p I
. 1232638
. 1820853
0.68
0.498
-.2336179
.4801454
1.131183
.8840305
.2059723
.1609694
.7916643
.6186934
1.616309
1.263162
age
The Weibull regression obtains a hazard ratio estimate (1.079) intermediate between our
previous Cox and exponential results. The most noticeable difference from those earlier models
is the presence of three new lines at the bottom of the table. These refer to the Weibull
distribution shape parameter/?. Ap value of 1 corresponds-to an exponential model: the hazard
J
Survival and Event-Count Models
309
does not change with time, p > 1 indicates that the hazard increases with time; p < 1 indicates
at the hazard decreases. A 95% confidence interval for/? ranges from .79 to 1 62 so we have
no reason to reject an exponential (p = 1) model here. Different, but mathematically equivalent
parametenzations of the Weibull model focus on ln(p),p, or l/p, so Stata provides all three’
stcurve draws survival,- hazard, or cumulative hazard functions after streq
dxst (weibull) just as it does after streg, dist (exponential) or other streq
models.
*
E*P0"f.ntial Or Weibu11 regress>on is preferable to Cox regression when survival times
actually follow an exponential or Weibull distribution. When they do not, these models are
misspecified and can yield misleading results. Cox regression, which makes no a priori
assumptions about distribution shape, remains useful in a wider variety of situations.
In addition to exponential and Weibull models, streg can fit models based on the
Gompertz, lognormal, log-logistic, orgeneralizedgamma distributions. Type help streq
riisTo'f curelnT'options
andEpidemioloSical Tables Reference Manual, for syntax and
I
I
Poisson Regression
rj
I
I
I
I
I
I
=
count of events
number of times event could have occurred
t11 -4]
The denominator in [11.4] is termed the “exposure” and is often measured in units such as
person-y^rs. We model the logarithm of incidence rate as a linear function of one or more
predictor (x) variables:
ln(r,) = Po + P^+P^ + .-.+ppr,
Equivalently, the model describes logs of expected event counts:
ln(expectedcount)
^exposure) + Po + P.x, +P2x2 + ... ptxt
[H.5a]
[11.5b]
Assuming that a Poisson process underlies the events of interest, Poisson regression finds
maximum-likelihood estimates of the P parameters.
Data on radiation exposure and cancer deaths among workers at Oak Ridge National
aboratory provide an example. The 56 observations in dataset oakridge. dta represent 56
age/radiation-exposure categories (7 categories of age' x 8 categories of radiation). For each
combination, we know the number of deaths and the number of person-years of exposure.
Contains data from C:\data\oakridge.dta
obs:
56
vars:
4
size:
616 (99.9% of memory free)
variable name
age
rad
storage
type
byte
byte
display
format
value
label
%9.0g
.%S..0g
ageg
Radiation (Selvin 1995:474)
21 Jul 2005 09:34
variable label
Age group
-Radiation exposure level
310
Statistics with Stata
deaths
pyears
byte
float
%9.0g
%9.0g
Number of deaths
Person-years
Sorted by:
summarize
.
|
Obs
Mean
Std. Dev.
Min
Max
age
rad
deaths
pyears
I
I
I
I
56
56
56
56
4
4.5
1.839286
3807.679
2.0181
2.312024
3.178203
10455.91 ’
1
1
0
23
7
8
16
71382
list in 1/6
1.
2.
3.
4.
5.
6.
I
Variable
age
I
I
< 45
I
I 45-49
I 50-54
I 55-59
I 60-64
I
I 65-69
rad
deaths
1
1
1
1
1
0
1
4
3
3
1
1
------ +
pyears I
------ I
29901 |
6251 |
5251 |
4126 |
2778 |
------ I
1607 |
Does the death rate increase with exposure to radiation? Poisson regression finds a
statistically significant effect:
poisson deaths rad,
nolog exposure(pyears)
Poisson regression
Log likelihood =
irr
Number of obs
LR chi2(1)
Prob > chi2
Pseudo R2
-169.7364
I
56
14.87
0.0001
0.0420
I
IRR
Std. Err.
z
P> I z I
[95% Conf. Interval]
rad |
pyears |
1.236469
(exposure)
.0603551
4.35
0.000
1.123657
deaths
1.360606
For the regression above, we specified the event count (deaths) as the dependent variable
and radiation (rad) as the independent variable. The Poisson “exposure” variable is pyears, or
person-years in each category cfirad. The irr option calls for incidence rate ratios rather
than regression coefficients in the results table — that is, we get estimates of exp(p) instead of
P, the default. According to this incidence rate ratio, the death rate becomes 1.236 times higher
(increases by 23.6%) with each increase in radiation category. Although that ratio is
statistically significant, the fit is not impressive; the pseudo A2 (see equation [10.4]) is only
To perform a goodness-of-fit test, comparing the Poisson model’s predictions with the
observed counts, use the follow-up command poisgof :
■r
Survival and Event-Count Models
■
311
poisgof
Goodness-of-fit chi2
Prob > chi2 (54)
254.5475
0.0000
I
These goodness-of-fit test results (X2 = 254.5,P< .00005) indicate that our model’s predictions
are significantly different from the actual counts - another sign that the model fits poorly,
to 5^6°^ h",bCttCr reSuItS ^en we include aSe as a second predictor. Pseudo R2 then rises
. 966, and the goodness-of-fit test no longer leads us to reject our model.
■
poisson deaths rad age,
nolog exposure(pyears)
Poisson regression
Log likelihood =
f
I
.
Number of obs
LR chi2(2)
Prob > chi2
Pseudo R2
-71.4653
|
IRR
rad |
age |
pyears |
1.176673
deaths
1.960034
(exposure)
irr
56
211 .41
O.OOC-C
0.5966
Std. Err.
z
P> I z |
'95% Conf.
Interva
.0593446
.0997536
3.23
13.22
0.001
0.000
1.065924
1.773955
1.298929
2.165631
poisgof
Goodness-of-fit chi2
Prob > chi2 (53)
58.00534
0.2960
For simplicity, to this point we have treated rad and age as if both were continuous
variables, and we expect their effects on the log death rate to be linear In fact however both
independent variables are measured as ordered categories, rad = 1, for example means 0
radiation exposure; rad =2 means 0 to 19 milliseiverts; rad =3 means 20 to 39 mHiiSZs
and so forth. An alternative way to include radiation exposure categories in the regression.’
while watching for nonlinear effects,z iis as a set of dummy variables. Below we use the gen ()
option of tabulate to create 8 dummy variables, rl to r8, representing each of the 8 values
of rad.
.
tabulate rad,
gen(r)
Radiation |
exposure |
level |
--------- -
Freq.
Percent
Cum.
I
I
I
I
I
I
I
I
7
7
7
7
7
7
7
7
12.50
12.50
12.50
12.50
12.50
12.50
12.50
12.50
12.50
25.00
37.50
Total |
56
100.00
1
2
3
4
5
6
7
8
•
___
describe
50.00
62.50
75.00
87.50
100.00
312
Statistics with Stata
Contains data from C: data\oakridge.dta
obs:
56
vars:
12
size:
1,064 (99.9% of memory free)
variable name
w1
i
storage
type
age
rad
deaths
pyears
rl
r2
r3
r4
r5
r6
r7
r8
byte
byte
byte
float
byte
byte
byte
byte
byte
byte
byte
byte
display
format
value
label
%9.0g
%9.0g
%9.0g
%9.0g
%8.0g
%8.0g
%8.0g
%8.0g
%8.0g
%8.0g
%8.0g
%8.0g
ageg
Radiation (Selvin 1995:474)
21 Jul 2005 09:34
variable label
Age group
Radiation exposure level
Number of deaths
Person- years
xad==
1.0000
rad==
2.0000
rad==
3.0000
rad==
4.0000
rad==
5.0000
rad==
6.0000
rad==
7.0000
rad==
8.0000
Sorted by:
We now include seven of these dummies (omitting one to avoid multicollinearity) as
regression predictors. The additional complexity of this dummy-variable model brings little
improvement in fit. It does, however, add to our interpretation. The overall effect of radiation
on death rate appears to come primarily from the two highest radiation levels (r7 and r8,
corresponding to 100 to 119 and 120 or more milliseiverts). At these levels, the incidence rates
are about four times higher.
IP
. poisson deaths r2-r8 age, nolog exposure(pyears)
Poisson regression
Number of obs
LR chi2 (8)
Prob > chi2
Pseudo R2
Log likelihood = -69.451814
deaths
|
------ +
r2 I
r3 I
r4 I
r5 I
r6 I
r7 I
r8 I
age I
pyears !
irr
IRR
Std. Err.
z
P> I z I
(95* Conf.
1.473591
1.630688
2.375967
. 7278113
1 . 16 = 477
4.433729
3.89188
1.961907
(exposure)
.426898
. 6659257
1.088835
.7518255
1.20691
3.337738
1.640978
.1000652
1.34
1 . 20
1.89
-0.31
0.15
1. 98
3.22
13.21
0.181
0.231
0.059
0.758
0.880
0.048
0.001
0.000
.8351884
.732 4 2 8. 9677429
.0961018
.1543195
1.013863
1.703168
1.775267
56
215.44
0.0000
0.6
2.5999’5
3.63 0 5 6"
5.
5.51195"
8.847472
19.38915
8.893267
2.168169
Radiation levels 7 and 8 seem to have similar effects, so we might simplify the model by
combining them. First, we test whether their coefficients are significantly different. They are
not:
test r7
( 1)
r8
[deaths]r7
[deaths]r8 = 0.0
chi2(
1) =
Prob > chi2 =
0.03
0.8676
Survival and Event-Count Models
313
Next, generate a new dummy variable r78, which equals 1 if either r7 or r8 equals 1:
. generate r!8 = (r7 |
r8)
Finally, substitute the new predictor for r7 and r8 in the regression:
. poisson deaths r2-r6 r78 age,
Poisson reg
ex(pyears)
on
nolog
Number of obs
LR chi2 (7)
Prob > ch 12
Pseudo R2
Log likelihood = -69.465332
56
215.41
0.0000
0.6079
deaths
IRR
Std. Err.
z
P> I z |
[95% Conf.
erval]
r2
r3
r4
r5
r6
r78
age
pyears
1.473602
1.630718
2.376065
.7278387
1.168507
3.980326
1.961722
(exposure)
.4269013
6659381
1 . 08888
"518538
.226942
i .580024
.100043
1.34
1.20
1 . 89
-0. 31
0.15
3 . 48
13.21
0.181
0.231
0.059
0.758
0.880
0.001
0.000
. 8351949
. 7 324 4 1 5
. 9677823
. 0961055
.1543236
1 . 828214
1.775122
2.599996
3.630655
5.=33629
5.512165
= . 847704
8.665833
2.167937
We could proceed to simplify the model further in this fashion. At each step, test helps
to evaluate whether combining two dummy variables is justifiable.
Generalized Linear Models
Generalized linear models (GLM) have the form
g[E0)] = Po + pi.r1 + p,A-:-
P
y~.F
[ll.6]
where g[ ] is the link function and F the distribution family, This general formulation
encompasses many specific models. For example, ifg[ ] is the identity function and v follows
a normal (Gaussian) distribution, we have a linear regression model:
E(.v) ~ Po
Pi-Vi ~ P:
~ Pt vt,
y~ Normal
[11-7]
If fit ] is the logit function and y follows a Bernoulli distribution, we have logit regression
instead:
Iogit[E(v)] = P0 + pI.vl +p:.v.
••
v~ Bernoulli
[H.8]
Because of its broad applications. GLM could have been introduced at several different
points in this book. Its relevance to this chapter comes from the ability to fit event models.
Poisson regression, for example, requires thatg[ ] is the natural log function and that v follows
a Poisson distribution:
ln[E(y)J = po + p,*, + p2x, + . . . + p kxk7
Poisson
[11.9]
As might be expected with such a flexible method, Stata’s glm command permits many
different options. Users can specify not only the distribution family and link function, but also
details of the variance estimation, fitting procedure, output, and offset. These options make
glm a useful alternative even when applied to models for which a dedicated command (such
as regress,, logistic , or poisson ^already exists.
y
314
Statistics with Stata
Hi!
B
I
We might represent a “generic” glm command as follows:
T
. glm y xl x2 x3, family(fanzlyname) link(J inkname)
Inoffset(exposure) eform jknife
I
I11
IH1 '
?-!l
where family () specifies the v distribution family, link() the link function, and
Inoffset () an “exposure" variable such as that needed for Poisson regression. The eform
option asks for regression coefficients in exponentiated form, exp(P) rather than p. Standard
errors are estimated through jackknife ( jknife ) calculations.
Possible distribution families are
family(gaussian)
family(igaussian)
family(binomial)
I
family(poisson)
family(nbinomial)
family(gamma)
Gaussian or normal (default)
Inverse Gaussian
Bernoulli binomial
Poisson
Negative binomial
Gamma
We can also specify a number or variable indicating the binomial denominator N (number of
trials), or a number indicating the negative binomial variance and deviance functions, by
declaring them in the family () option:
*■
’
I
I
family(binomial #)
family(binomial varname)
family(nbinomial #)
Possible link functions are
5
g
link(logit)
Identity (default)
Log
Logit
link(probit)
Probit
link(cloglog)
Complementary log-log
link(opower #)
Odds power
Power
link(identity)
I
I:
p
I>
ji -■ $
j
T
I
• .
link(log)
link(power #)
link (loglog)
Negative binomial
Log-log
link (logo)
Log-complement
link(nbinomial)
Coefficient variances or standard errors can be estimated in a variety of ways. A partial list
of glm variance-estimating options is given below:
opg
oim
robust
■ I
t'
■
unbiased
Berndt, Hall, Hall, and Hausman “B-H-cubed" variance
estimator.
Observed information matrix variance estimator.
Huber/White/sandwich estimator of variance.
Unbiased sandwich estimator of variance
Survival and Event-Count Models
315
nwes t
!
Heteroskedasticity and autocorrelation-consistent variance
estimator.
jknife
Jackknife estimate of variance.
jknifel
One-step jackknife estimate of variance.
bstrap
Bootstrap estimate of variance. The default is 199 repetitions;
specifysome other number by adding the bsrep(#) option.
For a full list of options with some 1technical details, look up glm in the Base Reference
Manual. A more in-depth treatment ofGLM topics can be found in Hardin and Hilbe^OOl)*
Chapter 6 began with the simple regression of mean composite SAT scores (csat) on perpupil expenditures (expense) of the 50 U.S. states and District of Columbia (states.dta):
.
regress csat expense
We could fit the same model and obtain exactly the same
estimates with the following
command:
.
I
glm csat expense,
Iteration 0:
link (identity)
family(gaussian)
log likelihood = -279.99869
Generalized linear models
Optimization
: ML: Newton-Raphson
Deviance
Pearson
I
i
No. of obs
=
Residual df
=
Scale param
=
(1/df) Deviance =
(1/df) Pearson =
175306.2097
175306.2097
Variance function: V(u) = 1
Link function
: g(U) = u
Standard errors
: OIM
[Gaussian]
[Identity]
Log likelihood
BIC
AIC
csat
expense I
_cons I
= -279.9986936
=
175298.346
Coef.
Std. Err.
-.0222756
1060.732
.0060371
32.7009
2
-3.69
32.44
P> I z |
0.000
0.000
51
49
3577.678
3577.678
3577.678
11.05877
[95% Conf. Interval]
-.0341082
996.6399
-.0104431
1124.825
Because link(identity) and family(gaussian) are default options, we could
actually have left them out of the previous glm command.
_ The glm command can do more than just duplicate our regress results, however.
For example,
. , we could fit the same OLS model but obtain bootstrap standard errors:
i
■
I
A
-
316
.
Statistics with Stata
glm csat expense,
Iteration 0:
family(gaussian) bstrap
link(identity)
log likelihood = -279.99869
Bootstrap iterations (199)
---+-- :------ 2---
3
4
5
50
100
150
Generalized linear models
No. of obs
=
Residual df
Scale param
=
(1/df) Deviance =
(1/df) Pearson
: ML: Newton-Raphson
Optimization
Deviance
Pearson
175306.2097
175306.2097
Variance function: V(u) = 1
Link function
: g(u) = u
Standard errors
: Bootstrap
[Gaussian]
[Identity]
Log likelihood
BIC
AIC
= -279.9986936
=
175298.346
I
csat |
Coef .
Bootstrap
Std. Err.
-.0222756
1060.732
. 0039284
25.36566
P> I z I
— —------- — — 4.
expense |
cons ,
-5.67
41.82
0.000
0.000
51
49
4124.656
3577.678
3577.678
11.05877
[95% Conf. Interval]
-.0299751
1011.017
-.0145762
1110.448
The bootstrap standard errors reflect observed variation among coefficients estimated from 199
samples of n = 51 cases each, drawn by random sampling with replacement from the original
/? = 51 dataset. In this example, the bootstrap standard errors are less than the corresponding
theoretical standard errors, and the resulting confidence intervals are narrower.
Similarly, we could USC 'glm to repeat the first logistic regression of Chapter 10.
In the following example, we ask for jackknife standard errors and odds ratio or exponentialform ( eform) coefficients:
.1.
Survival and Event-Count Models
glm any date,
I
Iteration 0:
Iteration 1:
Iteration 2:
link(logit) family(bernoulli)
317
eform jknife
log likelihood = -12.995268
log likelihood = -12.991098
log likelihood = -12.991096
Jackknife iterations (23)
---- +___
j
2
3
4
5
Generalized linear models
Optimization
: ML: Newton-Raphson
Deviance
Pearson
I
I
I
I
I
I
No. of obs
Residual df
=
Scale param
(1/df) Deviance =
(1/df) Pearson
25.98219269
22.8885488
Variance function: V (u) = u*(1-u)
Link function
: g (u) = In (u/ (1-u))
Standard errors
: Jackknife
[Bernoulli]
[Logit]
Log likelihood
BIC
AIC
= -12.99109634
= 19.71120426
23
21
1
1.23~247
1.089931
1.303574
I
any | Odds Ratio
Jackknife
Std. Err.
z
P> I z |
[95% Conf. Interval]
date |
. 0015486
1.35
0.176
. 9990623
1.002093
1.005133
The final poisson regression
'"ion of the present chapter corresponds to this glm
. glm deaths r2-r6 r78 ra9e> link(log)
Inoffset(pyears) eform
model:
family(poisson)
though glm canreplicatethemodelsfitbymanyspecializedcommands.andaddssome
new capabilities, the specialized commands have their own advantages including speed and
customized options. A particular attraction of glm is its ability to fit models for which Stata
has no specialized command.
I
I
IfO- ?
■■■■
■
■
Principal Components, Factor,
and Cluster Analysis
If
Principal components and factor analysis provide methods for simplification, combining many
correlated variables into a smaller number of underlying dimensions. Along the way to
achieving simpl i fication, the analyst must choose from a daunting variety of options. If the data
really do reflect distinct underlying dimensions, different options might nonetheless converge
on similar results. In the absence of distinct underlying dimensions, however, different options
often lead to divergent results. Experimenting with these options can tell us how stable a
particular finding is, or how much it depends on arbitrary choices about the specific analytical
technique.
Stata accomplishes principal components and factor analysis with five basic commands:
pea
Principal components analysis.
factor
Extracts factors of several different types.
greigen
Constructs a scree graph (plot of the eigenvalues) from the recent pea or
factor.
rotate
Performs orthogonal (uncorrelated factors) or oblique (correlated factors)
rotation, after factor.
score
Generates factor scores (composite variables) after pea , factor , or
rotate.
The composite variables generated by score can subsequently be saved, listed, graphed, or
analyzed like any other Stata variable.
Users who create composite variables by the older method of adding other variables
together without doing factor analysis could assess their results by calculating an a reliability
coefficient:
alpha
Cronbach’s a reliability
Instead of combining variables, cluster analysis combines observations by finding non
overlapping, empirically-based typologies or groups. Cluster analysis methods are even more
diverse, and less theoretical, than those of factor analysis. Stata’s cluster command
provides tools for performing cluster analysis, graphing the results, and forming new variables
to identify the resulting groups.
X.
318
Principal Components, Factor, and Cluster Analysis
319
Methods described in this chapter can be accessed through the following menus:
Statistics - Other multivariate analysis
Graphics - More statistical graphs
Statistics - Cluster analysis
Example Commands
. pea xl-x20
Obtains principal components of the variables xl through x20.
. pea xl-x20, mineigen(l)
Obtains principal components of the variables^/ throughx20. Retains components having
eigenvalues greater than 1.
&
.
factor xl-x20, ml factor(5)
thSm five3 faTtora likeIih°Od faCt°r analysis of the variables*/ through x20. Retai ns on ly
. greigen
Graphs eigenvalues versus factor or ccomponent number from the most recent factor
command (also known as a “scree graph”).
- rotate, varimax factors(2)
Performs orthogonal (varimax) rotation of the first
two factors from the most recent
factor command.
. rotate, promax factors(3)
Performs oblique (promax) rotationof the first three factors from the most recent factor
command.
.
score fl f2 f3
Generates three new factor score variables named//,f2,
factor and rotate commands.
based upon the most recent
. alpha xl-xlO
Calculates Cronbach’s a reliability coefficient for a composite variable defined as the sum
oveZX
I f ST e ltemS entering neSative,y is ordinarily reversed. Options can
override this default, or form a composite variable by adding together either the original
variables or their standardized values.
■ cluster centroidlinkage x y z w, L2 name(L2cent)
Performs; agglomerative cluster analysis with centroid linkage, using variables x, y, and
w. Euclidean distance (L2) measures dissimilarity among observations. Results from this
cluster analysis are saved with the name L2cent.
■ cluster tree, ylabel(0(.5)3) cutnumber(20) vertlabel
Draws a cluster analysis tree graph or dendrogram showing results from the previous
cluster analysis, cutnumber (20) specifies that the graph begins with only 20 clusters
remaining, after some previous fusion of the most-similar observations. Labels are printed
in a compact vertical fashion below the graph. cluster dendrogram does the
same thing as cluster tree.
320
Statistics with Stata
. cluster generate ctype = groups(3), name(L2cent)
Creates a new variable ctype (values of 1,2, or 3) that classifies each observation into one
of the top three groups found by the cluster analysis named L2cent.
i
”1
■
Principal Components
To illustrate basic principal components and factor analysis commands, we will use a small
dataset describing the nine major planets of this solar system (from Beatty et al. 1981). The
data include several variables in both raw and natural logarithm form. Logarithms are
employed here to reduce skew and linearize relationships among the variables.
Contains data from C:\daia\planets.dta
obs :
9
vars:
12
size:
441 (99.9% of memory free)
variable name
storage
type
planet
dsun
radius
rings
moons
mass
density
logdsun
lograd
logmoons
logmass
logdense
Sorted by:
s tr7
float
float
byte
byte
float
float
float
float
float
float
float
display
format
*3s
*9.0g
*9.0g
•B. 0g
*B.0g
%9.0g
*9.0g
*9.0g
%9.0g
%9.0g
%9.0g
%9.0g
value
label
Solar system data
22 Jul 2005 09:49
variable label
Planet
ringlbl
Mean dist. sun, km*10A6
Equatorial radius in km
Has rings?
Number of known moons
Mass in kilograms
Mean density, g/cmA3
natural log dsun
natural log radius
natural log (moons + 1)
natural log mass
natural log dense
dsun
To extract initial factors or principal components, use the command factor followed
by a variable list (variables in any order) and one of the following options:
Principal components factoring
Principal factoring (default)
pf
Principal factoring with iterated communalities
ipf
ml
Maximum-likelihood factoring
Principal components are calculated through the specialized command pea . Type help
pea or help factor to see options for these commands.
pcf
1
I
r
Principal Components, Factor, and Cluster Analysis
321
To obtain principal components factors, ty pe
factor rings logdsun - logdense, pcf
(obs=9)
Factor
(principal component factors; 2 factors retained)
Eigenvalue
Difference
Proportion
Cumulative
1
2
3
4
5
6
4.62365
1.16896
0.11232
C . 05837
0.03663
0.00006
3.45469
1.05664
0.05395
0.02174
0.03657
Variable |
ractor Loadings
1
2
rings
logdsun
lograd
logmoons
logmass
logdense
0.97917
0.67105
0.92287
0.97647
0.83377
-0.84511
|
|
|
|
|
|
0.07720
-0.71093
0.37357
0.00028
0.54463
0.47053
0.7706
0.1948
0.0187
0.0097
0.0061
0.0000
0.7706
0.9654
0.9842
0.9939
i
nnnn
1.0000
Uniqueness
0.03526
0.04427
0.00875
0.04651
0.00821
0.06439
Only the first two components have eigenvalues greater than 1, and these two components
explain over 96 /. of the six variables’ combined variance. The unimportant 3rd throCsh 6th
principal components might safely be disregarded in subsequent analysis.
Two factor options provide control over the number of factors extracted:
factors (#)
where # specifies the number of factors
mineigen (#)
where # specifies the minimum eigenvalue for retained factors
The principal components factoring ( pcf ) procedure
> automatically drops factors with
eigenvalues below 1, so
• factor rings logdsun — logdense, pcf
is equivalent to
.
factor rings logdsun - logdense, pcf mineigen (1)
In this example, we would also have obtained the same results by typing
-
factor rings logdsun - logdense, pcf factors (2)
To see a scree graph (plot of eigenvalues versus component or f
factor number) after any
factor, use the greigen command. A horizontal line at eigenvalue = 1 in Figure 12 1
marks the usual cutoff for retaining principal components, and again emphasizes the
unimportance in this example of components 3 through 6.
I
322
Statistics with Stata
. greigen, yline(l)
I
Figure 12.1
in
I:
! I
oCO -
5
ro
>
c
1
0)
O)
LU ™ -
I
O
1
I
1
2
3
Number
4
5
6
Rotation
Rotation further simplifies factor structure. After factoring, type rotate followed bv one
of these options:
varimax
Varimax orthogonal rotation, for uncorrelated factors or components (default ).
promax()
Promax oblique rotation, allowing correlated factors or components. Choose
a number (promax power) < 4; the higher the number, the greater the degree
of interfactor correlation, promax (3) is the default.
■
Two additional rotate options are
factors ()
As it does with factor , this option specifies how many factors to retain.
Horst modification to varimax and promax rotation.
horst
Rotation can be performed following any factor analysis, whether it employed the pcf .
Pf» ipf »or ml options. In this section, we will follow through on our pcf example. For
orthogonal (default) rotation of the first two components found in the planetary data, we type
.
rotate
(varimax rotation)
Rotated Factor Loadings
Variable I
1
2
Uniqueness
rings
logdsun
lograd
logmoons
logmass
logdense
|
|
|
|
I
|
0.52848
0.97173
0.25804
0.58824
0.06784
-0.88479
C.82792
G.10707
0.96159
G.77940
0.99357
-0.39085
0.03526
0.04427
0.00875
0.04651
0.00821
0.06439
fe,.
Principal Components, Factor, and Cluster Analysis
323
This example accepts all the defaults: varimax rotation and the same number of factors
retained in the last factor . We could have asked for the
--------- ...e same rotation explicitly, with the
following command:
.
varimax factors(2)
rotate,
For oblique promax rotation (allowing correlated factors) of the most recent factoring, type
•
rotate,
promax
(promax rotation)
Rotated Factor Loadings t
Variable |
1
2
Uniqueness
rings
logdsun
lograd
logmoons
logmass
logdense
|
|
|
I
|
|
0.34664
1.05196
0.00599
0.42747
-0.21543
-0.87190
0.76264
-0.172'?0
0.99262
0.69070
1.08534
-0.16922
0.03526
0.04427
0.00875
0.04651
0.00821
0.06439
By default, this example used a promax power of 3.
We could have specified the promax
power and desired number of factors explicitly:
.
rotate, promax (3)
factors(2)
(4} W iUld permi fUrther simplif,cation of the fading matrix, at the cost of stronger
interfactor correlations and less total variance explained.
I
After promax rotation, rings, lograd. logmoons, and logmass load most heavily on factor
hiahp apP7rS1t°be a “larSe s^/many satellites” dimension, logdsun and logdense load
oher on factor 1, forming a “far out/low density” dimension. The next section shows how to
create new variables representing these dimensions.
I
Factor Scores
Factor scores are linear composites, formed by standardizing each variable to zero mean and
unit variance and then we.ghtmg with factor score coefficients and summing for each factor
score performs these calculations automatically, using the most recent rotate or
/and0/? r6S
Inthe SC°re commandwesuPPlv names for the new variables, such as
I
ji dnu jz.
score fl
f2
(based on rotated factors)
Scoring Coefficients
Variable
1
2
I
rings
logdsun
lograd
logmoons
logmass
logdense
_____
|
|
|
|
|
|
0.12674
0.48769
-0.03840
0.16664
-0.14338
-0.39127
0.22099
-0.09689
0.30608
0.19543
0.34386
-0.01609
324
Statistics with Stata
label variable fl "Far out/low density"
. label variable f2 ."Large size/many satellites"
.
list planet fl f2
1.
2.
3.
4.
5.
6.
7.
8.
9.
planet
I
I
I Mercury
Venus
I
Earth
I
Mars
I
I Jupiter
I--------------Saturn
I
Uranus
I
I Neptune
I
Pluto
fl
-1.256881
-1 . 188757
-1.035242
-.5970106
. 3841085
.9259058
.9347457
.8161058
1.017025
----- +
f2 |
I
- . 9172388 I
-.5160229 I
- .3939372 I
-.6799535 I
1.342658 I
I
1.184475 I
.7682409 |
.647119 I
-1.43534 |
------------- +
Being standardized variables, the new factor scoresfl and\f2 have means (approximately) equal
to zero and standard deviations equal to one:
summarize fl
f2
Variable
I
Obs
Mean
Std. Dev.
Mir.
Max
fl
f2
I
I
9
9
9.93e-09
-3.31e-09
1
1
-1.256881
-1.43534
1.017125
1.342658
Thus, the factor scores are measured in units of standard deviations from their means. Mercury,
for example, is about 1.26 standard deviations below average on the far out/low density (fl)
dimension because it is actually close to the sun and high density. Mercury is .92 standard
deviations below average on the large size/many satellites (/2) dimension because it is small and
has no satellites. Saturn, in contrast, is .93 and 1.18 standard deviations abo\ e average on these
two dimensions.
Promax rotation permits correlations between factor scores:
. correlate fl
(obs=9)
fl
f2
•ii
I
|
f2
fl
f2
1.0000
0.4974
1.0000
Scores on factor 1 have a moderate positive correlation with scores on factor 2: far out/low
density planets are more likely also to be larger, with many satellites.
If we employ varimax instead of promax rotation, we get uncorrelated factor scores:
.
quietly factor rings logdsun - logdense,
. quietly rotate
!
E
quietly score
v&rimaxl varimax2
pcf
T
Principal Components, Factor, and Cluster Analysis
325
correlate varimaxl varimax2
(obs = 9)
I varimaxl varimax2
-------- +
varimaxl I
1 . ooocvarimax2 |
0.0000
1.0000
1
i
I
Once created by score , factor scores can be treated like any other Stata variable —
listed, analyzed, graphed, and so forth. Graphs ofprincipal component factors sometimes help
to identify multivariate outliers orclusters of observations that stand apart from the rest. For
example. Figure 12.2 reveals three distinct types of planets.
. graph twoway scatter fl f2, yline(0) xline(O) mlabel(planet)
mlabsize(medsmall) ylabel(, angle(horizontal))
xlabel(-1.5 ( .5)1.5, grid)
1
Figure 12.2
• Pluto
• Uranus • Saturn
• Neptune
.5
• Jupiter
c
1
0
s
o
ro
-.5
• Mars
LU
-1
• Earth
. Mercury”Venus
I
■•5
0
.5
Large size/many satellites
i
1
1.5
The inner, rocky planets (such as Mercury, low on “far out/low density” factor 1; low also
on “large size/many satellites" factor 2) cluster together at the lower left. The outer gas giants
have opposite characteristics, and cluster together at the upper right. Pluto, which physically
resembles some outer-system moons, is unique among planets for being high on the “far out/low
density" dimension, and at the same time low on the “large size/many satellites” dimension.
This example employed rotation. Factor scores obtained by principal components without
rotation are often used to analyze large datasets in physical-science fields such as climatology
and remote sensing. In these applications, principal components are called “empirical
orthogonal functions.” The first empirical orthogonal function, or EOF1, equals the factor
score for the first unrotated principal component. EOF2 is the score for the second principal
component, and so forth.
326
Statistics with Stata
E
Principal Factoring
Principal factoring extracts principal components from a modified correlation matrix, in which
the main diagonal consists of communality estimates instead of I’s. The factor options
pf and ipf both perform principal factoring. They differ in how communalities are
estimated:
!
Communality estimates equal 7?2 from regressing each variable on all the others.
Iterative estimation of communalities.
pf
ipf
d.
Whereas principal components analysis focuses on explaining the variables’variance, principal
factoring explains intervariable correlations.
We apply principal factoring with iterated communalities ( ipf ) to the planetary data:
t-
factor
rings logdsun
logdense,
ipf
(obs=9)
4-
Factor
1
2
3
4
5
6
I:
(iterated principal factors;
Eigenvalue
lifference
5 factors retained)
Proportion
Cumulative
4.59663
1.12846
0.07739
0.01301
0.00125
-0.00012
0.7903
0.1940
0.0133
0.0022
0.0002
-0.0000
Variable
I
rings
logdsun
lograd
logmoons
logmass
logdense
I
I
I
i
i
3.46817
1.05107
. 06438
:.01176
:.00137
-actor Loadings
1
'2
0.97599
0.65708
0.92 67 0
0.96738
0.63753
-0.84602
2.06649
-C.6'054
1074
~ 5" 6
= 941
0.7903
0.9843
0.9976
0.9998
1.0000
1.0000
3
0.113"’4
0.14114
0.00
•o. c94
-0.02065
0.C4471
0.04665
-0.08593
0. 12 82 4
-0.00610
5
Uniqueness
-0.02234
0.00816
0.01662
0.01597
-0.00714
0.00997
0.02916
0.09663
-0.00036
0.05636
-0.00069
0.00217
Only the first two factors have eigenvalues above 1. With pcf or pf factoring, we can
simply disregard minor factors. Using ipf . however, we must decide how many factors to
retain, and then repeat the analysis asking for exactly that many factors. Here we will retain
two factors:
factor rings logdsun
logdense,
ipf factor(2)
(obs = 9)
Factor
I
! i
i
2
3
4
5
6
(iterated principal factors; 2 factors retained)
Eigenvalue
Difference
Proportion
Cumulative
4.57495
1.10083
0.02452
0.00439
-0.00356
-0.02537
3.47412
1.07631
0.02013
00795
0.02182
0.8061
0.1940
0.0043
0.0008
-0.0006
-0.0045
0.8061
1.0000
1.0043
1.0051
1.0045
1.0000
Principal Components, Factor, and Cluster Analysis
327
Factor Loadings
Variable
rings
logdsun
lograd
logmoons
logr.ass
logdense
I
|
|
|
|
|
|
1
2
Uniqueness
0.97474
0.65329
0.92816
0.9685-5
0.84298
-0.82938
0.05374
-0.67309
0.36047
-0.02278
0.54616
0.46490
0.04699
0.12016
0.00858
0.06139
-0.00890
0.09599
After this final factor analysis, we can create composite variables by rotate and
score . Rotation of the ipf factors produces results similar to those found earlier with
pef a far out/low density dimension and a large size/many satellites dimension When
kss difference 3 Str°nS
d°’
SpeCiflC teChniques we choose make
i
Maximum-Likelihood Factoring
factor
maximum-likelihood
i-likelihood factor for the planetary data, type
typ<
.
factor rings logdsun - logdense,
ml nolog factor(1)
(obs=9)
(maximum likelihood factors; 1 factor retained)
Variance
Difference
Proportion
Cumulative
Factor
1
Test:
Test:
4.47258
1 vs. no
factors.
1 vs. mere factors.
1.0000
Chi2 (
Chi2 (
Variable |
Factor Loadings
1
Uniqueness
rings
logdsun
lograd
logmoons
logmass
logdense
0.98726
0.59219
0.93654
0.95890
0.86918
-0.77145
[
I
|
I
|
I
6) =
9) =
1.0000
62.02, Prob > chi2 =
51.73, Prob > chi2 =
0.0000
0.0000
0.02535
0.64931
0.12288
0.08052
0.24451
0.40487
The ml output includes two %2 tests:
J vs .
no
factors
This tests whether the current model, with/factors, fits the observed correlation matrix
significantly better than a no-factor model. A low probability indicates that the current
model is a significant improvement over no factors.
J vs . more factors
This tests whether the current /-factor model fits significantly worse than a more
complicated, perfect-fit model. A low P-value suggests that the current model does not
nave enough factors.
i/
■
328
Statistics with Stata
The previous 1-factor example yields these results:
1
vs .
no
factors
Z ‘ [6] = 62.02. P = 0.0000 (actually, meaning P
significantly improves upon a no-factor model.
1
vs .
.00005). The 1-factor model
factors
more
x2 [9] = 51.73,P = C0.0000 (P < .00005). The 1-factor model is significantly worse
than a perfect-fit model.
I
Perhaps a 2-factoi model will do better:
factor rings logdsun -
logdense,
ml nolog factor(2)
(obs=9)
i
(maximum iikeli'r. id fact - s;
• - - o-aVariance
Factor
1
I
Test :
Test:
. |
ai
3.64201
1.97085
2 vs. no
factors.
2 vs. more factors.
rings
logdsun
lograd
logmoons
logmass
logdense
:hi2 (
7hi2 (
Factor
1
Variable
■
1.67115
:
|
I
I
I
I
n
K K = = I
0.20923
0.98437
0.81560
0.99965
-0.46434
12 ■
2 factors retained)
Proportion
Cumulative
0.6489
0.3511
0.6489
1.0000
134.14, Prob > chi2 =
6.72, Prob > chi2 =
0.0000
0.1513
iqueness
.41545
.35593
.17528
.49982
.02639
.38565
0.0’7829
0.22361
0.00028
0.08497
0.00000
0.00000
Now we find the following:
i
2
i
s.
vs.
-
no
factors
Z ’ [1~] “ 134.14, P = 0.0000 (actually. P < .00005). The 2-factor model significantly
improves upon a no-factor model.
more
factors
Z' [4] = 6.72, P = 0.1513. The 2-factor model is not significantly worse than a perfect-fit
model.
These tests suggest that two factors provide an adequate model.
Computational routines performing maximum-likelihood factor analysis often yield
improper solutions’ — unrealistic results such as negative variance or zero uniqueness. When
this happens (as it did in our 2-tactor ml example), the % 2 tests lack formal justification.
Viewed descriptively, the tests can still provide informal guidance regarding the appropriate
number of factors.
Principal Components, Factor, and Cluster Analysis
329
Cluster Analysis — 1
specified hypotheses. Indeed, there exists little formal theoiy to guide hypothesis testing for
the common clustering methods. The number of choices available at each step in the analysis
daunting, and all the more so because they can lead to many different results This section
provides no more than an entry point to begin cluster analysis. We review some basic ideas and
i us rate them through a simple example. The following section considers a somewhat larger
example. Stata sMi//nva/7a/e^to/?e/ere„ceM«wwaZintroduces anddefines the full ran„e
choices available. Everitt et al. (2001) cover topics in more detail, including helpful
comparisons among the many cluster-analysis methods.
P
nwfHT'Hv ryCth°ds fal1 int0 two broad categories, partition and hierarchical. Partition
ways todo this °bSerVat,OnS lnt0 aPre-set "^ber of nonoverlapping groups. We have two
I
cluster kmeans
Kmeans cluster analysis
keSrafiSveeCifleS
1
W t0 c™16- Stata then flnds these thr°ugh an
iterative process, assigning observations to the group with the closest mean.
cluster kmedians
Kmedians cluster analysis
Similar to Kmeans, but with medians.
Partition methods tend to be computationally simpler and faster than hierarchical methods The
Xk,howeveE
8
CXaCt nUmber0f Clusters in advance a disadvantage for exploratory
Hierarchical methods, involve a process of smaller groups gradually fusing to form
it^tartsT / T °T ?ata
a88lomerative aPProach in hierarchical cluster analysisit starts out with each observation considered as its own separate “group ” The closest two
groups are merged, and this process continues until a specified stoppifg-point is reached o IS
observations belong to one group. A graphical display called a dent^rarn orZeediaZa"
visualizes h'erarchical clustering results. Several choices exist for the linkage method Jhich
specifies what should be compared between groups that contain more than one observation:
cluster singlelinkage
Single linkage cluster analysis
omputes the dissimilarity between two groups as the dissimilarity between the closest pair
of observations between the two groups. Although simple, this method has low resistance
Z IlerS77easurement errors- Observations tend to join clusters one at a time, forming
unbalanced, drawn-out groups in which members have little in common, but are linked by
intermediate observations — a problem called chaining.
V
cluster completelinkage
Complete linkage cluster analysis
ZZZl lfaithtSt Palr °f Ob™ions between the two groups. Less sensitive to outliers
mo ti2
t n6’
W ‘t °PP0Site tendenCy t0Wards clumP*nS many observations
into tight, spatially compact clusters.
I
/
(
cluster averagelinkage
Average linkage cluster analysis
S^edHt^t diSSimilar1ity of observations between the two groups, yielding properties
intermediate between-single and complete linkage. Simulation studies report that this
330
11
Statistics with Stata
works well for many situations and is reasonably robust (see Everitt et al. 2001, and sources
they cite). Commonly used in archaeology.
cluster centroidlinkage
Centroid linkage cluster analysis
Centroid linkage merges the groups whose means are closest (in contrast to average linkage
which looks at the average distance between elements of the two groups). This method is
subject to reversals — points where a fusion takes place at a lower level of dissimilarity
than an earlier fusion. Reversals signal an unstable cluster structure, are difficult to
interpret, and cannot be graphed by cluster tree.
i
t
cluster waveragelinkage
Weighted-average linkage cluster analysis
cluster medianlinkage
Median linkage cluster analysis.
Weighted-average linkage and median linkage are variations on average linkage and
centroid linkage, respectively. In both cases, the difference is in how groups of unequal
size are treated when merged. In average linkage and centroid linkage, the number of
elements of each group are factored into the computation, giving correspondingly larger
influence to the larger group (because each observation carries the same weight). In
weighted-average linkage and median linkage, the two groups are given equal weightine
regardless of how many observations there are in each group. Median linkage, like centroid
linkage, is subject to reversals.
I
i
<
cluster wardslinkage
Ward’s linkage cluster analysis
Joins the two groups that result in the minimum increase in the error sum of squares. Does
well with groups that are multivariate normal and of similar size, but poorly when clusters
have unequal numbers of observations.
I
I
■
i
All clustering methods begin with some definition of dissimilarity (or similarity).
Dissimilarity measures reflect the differentness or distance between two observations, across
a specified set of variables. Generally, such measures are designed so that two identical
observations have a dissimilarity of 0, and two maximally different observations have a
dissimilarity of 1. Similarity measures reverse this scaling, so that identical observations have
a similarity of 1. Stata s cluster options offer many choices ofdissimilarity or similarity
measures. For purposes of calculation, Stata internally transforms similarity to dissimilarity:
dissimilarity = 1 - similarity
The default dissimilarity measure is the Euclidean distance, option L2 (or Euclidean ).
This defines the distance between observations i and j as
{lLk(xki-xkjy}12
where xkj is the value of variable .vk for observation z, xkj the value ofx* for observationj,
observationy, and
summation occurs over all the x variables considered. Other choices available for measuring
the (dis)similarities between observations based on continuous variables include the squared
Euclidean distance ( L2squared),
Lk^ki-xkjy
••
Ijl i
the absolute-value distance (LI). maximum-value distance (Linf inity), and correlation
coefficient similarity measure ( correlation). Choices for dissimilarities or similarities
based on binary variables include simple matching (matching ), Jaccard binary similarity
coefficent ( Jaccard), and many others. Type help cldis for a list and explanations.
lljy.
W
Principal Components, Factor, and Cluster Analysis
■I
331
Earlier in this chapter, a principal components analysis of variables in planets.dta (Figure
12.2) identified three types of planets: inner rocky planets, outer gas giants, and in a class by
itself, Pluto. Cluster analysis provides an alternative approach to the question of planet “types.”
Because variables such as number of moons (moons) and mass in kilograms (mass) are
measured in incomparable units, with hugely different variances, we should standardize in some
way to avoid results dominated by the highest-variance items. A common, although not
automatic, choice is standardization to zero mean and unit standard deviation. This is
accomplished through the egen command (and using variables in log form, for the same
reasons discussed earlier), summarize confirms that the new z variables have (near) zero
means, and standard deviations equal to one.
.
egen zrings = std(rings)
egen zlogdsun = std(logdsun)
.
egen zlograd = std(lograd)
.
egen zlogmoon = std(logmoons)
.
egen zlogmass = std(logmass)
.
egen zlogdens - std(logdense)
summ zrings - zlogdens
I
I
I
I
Variable |
Obs
Mean
Std. Dev.
Min
Max
zrings |
zlogdsun I
zlograd |
zlogmoon |
zlogmass |
9
9
9
9
9
-1.99e-08
-1.16e-08
-3.31e-09
0
-4 .14e-09
1
1
1
1
1
-.8432741
-1.393821
-1 .3471
-1.207296
-1.74466
1.054093
1.288216
1.372751
1.175849
1.365167
zlogdens |
9
-1.32e-08
1
-1.453143
1.128901
The three types” conclusion suggested by our principal components analysis is robust and
could have been found through cluster analysis as well. For example, we might perform a
hierarchical cluster analysis with average linkage, using Euclidean distance ( L2 ) as our
dissimilarity measure. The option name (L2avg) gives the results from this particular
analysis a name, so that we can refer to them in later commands. The results-naminn feature
is convenient when we need to try a number of cluster analyses and compare their outcomes.
.
cluster averagelinkage zrings zlogdsun zlograd zlogmoon zlogmass
zlogdens, L2 name(L2avg)
Nothing seems to happen, although we might notice that our dataset now contains three new
variables with names based on L2avg. These new L2avg* variables are not directly of interest,
but can be used unobtrusively by the cluster tree command to draw a cluster analysis
tree or dendrogram visualizing the most recent hierarchical cluster analysis results (Figure
12.3). The label (planet) option here causes planet names (values ofplanet) to appear
as labels below the tree. Typing cluster dendrogram instead of cluster tree
would produce the same graph.
I
I
332
Statistics with Stata
. cluster tree, label(planet) ylabel(0(1)5)
5i
Figure 12.3
4-
i!
1
!
i
I
I2!
3-
2-
1
0J
I
Mercury Venus3 Earth Mars
Pluto Jupiter Saturn Uranus Neptune
Dendrogram for L2avg cluster analysis
Dendrograms such as Figure 12.3 provide key interpretive tools for hierarchical cluster
analysis. We can trace the agglomerative process from each observation its own cluster, at
bottom, to all fused into one cluster, at top. Venus and Earth, and also Uranus and Neptune,
are the least dissimilar or most alike pairs. They are fused first, forming the first two multi
observation clusters at a height (dissimilarity) below 1. Jupiter and Saturn, then Venus-Earth
and Mars, then Venus-Earth-Mars and Mercury, and finally Jupiter-Saturn and
Uranus-Neptune are fused in quick succession, all with dissimilarities around 1. At this point
we have the same three groups suggested in Figure 12.2 by principal components: the inner
rocky planets, the gas giants, and Pluto. The three clusters remain stable until, at much higher
dissimilarity (above 3), Pluto fuses with the inner rocky planets. At a dissimilarity near 4, the
final two clusters fuse.
So, how many types of planets are there? The answer, as Figure 12.3 makes clear, is “it
depends.” How much dissimilarity do we want to accept within each type? The long vertical
lines between the three-cluster stage and the two-cluster stage in the upper part of Figure 12.3
indicate that we have three fairly distinct types. We could reduce this to two types only by
fusing an observation (Pluto) that is quite dissimilar to others in its group. We could expand
it to five types only by drawing distinctions between several planet groups (e.g., Mercury-Mars
and Earth-Venus) that by solar-system standards are not greatly dissimilar. Thus, the
dendrogram makes a case for a three-type scheme.
The cluster generate command creates a new variable indicating the type or group
to which each observation belongs. In this example, groups (3) calls for three groups. The
name (L2avg) option specifies the particular results we named L2avg. This option is most
useful when our session included multiple cluster analyses.
fe
ff®'
Principal Components, Factor, and Cluster Analysis
cluster generate plantype = groups(3),
.
label variable plantype ’’Planet type”
•
list planet plantype
1.
2.
3.
4.
5.
6.
7.
8.
9.
I
I
I
I
planet
i
I Mercury
Venus
I
Earth
I
Mars
I
I Jupiter
I--------------Saturn
I
Uranus
I
I Neptune
I
Pluto
333
name(L2avg)
plantype I
I
1 I
1 I
1 I
1 I
3 I
I
3 I
3 I
3 I
2 I
The inner rocky planets have been coded as plantype = 1; the gas giants as plantype = 3;
and Pluto, which resembles an outer-system moon more than it does other planets, is by itself
as plantype = 2. The group designations as 1,2, and 3 follow the left-to-right ordering of final
clusters in the dendrogram (Figure 12.3). Once the data have been saved, our new typology
could be used like any other categorical variable in subsequent analyses.
These planetary data have a strong pattern of natural groups, which is why such different
techniques as cluster analysis and principal components point towards similar conclusions. We
could have chosen other dissimilarity measures and linkage methods for this example, and still
arrived at much the same place. Complex or weakly patterned data, on the other hand, often
yield quite different results depending on nuances of the methods used. The clusters found by
one method might not prove replicable under others, or even with slightly different analvtical
decisions.
Cluster Analysis — 2
Discovering a simple, robust typology to describe the nine planets was straightforward. For a
more challenging example, consider the cross-national data in nations.dta. This dataset
contains living-conditions variables that might provide a basis for classifying countries into
types.
Contains data from C:\data\nations.dta
obs:
109
vars:
15
size:
4,142 (99.9% of memory free)
variable name
country
pop
birth
death
chldmort
infmort
life
storage
type
st r8
float
byte
byte
byte
int
byte
display
format
%9s
%9.0g
%8 . Og
%8 . Og
%8 . Og
%8 . Og
%8.0g
value
label
Data on 109 nations,
23 Jul 2005 18:37
ca.
1985
variable label
Country
1985 population in millions
Crude birth rate/1000 people
Crude death rate/1000 people
Child (1-4 yr) mortality 1985
Infant (<1 yr) mortality 1985
--- Li fe expectancy at birth 1985
334
Statistics with Stata
food
energy
gnpcap
gnpgro
urban
schooll
school2
schools
int
in t
int
float
byte
int
int
byte
% 9 . Og
* i . Og
* 6 . Og
%9. Og
%c . Og
%8 . Og
%8 . Og
%8 . Og
Per capita daily calories 1985
Per cap energy consumed, kg oil
Per capita GNP 1985
Annual GNP growth % 65-85
% population urban 1985
Primary enrollment ; age-grrup
Secondary enroll - age-group
Higher ed. enroll ; age-group
Sorted by:
In Chapter o,
8, we
nonlinear transformations
transformations (logs
(logs or square roots) helped to
yvc saw that
nidi nonlinear
normalize distributions and linearize relationships among some of these variables. Similar
arguments for nonlinear transfonnations could apply to cluster analysis, but to keep our
example simple, we will not pursue them here. Linear transformations to standardize the
variables in some fashion remain important, however. Otherwise, the variablegnpcap, which
ranges from about $100 to SI9,000 (standard deviation $4,400) would overwhelm other
vaiiables such as life, which ranges from 40 to 78 years (standard deviation 11 years). In the
Previous section, we standardized planetary data by subtracting each variable’s mean, then
ividing by its standard deviation, so that the resulting z-scores all had standard deviations of
one. In this section we take a different approach, range standardization, which also works well
for cluster analysis.
Range standardization involves dividing each variable by its range. There is no command
to do this directly m Stata, but we can improvise one easily enough. The summarize,
detail command calculates one-variable statistics, and afterwards unobtrusively stores the
results in memory as macros (described in Chapter 14). A macro named r (max) stores the
variable’s maximum, and r (min) stores its minimum. Thus, to generate new variable rpop,
defined as a range-standardized version ofpop (population), type the commands
. quietly summ pop, detail
. generate rpop = pop/(r(max) - r(min))
. label variable rpop "Range-standardized population"
Similar commands create range-standardized versions ofother living-conditions variables:
. quietly summ birth, detail
6 i
. generate rbirth = birth/(r(max)
r(min))
. label variable rbirth "Range-standardized bith rate"
. quietly summ infmort, detail
. generate rinf
infmort/(r(max) - r(min))
.
■I;
label variable rinf "Range-standardized infant mortality"
and so forth, defining the 8 new variables listed below. These range-standardized variables all
have ranges equal to 1.
. describe rpop-rschool2
storage
type
display
format
rbirth
rinf
float
float
float
%9 . Og
%9. Og
%9 . Og
rli fe
float
% 9.-.PS__
variable name
rpop
? I
2
value
label
variable label
Range-standardized population
Range-standardized bith rate
Range-standardized infant
mortality
Range-standardized life
Principal Components, Factor, and Cluster Analysis
expectancy
Range-standardized food per
capita
Range-standardized energy per
capita
Range-standardized GNP per
capita
Range-standardized secondary
school %
i
r energy
r ?r;ycsp
■9. :g
rschoo!2
floar
summarize
rpop
%9.0g
rschool2
Vari ar le
Me a n
Std.
Max
i
|
I
|
|
109
109
109
109
108
. 03744 93
.7452043
.4051354
1.621922
1.230213
. 1206474
. 3098672
.2913825
.291343
.2644839
- 1 0 09622
.Z27272'7
.035503
1. 052632
.’■93776
1.000962
1.227273
1.035503
2.052632
1 . 779378
renergy ;
rgnpcap ;
rschoolz i
107
. 159786
.1666459
.4574849
.2137914
.2319276
.2899882
.- -ia4 64
. 0057411
.019607=
1.001846
1.005741
1.019608
rpop
rbirth
rinf
rlife
rfood
335
104
After the variables of interest have been standardized, we can proceed with cluster analysis
As we divide more than 100 nations into “types," we have no reason to assume that each type
will include a similar number of nations. Average linkage (used in our planetary example)
a ong with some other methods, gives each observation the same weight. This tends to make
larger clusters more influential as agglomeration proceeds. Weighted average and median
linkage methods, on the other hand, give equal weight to each cluster regardless of how many
o servations it contains. Such methods consequently tend to work better for detecting clusters
of unequal size. Median linkage, like centroid linkage, is subject to reversals (which will occur
with these data), so the following example applies weighted average linkage. Absolute-value
distance ( LI ) provides our dissimilarity measure.
.
cluster waveragelinkage rpop - rschool2,
LI name {LIwav)
The full cluster analysis proves unmanageably large fora tree graph:
. cluster tree
too many leaves;
rr.sner using the cutv = lue()
or cutnumber()
options
»■ / 1 Q Q V .
*. V J. -> w
,
I
I
Following the error-message advice. Figure 12.4 employs a cutnumber (100) option to
form a dendrogram that starts with only 100 groups, after the first few fusions have taken place.
!
336
Statistics with Stata
. cluster tree, ylabel (0 ( . 5)3) cutnumber(100)
3i
3
Figure 12.4
2.5-
§
II >
I
i
II
2-
1.5-
1-
V"
.5-
,__ [
£
lii
Dendrogram for L1wav cluster analysis
-
I
i
'I
7
11
I
m
a*''
The bottom labels in Figure 12.4 arc unreadable, but we can trace the general flow of this
clustering process. Most of the fusion takes place at dissimilarities below 1. Two nations at
far right are unusual; they resist fusion until about 1.5, and then form a stable two-nation group
quite different from all the rest. This is one of four clusters remaining above dissimilarities of
2. The first and second of these four final clusters (reading left to right) appear heterogeneous,
formed through successive fusion of a number of somewhat distinct major subgroups. The third
cluster, in contrast, appears more homogeneous. It combines many nations that fused into two
subgroups at dissimilarities below I, and then fused into one group at slightly above 1.
Figure 12.5 gives another view of this analysis, this time using the cutvalue (1) option
to show only clusters with dissimilarities above 1. The vertlabel option, not really
needed here, calls for the bottom labels (G1. G2. etc.) to be printed vertically instead of
horizontally.
Principal Components, Factor, and Cluster Analysis
337
cluster tree, ylabel(0(.5)3) cutvalue(1)
vertlabel
Figure 12.5
2.5-
2-
i
1.5-
I
1-
1
.5-
0J
2
§
?
§
?
9
S
§
Dendrogram for LI wav cluster analysis
As Figure 12.5 shows, there are 11 groups remaining«-< at dissimilarities
----------- ——UV/V7
W 1.
above
1 Fol
purposes
above 2 of illustration.
'Vl1* COnsider onl*the t0P four groups, which have dissimilarities
the H \
7
generate creates a categorical variable for the final four groups from
the cluster analysis we named Llwav.
K*uups irom
cluster generate
•
ctype = groups (4), name(nwir)
label variable ctype "Country type"
We could next examine which countries belong to which groups by typing
by ctype:
list country
I
I
+-
I
ctypel
I1. I
Algeria
2. I
Brazil
3. I
Burma
4. I
Chile
5. I Colombia
|-------6. I CostaRic
7. I
DorTtRep
8. I
Ecuador
9. I
Egypt
10. I Indonesi
I11. I Jamaica
12 . I
Jordan
13 . I Malaysia
___
ctype2
ctype3
Argentir.
Australi
Austria
Belgium
Canada
Banglade
Benin
Bolivia
Botswana
BurkFaso
Denmark
Finland
France
Greece
HongKong
Burundi
Cameroon
CenAfrRe
ElSalvad
Ethiopia
Hungary
Ghana
Guatemal
Guinea
ctype4 |
-------------I
China |
India |
I
I
I
------------ (
------------ I
Ireland
Israel
_
I
I
I
I
I
I
I
I
sr
338
Statistics with Stata
14 .
15.
i Mauritiu
I
Mexico
I--------
16.
17 .
Mo rocco
Panama
Paraguay
Peru
Philippi
20.
21 .
22 .
23.
24 .
*-
I
I
I SauArabi
S r i La n k a
I
Syria
I Thailand
Tunisia
26.
Turkey
27 . I Uruguay
28 . I Venezuel
29. I
30 . I
31 .
32 .
33.
34 . I
35. I
I
36 .
3~ .
38 .
39.
40 .
I
Ha i t i
Honduras
Kuwait
Netherla
NewZe ala
Norway
Poland
IvoryCoa
Kenya
Liberia
Madagasc
Malawi
Portugal
S_Korea
Singapor
Spain
Sweien
Mauritian
Mozambiq
Nepa 1
Nicaragu
Niger
Trir. sea
Nigeria
Pakistan
PapuaNG
Rwanda
Senegal
-I
I
I
I
I
I
■I
_■
:<
L’_S_A
UnArH.-ir
W German
Yugcs1=v
I
I
I
I
’I
I
I
I
I
I
SierraLe
Somalia
Sudan
Tanzania
Togo
YemenAR
YemenPDR
Zaire
Zambia
Zimbabwe
I
I
I
I
The two-nation cluster seen at far right in Figure 12.4 turns out to be type 4, China and
India. The broad, homogeneous third cluster in Figure 12.4, type 3, contains a large group of
the poorest nations, mainly in Africa. The relatively diverse type 2 contains nations with higher
liv ing conditions including the U.S.. Europe, and Japan. Type 1, also diverse, contains nations
with intermediate conditions. Whether this or some other typology is meaningful remains a
substantixe question, not a statistical one. and depends on the uses for which a typology is
needed. Choosing different options in the steps of our cluster analysis would have returned
different results. By experimenting with a variety of reasonable choices, we could gain a sense
of which findings are most stable.
T
Time Series Analysis
Stata’s evolving time series capabilities are covered in the 350-page Time-Series Reference
explorations.
A technical and thorough treatment of time series topics is found in Hamilton (1994)
?? nnnn lnC Ude B°X’ Jenklns’ and Reinsel (1994), Chatfield (1996), Dioole (1990)
Enders (1995), Johnston and DiNardo (1997), and Shumway (1988).
Menus for time series operations come under the following headings:
I
Statistics - Time series
Statistics - Multivariate time series
Statistics — Cross-sectional time series
-
Graphics - Time series graphs
Example Commands
I
I
ac y, lags(8)
level(95)
generate(newvar)
Graplis; autocorrehtions of variable^, with 95% confidence intervals (default) for lags 1
through 8. Stores the autocorrelations as the first 8 values of newvar.
S
. arch D.y, arch(l/3)
ar(l) ma(l)
Fits an ARCH (autoregressive conditional heteroskedasticity) model for first differences
disturbances"18
third_°rder ARCH terms> and first-order AR and MA
. arima y,
arima(3,l,2)
Fits a simple ARIMA(3,12) model. Possible options include several estimation strategies,
linear constraints, and robust estimates of variance.
I
-
I
arima y, arima(3,l,2)
sarima(1,0,1,12)
Fits ARIMA model including a multiplicative seasonal component with period 12.
. arima D.y xl Ll.xl x2, ar(l) ma(l 12)
diff®rences ofP°n*A lag-1 values ofxl, andx2, including AR(1),MA(1),
ana MA( 12) disturbances.
_______
339
1
340
Statistics with Stata
corrgram y,
lags(8)
Obtains autocorrelations, partial autocorrelations, and Q tests for lags 1 through 8.
dfuller y
Performs Dickey-Fuller unit root test for stationarity.
dwstat
After regress , calculates a Durbin-Watson statistic testing first-order autocorrelation.
.
egen newvar = ma(y), nomiss t(7)
Generates newvar equal to the span-7 moving average ofy, replacing the start and end
values with shorter, uncentered averages.
.
generate date = mdy(mon th,day,year)
Creates variable date, equal to days since January 1, 1960, from the three variables month,
day. and year.
. generate date = date(str_date,
"mdy")
Creates variable date from the string variable str_date, where str_date contains dates in
month, day, year form such as “IF 19/2001”, “4/18/98”, or “June 12, 1948”. Type help
dates for many other date functions and options.
. generate newvar = L3. y
Generates newvar equal to lag-3 values ofy.
• Pac Yt lags(8) yline(O) ciopts(bstyle(outline) )
Graphs partial autocorrelations with confidence intervals and residual variance for lags 1
through 8. Draws a horizontal line at 0; shows the confidence interval as an outline, instead
of a shaded area (default).
. pergram y, generate(newvar)
Draws the sample periodogram (spectral density function) of variable^ and creates newvar
equal to the raw periodogram values.
. prais y xl x2
Performs Prais-Winsten regression of y on xl and x2, correcting for first-order
autoregressive errors, prais y xl x2, core does Cochrane-Orcutt instead.
smooth 73 y, generate (newar)
Generates newvar equal to span-7 running medians ofy, re-smoothing by span-3 running
medians. Compound smoothers such as “3RSSH” or “4253h,twice” are possible. Type
help smooth , or help tssmooth ,for other smoothing and filters.
tsset date,
format(%d)
Defines the dataset as a time series. Time is indicated by variable date, which is formatted
as daily. For “panel” data with parallel time series for a number of different units, such as
cities, tsset city year identifies both panel and time variables. Most of the
commands in this chapter require that the data be tsset.
tssmooth ma newvar = y, window(2 1 2)
Applies a moving-average filter toy, generating newvar. The window (2 1 2) option
finds a span-5 moving average by including 2 lagged values, the current observation, and
2 leading values in the calculation of each smoothed point. Type help tssmooth for
a list of other possible filters including weighted moving averages, exponential or double
exponential, Holt-Winters, and nonlinear.
i-
J
I
Time Series Analysis
.
i
341
tssmooth nl newvar = y, smoother(4253hztwice)
Applies a nonlinear smoothing filter toy, generating newvar. The
smoother (425 3h, twice) option iteratively finds running medians of span 4.2,5, and
3, then applies Hanning, then repeats on the residuals, tssmooth nl , unlike other
tssmooth procedures, cannot work around missing values.
. wntestq y, lags(15)
Box-Pierce portmanteau Q test for white noise (also provided by corrgram ).
. xcorr x y, lags (8)
xline(0)
Graphs cross-correlations between input (x) and output (y) variable for lags 1-8.
xcorr x y, table gives a text version that includes the actual correlations (or
include a generate (newvar) option to store the correlations as a variable).
1
Smoothing
I
Many time senes exhibit rapid up-and-down fluctuations that make it difficult to discern
underlying patterns. Smoothing such series breaks the data into two parts, one that varies
gradually, and a second “rough” part containing the leftover rapid changes:
data = smooth + rough
Dataset.MILwater.dta contains data on daily water consumption for the town of Milford, New
Hampshire over seven months from January through July 1983 (Hamilton 1985b).
Contains data from MILwater.dta
obs:
212
vars :
size:
I
I
variable name
month
day
year
water
4
2, 120 (99.9% of memory free)
storage
type
byte
byte
int
int
display
format
value
label
%9.0g
%9.0g
%9.0g
%9.0g
Milford daily water use,
- 7/31/83
27 Jul 2005 12:41
1/83
variable label
Month
Date
Year
Water use in 1000 gallons
Sorted by:
Before further analysis, we need to convert the month, day, and year information into a
single numerical index of time. Stata’s mdy() function does this, creatine an elapsed^iate
variable (named date here) indicating the number of days since January 1, 1960.
generate date = mdy{month,day,year)
•
list in 1/5
+----I month
I
1. I
1
2. I
1
3. I
1
4. I
1
5. I
1
day
year
water
1
2
3
4
5
1983
1983
1983
1983
1983
520
600
610
590
620
date |
----- I
8401 |
8402 |
8403 |
8404 I
8405 |
I
p
342
Statistics with Stata
The January 1, 1960 reference date is an arbitrary default, We can provide more
understandable formatting for date, and also set up our data for later analyses, by using the
tsset (time series set) command to identify date as the time index variable and to specify
the %d (daily) display option for this variable.
f'
I
tsset date, format(%d)
time variable:
date,
01janl983 to 31jull983
list in 1/5
.
I month
I
1
1. I
2. I
1
3. I
4. I
5. I
1
+
day
year
water
1
2
3
4
5
1983
1983
1983
1983
1983
520
600
610
590
620
date I
--------- I
01janl983 |
02janl983 I
03janl983 |
04janl983 I
05janl983 I
Dates in the new date format, such as “05janl983”, are more readable than the underlying
numerical values such as “8405” (days since January 1, 1960). If desired, we could use %d
formatting to produce other formats, such as “05 Jan 1983” or “01/05/83”. Stata offers a
number of variable-definition, display-format, and dataset-format features that are important
with time series. Many of these involve ways to input, convert, and display dates. Full
descriptions of date functions are found in the Data Management Reference Manual and the
User's Guide, or they can be explored within Stata by typing help dates .
The labeled values Qidate appear in a graph of water against date, which shows day-to-day
variation, as well as an upward trend in water use as summer arrives (Figure 13.1):
. graph twoway line water date, ylabel(300(100)900)
Figure 13.1
l
o
CD
o
w®
o
ro o
0)0
o
o
•£o
<U <D
co
3
oo
gS
o
o
co
Sided 982
19feb1983
10apr1983
date
30may1983
19jul1983
Time Series Analysis
343
Visual inspection plays an important role in time series analysis. It often helps us to see
underlying patterns in jagged series if we smooth the data by calculating a “moving average”
attach point from its present, earlier, and later values. For example, a “moving average of span
3 refers to the mean ofyandy ,+I . We could use Stata’s explicit subscripting to
generate such a variable:
.
I
I
generate water3 = (water[_n-l] + water[_n] + water[_n+l] )/3
Or, we could apply the ma (moving average) function of egen :
.
egen waters = ma(water), nomiss t(3)
The nomiss option asks for shorter, uncentered moving averages in the tails; otherwise, the
first and last values of waterJ would be missing. The t (3) option calls for moving averages
of span 3. Any odd-number span >3 could be used.
For time series ( tsset ) data, powerful smoothing tools are available through the
tssmooth commands. All but tssmooth nl can handle missing values.
tssmooth ma
moving-average filters, unweighted or weighted
I
tssmooth exponential
single exponential filters
tssmooth dexponential
double exponential filters
tssmooth hwinters
nonseasonal Holt-Winters smoothing
tssmooth shwinters
seasonal Holt-Winters smoothing
tssmooth nl
nonlinear filters
Type help tssmooth_exponential , help tssmooth—hwinters , etc. for the
syntax of each command.
Figure 13.2 graphs a simple 5-day moving average of Milford water use (waterS), together
with the raw data (water). This graph twoway command overlays a line plot of smoothed
waters values with a line plot of raw water values (thinner line). .Y-axis labels mark start-ofmonth values chosen “by hand” (8401, 8432, etc.) to make the graph more readable
Readability is also improved by formatting the labels as %dmd (date format, but only month
followed by day). Compare Figure 13.2’s labels with their default counterparts in Figure 13.1.
tssmooth ma waters = water, window(2 1 2)
The smoother applied was
(1/5)*[x(t-2) + x(t-1) + l*x(t) + x(t + l) + x(t+2)]; x(t)= water
344
Statistics with Stata
graph twoway line waters date, elwidth(thick)
line water date, ciwidth(thin) cipattern(solid)
I I
, ylabel(300(100)900)
I I
xlabel(8401 8432 8460 8491 8521 8552 8582 8613,
grid format(%dmd))
xtitle("”) ytitle(Water use in 1000 gallons)
legend(order(2 1) position(4) ring(0) rows(2)
label (1 "5-day average") label(2 "daily water use"))
Figure 13.2
o
o
CD
o
o -
■
:4
W CO
o
ro o
Oo o
o
o
eg.
qCD
<z>
3
^2
m
i
o
o -
daily water use
5-day average
o
o CO Li-
Jani
Feb1
Marl
Apr1
May1
Jun1
Ju!1
Aug1
Moving averages share a drawback of other mean-based statistics: they have little
resistance to outliers. Because outliers form prominent spikes in Figure 13.1, we might also try
a different smoothing approach. The tssmooth nl command performs outlier-resistant
nonlinear smoothing, employing methods and a terminology described in Vellemanand Hoaglin
(1981) and Velleman (1982). For example,
. tssmooth nl waterSr = water, smoother(5)
i
creates a new variable named water5r, holding the values of water after smoothing by running
medians of span 5. Compound smoothers using running medians of different spans, in
combination with “banning” (‘/4, ’/z, and Va -weighted moving averages of span 3) and other
techniques, can be specified in Velieman’s original notation. One compound smoother that
seems particularly useful is called “4253h, twice.” Applying this to water, we calculate
smoothed variable water4r:
. tssmooth nl water4r = water, smoother(4253h ,twice)
Figure 13.3 graphs new smoothed values, water4r. Compare Figure 13.3 with 13.2 to see
how the 4253h, twice smoothing performs relative to a moving-average. Although both
smoothers have similar spans, 4253h, twice does more to reduce the jagged variations.
i
-BX.
Time Series Analysis
345
Figure 13.3
o
o
o
o -
W 00
_o
O)q _
I
o
o
Ss<D<°
W
-TO ID
o
o daily water use
4253h, twice smooth
o
o
CO
Jani
Feb1
Marl
Apr1
May1
Jun1
Jul1
Aug1
nartST reSu0Ur 8
ln smoothing is t0 >ook for patterns in smoothed plots With these
particular data, however, the “rough” or residuals after smoothing actually hold more interest
We can calculate the rough as the difference between data and smooth and Z Z anh S
results in another time plot, Figure 13.4.
’
graph the
. generate rough = water - water4r
. label variable rough "Residuals from 4253h,
I
1 __
twice"
. graph twoway line rough date,
xlabel(8401 8432 8460 8491 8521 8552 8582 8613
grid format(%dmd)) xtitle("")
o
Figure 13.4
CM
o
o
So
E
u> o
gv
ID
’«
0)
CM
o
Jani
Feb1
Marl
Apr1
May1
Jun1
Jul1
Aug1
I
346
IJ
•Mi
Statistics with Stata
-1
The wildest fluctuations in Figure 13.4 occur around March 27-29. Water use abruptly
dropped, rose again, and then dropped even further before returning to more usual levels. On
these days, local newspapers carried stories that hazardous chemical wastes had been
discovered in one of the wells that supplied the town’s water. Initial reports alarmed people,
but they were reassured after the questionable well was taken offline.
The smoothing techniques described in this section tend to make the most sense when the
observations are equally spaced in time. For time series with uneven spacing, lowess regression
(see Chapter 8) provides a practical alternative.
r. i
Further Time Plot Examples
Dataset atlantic.dta contains time series of climate, ocean, and fisheries variables for the
northern Atlantic from 1950-2000 (the original data sources include Buch 2000. and others
cited in Hamilton, Brown, and Rasmussen 2003). The variables include sea temperatures on
Fylla Bank off west Greenland; air temperatures in Nuuk, Greenland’s capital city; two climate
indexes called the North Atlantic Oscillation (NAO) and the Arctic Oscillation (AO); and
catches of cod and shrimp in west Greenland waters.
Contains data from atlantic.dta
obs:
51
vars:
8
size:
1,734 (99.9% of memory free)
1 I
I
storage
type
display
format
year
fylltemp
fyllsal
nuuktemp
wNAO
int
float
float
float
float
%ty
%9.0g
%9.0g
%9.0g
%9.0g
wAO
tcodl
tshrimpl
float
float
float
%9.0g
%9.0g
%9.0g
variable name
Sorted by:
value
label
Greenland climate & fisheries
27 Jul 2005 12:41
variable label
Year
Fylla Bank temp, at 0-40r.
Fylla Bank salinity at 0-40m
Nuuk air temperature
Winter (Dec-Mar)
Lisbon-Stykkisholmur NAC
Winter (Dec-Mar) AO index
Division 1 cod catch, lOOSt
Division 1 shrimp catch, LOOOt
year
Before analyzing these time series, we tsset the dataset, which tells Stata that the
variable year contains the time-sequence information.
.
tsset year,
yearly
:ime variable:
year,
1950 to 2000
With a tsset dataset, two new qualifiers become available: tin (times in) and
twithin (times within). To list Fylla temperatures and NAO values for the years 1950
through 1955, type
111
i
list year fylltemp wNAO if tin(1950,1955)
1.
2.
3.
+---------I year
I---------I 1950
I 1951
I 1952
fylltemp
2.1
1.9
1^-6__
-----+
wNAO |
----- I
1.4 |
-1.26 |
_83_J__
rr
Time Series Analysis
4.
5.
6.
I 1953
I 1954
I---------I 1955
2.1
2.3
1.2
+--------
347
.18 |
.13 |
----------- I
-2.52 •
The twithin qualifier works similarly, but excludes the two endpoints:
list year fylltemp wNAO if twithin(1950,1955)
2.
3.
4.
5.
I
I year
I----I 1951
I 1952
I 1953
I 1954
fyl1 temp
1.9
1.6
2.1
2.3
wNAO |
----- I
-1.26 |
.83 |
.18 |
.13 |
-----+
We use ts smooth nl to define a new variable,fyll4, containing 4253h, twice smoothed
values Qifylltemp (data from Buch 2000).
tssmooth nl fyll4 = fylltemp, smoother(4253h,
.
twice)
Figure 13.5 graphs raw {fylltemp) and smoothed (fyll4) Fylla Bank temperatures. Raw
temperatures are shown as spike-plot deviations from the mean (1.67 °C), so this araph
emphasizes both decadal cycles and annual variations.
graph twoway spike fylltemp year, base (1.67) yline(1.67)
IIII line fy!14 year, cipattern(solid)
I I ' ytitie("Fylla Bank temperature, degrees
C") ylabel
degrees C")
ylabel(0(1)3)
(0 (1)3)
xtitle ("” ) xtick(1955(10)1995) legend(off)
.
Figure 13.5
o
O
v>
0)
fl>
CD
<D
TJ
(D CXI
2
ro
CD
1
E
0)
m
=
3^
o
I
1950
1960
1970
1980
1990
2000
The smoothed values of Figure 13.5
I
exhibit irregular periods of generally warmer and
cooler water. Of course, “warmer” i,is a relative term around Greenland; these summer sea
temperatures rise no higher than 3.34 °G(37 °F). -
348
Statistics with Stata
Fylla Bank temperatures are influenced by a large-scale atmospheric pattern called the
North Atlantic Oscillation, or NAO. Figure 13.6 graphs smoothed temperatures together with
smoothed values of the NAO (a new variable named wNA04). For this overlaid graph,
temperature defines the left axis scale, yaxis(l) , and NAO the right, yaxis(2) . Further
j^-axis options specify whether they refer to axis 1 or 2. For example, a horizontal line drawn
by yline(O, axis (2)) marks the zero point oftheNAO index. On both axes, numerical
labels are written horizontally. The legend appears at the 5 o’clock position inside the plot
space, position (5) ring(0) .
. graph twoway line fyll4 year, yaxis(l).
ylabel (0 (1)3 , angle(horizontal) nogrid axis(l))
ytitle("Fylla Bank temperature, degrees C", axis(l))
I | line wNA04 year, yaxis(2) ytitle("Winter NAO index", axis(2))
ylabel (-3 (1)3 , angle(horizontal) axis(2)) yline(0, axis(2))
II
, xtitleC") xlabel (1950 (10) 2000 , grid) xtick (1955 (5) 1 9 95 )
legend(label (1 "Fylla temperature") label (2 "NAO index") cols(l)
position(5) ring(0))
■ b
u
■
!'■
Figure 13.6
3
/
/
/
I
I
I
i
O
V)
o
r-
"\
3
\
\
\
\
\
I
I
I
I
I
I
I
/
T3
1 2
(D
I
!
2
■O
2
ro
O
<
0 z
E
o
0
11
\
\
CQ
=
I
I
■>%
V
bl
i i
I
1
I
t
\
■
.3
I /
/
I
k
\
/ /
I
-2
I
I
Fylla temperature
NAO index
0
1950
1960
1970
1980
1990
-3
2000
Overlaid plots provide a way to visually examine how several time series vary together.
In Figure 13.6, we see evidence of a negative correlation: high-NAO periods correspond to low
temperatures. The physical mechanism behind this correlation involves northerly winds that
bring Arctic air and water to west Greenland during high-NAO phases. The negative
temperature-NAO correlation became stronger during the later part ofthis time series, roughly
the years 1973 to 1997. We will return to this relationship in later sections.
I ■!
T
Time Series Analysis
349
Lags, Leads, and Differences
Time series analysis often involves lagged variables, or values from previous times Lags can
specified by explicit subscnpttng. For example, the following command creates variable
n >JAO_1, equal to the previous year's NAO value:
variable
I
•generate wNA0_l = vWA0[_n-l]
(x missing value generated)
An alternative way to achieve the same thing, using tsset data, is with Stata’s L. (lag)
operator:
•generate wNAO_l = L.wNAO
(- missing values generated)
Lag
Udg operators
operators are
are often
often simpler
simpler than
than an explicit-subscripting approach. More imnortantl v the
lag opeiators also respect panel data. To generate lag 2 values, use
Y’
•generate wNAO_2 = L2.wNAO
(2. missing values generated)
list year wNAO wNA0_l wNA0_2 if tin(1950,1954)
•
3
4
5
I year
I---------I 1950
I 1951
I 1952
I 1953
I 1954
WrlAO
1.4
-1.26
.83
. 18
.13
wNA0_2 |
-------------I
1.4
.26
.83
.18
1.4 J
-1.26 |
.83 |
We could have obtained this same list without generating any new variables, by instead typing
I
I
I
.
list year wNAO L.wNAO L2.wNAO if tin(1950,1954)
The L. operator is one of several that simplify the analysis of tsset datasets Other
ttme series operators arc F. (lead). D. (difference), and S. (seasonal difference) ’ Sese
operators can be typed in upper or lowercase-for example, F2 . wNAO or f2.wNAO.
Time Series Operators
l.
Lag y, 1 ( LI. means the same thing)
L2.
2-period lag r.., (similarly. L3.,etc. L(l/4)
L4 .)
I
I
I
I
means LI. through
F.
Lead v/+, ( Fl. means the same thing)
F2 .
2-period lead(similarly, F3 ., etc.)
D.
Differencey,
D2.
Second difference (y,-y,.,)
S.
Seasonal differencey,-yf |, (which is the same as D.)
S2 .
Second seasonal difference (y, -y,_2) (similarly, S3 ., etc.)
(DI. means the same thing)
J (similarly, D3.,etc.)
XXX' differen«s S12 . does not mean “12th difference,” but rather a first
difference at lag 12. For example, if we had monthly temperatures instead of yearly, we might
JI
350
r
Statistics with Stata
want to calculate S12 . temp . which would be the differences between December 2000
temperature and December 1999 temperature, November 2000 temperatures and November
1999 temperature, and so forth.
Lag operators can appear directly in most analytical commands. We could regress 1973-97
fylltemp on wNAO, including as additional predictors wNAO values from one, two, and three
years previously, without first creating any new lagged variables.
. regress
1
fylltemp wNAO Ll.wNAO L2.wNAO L3.wNAO if tin(1973,1997)
Source I
---------- +
Model |
Residual |
--------- +
Total |
ir
St
fylltemp
wNAO
LI
L2
L3
cons
B
i
i
i
I
I
I
ss
df
MS
3 . 1884913
3.48929123
4
20
.797122826
.174464562
6.67778254
24
.278240939
Coef.
Err .
t
P> 111
- . 1688424
.0043805
- . 0472993
.0264682
1.727913
.2412995
. 0421436
. 050851
.0495416
. 1213588
-4.09
0.10
-0.93
0.53
14.24
0.001
0.918
0.363
0.599
0.00 0
Number of obs =
Ft
4,
20) =
Prob > F
R-squared
Adj R-squared =
Root MSE
2c
4 . 57
0.0088
0.4775
0.3 7 30
.41769
[95% Conf.
terva11
-.2549917
- .0835294
-.1533725
- .0768738
1.474763
. 0826931
.0922905
.058774
.1298102
1.981063
Equivalently, we could have typed
.
regress
fylltemp L(0/3).wNAO if tin(1973,1997)
The estimated model is
predictedfylltemp, = 1.728
Coefficients on the lagged terms are not statistically significant: it appears that current
(unlagged) values of wNAO, provide the most parsimonious prediction. Indeed, if we reestimate this model without the lagged terms, the adjusted R2 rises from .37 to .43. Either
model is very rough, however. A Durbin-Watson test for autocorrelated errors is inconclusive,
but that is not reassuring given the small sample size.
I"
b'
.
dwstat
Durbin-Watson d-statistic(
5
25) =
1 . 423806
Autocorrelated errors, commonly encountered with time series, invalidate the usual OLS
confidence intervals and tests. More suitable regression methods for time series are discussed
later in this chapter.
ill
1
-r'1
1
169uArJQ + .004h\V^Q -.047wM4Of2 + .026vvAC40.3
J
Time Series Analysis
351
Correlograms
Autocorrelation coefficients estimate the correlation between a variable and itself at particular
lags. For example, first-order autocorrelation is the correlation betweeny and y . Second
order refers to Cor[r„ r,,]. and so forth. A correlogram graphs correlation versus "lags.
Stata’s corrgram command provides simple correlograms and related information The
maximum number of lags it shows can be limited by the data, by matsize , or to some
arbitrary lower number that is set by specifying the lags () option:
. corrgram fylltemp, lags(9)
LAG
1
2
3
4
5
6
7
8
9
■
I
AC
0.4038
0.1996
0.0788
0.0071
-0.1623
-0.0733
0.0490
-0.1029
-0.2228
0.4141
0.056~
0.0045
-0.055c
-0.2232
0.0880
0.136"
~j
2
~
Q
Prob>Q
8.8151
11.012
11.361
11.364
12.912
13.234
13.382
14.047
17.243
0.0030
0.0041
0.0099
0.0228
0.0242
0.0395
0.0633
0.0805
0.0450
-1
0
1-1
0
1
(Autocorrelation]
[Partial Autocor]
I—
II
I
-I
I
I
I
-I
I -I
I
I
-1
I
I--I
--1
Lags appear at the left side of the table, and are followed by columns for the autocorrelations
(AC) and partial autocorrelations (PAC). For example, the correlation betweenfylltemp and
jylltemp ,_2 is .1996, and the partial autocorrelation (adjusted for lag 1) is 0565 The Q
statistics (Box-Pierce portmanteau) test a series of null hypotheses that all autocorrelations up
to and including each lag are zero. Because the P-values seen here are mostly below .05, we
can reject the null hypothesis, and conclude that.fylltemp shows significant autocorrelation. If
none of the Q statistics had been below .05, we might conclude instead that the series was
white noise” with no significant autocorrelation.
At the right in this output are character-based plots of the autocorrelations and partial
autocorrelations. Inspection of such plots plays a role in the specification of time series models.
More refined graphical autocorrelation
’ ’ .plots
‘ i can be obtained through the ac command:
. ac fylltemp, lags(9)
The resulting correlogram, Figure 13.7, includes a shaded area marking pointwise 95%
confidence intervals. Correlations outside of these intervals are individually significant.
'fl
352
J
Statistics with Stata
Figure 13.7
o
o
I
1°
I
o§
re o
<u
o
°o
<2
ts
i
o
o
0
2
4
6
8
Lag
j
10
Bartlett's formula for MA(q) 95% confidence bands
■!
h
A similar command, pac , produces the graph of partial autocorrelations seen in Figure
13.8. Approximate confidence intervals (estimating the standard error as l/x/n~) also appear in
Figure 13.8. The default plot produced by both ac and pac has the look shown in Figure
13.7. For Figure 13.8 we chose different options, drawing a baseline at zero correlation, and
indicating the confidence interval as an outline instead of a shaded area.
. pac fylltemp, yline(O) lags(9) ciopts(bstyle(outline))
-
Figure 13.8
o
|
p
o
CL
E
re
Jg
c
o
i
co
re
1
8o ?o
3
re
4
t
re
Q-o
CXI
o
0
2
4
6
Lag
95% Confidence bands (se = 1/sqrt(n)]
.s’
8
10
Time Series Analysis
353
Cross-correlograms help to explore relationships between two time series Fieure 13 9
fr.±r;Xo2^zsev"aly’“Re^
xcorr vNAO fylltemp if tin(1973,1997) , lags(9)
xlabel (-9 (1)9,
Figure 13.9
Cross-correlogram
o
grid)
o
I
8
co
o
CD
o
<
z
$ o
J
c
o
I
1 .
J
J J
1 •
1
o
o
to
h
8
??
OT
o
tt
O
6
o
o
q
-9 -8 -7 -6 -5 -4 -3 -2-10 1
Lag
i
2
3
4
5
6
7
8
9
Ifwe list our input or independent variable first in the xcorr <
- command, and the output
or dependent variable second - as was done for Figure 13.9 - then positive lags denote
corre ations between input at time t and output at time t +1, / +2, etc. Thus we see a positive
correlation of .394 between winter NAO index and Fylla temperature four’vears later
“,eX, VerSi“ °f ""
be
I
i
. xcorr wNAO fylltemp if tin (1973,1997) ,
LAG
I
-9
-8
-7
-6
-5
-4
-3
-2
-1
0
1
2
CORR
-1
0
1
[Cross-correlation]
-0.0541
-0.0786
0.1040
-0.0261
-0.0230
0.3185
0.1212
0.0053
-0.0909
-0.6740
-0.1386
-0.0865
I
I
I
I
I
I—
I
I
I
-I
-I
I
lags (9)
table
354
3
4
5
6
7
8
9
I
I
i
I
r'i
r
Statistics with Stata
0.0-57
0.3940
0.2464
0.1100
0.0183
-0.2699
-0.3042
i
i -ii
i
--1
--1
ARIMA Models
Autoregressive integrated moving average (ARIMA) models for time series can be estimated
through the arima command. This command encompasses simple autoregressive (AR),
moving ax erage (MA), or ARIMA models of any order. It also can estimate structural models
that include one or more predictor variables and AR or MA errors. The general form of such
structural models, in matrix notation, is
i
[13 J]
=x,P + p,
where y, is the vector of dependent-variable values at time t, x, is a matrix ofpredictor-variable
values (usually including a constant), and p, is a vector of disturbances. Those disturbances
can be autoregressive or moving-average, of any order. For example, ARMA( 1,1) disturbances
are
R; -PR,-!
4-e,
[13.2]
where p is the first-order autocorrelation parameter, 6 is the first-order moving average
parameter, and € is a white-noise (normal i.i.d.) disturbance, arima fits simple models as
a special case of [13.1] and [13.2], with a constant (p 0) replacing the structural term xt p.
Therefore, a simple ARMA( 1,1) model becomes
y. =Po + R;
= Po + PR/-i +0e,_I +e,
[13.3]
Some sources present an alternative version. In the ARMA(1,1) case, they show as a
function of the previous y value (y,_,) and the present (g ,) and lagged (g
disturbances:
j\ = a + py,_I +0g/_i 4-g,
[13.4]
Because in the simple structural model y, = p 0 + p ,, equation [13.3] (Stata’s version) is
equivalent to [ 13.4], apart from rescaling the constant a = (l-p)P 0.
Using arima , an ARMA(1,1) model (equation [13.3]) can be specified in either of two
ways:
i
arima y,
ar(1)
arima y,
arima(l,0,l)
ma(1)
or
The i in arima stands for “integrated,” referring to models that also involve differencing.
To fit an ARIMA(2,1,1) model, use
.
arima y,
arima(2,1,1)
or equivalently.
0
r
Time Series Analysis
.
i
I
I
I
355
arima D.y, ar(l 2) ma(l)
Either command specifies a model in which first differences of the dependent variable (y. - v, ,)
are a function of first differences one and two lags previous
-yt_2 and y,_2 - V/ 3) and also
of present and previous disturbances (e, and
To estimate a structural model in which y, depends on two predictor variables .v (present
and lagged values, x, and x,.!) and w (present values only, w,), with ARIMA( 1,0,1) errors, an
appropriate command would be
arima y x L.x w, arima(1,0,1)
Although seasonal differencing (e.g., S12 .y) and/or seasonal lags (e.g., L12 . x ) can be
included, as of this writing arima does not estimate multiplicative ARlMA(p,r/,^)(P.Z).(?) s
seasonal models.
I
A time series y is considered “stationary” if its mean and variance do not change with time,
and if the covariance betweeny, andy,+„ depends only on the lag u, and not on the particular
values oft. ARIMA modeling assumes that our series is stationaiy, or can be made stationary
through appropriate differencing or transformation. We can check this assumption informally
by inspecting time plots for trends in level or variance. Formal statistical tests for “unit roots”
(a nonstationary AR(1) process in which p, = 1, also known as a “random walk”) also help
Stata offers three unit root tests, pperron (Phillips-Perron), dfuller (augmented
Dickey-Fuller), and dfgls (augmentedDickey-FullerusingGLS,generally a more powerful
test than dfuller).
Applied to Fylla Bank temperatures, a pperron test rejects the null hypothesis of a unit
root (P<.01).
. pperron fylltemp, lag(3)
Phillips-Perron test for unit root
Z(rho)
Z(t)
I
Number of obs
=
Newey-West lags =
Test
Statistic
1% Critical
Value
-29.871
-4.440
-18.900
-3.580
50
3
Interpolated Dickey-Fuller -------5% Critical
10% Critical
Value
Value”
-13.300
-2.930
-10
-2
:o
:o
MacKinnon approximate p-value for Z(t) = 0.0003
Similarly, a Dickey-Fuller GLS test evaluating the null hypothesis thatfylltemp has a unit
route (versus the alternative hypothesis that it is stationary with a possibly nonzero mean but
no linear time trend) rejects this null hypothesis (P < .05). Both tests thus confirm the visual
impression of stationarity given by Figure 13.5.
356
.
Statistics with Stata
dfgls
fylltemp,
notrend maxlag(3)
DF-GLS for fylltemp
r
Number of obs =
47
(lags]
DF-GLS mu
Test Statistic
1% Critical
Value
5% Critical
Value
10% Critical
Value
3
2
1
-2.304
-2.479
-3.008
-2.620
-2.620
-2.620
-2.211
-2.238
-2.261
-1.913
-1.938
-1.959
Opt Lag (Ng-Perron seq t) = 0 [use maxlag (0)]
Min SC
- -.6735952 at lag 1 with RMSE .6578912
Min MAIC = -.2683716 at lag
2 with RMSE .6569351
For a stationary series, correlograms provide guidance about selectine a preliminary
ARIMA model:
AR(/7)
An autoregressive process of order p has autocorrelations that damp out
gradually with increasing lag. Partial autocorrelations cut off after lag p.
Amoving average process of order q has autocorrelations that cut off after lag
q. Partial autocorrelations damp out gradually with increasing lag.
ARMAQ?,#)
A mixed autoregressive-moving average process has autocorrelations and
partial autocorrelations that damp out gradually with increasing lag.
Correlogram spikes at seasonal lags
example,
- (for
.
. . at 12, 24, 36 iin monthly data) indicate a
seasonal pattern. Identification of seasonal models follows similar guidelines, but applied to
autocorrelations and partial autocorrelations at seasonal lags.
Figures 13.7-13.8 weakly suggest an AR(1) process, so we will try this as a simple model
forfylltemp.
MA(r/)
. arima fylltemp, arima (1,0,0)
'' !
nolog
ARIMA regression
Sample:
1950 to 2000
Number of obs
Wald chi2(l)
Prob > chi2
Log likelihood = -48.66274
!
fylltemp
I
I
Coef.
OPG
Std. Err.
z
P> I z I
[95% Conf. Interval]
1.68923
.1513096
11.16
0.000
1.392669
1.935792
.4095759
.1492491
2.74
0.006
.1170531
.7C20987
. 627151
.0601859
10.42
0.000
. 5091889
.7451131
+
fylltemp
cons
ARMA
ar
I
I
I
I
LI I
----- +
/sigma |
51
7.53
0.0061
After we fit an arima model, its coefficients and other results are saved temporarily in
Stata’s usual way. For example, to see the recent model’s AR(1) coefficient and s.e., type
. display
.4095759
[ARMA]_b[LI.ar]
. display
. 14924909
[ARMA]_se[LI.ar]
I
Time Series Analysis
357
1 )kCOefficient in this examP'e is statistically distinguishable from zero (t = 2
P
appear to be uncorrelated “white
noise.” ’We can obtain residuals (also predicted values, and
-------------other case statistics) after arima through predict
-
predict fyllres,
resid
. corrgram fyllres, lags(15)
LAG
I
i
I
1
2
3
4
5
6
7
8
9
10
11
12
13
14
15
AC
PAC
Q
Prob>;
-0.0173
0.0467
0.0386
0.0413
-0.1834
-0.0498
0.1532
-0.0567
-0.2055
-0.1156
0.1397
-0.0028
0.1091
0.1014
-0.0673
0.0176
0.0465
0.0497
: .0496
: .2450
: .0602
: .2156
. 0726
. 3232
.2418
.2794
. 1606
. 0647
. 0547
. 2837
.0162
.13631
.22029
.31851
2.2955
2.4442
3.8852
4.087
6.8055
7.6865
9.0051
9.0057
9.8519
10.603
10.943
0.89-"
0.9341
0.9742
0.9866
0.806?
0.874’
0.792?
0.84?2
0.65’4
0.6594
0.6214
0.7024
0.7061
0.716?
0.7566
-1
i -i
o
i
[Aur : orrelation]
[Partial Autocor]
i -
II
corrgram’s 0 test finds no ‘significant autocorrelation among residuals out to las 15. We
could obtain exactly the same result by requestins
j a wntestq (white noise test Q statistic)
for 15 lags.
.
wntestq fyllres,
lags(15)
Portmanteau test for white noise
I
Portmanteau (Q)
Prob > chi2(15)
statistic =
10.9435
0.7566
By these criteria, our AR(1) or ARIMA(l,0,0) model appears adequate
More complicated
versions, with MA or higher-order AR terms, do not offer much improvement in fit.
A similar AR(1) model ^sfylltemp over just the years 1973-1997. During this period
however, information about the winter North Atlantic Oscillation (wNAO) '’significantly
improves the predictions. For this model, we include wNAO as
a predictor but keep an AR(I)
term to account for autocorrelation of errors.
358
.
Statistics with Stata
arima fylltemp wNAO if tin(1973,1997) , ar(l) nolog
ARIMA regression
Sample:
1973 to 1997
Log likelihood =
Ir
Number of cbs
Wald chi2(2)
Prob > chi2
-10.3481
Coef.
OPG
Std. Err.
z
P> I z I
-.1736227
1.703462
.0531688
.1348599
-3.27
12.63
0.001
0.000
-.2778317
1.439141
Ll
I
I
I
.2965222
.237438
1.25
0.212
- . 1688478
/sigma
|
.36536
.0654008
5.59
0.000
.2371767
fylltemp
fylltemp
wNAO
cons
I
I
I
----- +
ARMA
ar
[95% Conf.
0.001-
In e r v a
96-7=2
. predict fyllhat
(option xb assumed; predicted values)
label variable fyllhat "predicted temperature"
.
predict fyllres2,
resid
. corrgram fyllres2, lags(9)
LAG
lib
!
1
2
3
4
5
6
7
8
9
AC
0.1485
-0.1028
0.0495
0.0887
-0.1690
-0.0234
0.2658
-0.0726
-0.1623
PAC
0.1529
-0.1320
0.1182
0.0546
-0.2334
0.0722
0.3062
-0.2236
-0.0999
Q
Prob>Q
1.1929
1.7762
1.9143
2.3672
4.0447
4.0776
8.4168
8.7484
10.444
0.2747
0.4114
0.5904
0.6686
0.5430
0.6662
0.2973
0.3640
0.3157
-1
0
1 -1
0
1
[Autocorrelation]
[Partial Autocorj
II
I
I
-I
I
I -I
-I
I-I
-I
wNAO has a significant, negative coefficient in this model. The AR( 1) coefficient now is
not statistically significant. If we dropped the AR term, however, our residuals would no longer
pass corrgram’s test for white noise. Figure 13.10 graphs the predicted values, fyllhat,
together with the observed temperature series fylltemp. The model does reasonably well in
fitting the main warming/cooling episodes and a few of the minor variations. To have the v-axis
labels displayed with the same number ofdecimal places (0.5,1.0,1.5,... instead of.5,1. 1.5,...)
in this graph, we specify their format as %2 . If .
2
Time Series Analysis
graph twoway line fylltemp year if tin (1973, 1997)
I I line fyllhat year if tin(1973, 1997)
I I , ylabel ( . 5 ( .5)2.5, angle(horizontal) format(%2.If))
ytitie ( "Degrees C")) :
—---xlabel(1975(5)1995,
grid) xtitle("" )
legend(label (1 "observed temperature")
label (2 "model prediction") position(5) ring(O) col(l))
•
I
I
Figure 13.10
2.5
I
I
359
2.0
Q
w
(D
<D
O)
(V
Q
I
0.5
1975
1980
1985
1990
1995
A technique called Prais-Winsten regression ( prais ), which corrects for first-order
autoregressive errors, can also be illustrated with this example.
. prais fylltemp wNAO if tin (1973,1997) , nolog
Prais-Winster. AR(1) regression
Source
SS
iterated estimates
df
MS
Model |
Residual I
3.3581925=
3.33743545
1
23
3.35819258
.145105889
Total |
6.69562833
24
.278984501
Number of obs =
F( 1,
23) =
Prob > F
=
R-squared
Adj R-squared =
Root MSE
fylltemp I
-------- +
wNAO |
cons |
Soef.
Std. Err
t
P> i t
-.17356
1.703436
.037567
.1153695
-4 . 62
14 . 77
0.000
0.000
rho |
.2951576
---- +
25
23.14
0.0001
0.5016
0.4799
.38093
[95% Conf. Interval]
-.2512733
1.464776
-.0958468
1 . 942096
Durbin-Watson statistic (original)
1.344998
Durbin-Watson statistic (transformed) 1.789412
prais is an older method, more specialized than arima. Its regression-based standard
errors assume that rho (p) is known rather than estimated. Because that assumption is untrue,
t. •
* .1.
360
Statistics with Stata
the standard errors, tests, and confidence intervals given by prais tend to be anti
conservative, especially in small samples, prais provides a Durbin-Watson statistic (d =
1.789). In this example, the Durbin-Watson test agrees that after fitting the model, no
significant first-order autocorrelation remains.
lb
b bi
I
Introduction to Programming
I
I
I
As mentioned in Chapters 2 and 3. we can create a simple type of proeram by writing any
sequence of Stata commands in a text (ASCII) file. Stata's Do-file Edito?(click on Windrow o-file Editor or the icon
) provides a convenient way to do this. After saving the do-file,
we enter Stata and type a command with the form do filename that tells Stata to read
Jilename.do and execute whatever commands it contains. More sophisticated programs are
possible as well, making use of Stata's built-in programming language. Many of the commands
used in previous chapters actually involve programs written in Stata. These programs might
have originated either from Stata Corporation or from users who wanted something beyond
Stata s built-in features to accomplish a particular task.
Stata programs can access all the existing features of Stata, call other programs that call
other programs in turn, and use model-fitting aids including matrix algebra and maximum like
lihood estimation. Whether our purposes are broad, such as adding new statistical techniques
or narrowly specialized, such as managing a particular database, our ability to write programs
in Stata greatly extends what we can do.
Substantial books (Stata Programming Reference Manual; Mata Reference ManualMaximum Likelihood Estimation with Stata) have been written about Stata programming. This
engaging topic is also the focus of penodic NetCourses (see www.stata.com) and a section of
the L ser s Guide. The present chapter has the modest aim of introducing a few basic tools and
giving examples that show how these tools can be used.
Basic Concepts and Tools
Some elementary concepts and tools, combined with the Stata capabilities described in earlier
chapters, suffice to get started.
Do-files
Do-files are ASCII (text) files, created by Stata’s Do-file Editor, a word processor, or any other
text editor. They are typically saved with a .do extension. The file can contain any sequence
o legitimate Stata commands. In Stata, typing the following command causes Stata to read
Jilename.do and execute the commands it contains:
i
. do filename
361
362
Statistics with Stata
Each command \n filename.do. including the last, must end with a hard return — unless we
have reset the delimiter to some other character, through a # de limit command. For
example.
This sets a semicolon as the end-of-line delimiter, so that Stata does not consider a line finished
until it encounters a semicolon. Setting the semicolon as delimiter permits a single command
to extend over more than one physical line. Later, we can reset “carriage return" as the usual
end-of-line delimiter by typing the following command:
# delimiter
J
Ado-files
Ado (automatic do) files are ASCII files containing sequences of Stata commands, much like
do-files. The difference is that we need not type do filename in order to run an ado-file.
Suppose we type the command
.
clear
As with any command, Stata reads this and checks whether an intrinsic command by this name
exists. If a clear command does not exist as part of the base Stata executable (and, in fact,
it does not), then Stata next searches in its usual “ado" directories, trying to find a file named
clear.ado. If Stata finds such a tile (as it should), it then executes whatever commands the file
contains. Ado-files have the extension .ado. User-written programs commonly go in a
directory named C:\ado\personaL whereas the hundreds of official Stata ado-files get installed
in C:\stata\ado. Type sysdir to see a list of the directories Stata currently uses. Type
help sysdir or help adopath for advice on changing them.
■
4 ■
The which command reveals whether a given command really is an intrinsic, hardcoded
Stata command or one defined by an ado-file; and if it is an ado-file, where that resides. For
example, logit is a built-in command, but the logistic command is defined by an adofile named logistic.ado:
if
I.
. which logit
built-in command:
i
which logistic
C:\STATA\ado\base\1\logistic.ado
*! version 3.1.9 01oct2002
J
This distinction makes no difference to most users, because logit and logistic work
with similar ease and syntax when called.
Programs
Both do-files and ado-files might be viewed as types of programs, but Stata uses the word
“program” in a narrower sense, to mean a sequence of commands stored in memory and
executed by typing a particular program name. Do-files, ado-files, or commands typed
interactively can define such programs. The definition begins with a statement that names the
program. For example, to create a program named count5, we start with
program counts
k
Introduction to Programming
363
Next should be the lines that actually define the progi;ram. Finally, we give an end command.
followed by a hard return:
end
Once Stata has read the program-definition commands, it retains that definition of the
program in memory and will run it any time we type the program’s name as a command:
counts
Programs effectively make new commands available within Stata, so most users do not need
to know whether a given command comes from Stata itself or from an ado-file-de fined program.
As we start to write a new program, we often create preliminary versions that are
incomplete or just unsuccessful. The program drop command provides essential help
here, allowing us to clear programs from memory so that we can define a new version For
example, to clear program count5 from memory, type
• program drop counts
To clear all programs (but not the data) from memory, type
• program drop _all
Local Macros
I
Macros are names (up to 31 characters) that can stand for strings, program-defined results, or
user-defined values. A local macro exists only within the program that defines it, and cannot
be referred to in another program. To create a local macro named iterate, standing for the
number 0, type
local iterate = 0
i
To refer to the contents of a local macro (0 in this example), place the macro name within
left and right single quotes. For example,
display 'iterate*
0
i
Thus, to increase the value of iterate by one, we write
local iterate = 'iterate*
+ 1
Global Macros
Global macros are similar to local macros, but once defined, they remain in memory and can
be used by other programs. To refer to a global macro’s contents, we preface the macro name
with a dollar sign (instead of enclosing the name in left and right single quotes as done with
local macros):
global distance = 73
display $distance * 2
146
364
Statistics with Stata
Version
I■
r
Stata s capabilities and features have changed over the years. Consequently, programs written
for an older version of Stata might not run directly under the current version. The version
command works around this problem so that old programs remain usable. Once we tell Stata
for what version the program was written, Stata makes the necessary adjustments and the old
program can run under a new version of Stata. For example, if we begin our program with the
following statement. Stata interprets all the program’s commands as it would have in Stata 6:
version 6
Comments
Stata does not attempt to execute any line that begins with an asterisk. Such lines can therefore
be used to insert comments and explanation into a program, or interactively during a Stata
session. For example.
* This entire line is a comment.
Alternatively, we can include a comment within an executable line. The simplest way to do so
is to place the comment after a double slash, / / (with at least one space before the double
slash). For example,
summarize income education
// this part is the comment
A triple slash (also preceded by at least one space) indicates that what follows, to the end of the
line, is a comment; but then the following physical line should be executed as a continuation
of the first. For example,
summarize income education
occupation age
I
/// this part is the comment
will be executed as if we had typed
summarize income education occupation age
I
With or without comments, the triple slash provides an easy way to include long command lines
in a program. For example, the following lines would be read as one table command, even
though they are separated by a hard return.
table gender kids school if contam
median lived count lived)
1, contents(mean lived ///
If our program has more than a few long commands, however, the # de limit ; approach
(described earlier; also see help delimit) might be easier to write and read.
It is also possible to include comments in the middle of a command line, bracketed by / *
and */. For example,
summarize income /* this is the comment */ education occupation
If one line ends with / * , and the next begins with * / , then Stata skips over the line break
and reads both lines as a single command — another line-lengthening trick sometimes found
in programs.
J
7
%
Introduction to Programming
365
Looping
There are a number of ways to create program loops. One simple method employs the
orvalues command. For example, the following program counts from 1 to 5.
* Program that -counts from one to five
program counts
version 8.0
forvalues i = 1/5 {
display 'i’
I
}
end
By typing these commands, we define program <counts
• - . Alternatively,
*<
we could use the
Do-file Editor to save the same series of commands as an ASCII file named co Jnt5 "do
....... .... . Then,
typing the following causes Stata to read the file:
do counts
Either way, by defining program counts we make this available as a new command:
counts
1
2
3
4
5
The command
forvalues i = 1/5 {
assigns to local macro i the consecutive integers from 1 through 5. The command
display 'i’
shows the contents of this macro. The name i is arbitrary. A slightly different notation
would allow us to count from 0 to 100 by fives (0, 5, 10,..., 100):
forvalues j = 0(5)100
{
Mh00St4Pmb?7rn Vacn7need nOt be integerS- T° C0Unt from 4 t0 5 by increments of .01
(H.uu, 4.ui, 4.02,..., 5.00), write
forvalues k = 4(.01)5 {
Any lines containing valid Stata commands, between the opening and closing curly brackets { }
wi l be executed repeatedly for each of the values specified. Note that nothing (on that line)
follows the opening bracket, and that the closing bracket requires a line of its own.
The foreach command takes a different approach. Instead of specifying a set of
consecutive numerical values, we give a list of items for which iteration occurs. These items
could be variables, files, strings, or numerical values. Type help foreach to see the
syntax of this command.
I
forvalues and foreach create loops that repeat for a pre-specified number oftimes
If we want looping to continue until some other condition is met, the while command is
useful. A section of program with the following general form will repeatedly execute the
commands within curly brackets, so long as expression evaluates to “true”:
366
Statistics with Stata
while expression {
command A
command B
}
command Z
i!
As in previous examples, the closing bracket } should be on its own separate line, not at the
end of a command line.
When expression evaluates to “false,” the looping stops and Stata goes on to execute
command Z. Parallel to our previous example, here is simple program that uses a while loop
to display onscreen the iteration numbers from 1 through 6:
* Program thaz counts from one to six
program count6
version 8.C
local iterate = 1
while 'iterate’ <= 6 {
display 'iterate'
local iterate = 'iterate’ + 1
1
end
! I
i
■0
■
A second example of a while loop appears in the gossip, ado program described later in this
chapter. The Programming Reference Manual contains more about programming loops.
If ... else
The if and else commands tell a program to do one thing if an expression is true, and
something else otherwise. They are set up as follows:
if expression
command A
command B
i ■
i*
{
}
else {
command Z
}
For example, the following program segment checks whether the content of local macro
span is an odd number, and informs the user of the result.
I
if int ( 'span’, 2) ! = ('spa.'.’ - l)/2 {
display "span is NOT ar. odd number”
}
else {
display "span is an odd number”
}
Arguments
1
Programs define new commands. In some instances (as with the earlier example, counts ),
we intend our command to do exactly the same thing each time it is used. Often, however, we
need a command that is piodified by-arguments-such as variable names or options. There are
Introduction to Programming
367
two ways we can tell Stata how to read and understand a command line that includes arguments.
The simplest of these is the args command.
The following do-file (listres 1 .do) defines a program that performs a two-variable
regression, and then lists the observations with the largest absolute residuals.
* Perform simple regression and lis- observations with
* largest absolute residuals.
*
listresl Yvariable Xvariable # ZDvariable
program listresl, sortpreserve
version 8.0
args Yvar Xvar number-id
quietly regress 'Yvar’ 'Xvar'
capture drop Yhat
capture drop Resid
capture drop Absres
quietly predict Yhat
quietly predict Resid, resid
quietly gen Absres = abs(Resid)
gsort -Absres
drop Absres
list 'id' 'Yvar' Yhat Resid in
number'
end
I
I
w
The line args Yvar Xvar number id tells Stata that the command listresid
should be followed by four arguments. These arguments could be numbers, variable names,
or other strings separated by spaces. The first argument becomes the contents of a local macro
named Yvar , the second a local macro named Xvar , and so forth. The program then uses
the contents of these macros in other commands, such as the regression:
quietly regress 'Yvar’
'Xvar*
The program calculates absolute residuals (Absres), and then uses the gsort command
(followed by a minus sign before the variable name) to sort the data in high-to-low order, with
missing values last:
gsort -Absres
The option sortpreserve on 1the
‘ command line makes this program ’’sort-stable": it
returns the data to their original order after the calculations are finished.
Dataset nations.dta, seen previously in Chapter 8, contains variables indicating life
expectancy (life), per capita daily calories (food), and country' name (country) for 109 countries.
We can open this file, and use it to demonstrate our new program. A do command runs dofile listresl.do, thereby defining the program listresl :
do listresl.do
I
j
i
J
Next, we use the newly-defined listresl command, followed by its four arguments.
The first argument specifies they variable, the second x, the third how many observations to
list, and the fourth gives the case identifier. In this example, our command asks for a list of
observations that have the five largest absolute residuals.
•
listresl life food 5 country
■
368
Statistics with Stata
+------------I country
I
i. I
Libya
2. I
Bhutan
3. I
Panama
4 . I Malawi
5 . I Ecuador
life
Yhat
60
44
72
45
66
76.6901
60.49577
58.13118
58.58232’
52.45305
Resid |
--------- I
-16.69011 |
-16.49577 |
13.86882 |
-13.58232 |
13.54695 |
Life expectancies are lower than predicted in Libya, Bhutan, and Malawi. Conversely, life
expectancies in Panama and Ecuador are higher than predicted, based on food supplies.
1
Syntax
The syntax command provides a more complicated but also more powerful way to read a
command line. The following do-file named Ustres2.do is similar to our previous example, but
it uses syntax instead of args:
I; ;■
I
I
1
Perform simple or multiple regression and list
observations with # largest absolute residuals.
Iistres2 yvar xvarlist [if] [in], number(#) [id(varname
program listres2, sortpreserve
version 8.0
syntax varlist(min=l) [if] [in], Number(integer) [Id(string)]
marksample touse
quietly regress 'varlist' if 'touse’
capture drop Yhat
capture drop Resid
capture drop Absres
quietly predict Yhat if 'touse’
quietly predict Resid if 'touse ’ , resid
quietly gen Absres = abs(Resid)
gsort -Absres
drop Absres
list 'id' ' 1' Yhat Resid in l/'number’
end
listres2 has the same purpose as the earlier listresl: it performs regression, then
lists observations with the largest absolute residuals. This newer version contains several
improvements, however, made possible by the syntax command. It is not restricted to twovariable regression, as was listresl . Iistres2 will work with any number of
predictor variables, including none (in which case, predicted values equal the mean ofy. and
residuals are deviations from the mean).
list res 2 permits optional if and in
qualifiers. A variable identifying the observations is optional with listres2 , instead of
being required as it was with listresl. For example, we could regress life expectancy on
food and energy, while restricting our analysis to only those countries where per capita GNP
is above 500 dollars:
Introduction to Programming
•
do Hstres2.do
.
Iistres2 life food energy if gnpcap > 500,
1.
2.
3.
4 .
5.
6.
I
country
I-----------------I YemenPDR
I
YemenAR
I
Libya
I S_Africa
I HongKong
I
I
Panama
life
46
45
60
55
76
n(6)
369
i(country)
Res i i
.34964
.85839
. 6251 6
".9146
6 4.6 4 12 2
-15.34964 |
-14.85839 !
-13.62516 I
-12.9146 !
11.35978 j
72
10.22211
The syntax line in this example illustrates some general features of the command:
I
syntax varlist (17.1.1 = 1)
[if]
[in]
[in] ,.
Number < integer)
[Id(string)]
The variable list fora listres2 command is required to contain at least one variablename
(varlist(min=l) ). Square brackets denote optional arguments — in this example the
if and m qualifiers, and also the id() option. Capitalization of initial letters for the
options indicates the minimum abbreviation that can be used. Because the syntax line in
our example specified Number (integer) Id (string). an actual command could be
written:
.
Iistres2 life food,
number(6)
id(country)
Or, equivalently,
I
*
listres2 life food,
n(6)
i(country)
The contents of local macro number are required to be an integer, and id is a string (such
as country, a variable’s name).
This example also illustrates the marksample command, which marks the subsample
(as qualified by if and in ) to be used in subsequent analyses.
The syntax of syntax is outlined in the Programming Manual. Experimentation and
studying other programs help in gaining fluency with this command.
Example Program: Moving Autoc o r re I a ti o n
The preceding sections presented basic ideas and example short programs. In this section we
apply those ideas to a slightly longer program that defines a new statistical procedure The
procedure obtains moving autocorrelations through a time series, as proposed for ocean
atmosphere data by Topliss (2001). The following do-file, gossip.do, defines a program that
makes available a new command called gossip . Comments, in lines that begin with * or
tn phrases set off by / / , explain what the program is doing. Indentation of lines has no effect
on the program’s execution, but makes it easier for the programmer to read.
4
capture program drop gossip
// FOR WRITING & DEBUGGING; DELETE LATER
program gossip
version 8.0
* Syntax requires user to specify two variables (
(Yvar and TIMEvar), and
* the span of the moving window.
Optionally, the2 user can ask to generate
370
i
i;
Statistics with Stata
* a new variable holding autcccrrelations, :: draw a graph, or both,
syntax varlist(min=l max=2 numeric), SPan(i r.teger) [GENerate (string) GRaphj
if int('span'/2) != ('span' - 1)/2 <
display as error "Span must be an odd integer"
}
else {
* The first variable in 'varlist' becomes Yvar, the second TIMEvar.
tokenize 'varlist'
local Yvar '1'
local TIMEvar '2'
tempvar NEWVAR
quietly gen 'NEWVAR'
local miss = 0
* spanlo and spanhi are local macros holding the observation number at the
* low and high ends of a particular window. spanmid holds the observation
* number at the center of this window.
local spanlo = 0
local spanhi = 'span'
local spanmid = int( span' 2)
while 'spanlo' <=
-'scan'
local spanhi = 'span' - ' s p a n 1 o '
local spanlo = 'spanlc'
local spanmid = 'spanmid' + 1
* The next lines check whether missing values exist within the window.
* If they do exist, then no autocorrelation is calculated and we
* move on to the next window. UUsers
se r s are informed that this occurred.
quietly summ 'Yvar' in ’spanlo'/’spanhi’
if r(N) != 'span' {
local miss = 1
}
* The value of NEWVAR in observation 'spanmid' is set equal to the first
* row, first column (1,1) element of the row vector of autocorrelations
* r(AC) saved by corrgram.
else {
quietly corrgram 'Yvar' in ' spanlc'/'spanhi', lag(l)
quietly replace 'NEWVAR' = el(r(AC),1,1) in 'spanmid'
}
}
if "'graph'"
"'graph
!= "" {
* The following graph command illustrates the use of comments to cause
* Stata to skip over line breaks, so it reads the next two lines as if
* they were one.
graph twoway spike 'NEW.’AR' 'TIMtvar', yline(O) ///
ytitle("First-order autocorrelations of 'Yvar' (span span*)
}
if
ah
'miss' == 1 {
display as error "Cauticn:
missing values exist
}
if "'generate'" != l»""•• {
rename 'NEWVAR' 'generate'
label variable 'generate' /: /
"First-order autocorrelations of
■Yvar’
(span ' span')"
}
}
end
aI1
rC1
As the comments note, gossip requires time series (tsset) data. From an existing
time series variable, gossip calculates a second time series consisting of lag-1
autocorrelation coefficients within a moving window of observations — for example, a moving
9-year span. Dataset nao.dta contains North Atlantic climate time series that can be used for
illustration:
Introduction to Programming
Contains data from C:\data\nao.dta
obs:
159
vars :
size:
i
i
I
5
3, 4 96 (??.?* of memory free)
variable name
storage
type
year
wNAO
wNA04
temp
t emp4
float
float
float
Sorted by:
display
format
value
label
%ty
%9.0g
0g
%?. 0g
%9.0g
371
North Atlantic Oscillation &
meat, air temperature at
Stykkisholmur, Iceland
1 Aug 2005 10:50
variable label
Year
Winter NAO
Winter NAO smoothed
Xear. air temperature (C)
Mean air temperature smoothed
year
The variable temp records annual mean air temperatures at Stykkisholmur in west Iceland
from 1841 to 1999. temp4 contains smoothed values of temp (see Chapter 13). Figure 14.1
graphs these two time series. To visually distinguish between raw {temp) and smoothed
{temp4) variables, we connect the former with very thin lines, clwidth (vthin), and the
latter with thick lines, clwidth (thick). Type help linewidthstyle for a list of
other line-width choices.
. graph twoway line temp year, cipattern(solid) clwidth(vthin)
I I line temp4 year, cipattern(solid) clwidth(thick)
I I
, ytitle("Temperature, degrees C") legend(off)
Figure 14.1
2
o
Q
E
1850
1900
Year
1950
2000
To calculate and graph a series of autocorrelations of temp, within a moving window of 9
years, we type the following commands. They produce the graph shown in Figure 14.2.
372
Statistics with Stata
do gossip. do
i
. gossip temp year,
Figure 14.2
CD
!•
generate(autotemp) graph
span (9)
IO
s-
, li,
E
0)
I
in
.iih
c
O
.IL. iliSlil
II III
, ,1,.;
ro o
O
o
n
ro
o
■p
o
J!
co
ill
T I
Q)
I1 ! )
’ I f'l
Il
H
!
■
I ■
1900
1850
.... I
III,
I
III:
I
■
i
1950
Year
2000
In addition to drawing Figure 14.2. gossip created a new variable named autotemp\
describe autotemp
Ikp
lii
8 r;
variable name
storage
type
autotemp
value
label
display
format
* ?.0g
variable label
irst-rder autocorrelations of
temp •,span 9)
list year temp autotemp in 1/10
f
1
3
4
I
I
I
I
I
c
!h
IP
6.
7.
8.
9.
10 .
I
I
I
I
I
I
year
temp
1841
1842
1843
184 4
1845
2.73
4.34
2.97
3.41
3.62
1846
184 7
184 8
1849
1850
4.28
4.45
2.32
3.27
3.23
autotemp
.
I
. I
. I
-.2324837 |
I
.1683512 I
.5194607 I
.5175247 I
-.03303 I
.0181154 I
Ik'
autotemp values are missing for the first four years (1841 to 1844). In 1845, the autotemp
value (-.2324837) equals the lag-1 autocorrelation of temp over the 9-year span from 1841 to
1849. This is the same coefficient we would obtain by typing the following command:
Introduction to Programming
.
373
corrgram temp in 1/9, lag(l)
LAG
1
AZ
?AC
Q
Prob>Q
-0.22-25
-0.2398
.66885
0.4135
-1
0
1-1
0
1
[Autocorrelation]
(Partial Autocor]
-i
(“-0883512) e<?uals the lag-> autocorrelation of temp over the 9 years from
1S42 to 1850. and so on through the data, autotemp values are missing for the last four years
in the data (1996 to 1999), as they are for the first four.
The pronounced Arctic warming of the 1920s, visible in the temperatures of Figure 14.1
mamfestsm Figure 14.2 as a period of consistently positive autocorrelations. A briefer period
of positive autocorrelations in the 1960s coincides with a cooling climate. Topliss (2001)
suggests interpretation of such autocorrelations as indicators of changing feedbacks in ocean
atmosphere systems.
The do-file gossip.do was written incrementally, starting with input components such as
t le syntax statement and span macros, running the do-file to check how these work and then
adding other components. Not all of the trial runs produced satisfactory results. Typing the
following command causes Stata to display programs line-by-line as they execute, so we can
see exactly where an error occurs:
set trace on
Later, we can mm this feature off by typing
set trace off
gossip.do contains a first line, capture program drop gossip, that discards the
program from memory before defining it again. This is helpful during the writina and
debugging stage, when a previous version of our program might have been incomplete or
incorrect. Such lines should be deleted once the program is mature, however. The next section
describes further steps toward making gossip available as a regular Stata command.
i
Ado-File
Once we believe our do-file defines a program that we will want to use again, we can create an
ado-file to make it available like any other Stata command. For the previous example
gossip.do, the change involves two steps:
1. With the Do-file Editor, delete the initial “DELETE LATER” line that had been inserted
to streamline the program writing and debugging phase. We can also delete the comment
lines. Doing so removes useful information, but it makes the program more compact and
easier to read.
2. Save our modified file, renaming it to have an .ado extension (for example, gossip ado) in
a new directory. The recommended location is in C:\ado\personal; you might need to create
this directory and subdirectory if they do not already exist. Other locations are possible,
but review the User’s Manual section on “Where does Stata look for ado-files?” before
proceeding.
Once this is done, we can use gossip as a regular command within Stata. A listing of
gossip.ado follows.
J
374
I
rI
j'
Statistics with Stata
*! version 2.0
’! 1. Hamilton, Statistics with Stata .iT’CM)
program gossip
version 8.0
syntax varlist (min = l max=2 numeric), SPa.n (integer) [GENerate (string) GRaphl
it ir.t ( ' span ' '2 ) != (-span’ - 1)/2 {
display as error "Span must be an odd integer"
}
else {
token!ze ’varlist'
local Yvar '1'
local TIMEvar 2'
tempvar NEWVAR
quietly ger. ’ NEWVAR ’ = .
local miss = 0
local spanlo = 0
local spanhi = 'span'
local spanmid = int ( ' span'/2)
while 'spanlo' <= _N -'s: an' {
local spanhi = span' + 'spanlc'
local spanlo = spar.lo' + 1
local spanmid = 'spanmid' + 1
quietly summ 'Yvar' in 'spanlo' = c a n h i '
if r (N) != ‘span’ {
local miss = 1
}
else {
quietly corrgram Yva r’ in ' =t =r.lo ' / ' spanhi ', lag(l)
quietly replace XEWVAR' = el r(AC),l,l) in ' spar.r.id ’
}
if "'graph'" != "" {
graph twoway spike 'JEWVAR'
::ewvap. • ' TIXEvar' , ylir.e(O) ///
ytitle("First-order autocorrelations of ‘Yvar' (span ' span’)")
}
if 'miss’ == 1 {
display as error "Caution: missir.g values exist"
i
- f " generate’” ! =
rename '::Ea_.7AR’
generate'
lac-el variable generate'
‘
"First-order autttorrelations :f 'Yvar' (span 'span') "
The program could be refined further to make it more flexible, elegant, and user-friendly.
Note the inclusion ofcomments stating the source and “version 2.0” in the first two lines, which
both begin * ! . The comment refers to version 2.0 ofgossip.ado, not Stata (an earlier version
of gossip.ado appeared in a previous edition of this book). The Stata version suitable for this
program is specified as 8.0 by the version command a few lines later. Although the *1
comments do not affect how the program runs, they are visible to a which command:
. which gossip
c:\ado\personal\gossip.ado
* ! version 2.0
* ! L. Hamilton, Statistics with Stata (2304)
5I
1
Oncegossip.ado has been saved in the C:\ado\personal directory, the command gossip
could be used at any time. If we are following the steps in this chapter, which previously
Tj
I
Introduction to Programming
375
defined a preliminary version of gossip , then before running the new ado-file version we
should drop the old definition from memory by typing
. program drop gossip
We are now prepared tp run the final, ado-file version. To see a graph of span-15
autocorrelations of variable wNAO from dataset nao.dta, for example, we would simply open
nao.dta and type
. gossip wNAO year, span(15) graph
Help File
Help files are an integral aspect of using Stata. For a user-written program such as gossip.ado,
they become even more important because no documentation exists in the printed manuals. We
can write a help file for gossip.ado by using Stata’s Do-file Editor to create a texi file named
gossip.hlp. This help file should be saved in the same ado-file directory (for example,
C:\ado personal) as gossip.ado.
Any text file, saved in one of Stata’s recognized ado-file directories with a name of the
formfilename.hlp. will be displayed onscreen by Stata when we type help filename. For
example, we might write the following in the Do-file Editor, and save it in directory
C:\ado personalas file gossipl.hlp. Typing help gossipl at any time would then cause
Stata to display the text.
I
help for gossip
L. Hamilton
Moving first-order autocorrelations
gossip yvar tir.evar, span(#)
[ generate (newvar) graph ]
Description
i
I
calculates firsT-order autocorrelations of time series
yvar, within a moving window of span #. For example, if we
specify span(7) gen (new), then the first
through 3rd values of new are missing. The 4th value of new
equals the lag-1 autocorrelation of yvar across observations 1
through 7. The 5th value of new equals the lag-1 autocorrelation
of yvar across observations 2 through 8, and so forth. The last
3 values of new are missing. See Topliss (2001) for a rationale
and applications of this statistic to atmosphere-ocean data.
Statistics with Stata (2004) discusses the gossip program itself.
gossip requires rsset data. timevar is the time
variable tc be used for graphing.
Options
span(#)
specifies the width of the window for
This option is required;
calculating autocorrelations.
# should be an odd integer.
gen(newvar)
creates a new variable holding the
autocorrelation coefficients.
n
s til
I
i
376
Statistics with Stata
■graph
requests a spike plot of lag-1 autocorrelations vs.
timevar.
Examples
. gossip water month, span(13) graph
. gossip water month, span (9) gen (autowater)
. gossip water month, span (17) gen (autowater) graph
References
Hamilton, Lawrence C.
CA: Duxbury.
2004 .
Statistics with Stata.
Pacific Grove,
Topliss, 3renda J. 2001. "Climate variability I: A' conceptual
■
' approach to
ocean-atmosphere feedback." In Abstracts for AGU Chapman Conference,, The
North Atlantic Oscillation, Nov. 28 - Dec 1, 2000, Ourense, Spain.
I
p
i.
Nicer help files containing links, text formatting, dialog boxes, and other features can be
designed using Stata Markup and Control Language (SMCL). All official Stata help files, as
well as log files and onscreen results, employ SMCL. The following is an SMCL version of
the help file for gossip. Once this file has been saved in C:\ado\personal with the file name
gossip.hlp. typing help gossip will produce a readable and official-looking display.
{smcl}
{* laug2003}{...}
{hline}
help for {hi:gossip}{right:(L. Hamilton)}
{hline}
{title:Moving first-order autocorrelations}
r
l!l
{p 8 12}{cmd:gossip} {it:yvar timevar} {cmd:,} {cmdab:sp:an}{cmd:(}
{it:#}{cmd:)} [[ {cmdab:gen:erate}{cmd:(}{it:newvar}{cmd:)}
{cmdab:gr:aph} ]
{title:Description}
{p}{cmd:gossip} calculates first-order autocorrelations of time series
{it:yvar}, within a moving window of span {it:#}. For example, if we
^cnJd:sPan O'7 {cmd:) } {cmd: gen (} {it: new} {cmd:) }, then the first
through 3rd values of {it:new} are missing. The 4th value of {it.-new}
equals the lag-1 autocorrelation of {it:yvar} across observations 1
through 7. The 5th value of {it:new} equals the lag-1 autocorrelation
of {it:yvar} across observations 2 through 8, and so forth. The last
3 values of {it:new} are missing. See Topliss (2001) for a rationale
and applications of this statistic to atmosphere-ocean data.
{browse "http://www.stata.com/bockstore/sws .html":Statistics with Stata}
(2004) discusses the {cmd:gossip} program itself.{p end}
{p}{cmd:gossip} requires {cmd:tsset} data.
variable to be used for graphing. -;p_end}
r
{it:timevar} is the time
{title:Options}
!1
-{
{p^0 4}{cmd:span(}{it:#}{cmd:)} specifies the width of the window for
calculating autocorrelations, This option is required; {it:#} should be
an odd integer.
I
Introduction to Progrsmmina
i
377
{p 0 4}{cmdrgen(}{it:newvar}{cmd:)} creates a new variable
autocorrelation coefficients.
{p 0 4}{cmd:graph} requests a spike plot of lag-1
autoccrrelatizr.s vs.
{it:timevar}.
{title:Examples}
I
{p 8 12}{inp:, gossip water month,
{p 8 12} {inp:, gossip ’water
’tier rr.cn.th
month,
<P 8 12Hinp:. gossip water month,
I
{title:References}
C C 1 TA
T.T
span(13) graph}{p end}
— "" gen(autcwater
■
span(9)
)}
c
. {. _:_enz
span(17) gen(autowater) graph
/ -5 —» v
p end-
{p 0 4}Hamilton, Lawrence C. 2004.
{browse "http://www.stata.com/bookstore/sws.html”:Szatiszic~
wi:.-. Staza}.
Pacific Grove, CA: Duxbury.{p end}
{p 0 4}Topliss, Brenda J. 2001. ’"Climate
■Cll...
variability Z: A co.':eptu=.l
approach to ocear.-atmosphere feedback."
—I..
In Abstracts f:r AST C?. = pmar.
Conference, The North Atlantic Oscillation,, Nov. 26 - Eec
1/ 2C::, Ourense,
Spain, citation.{p_end}
The help file begins with {smcl}, which tells Stata to process the file as SMCL. Curly
brackets {} enclose SMCL codes, many of which have the form
.... — >—j {cczuiiar.d: text.} or
{command arguments : text}. The following examples illustrate how these codes
are
interpreted.
{hline}
{hi:gossip}
{title:Moving...}
{right:L Hamilton}
{p 8 12}
{cmd:gossip}
I
{it:yvar}
{cmdab:sp:an}
{?}
Draw a horizontal line.
Highlight the text “gossip”.
Display the text “Moving ..as a title.
Right-justify the text “L. Hamilton”.
Format the following text as a paragraph, with the first line
indented 8 columns and subsequent lines indented 12.
Display the text “gossip” as a command. Thai is. show “gossip”
with whatever colors and font attributes are presently defined as
appropriate for a command.
Display the text “yvar” in italics.
Display “span” as a command, with the letters “sp” marked as the
minimum abbreviation.
Format the following text as a paragraph, until Terminated by
{p_end}.
{browse
http://www.stata.com/bookstore/sws.html":Stat l s--- =
Link the text “Statistics with Stata” to the wed address (URL)
http://www.stata.com/bookstore/sws.html . Clicking on the words
Statistics with Stata” should then launch your browser and
connect it to this URL.
comm16 ^°8rammin8 Manual supplies details about using these and many other SMCL
4
••/I
378
Statistics with Stata
Matrix Algebra
Matrix algebra provides essential tools for statistical modeling. Stata’s matrix commands and
matrix programming language (Mata) are too diverse to describe adequately here; the subject
tequires its own reference manual (Mata Reference Manual), in addition to many pages in the
Programming Reference Manual and User’s Guide. Consult these sources for information
about the Mata language, which is new with Stata 9. The examples in this section illustrate
earlier matrix commands, which also still work (hence the placement of version 8.0
commands at the start of each program).
I
1
The built-in Stata command regre s s performs ordinary least squares (OLS) regression,
among other things. But as an exercise, we could write an OLS program ourselves, olsl.do
(following) defines a primitive regression program that does nothing except calculate and
display the vector ofestimated regression coefficients according to the familiar OLS equation:
i l-
b!
b = (X'X)-'X'y
r
1
id
I
I-
IP
; ■
A very simple program, ”olsl” estimates linear regression
* coefficients using ordinary least squares (OLS).
program olsl
version 8.0
* The syntax allows only for a variable list with one or more
* numeric variables.
syntax varlist(min=l numeric)
"tempname...” assigns names to temporary matrices to be used in this
program. When olsl has finished, these matrices will be dropped.
tempname crossYX crossX crossY b
"matrix accum..." forms a cross-product matrix. The K variables in
varlist, and the N observations with nonmissing values on all K variables,
★ comprise an N row, K column data matrix we might call yX.
The cross product matrix crossYX equals the transpose of yX times yX.
Written algebraically:
crossYX = (yX)’yX
quietly matrix accum 'crossYX' = 'varlist'
★
Matrix crossX extracts rows 2 through K, and columns 2 through K,
from crossYX:
crossX = X’X
matrix 'crossX' = 'crossYX'[2...,2.. .]
* Column vector crossY extracts rows 2 through K, and column 1 from crossYX:
crossY = X’y
matrix 'crossY' = 'crossYX'[2..., 1 ]
column vector b contains OLS regression coefficients, obtained by
★ The
the classic estimating equation:
★
b = inverse(X'X)X'y
matrix 'b' = symir.v (' crossX')
'crossY'
Finally, we list the coefficient estimates, which are the contents of b.
matrix list 'b'
end
!
Comments explain each command in olsl.do. A comment-free version named ols2.do
(following) gives a clearer view of the matrix commands:
I
I
Introduction to Programming
it
379
program ols2
version 8.0
syntax varlist(min=l numeric)
tempname crossYX crcssX crossY b
quietly matrix accum 'crossYX' = 'varlist'
matrix 'crossX' = 'crossYX'[2..., 2... ]
matrix 'crossY' = 'crossYX'[2..., 1]
matrix 'b' = syminv('crossX') * 'crossY'
matrix list 'b'
end
I
I
Neitherolsl.do nor olsl.do make any provision for in or if qualifiers, syntax errors,
or options. They also do not calculate standard errors, confidence intervals, or the other
ancillary statistics we usually want with regression. To see just what they do accomplish, we
will analyze a small dataset on nuclear power plants (reactor.dta):
Contains data from c:\dar= reactor.dta
obs:
5
£
131
vars :
size :
variable name
site
decom
capacity
years
start
close
Sorted by:
I
Reactor decommissioning costs
(from Brown et al. 1986)
1 Aug 2005 10:50
(99.?* of memory free)
storage
type
disc lay
fcrmat
str 1 4
byte
in t
byte
%14s
*8.:g
% = .:g
%9. g
int
%6 . 2g
value
label
variable label
Reactor site
Decommissioning cost, millions
Generating capacity, megawatts
Years in operation
Year operations started
Year operations closed
%8. jg
start
The cost of decommissioning a reactor increases with its generating capacity and with the
number of years in operation, as can be seen by using regress:
regress decom capacity years
Source |
------ +
Model |
Residual |
-------- +
Total |
I
SS
df
MS
Number cf
F(
4666.16571
24.6342883
2
2
2333.08286
12.3171442
4 690.8.*
4
1172.70
decom |
Coef.
Std. Err .
t
P> ! 11
capacity |
years |
_cons |
. 1758739
3.899314
-11.39963
. 0247774
.2643087
4.330311
7.10
14.75
-2.63
0.019
0.005
0.119
2,
2)
Frcb
F
R-squared
Adj R-squared =
Root MSE
[95% Conf.
.0692653
2.762085
-30.03146
5
189.42
0.0053
0.9947
0.9895
3.5096
Interval]
.2824825
5.036543
7.23219
Our home-brewed program ols2.do yields exactly the same regression coefficients:
4
380
Statistics with Stata
.
do ols2.do
.
ols2
decom capacity years
000003 [3Z1]
capacity
years
cons
decom
.1758739
3.8993139
-11.399633
Although its results are correct, the minimalist ols2 program lacks many features we
would want in a useful modeling command. The following ado-file. ols3.ado. defines an
improved program named ols3 . This program permits in and if qualifiers, and
optionally allows specification of the level for confidence intervals. It calculates and neatly
displays regression coefficients in a table with their standard errors, t tests, and confidence
intervals.
*! version 2.0 laug2003
*! Matrix demonstration: more complete OLS regress!:.' program.
program ols3, eclass
version 8.0
syntax varlist(min=l numeric) [in] [if] i. Level integer SS_level)]
marksample touse
tokenize "'varlist'"
tempname crossYX crossX crossY b hat V
quietly matrix accum 'crossYX' = 'varlist' if
local nobs = r(N)
local df = 'nobs' - (rowsof('crossYX')
1)
matrix crossX' = 'crossYX' [2. . . , 2 . . . ]
matrix crossY' = 'crossYX' [2 ...,1]
matrix b' = (syminv ('crossX') * 'crossY')'
matrix hat' = 'b' * 'crossY'
matrix V' = syminv ('crossX') * ('crossYX' [1,1] - hat'[l,i:) ' if ’
ereturn post 'b' 'V, dof('df') obs (' nobs ' ) depnarr.e ( ’ 1 ’)
esample('touse')
ereturn local depvar " ' 1 ’ "
ereturn local cmd "ols3"
if 'level’ < 10 | 'level' > 99 {
display as error ’’level ( ) must be between 10 and 99 in
exit 198
- * ive."
}
ereturn display,
level('level’)
end
Because ols3.ado is an ado-file, we can simply type ols3 as a command:
.
ols3
decom capacity years
decom I
Coef.
Std. Er r .
capacity I
years |
_cons |
. 1758739
3.899314
-11.39963
. 0247774
.2643087
4.330311
?>! t
7.10
14.75
-2.63
0.019
0.005
0.119
[95*
onf.
.0692653
2."62085
-30.03146
Interval]
.2824825
5.036543
7.23219
ols3.ado contains familiar elements including syntax and marksample commands,
as well as matrix operations built upon those seen earlier in ols 1.do and ols2.do. Note the
Introduction to Programming
381
use of a right single quote ( ' ) as the “matrix transpose” operator. We write the transpose of
the coefficients vector (syminv ('crossX ' ) * ' crossY') as follows:
(syminv ( 'crossX’)
I
*
'crossY ’ ) 1
The ols3 program is defined as e-class, indicating that this is a statistical modelestimation command:
program ols3,
I
eclass
E-class programs store their results with <e() designations. After the previous ols3
command, these have the following contents:
I
.
ereturn list
scalars:
e (N) =
e (df r) =
5
2
macros:
e(cmd)
e(depvar)
I
I
: "cis3"
: "decom"
matrices:
e (b)
e(V)
:
:
1
X
3
3x3
functions:
e(sample)
.
5
display e(N)
.
matrix list e(b)
e (b) [1,3]
capacity
yi
.1758733
■
years
3.8993133
_cons
< a o c. q
matrix list e(V)
symmetric e(V):3,3]
capacity
capacity
. 0 0 0 613 32
years
-.00216732
cons
-.01492755
years
cc n s
-.342626
18.751531
The e () iresults
' from
~
e-class programs remain in memory until the next e-class command,
In contrast, r-class programs such as summarize store their results with r () designations,
and these remain in memory only until the next e- or r-class command.
Several ereturn lines in olsi.ado save the e () results, then use these in the output
display:
r
I
ereturn post 'b’ 'V, dof('df)
esample('touse’)
obs (
nobs ' )
depname('1’)
///
The above command sets the contents of e ('
' including
‘
2
() results,
the coefficient vector (b)
and the variance-covariance matrix (V). This makes all the° post'-esti^tion features
detailed in help estimates and help postest available. Options specify the
residual degrees of freedom ( df ), number of observations used in estimation ( nobs ),
382
Statistics with Stata
dependent variable name ( ' 1' . meaning the contents of the first macro obtained when we
tokenize varlist ). and estimation sample marker (touse ).
ereturn
j
depvar
local
" ’ i • ••
This command sets the name of the dependent variable, macro 1 after tokenize
varlist, to be the contents of macro e (depvar)
ereturn local and "ols3"
This sets the name of the command, ols3 , as the contents of macro e (cmd)
ereturn display,
level ( ' 1 ee 1 ' )
The ereturn display command displays the coefficient table based on our previous
ere turn post . This table follows a standard Stata fonnat: its first two columns
contain coefficient estimates (from b ) and their standard errors (square roots of diagonal
elements from V). Further columns are / statistics (first column divided by second), twotail t probabilities, and confidence intervals based on the level specified in the ols3
command line (or defaulting to Q?%).
fi
Bootstrapping
■
:
1 ;
-■
%
I
r
rri
V
Bootstrapping refers to a process of repeatedly drawing random samples, with replacement.
from the data at hand. Instead of trusting theory' to describe the sampling distribution of an
estimator, we approximate that distribution empirically. Drawing k bootstrap samples of size
n (from an original sample also size n) yields k new estimates. The distribution of these
bootstrap estimates provides an empirical basis for estimating standard errors or confidence
intervals (Efron and Tibshirani 1986: for an introduction, see Stine in Fox and Lons 1990).
Bootstrapping seems most attractive in situations where the statistic of interest is theoretically
intractable, or where the usual theory regarding that statistic rests on untenable assumptions.
Unlike Monte Carlo simulations, which fabricate their data, bootstrapping typically works
from real data. For illustration, we tum to islands.dta, containing area and biodiversity
measures for eight Pacific Island groups (from Cox and Moore 1993).
Contains data from c:\data isl
obs :
8
-
vars :
size :
variable name
island
area
birds
plants
I
4
208
storage
type
strlS
float
byte
in t
x ac.f ic _s 1 ar.d biodiversi ty
(Cox & Moore 1993)
1 Aug 2005 10:50
(99.9* of re-ory free)
display
format
%
5
%e. -7
value
label
variable label
Island group
Land area, kmA2
Number of bird genera
Number flowering plant genera
Sorted by:
i-
'■
Suppose we wish to form a confidence interval for the mean number of bird genera. The
usual confidence interval for a mean derives from a normality assumption. We might hesitate
to make this assumption, however, given the skewed distribution that, even in this tiny sample
(n — 8), almost leads us to reject normality:
I
Introduction to Programming
383
sktest birds
Skewness .-'Kurtosis tests for Normality
Variable I
Pr (Skewness)
Pr(Kurtosis)
0.0" 9
0.181
birds |
adj chi2(2)
------ joint ----Prob>chi2
4.75
0.0928
Bootstrapping provides a more empirical approach to forming confidence intervals. An rclass command, summarize, detail unobtrusively stores its results as a series of
macros. Some of these macros are:
Number of observations
Mean
r (N)
r (mean)
r(sum)
Skewness
Minimum
Maximum
50th percentile or median
Variance
Sum
r (s d)
Standard deviation
r(skewness)
r(min)
r (max)
r (p50)
r(Var)
I
Stored results simplify the job of bootstrapping any statistic. To obtain bootstrap
confidence intervals for the mean of birds, based on 1,000 resamplings, and save the results in
new file boot 1 .dta, type the following command. The output includes a note warning about the
potential problem of missing values, but that does not apply to these data.
.
bs
"summarize birds,
command:
statistic:
Warning:
detail"
"r(mean)",
rep(1000)
saving(bootl)
summarize birds , detail
_bs_l
= r(mean)
Since summarize is not an estimation command or does not set
e'sample), bootstrap has no way to determine which observations are
used in calculating the statistics and so assumes that all
observations are used. This means no observations will be excluded
from the resampling due to missing values or other reasons.
If the assumption is not true, press
p--- T'--_
Break, save the data, and drop
the observations that are to be excluded,
------Be sure the dataset in
memory contains only the relevant data.
Bootstrap statist!
Variable
I
I
bs_l |
Number of obs
Replications
Reps
Observed
Bias
Std. Err .
[95% Conf.
Interval]
1000
47.625
-.475875
12.39088
23.30986
25.75
27
71.94014
74.8125
78.25
I
I
Note:
8
1000
N
= normal
p
= percentile
BC
= bias-corrected
(N)
(P)
(BC)
I
384
Statistics with Stata
The bs command states in double quotes what analysis is to be bootstrapped ( "summ
birds, detail” ). Following this comes the statistic to be bootstrapped, likewise in its
own double quotes ( "r (mean) " ). More than one statistic could be listed, each separated by
a space. The example above specifies two options:
f
’i
j *
rep (1000)
Calls for 1,000 repetitions, or drawing 1,000 bootstrap samples.
saving(bootl)
Saves the 1,000 bootstrap means in a new dataset named bootl.dta.
The bs results table shows the number of repetitions perfonned and the “observed”
(original-sample) value of the statistic being bootstrapped — in this case, the mean birds value
47.625. The table also shows estimates of bias, standard error, and three types of confidence
intervals. “Bias” here refers to the mean of the k bootstrap values of our statistic (for example,
the mean of the 1,000 bootstrap means of birds), minus the observed statistic. The estimated
standard error equals the standard deviation of the k bootstrap statistic values (for example, the
standard deviation ofthe 1,000 bootstrap means ofbirds). This bootstrap standard error( 12.39)
is less than the conventional standard error (13.38) calculated by ci :
.
ci birds
Variable
|
Obs
Mean
Std. Err.
[95* Conf. Intervalj
birds
I
8
47.625
13.38034
15.38552
------------- +
79.26448
Normal-approximation (N) confidence intervals in the bs table are obtained as follows:
I- ;:!
observed sample statistic ± t x bootstrap standard error
where t is chosen from the theoretical t distribution with k - 1 degrees of freedom. Their use
is recommended when the bootstrap distribution appears unbiased and approximately normal.
Percentile (P) confidence intervals simply use percentiles ofthe bootstrap distribution (for
a 95% interval, the 2.5th and 97.5th percentiles) as lower and upper bounds. These might be
appropriate when the bootstrap distribution appears unbiased but nonnormal.
The bias-corrected (BC) interval also employs percentiles ofthe bootstrap distribution, but
chooses these percentiles followinga normal-theory adjustment for the proportion of bootstrap
values less than or equal to the observed statistic. When substantial bias exists (by one
guideline, when bias exceeds 25% of one standard error), these intervals might be preferred.
Since we saved the bootstrap results in a file named bootl.dta, we can retrieve this and
examine the bootstrap distribution more closely if desired. The saving (bootl) option
created a dataset with 1.000 observations and a variable named _bs_l, holding the mean of each
bootstrap sample.
r
Contains data from c:\data\bootl.dta
Ij
I
||i;
obs:
vars:
s^ze:
variable name
bs 1
li
-
1
Sorted by:
1,000
1
8,000
bs: summarize birds, detail
1 Aug 2005 15:10
(99.9% of memoryfree)
storage
type
display
format
float
%9. Og
value
label
variable label
r (mean)
7
Introduction to Programming
385
summarize
Variable I
bs 1
Obs
|
10CO
Mean
47.14912
Std. Dev.
12.39088
Min
Max
14.625
92.5
Note that the standard deviation of these 1,000 bootstrap means equals the standard error
(12.82) shown earlier in the bs results table. The mean of the 1,000 means minus the
observed (original sample) mean equals the bias:
47.14912 -47.625 = -.47588
Figure 14.3 shows the distribution of these 1,000 sample means, with the original-sample
mean (47.625) marked by a vertical line. The distribution exhibits mild positive skew, but is
not far from a theoretical normal curve.
•
histogram _bs_l , norm bcolor(gslO) xaxis (1 2) xline(47.625)
xlabel(47.635, axis(2)) xtitle("", axis(2))
Figure 14.3
47.635
i
/
/
w CN
c o
<D
Q
z
: •• •
20
40
60
r(mean)
80
100
Biologists have observed that biodiversity, or the number of different kinds of plants and
animals, tends to increase with island size. In islands.dta, we have data to test this proposition
with respect to birds and flowering plants. As expected, a strong linear relationship exists
between birds and area'.
1
386
■
Statistics with Stata
regress birds area
Source
SS
Model
Residual
df
MS
Number of obs =
F( lr
6) =
Prob > F
R-squared
=
Adj R-squared =
Root MSE
8
162.96
0.0000
0.9645
0.9586
7.7033
|
j
9669.83255
356.042449
1 9669.83255
6 . 59.3404082
Total |
10025.875
7
birds |
Coef .
Std. Err.
t
P> 111
[95% Conf. Interval]
area 1
cons |
.0026512
13.97169
. 0002077
3.79046
12.77
3.69
’0.000
0.010
.002143
4.696773
1432.26786
.0031594
23.24662
An e-class command, regress saves a set of e () results as noted earlier in this
chapter. It also creates or iupdates a set of system variables containing the model coefficients
C
[ v’arnazne] ) and standard errors (; _se [ varname]). To bootstrap the slope and y
intercept from the previous regression, saving the results in file boot2.dta, type
t
• bs "regress birds area" ”
_b[area]
”__b
[ area] _b[_cons]", rep(1000)
saving(boot2)
command:
statistics:
regress birds area
_bs_l
= _b[area]
_bs_2
= _b[_cons]
Bootstrap statistics
J
Variable
|
I
I
bs_2 |
I
_bs_l
Number of obs
Replications
Reps
Observed
Bias
Std. Err.
[95% Conf. Interval]
1000
.0026512 -.0000737
.0003345
1000
13.97169
3.637705
.0019947
. 0019759
.00199
6.833275
7.891942
6.949539
1
Note :
BC
i
1
8
1000
.6230986
. 0033077
. 0029066
.0029246
21.11011
21.74494
19.73012
(N)
(P)
(BC)
(N)
(P)
(BC)
- normal
= percentile
= bias-corrected
The bootstrap distribution of
< ~ coefficients
~~ *
on area is severely skewed (skewness = 4.12).
Whereas
,
,,the bootstrap- distribution ofn means (Figi
r jure 14.3) appeared approximately normal, and
^/UCed bootstraP confldence intervals narrower than the theoretical confidence interval, in
this regressioni example bootstrapping obtains larger standard errors and wider confidence
intervals.
In a regression context, bs ordinarily performs what is called “data resampling,” or
resampling intact observations. An alternative procedure called “residual resampling”
(resampling only the residuals) requires a bit more programming work. Two additional
commands make such do-it-yourself bootstrapping easier:
bsampie
Draws a sample with replacement from the existing data, replacing the data in
memory.
ir
Introduction to Programming
387
I
bootstrap
Runs a user-defined program reps () times on bootstrap samples of size
size().
The Base Reference Manual gives examples of programs for use with bootstrap
I
I
1
I
I
-fl
Monte Carlo Simulation
Monte Carlo simulations generate and analyze many samples of artificial data, allowing
researchers to investigate the long-run behaviOr.of their statistical techniques. The s imnt at-p
command makes designing a simulation straightforward so that it only requires a small amount
of additional programming. This section gives two examples.
To begin a simulation, we need to define a program that generates one sample of random
data, analyzes it, and stores the results of interest in memory. Below we see a file defining an
r-class program (one capable of storing r () results) named central . This program
randomly generates 100 values of variable x from a standard normal distribution. It next
generates 100 values of variable w from a "contaminated normal” distribution: N(0.1) with
probability .95. and X(0,10) with probability .05. Contaminated normal distributions have often
been used in robustness studies to simulate variables that contain occasional wild errors. For
both variables, central obtains means and medians.
* Creates a sample containing n=100 observations of variables x and
w.
* x~N(0,1)
x is standard normal
* w~N(0,l) with p=.95r w~NO,10) with
w is contaminated normal
* Calculates the irean -nd mediae of x and w
* Stored results:
r(xmean)
r(xmedian)
r(wmean)
r(wmedian)
program central, rclass
version 6.0
drop _all
set obs 100
generate x = lavnor-(uniform() )
summarize x, detail
return scalar zmear. = r(mean)
return scalar zmedian = r(p50)
generate w = invnom (uniform () )
replace w = 10*w if uniform() < .05
summarize w, detail
return scalar vmear. = r(mean»
return scalar vmedixn = r(p57)
end
Because we defined centxal as an r-class command, like summarize , it can store
its results in r() macros. central creates four such macros: r(xmean) and
r (xmedian) for the mean and median ofx: r (-...-mean) and r (wmedian) forthe mean and
median of w.
Once central has been defined, whether through a do-file, ado-file, or typing
commands interactively, we can call this program with a simulate command. To create
a new dataset containing means and medians of.v and w from 5,000 random samples, type
388
Statistics with Stata
■'ll
simulate "central"
xmean = r(xmean)
xmedian = r(xmedian)
wmean = r(wmean)
wmedian = r(wmedian), reps(5000)
command:
statistics:
central
xmean
xmedian
wmean
wmedian
=
=
=
=
r(xmean)
r(xmedian)
r(wmean)
r(wmedian)
This command creates new variMesxmean,xmedian, wmean, and wmedian, based on the r ()
results from each iteration of central.
describe
Contains data
obs :
vars :
size:
variable name
xmean
xmedian
wmean
wmedian
5, 000
4
100,000 (99.6* of memory free)
storage
type
display
format
float
float
float
float
*9.0g
%9.0g
%9.0g
%9.0g
value
label
simulate: central
1 Aug 2005 17:50
variable label
r (xmean)
r(xmedian)
r(wmean)
r(wmedian)
Sorted by:
summarize
Variable |
Obs
Mean
Std. Dev.
Min
Max
I
I
wmean I
wmedian I
5000
5000
5000
5000
-.0015915
-.0015566
-.0004433
.0030762
.0987788
. 1246915
.2470823
.1303756
-.4112561
-.4647848
-1.11406
-.4584521
.3699467
.4740642
. 8774976
.5152998
xmean
xmedian
I q?
r
The means of these means and medians, across 5,000 samples, are all close to 0 —
consistent with our expectation that the sample mean and median should both provide unbiased
estimates of the true population means (0) for x and w. Also as theory predicts, the mean
exhibits less sample-to-sample variation than the median when applied to a normally distributed
variable. The standard deviation of xmedian is .125, noticeably larger than the standard
deviation ofxmean (.099). When applied to the outlier-prone variable w, on the other hand, the
opposite holds true: the standard deviation of wmedian is much lower than the standard
deviation of wmean (. 130 vs. .247). This Monte Carlo experiment demonstrates that the median
remains a relatively stable measure of center despite wild outliers in the contaminated
distribution, whereas the mean breaks down and varies much more from sample to sample.
Figure 14.4 draws the comparison graphically, with box plots (and, incidentally, demonstrates
how to control the shapes of box plot outlier-marker symbols).
i
fl
e! i
’
Introduction to Programming
389
. graph box xmean xmedian wmean wmedian, yline(O) legend(col (4) )
marker (1, msymbol( + )) marker(2, msymbol(Th))
marker (3, msymbol(Oh)) marker(4, msymbol(Sh))
Figure 14.4
§
o
I
‘Pr
I
g
i
r
r(xmean)
I
i
I
1
r(xmedian)
r(wmean) BB r(wmedian)
Our final example extends the inquiry to robust methods, bringing together several themes
from this book. Program regsim generates 100 observations ofx (standard normal) and two
y variables, yl is a linear function ofx plus standard normal errors. y2 is also a linear function
ofx, but adding contaminated normal errors. These variables pennit us to explore how «rious
regression methods behave in the presence of normal and nonnormal errors. Four methods are
employed: ordinary least squares (regress), robust regression (rreg), quantile reeression
( qreg ), and quantile regression with bootstrapped standard errors ( bsqreg , with 500
repetitions). Differences among these methods were discussed in Chapter 9. Program
regsim applies each method to the regression ofyl onx and then to the regression of v2 on
x For this exercise, the program is defined by an ado-file, regsim.ado, saved in the
C:\ado\personal directory.
"J
390
Statistics with Stata
program regsim, rclass
* Performs one iterati:on of a Monte Carlo simulation comparing
* OLS regression (regress) with robust
--- - (rreg) and quantile
* (qreg and bsqreg) regression. Generates one n = 100 sample
* with x ~ N (0,1) and y variables defined by the models:
MODEL 1:
yl = 2x + el •
el ~ N(0,1)
MODEL 2:
y2 = 2x + e2
e2 ~ N(0,l) with p = . 95
e2 ~ N(0,10) with p = .05
* Bootstrap standard errors for qreg involve 500 repetitions.
version 8.0
if •»' i • « = — »»9w {
^delimit ;
global S_1 "bl blr selr big selq selqb
b2 b2r se2r b2q se2q se2qb,, ;
tfdelimit or
exit
}
drop _all
set obs 100
generate x = invncrr. (uniform () )
generate e = invncrrr. (uniform () )
generate yl = 2*x
e
reg yl x
return scalar =1 = _b[x]
rreg yl x, iterate(25)
return scalar =1R = _b[x]
return scalar SE1R = _se[x]
qreg yl x
return scalar EIQ = _b[x]
return scalar SE1Q = _se[x]
bsqreg yl x, reps(500)
return scalar SE1QB = _se[x]
replace e = 10 * e if uniform()
.05
generate y2 = 2*x + e
reg y2 x
return scalar B2 = _b[x]
rreg y2 x, iterate(25)
return scalar B2R = _b[x]
return scalar SE2R = _se[x]
qreg y2 x
return scalar B2Q = _b[x]
return scalar SE2Q = _se[x]
bsqreg y2 xf reps(500)
return scalar SE2QB = _se[x]
i
!•
end
The r-class program stores coefficient or standard error estimates from eight regression
analyses. These results have names such as
r (Bl)
coefficient from OLS regression ofy7 onx
r(B1R)
coefficient from robust regression ofy/ on x
r(SE1R) standard error of robust coefficient from model 1
and so forth. All the robust and quantile regressions involve multiple iterations: typically 5 to
10 iterations for rreg , about 5 for qreg, and several thousand for bsqreg with its 500
bootstrap re-estimations of about 5 iterations each, per sample. Thus, a single execution of
■
Introduction to Programming
391
regsim demands more than two thousand regressions. The following command calls for five
repetitions.
simulate "regsim”
bl = r(Bl)
blr = r(BlR)
selr = r(SE1R)
blq = r(B1Q)
selq = r(SE1Q)
selqb = r(SElQB)
b2 = r(B2)
b2r = r(B2R)
se2r = r(SE2R)
b2q = r (B2Q)
se2q = r(SE2Q)
se2qb = r(SE2QB), reps(5)
You might want to run a small simulation like this as a trial to get a sense of the time
required on your computer. For research purposes, however, we would need a much larger
experiment. Dataset regsim.dta contains results from an overnight experiment involving 5.000
repetitions of regsim — more than 10 million regressions. The regression coefficients and
standard error estimates produced by this experiment are summarized below.
I
describe
Contains data from C:\data\regsim.dta
obs:
5,000
I
vars :
size :
12
1 , 000
variable name
Monte Carl: escir.sies of b
5 0 00 s ar r es :f r. = 10 0
2 Aug 200:'
(99.0% cf memory free)
storage
type
display
forma:
bl
blr
selr
blq
selq
selqb
float
float
float
float
float
float
%9.0g
%9.0g
%9.0g
%9.0g
%9.0g
%9.0g
b2
b2r
se2r
float
float
float
%9.0g
%9.0g
%9.0g
b2q
se2q
float
float
%9.0g
%9.0g
se2qb
float
%9.0g
value
label
variable l=bel
OLS b (norr.al errzrs)
Robust b ir.:rmal errors.
Robust SE[r’ (normal errors)
Quantile b 'normal errors)
Quantile SH^b] (normal error )
Quantile bootstrap SE[b]
(normal errors)
OLS b (contaminated errors)
Robust b (contaminated errors)
Robust SE[b' (contaminated
errors)
Quantile b •contaminated errors)
Quantile SE
(contaminated
errors)
Quantile bootstrap SEfb]
(contaminated errors)
O *" *-
Sorted by:
I
summarize
|
Obs
Mean
Std. Dev.
bl I
blr i
selr |
blq I
selq |
5000
5000
5000
5000
5000
2.000828
2.000989
. 1041399
2.001135
.1262578
. 102018
. 1052277
.0109429
.1309186
. 0281738
1.6312
1.6031 6
.0693" = 6
1.47 112
. 0532"31
2.414814
2.391946
.1515421
2.536621
.2371508
selqb I
b2 I
b2r I
se2r I
b2q I
5000
5000
5000
5000
5000
. 1362755
2.006001
2.000399
. 1081348
2.000701
.032673
.2484688
.1092553
.0119274
.137111
.0510818
.9001114
1.633241
,0743103
1.471802
.29979
3.050552
2.411423
.1560973
2.536621
se2q |
se2qb I
5000
5000
.1328431
. 1436366
.0299644
.0346679
.0542015
. 0589419
.2594844
. 31‘064 I 7
Variable
i
Max
392
Statistics with Stata
Figure 14.5 draws the distributions of coefficients as box plots. To make the plot more
hip 11
—.—^____ J/____
•
«
readable
we non
use the 1
legend
(symxsize
(2) colgap(4))) options, which set * the width
of symbols and the gaps between columns within the legend at less than their default size.
help legend_option and help relativesize supply further information about
these options.
b
ftpI
II
B
graph box bl blr blq b2 b2r b2q,
.
ytitie ( "Es tiniates of slope
(b=2)")
yline (2)
legend(row(1) symxsize(2) colgap(4)
label(1 "OLS 1") label(2 "robust 1") label(3 "quantile 1")
label(4 "OLS 2") label(5 "robust 2") label(6 "quantile 2"))
Figure 14.5
co
in
Q
o
U)
V)
CD
ro
fwin
■I ii
UJ^--
Bi
!•
■
1
| OLS 1
Hp
■]
ijl;
I
g robust 1
| quantile 1 | OLS 2 | robust 2
quantile 2
All three iregression methods (OLS, robust, and quantile) produced mean coefficient
estimates for both
—i imodels that are not significantly different from the true value, p = 2. This
can be confirmed through t tests such as
•
ttest b2r = 2
One-sample t test
' 1
Variable |
b2r
|
Obs
Mean
5000
2.000399
---------------
Std. Err.
Std. Dev.
[95% Conf
Inter*-= 1
.0015451
.1092553
1 . 9973"
2.0
Degrees of freedom: 4999
Ho: ~ean(b2r) = 2
8
Ha: mean < 2
t =
0.2585
P < t =
0.6020
Ha: mean != 2
t =
0.2585
P > iTi =
0.7960
Ha:
I
mean > 2
t =
0.2585
P > t =
0.3980
I
Introduction to Programming
393
All the regression methods thus yield unbiased estimates of 0, but they differ in their
sample-to-sample variation or efficiency. Applied to the normal-errors model 1, OLS proves
the most efficient, as the famous Gauss-Markov theorem would lead us to expect. The
obsened standard deviation of OLS coefficients is .1016, compared with .1047 for robust
regression and .1282 for quantile regression. Relative efficiency, expressing the OLS
coefficient’s observed variance as a percentage of another estimator’s observed variance
provides a standard way to compare such statistics:
.
quietly summarize bl
. global Varbl = r(Var)
• quietly summarize blr
I
. display 100*($Varbl/r(Var) )
93.992612
.
quietly summarize blq
■ display 100*($Varbl/r(Var) )
60.722696
I
The calculations above use the r(Var) variance result from summarize We first
obtain the variance of the OLS estimates bl, and place this into global macro Varbl Next
the variances of the robust estimates blr, and the quantile estimates blq, are obtained and each
comparedwith Varbl. This reveals that robust regression was about 94% as efficient as OLS
when applied to the normal-errors model — close to the large-sample efficiency of 95% that
this robust method theoretically should have (Hamilton 1992a). Quantile reeression, in
contrast, achieves a relative efficiency of only 61% with the normal-errors model?
Similar calculations for the contaminated-errors model tell a different story. OLS was the
best (most efficient) estimator with normal errors, but with contaminated errors it becomes the
worst:
. quietly summarize b2
. global Varb2 = r(Var)
. quietly summarize b2r
■ display 100*($Varb2/r(Var) )
517.2005"
. quietly summarize b2q
. display 100* ($Varb2/r(Var))
328.3971
i
I
Outliers in the contaminated-errors model cause OLS coefficient estimates to vary wildly
from sample to sample, as can be seen in the fourth box plot of Figure 14.5. The variance of
these OLS coefficients is more than five times greater than the variance of the corresponding
robust coefficients, and more than threti times greater than that of quantile coefficients. Put
another way, both robust and quantile regression prove to be much more stable than OLS in the
presence of outliers, yielding correspondingly lower standard errors and narrower confidence
intervals. Robust regression outperforms quantile regression with both the normal-errors and
the contaminated-errors models.
394
Statistics with Stata
Figure 14.6 illustrates the comparison between OLS and robust regression with a scatterplot
showing 5,000 pairs of regression coefficients. The OLS coefficients (vertical axis) vary’ much
more widely around the true value, 2.0. than rreg coefficients (horizontal axis) do.
. graph twoway scatter b2 b2r, msymbol(p) ylabel(1(.5)3, grid)
yline(2) xlabel(1 ( .5)3, grid) xline(2)
Figure 14.6
co
L
£2 LO
11
O CN
0)
73
a?
- Uw •
to
fcN TO
I
:ep-;y.
O
X2
co^ .
o
! I
L
ji
si
I '1
H
I#
F
* !•
" '
■
1
1
‘■’i
—t-------------------------------- r-
1.5
2
25
Robust b (contaminated errors)
3
The experiment also provides information about the estimated standard errors under each
method and model. Mean estimated standard errors differ from the observed standard
deviations of coefficients. Discrepancies for the robust standard errors are small — less than
1 /o. For the theoretically-deri ved quantile standard errors the discrepancies appear a bit larger,
between 3 and 4%. The least satisfactory estimates appear to be the bootstrapped quantile
standard errors obtained by bsqreg . Means of the bootstrap standard errors exceed the
observed standard deviation of blq and b2q by 4 to 5%. Bootstrapping apparently over
estimated the sample-to-sample variation.
Monte Carlo simulation has become a key method in modem statistical research, and it
plays a growing role in statistical teaching as well. These examples demonstrate how readilv
Stata supports Monte Carlo work.
References
Barron’s Educational Series. 1992. Barron s Compact Guide to Colleges, Sth ed. New York:
Barron's Educational Series.
Beatty, J. Kelly, Brian O’Leary and Andrew Chaikin (eds.).
Cambridge, MA: Sky.
1981.
The \exv Solar System.
Eeisley, D. A £ .Kuh and R, E. AVelsch. 1980. Regression Diagnostics: Identifying Influential
Data and Sources of Collinearity. New York: John Wiley & Sons.
Sox. G. E. P. G M. Jenkins and G. C. Reinsei. 1994. Time Series Analysis: Forecasting and
Control. 3rded. Englewood Cliffs, NJ: Prentice-Hall.
Brown, Lester R„ William U. Chandler, Christopher Flavin, Cynthia Pollock, Sandra Postel Linda
Starke and Edward C. Wolf. 1986. State ofthe World 1986. New York: W. W. Norton.
Buch E. 2000. Oceanographic Investigations off West Greenland 1999. Copenhagen- Danish
Meteorological Institute.
CDC (Centers for Disease Control). 2003. Web site: http://www.cdc.gov
Chambers, John M., William S. Cleveland, Beat Kleiner and Paul A. Tukey (eds.)
j. 1983. Graphical
Methods for Data Analysis. Belmont, CA: Wadsworth.
Chatfield C. 1996. The Analysis of Time Series: An Introduction, 5th edition. London: Chapman
I
I
& tiall.
Chatterjee, S„ A. S. Hadi and B. Price. 2000. Regression Analysis by Example, 3rd edition. New
York: John Wiley & Sons.
i
Cleveland, William S. 1994. The Elements of Graphing Data. Monterey, CA: Wadsworth.
Cleves, Mario, William Gould and Roberto Gutierrez. 2004. An Introduction to Survival Analysis
Osing Stata, revised edition. College Station, TX: Stata Press.
COOChaPmtnn&HaC!lSanfOrdWeiSber8'
ResidualsandIn^uence in ^S^ion. New York:
Cook. R. Dennis and Sanford Weisberg. 1994. An Introduction
to Regression Graphics. New
ork: John Wiley & Sons.
Council on Environmental Quality. 1988. Environmental Quality 1987-1988.
Washington, DC:
Council on Environmental Quality.
Cox C. Barry and Peter D. Moore. 1993. Biogeography: An Ecological and Evolutionary
Approach. London: Blackwell Publishers.
4
395
396
Statistics with Stata
Cryer. Jonathan B. and Robert B. Miller. 1994. Statistics tor Business: Data Analysis and
Modeling, 2nd edition. Belmont. CA: Duxbury Press.
Davis. Duane. 2000. Business Research tor Decision Making. 5th edition. Belmont. CA: Duxbury
Press.
J
DFO (Canadian Department of Fisheries and Oceans). 2003. Website:
http://www.meds-sdmm.dfo-mpo.gc.ca/alphapro zmp/climate/IceCoverage_e.shtml
'I
Diggle, P. J. 1990. Time Series: A Biosianstical Introduction. Oxford: Oxford University Press.
Efron. Bradley and R. Tibshirani. 1986. “Bootstrap methods for standard errors, confidence
intervals, and other measures of statistical accuracy.” Statistical Science l(l):54-77.
Enders, W. 2003. Applied Econometric Time Series. 2nd edition. New York: John Wiley & Sons.
Everitt, Brian S., Savine Landau and Monen Leese. 2001. Cluster Analysis. 4th edition. LondonArnold.
Federal, Provincial, and Territorial Advisory Commission on Population Health. 1996. Report on
the Health oj Canadians. Ottowa: Health Canada Communications.
Fox, John. 1991. Regression Diagnostics. Newbury Park. CA: Sage Publications.
Fox, John and J. Scott Long. 1990. Modern Methods of Data Analysis. Beverly Hills: Sage
Publications.
e
K
Frigge, Michael. David C. Hoaglin and Boris Iglewicz.
boxplot. ’ The American Statistician 43( 1 ):50-54.
1989. “Some implementations of the
Gould, William, Jeffrey Pitblado and William Sribney. 2003. Maximum Likelihood Estimation with
Stata, 2nd edition. College Station, TX: Stata Press.
Hamilton, Dave C. 2003. “The Effects of Alcohol on Perceived Attractiveness.” Senior Thesis.
Claremont, CA: Claremont McKenna College.
Hamilton. James D. 1994. Time Series Analysis. Princeton, NJ: Princeton University Press.
- 1
!•
4
Hamilton. Lawrence C. 1985a. “Concern about toxic wastes: Three demographic predictors.”
Sociological Perspectives 28(4):463-486.
Hamilton. Lawrence C. 1985b. “Who cares about water pollution? Opinions in a small-town
cnsis.“ Sociological Inquiry’ 55(2): 170-181.
Hamilton, Lawrence C. 1992a. Regression with Graphics: A Second Course in Applied Statistics
Pacific Grove, CA: Brooks/Cole.
J
i
Hamilton, Lawrence C. 1992b. “Quartiles, outliers and normality: Some Monte Carlo results.” Pp.
92-95 in Joseph Hilbe (ed.) Stata Technical Bulletin Reprints. Volume 1. College Station TXStata Press.
Hamilton, Lawrence C. 1996. Data Analysis for Social Scientists. Belmont, CA: Duxbury Press.
Hamilton,LawrenceC., Benjamin C. Brown and Rasmus Ole Rasmussen. 2003. “Local dimensions
of climatic change: West Greenland's cod-to-shrimp transition.” Arctic 56(3):271-282.
Hamilton, Lawrence C., Richard L. Haedrich and Cynthia M. Duncan. 2003. “Above and below
the water: Social/ecological transformation in northwest Newfoundland.” Population and
Environment 25(2)101-121.
h
1
-L
References
397
Hamilton, Lawrence C. and Carole L. Seyfrit. 1993. “Town-village contrasts in Alaskan youth
aspirations.” Arctic 46(3):255-263.
Hardin, James and Joseph Hilbe. 2001. Generalized Linear Models and Extensions
Station, TX: Stata Press.
Colleoe
&
Hoaglin, David C., Frederick Mosteller and John W. Tukey (eds.). 1983
. Understanding Robust
and Exploratory Data Analysis. New York: John Wiley & Sons.
Hoaglin, David C„ Frederick Mosteller and John W. Tukey (eds.). 1985. Exploring Data Tables
Trends and Shape. New York: John Wiley & Sons.
Hosmer, David W., Jr. and Stanley Lemeshow. 1999. Applied Survival Analysis. New York- John
Wiley & Sons.
Hosmer, David W., Jr. and Stanley Lemeshow. 2000. Applied Logistic Regression, 2nd edition.
New York: John Wiley & Sons.
Howell, David C. 1999. Fundamental Statisticsfor the Behavioral Sciences, 4th edition. Belmont
CA: Duxbury Press.
Howell, David C. 2002. Statistical Methodsfor Psychology, Sth edition. Belmont, CA- Duxbury
Press.
Iman, Ronald L. 1994. A Data-Based Approach to Statistics. Belmont, CA: Duxbury Press.
Jentoft, Svein and Trond Kristoffersen. 1989. “Fishermen’s co-management: The case of the
Lofoten fishery.” Human Organization 48(4):355-365.
Johnson, Anne M., Jane Wadsworth, Kaye Wellings, Sally Bradshaw and Julia Field
“Sexual lifestyles and HIV risk.” Nature 360(3 December):410^112.
1992
Johnston, Jack and John DiNardo. 1997. Econometric Methods, 4th edition. New York- McGrawHill.
Keller, Gerald, Brian Warrack and Henry Bartel. 2003. Statisticsfor Management and Economics
abbreviated 6th edition. Belmont, CA: Duxbury Press.
League of Conservation Voters. 1990. The 1990 National Environmental Scorecard. Washington,
DC: League of Conservation Voters.
Lee, Elisa T. 1992. Statistical Methods for Survival Data Analysis, 2nd edition. New York- John
Wiley & Sons.
Li, Guoying. 1985. “Robust regression.” Pp. 281-343 in D. C. Hoaglin, F. Mosteller and J. W.
Tukey (eds.) Exploring Data Tables, Trends and Shape. New York: John Wiley & Sons.
Long, J. Scott. 1997. Regression Models for Categorical and Limited Dependent Variables.
Thousand Oaks, CA: Sage Publications.
Long, J. Scott and Jeremy Freese. 2003. Regression Modelsfor Categorical Outcom es Using Stata
revised edition. College Station, TX: Stata Press.
MacKenzie, Donald. 1990. Inventing Accuracy: A Historical Sociology of Nuclear Missile
Guidance. Cambridge, MA: MIT.
I
Mallows, C. L.. 1986. “Augmented partial residuals.” Technometrics 28:313-319.
398
Statistics with Stata
Mayewski, P. A., G. Holdsworth, M. J. Spencer, S. Whitlow, M. Twickler, M. C. Morrison, K. K.
Ferland and L. D. Meeker. 1993. “Ice-core sulfate from three northern hemisphere sites:
Source and temperature forcing implications.”
Atmospheric Environment
27A(17/18):2915-2919.
!
-
Mayewski, P. A., L. D. Meeker, S. Whitlow, M. S. Twickler, M.C. Morrison, P. Bloomfield, G. C.
Bond, R. B. Alley, A. J. Gow, P. M. Grootes, D. A. Meese, M. Ram, K. C. Taylor and W.
Wumkes. 1994. “Changes in atmosnheric
atmospheric cimulatinn
circulation and ocean ice cover overxt
the North
Atlantic during the last 41,000 years.” Science 263:1747-1751.
McCullagh, D. W. Jr. and J. A. Nelder. 1989. Generalized Linear Models, 2nd edition. London:
Chapman & Hall.
Nash, James and Lawrence Schwartz. 1987. “Computers and the writing process.” Collegiate
Microcomputer 5( 1 ):45-48.
National Center for Education Statistics. 1992. Digest ofEducation Statistics 1992. Washington,
DC: U.S. Government Printing Office.
k
National Center for Education Statistics. 1993. Digest ofEducation Statistics 1993. Washington,
DC: U.S. Government Printing Office.
Newton. H. Joseph and Jane L. Harvill. 1997. StatConcepts: A Visual Tour of Statistical Ideas.
Pacific Grove, CA: Duxbury Press.
Pagano, Marcello and Kim Gauvreau. 2000. Principles ofBiostatistics,2ndcd\t\Qn. Belmont, CA:
Duxbury Press.
Rabe-Hesketh, Sophia and Brian Everitt. 2000. A Handbook of Statistical Analysis Using Stata,
2nd edition. Boca Raton, FL: Chapman & Hall.
Report of the Presidential Commission on the Space Shuttle Challenger Accident.
Washington, DC.
1986.
Rosner, Bernard. 1995. Fundamentals ofBiostatistics, 4th edition. Belmont, CA: Duxbury Press.
Selvin, Steve. 1995. PracticalBiostatistical Methods. Belmont, CA: Duxbury Press.
Selvin, Steve. 1996. Statistical Analysis ofEpidemiologic Data, 2nd edition. New York: Oxford
University.
Seyfrit, Carole L.. 1993. Hibernia’s Generation: Social Impacts of Oil Development on
Adolescents in Newfoundland. St. John’s: Institute of Social and Economic Research,
Memorial University of Newfoundland.
Shumway, R. H. 1988.
Prentice-Hall.
Applied Statistical Time Series Analysis.
Upper Saddle River, NJ:
Stata Corporation. 2005. Getting Started with Stata for Macintosh. College Station, TX: Stata
Press.
Stata Corporation. 2005. Getting Started with Stata for Unix. College Station, TX: Stata Press.
Stata Corporation. 2005. Getting Started with Stata for Windows. College Station, TX: Stata
Press.
Stata Corporation. 2005. Mata Reference Manual. College Station, TX:' Stata Press.
a
Stata Corporation. 2005. Stata Base Reference Manual (3 volumes). College Station, TX: Stata
Press.
1
References
399
Stata Corporation. 2005. Stata Data Management Reference Manual. College Station, TX: Stata
Press.
Stata Corporation. 2005. Stata Graphics Reference Manual. College Station. TX: Stata Press.
Stata Corporation. 2005. StataProgramming Reference Manual. College Station, TX: Stata Press.
Stata Corporation. 2005. Stata Longitudinal/PanelData Reference Manual. College Station, TX:
Stata Press.
Stata Corporation. 2005. Stata Multivariate Statistics Reference Manual. College Station. TX:
Stata Press.
Stata Corporation. 2005. Stata Quick Reference and Index. College Station, TX: Stata Press.
Stata Corporation. 2005. Stata Survey Data Reference Manual. College Station, TX: Stata Press.
Stata Corporation. 2005. Stata Survival Analysis and Epidemiological Tables Reference Manual.
College Station, TX: Stata Press.
Stata Corporation. 2005. Stata Time-Series Reference Manual. College Station, TX: Stata Press.
Stata Corporation. 2005. Stata Users Guide. College Station, TX: Stata Press.
Stine, Robert and John Fox (eds.). 1997. Statistical Computing Environmentsfor Social Research.
Thousand Oaks, CA: Sage Publications.
Topliss, Brenda J. 2001. “Climate variability I: A conceptual approach to ocean-atmosphere
feedback.” In Abstracts for AGU Chapman Conference, The North Atlantic Oscillation, Nov.
28 - Dec. 1, 2000, Ourense, Spain.
Tufte, Edward R. 1997. Visual Explanations: Images and Quantities, Evidence and Narratives.
Cheshire, CT: Graphics Press.
Tukey, JohnW. 1977. Exploratory Data Analysis. Reading, MA: Addison-Wesley.
Velleman, Paul F. 1982. “Applied Nonlinear Smoothing,” pp.141-177 in Samuel Leinhardt (ed.)
Sociological Methodology 1982. San Francisco: Jossey-Bass.
Velleman, Paul F. and David C. Hoaglin. 1981. Applications, Basics and Computing of
Exploratory Data Analysis. Boston: Wadsworth.
Ward, Sally and Susan Ault. 1990. “AIDS knowledge, fear, and safe sex practices on campus.”
Sociology and Social Research 74(3): 158-161.
Werner, Al. 1990. “Lichen growth rates for the northwest coast of Spitsbergen, Svalbard.” Arctic
and Alpine Research 22(2): 129-140.
World Bank. 1987. World Development Report 1987. New York: Oxford University.
World Resources Institute. 1993. The 1993 Information Please Environmental Almanac. Boston:
Houghton Mifflin.
I
i
Index
A
I
ac (autocorrelations), 339, 351-352
acprplot (augmented component-plus
residual plot), 197, 202-203
added-variable plot, 198,201-202
ado-file (automatic do), 233-235 362
373-375
alpha (Cronbach’s alpha reliability),
318-319
analysis of covariance (ANCOVA),
141-142, 153-154
analysis of variance (ANOVA)
factorial, 142, 152-153, 156
interaction effects, 142, 152-154,
156-157
median, 253-255
A-way, 152-153
one-way, 142, 155
predicted values, 155-158. 167
regression model, 153-154, 249-256
repeated-measures, 142
robust, 249-256
standard errors, 155-157, 167
three-way, 142
two-way, 142, 152-153,156-157
anova, 142, 152-158, 167,239
append, 13, 42-44
ARCH model (autoregressive conditional
heteroskedasticity), 339
area plot, 86-87
args (arguments in program). 366-368
areg (absorb variables in regression)
179-180
ARIMA model (autoregressive integrated
moving average), 339, 354-360
arithmetic operator, 26
artificial data, 14, 57-61,241, 387-394
ASCII (text) file
read data, 13-14, 39-42
write data, 42
write results (log file), 2-3, 6-7
autocode (create ordinal variables) 31
37-38
autocorrelation, 339, 350-352, 357-358
369-373
aweight (analytical weights), 54
axis label in graph, 66
angle, 81-82
format, 13, 24-25, 76, 305-306
grid, 113-115
suppress, 118, 129, 173
axis scale in graph, 66, 112-118
B
_b coefficients (regression), 230. 269
273-274. 285, 356
band regression. 217-219
bar chart, 94-99, 147, 150-151
Bartlett's test for equal variances, 149-150
batch-mode program, 61
bcskewO (transform to reduce skew). 129
beta weight (standardized regression
coefficient), 160, 164—165
Bonferroni multiple-comparison test
correlation matrix. 172-173
one-way ANOVA, 150-151
bootstrap, 246, 315-316, 382-387
389-394
box plot, 66, 90-91, 118-119, 147,
150-151,389,392 ’
401
402
Statistics with Stata
Box-Cox
regression, 215,226-227
transformation, 129
Box-Pierce Q test (white noise), 341,351,
354, 357-358
browse (Data Browser), 13
bs (bootstrap), 382-387
bsqreg (quantile regression with
bootstrap), 240, 246, 389-394
by prefix, 121, 133-134
c
Ili
II
IIlii' I
li
!.
c chart (quality control), 105
caption in graph, 109-110
case identification number, 38-39
categorical variable, 35-39, 183-185
censored-normal regression, 264
centering to reduce multicollinearity,
212-214
chi-squared
deviance (logistic regression), 271,
275-278
equal variances in ANOVA, 149-150
independence in cross-tabulation, 55,
130-133,281
likelihood-ratio in cross-tabulation,
130-131,281
likelihood-ratio in logistic regression,
267-268, 270, 272-273, 281
probability plot, 105
quantile plot, 105
ci (confidence interval), 124, 255
cii (immediate confidence interval), 124
classification table (logistic regression),
264, 270-272
clear (remove data from memory), 14-15,
23,362
cluster analysis, 318-320, 329-338
coefficient of variation, 123-124
collapse, 52-53
color
bar chart, 95-96
pie chart, 92
scatterplot symbols, 74
shaded regions, 86
combine data files, 14, 42-47
combine graphs. See graph combine
comments in programs. 364, 369-370,
373-374
communality (factor analysis). 326
component-plus-residual plot, 197-198.
202-203
compress, 13. 40, 60-61
conditional effect plot, 230-232,273-274.
284-287
confidence interval
binomial, 124
bootstrap, 383-384, 386
mean, 124
regression coefficients, 163
regression line, 66, 85, 110-112, 160
robust mean, 255
Poisson, 124
constraint (linear constraints), 262
Cook and Weisberg heteroskedasticity test.
197
Cook’s/), 158, 167, 197. 206-210
copy results, 4
correlation
hypothesis test, 160, 172-173
Kendall’s tau, 131, 174-175
matrix, 18, 59, 160, 171-174
Pearson product-moment, 1, 18, 160.
171-173
regression coefficient estimates. 214
Spearman, 174
corrgram (autocorrelation). 339, 351,
357-358, 373
count-time data, 293-295
covariance
regression coefficient estimates, 167.
173, 197,214
variables, 160, 173
COVRATIO, 167, 197, 206
Cox proportional hazard model, 290,
299-305
Cramer’s V, 131
Cronbach’s alpha, 318-319
cross-correlation, 353-354
cross-tabulation, 121, 130-136
ctset (define count-time data), 289,
293-294
!
Index
cttost (convert count-time to survival-time
data). 289. 294-295
cubic spline curve. See graph twoway
mspline
cv (coefficient of variation), 123-124
D
II
I
Data Browser, 13
data dictionary, 41
Data Editor, 13, 15-16
data management, 12-63
database file, 41-42
date, 30, 266, 340-342
decode (numeric to string). 33-34
#delimit (end-of-line delimiter), 61. 116,
362
dendrogram, 319, 329, 331-337
describe (describe data), 3, 18
destring (string to numeric), 35
DFBETA, 158, 167, 197, 205-206,
208-210
DFITS, 167, 197, 206, 208-210
diagnostic statistics
ANOVA, 158, 167
logistic regression, 271,274-278
regression, 167, 196-214
Dickey-Fuller test, 340, 355-356
difference (time series), 349-350
display (show value onscreen). 31-32.39.
211.269
display format. 13, 24-25. 359
do-file, 60-61, 115-116, 361-362,
367-373
Do-File Editor, 60, 361
dot plot, 67, 95,99-100, 150-151
drawnorm (normal variable), 13, 59
drop
variable in memory, 22
data in memory, 14-15, 23, 40, 56
program in memory, 363, 373-375
dummy variable, 35-36, 176-185, 267
Durbin-Watson test, 158, 197, 350
dwstat (Durbin-Watson test), 197, 350
E
e-class, 381,386
1
403
edit (Data Editor). 13, 15-16
effect coding for ANOVA. 250-251
efficiency of estimator, 393
egen, 33, 331, 340, 343
eigenvalue, 318-319, 321, 326
empirical orthogonal function (EOF), 325
Encapsulated Postscript (.eps) graph. 6
116
encode (string to numeric), 13, 33-34
epidemiological tables, 288
error-bar plot, 143, 155-157
estimates store (hypothesis testins),
272-273, 278-279, 282-283
event-count model, 288, 290. 310-313
Exploratory Data .Analysis (EDA),
124-126
exponential filter (time series), 343
exponential growth model. 216, 232-235
exponential regression (survival analysis),
305-307
F
factor analysis, 318-328
factor rotation, 318-319, 322-325
factor score, 318-319,323-325
factorial ANOVA, 142, 152-153, 156
FAQs (frequently asked questions), 8
filter, 343
Fisher’s exact test in cross-tabulation, 131
fixed and random effects, 162
foreach, 365
format
axis label in graph, 76. 305-306
input data, 40-41
numerical display, 13, 24-25, 359
forvalues, 365
frequency table, 130-133. 138-139
frequency weights, 54-55. 66, 73-74, 120,
123,138-140
function
date, 30
mathematical, 27-28
probability, 28-30
special, 31
string, 31
fweight (frequency weights), 54-55,
---- 73-74, 138-140
404
Statistics with Stata
graph twoway spike, 84, 87-88, 347
graph use, 116
graph?, 65
gray scale, 86
greigen (graph eigenvalues), 318-319,
321-322
gsort (general sorting), 14
G
I'
1
I
I.
h
K
f
si
i
generalized linear modeling (GLM). 264,
291,313-317
generate, 13, 23-26, 37, 39
gladder, 128
Gompertz growth model, 234-238
Goodman and Kruskal’s gamma. 131
graph bar, 66-67, 94-99, 147
graph box, 66,90-91, 118-119. 147.389,
392
graph combine, 117-1 19, 147. 150-151,
222, 231-232
graph dot, 67, 95, 99-100, 150-151
graph export, 116
graph hbar, 97-98
graph hbox, 91, 150-151
graph matrix, 66, 77, 173-174
graph pie, 66, 92-94
graph twoway
all types, 84-85
overlays, 66, 85, 110-115, 344-345,
347-348
graph twoway area, 84, 85-86
graph twoway bar, 84
graph twoway connected, 5-6,50-51,66,
79-80, 83-84,114-115,157, 192-193
graph twoway dot, 85
graph twoway Ifit, 66, 74, 85, 110. 168,
181
graph twoway Ifitci, 85, 110-112,
170-171
graph twoway line, 66, 77-82, 112-115,
117,221-222,242,244,247,344-345,
371
graph twoway lowess, 85, 88-89, 216,
219-221
graph twoway mband, 85, 216, 217-219
graph twoway mspline, 85. 182. 190,
218-219, 226, 287-288
graph twoway qfit, 85, 110, 190
graph twoway rarea, 84, 170
graph twoway rbar, 85
graph twoway reap, 85, 89, 157
graph twoway scatter, 65-66, 72-77,
181-182,277, 394
H
hat matrix, 167,205-206, 210
hazard function. 290, 302, 307, 309
help, 7
help file, 7, 375-377
heteroskedasticity, 161, 197, 199-200,
223-224,239,256-258, 290,315,339
hettest (heteroskedasticity test), 197,
199-200
hierarchical linear models, 162
histogram, 65, 67-71, 385
Holt-Winters smoothing, 343
Huber/White robust standard errors, 160,
256-261
i
if qualifier, 13, 14, 19-23, 204-205,209
if...else, 366
import data. 39—42
in qualifier, 14. 19-23. 166
incidence rate, 289-290. 293, 297,
309-310,312
inequality’, 21
infile (read ASCH data). 13-14, 40-42
infix (read fixed-format data), 41-42
influence
logistic regression, 271, 274-278
regression (OLS), 167, 196-198, 201,
204-208
robust regression, 248
insert
graph into document, 6
table into document, 4
insheet (read spreadsheet data), 41-42
instrumental variables (2SLS), 161
i
Index
interaction effect
ANOVA, 142, 152-157, 250-253
regression, 160. 180-185, 211-212,
259-261
interquartile range (IQR). 53, 91,95, 103,
123-124, 126, 135
iteratively reweighted least squares (IRLS)
242
iweight (importance weights). 54
J
jackknife
residuals, 167
standard errors. 314-317
K
Kaplan-Meier survivor function, 289-290
295-298
keep (keep variable or observation), 23,
173
Kendall’s tau. 131, 174-175
kernel density, 65. 70. 85
Kruskal-Wallis test. 142. 151-152
kurtosis, 122-124, 126-127
L
L-estimator, 243
label data. 18
label define, 26
label values, 25-26
label variable. 16, 18
ladder of powers, 127-129
lag (time series), 349-350
lead (time series), 349-350
legend in graph, 78.81,112,114-115,157
221,344
letter-value display, 125-126
leverage, 158, 159, 167, 196, 198,
201-206,210, 229, 246-248
leverage-vs.-squared-residuals plot, 198,
203-204
lilt (fit of logistic model), 264
likelihood-ratio chi-squared. See chisquared
405
line in graph
pattern, 81-82, 84, 115
width, 221, 344, 371
line plot, 77-84
link function (GLM), 291, 313-317
list, 3-4, 14, 17,19, 49, 54,265
•og, 2-3
log file, 2-3, 6-7
logarithm, 27, 127-129, 223-229
logical operator, 20
logistic growth model, 216, 233-234
logistic regression, 262-287
logistic (logistic regression), 185,262-264
269- 278
logit (logistic regression), 267-269
looping, 365-366
lowess smoothing, 88-89, 216, 219-222
Iroc (logistic ROC), 264
Irtest (likelihood-ratio test), 272-273
278-279, 282-283
Isens (logistic sensitivity graph), 264
Istat (logistic classification table) 264
270- 272
Ivr2plot (leverage-vs.-squared-residuals
plot), 198, 203-204
M
M-estimator, 243
macro, 235,334, 363, 365,367, 370, 387
Mann-Whitney U test, 142, 148-149, 152
margin in graph, 110, 113, 117-118
192-193
marker label in graph, 66, 75-76, 202, 204
marker symbol in graph, 66, 73-75, 84
100,183,277
marksample, 368-369
matched-pairs test, 143, 145-146
matrix algebra, 378-382
mean, 122-124, 126,135-137, 139-140,
143-158, 387-389
median, 90-91, 122-124, 126, 135-137
387-389
median regression. See quantile regression
memory, 14, 61-63
merge, 14, 44-50
missing value, 13-16,21,37-38
406
Statistics with Stata
Monte Carlo, 126, 246, 387-394
moving average
filter, 340, 343-344
time series model, 354-360
multicollinearity, 210-214
multinomial logistic regression, 264, 278
280-287
multiple-comparison test
correlation matrix, 172-173
one-way ANOVA, 150-151
I
!
N
i
I’
V 1.1
1
:p
i M
fi ’
negative exponential growth model, 233
nolabel option, 32-34
nonlinear regression, 216, 232-238
nonlinear smoothing, 340-341, 343-346
normal distribution
artificial data, 13, 59, 241
curve, 65
test for, 126-129
normal probability plot.
See
quantile-normal plot
numerical variables, 16, 20, 122
O
OBDC (Open Database Connectivity), 42
odds ratio. See logistic regression
obsenation number, 38-39
omitted-variables test, 197, 199
one-sample t test, 143-146
one-way ANO VA, 149-152
open file, 2
order (order variables in data), 19
ordered logistic regression. 278-280
ordinal variable, 35-36
outfile (write ASCII data), 42
outlier, 126, 239-248. 344, 388-394
overlay two way graphs, 110-115
p
p chart (quality control), 105-107
paired-difference test, 143, 145-146
panel data, 161, 191-195
partial autocorrelation, 339-340, 352
partial regression plot. See added-variable
plot
Pearson correlation, 5, 19, 160, 171-173
percentiles, 122-124, 136
periodogram, 340
Phillips-Perron test, 355
pie chart, 66, 92-94
placement (legend in graph), 114-115
poisgof (Poisson goodness of fit test)
310-311
Poisson regression, 290-291,309-313,317
polynomial regression, 188-191
Portable Network Graphics (.png) graph. 6,
116
Postscript (.ps or .eps) graph, 6, 116
Prais-Winsten regression, 340, 359-360
predict (predicted values, residuals.
diagnostics)
anova, 155-158, 167
arima, 357
logistic, 264, 268-271,284
regress, 159, 165-167, 190, 196-197
205-210,216, 233
principal components, 318-325
print graph, 6
print results, 4
probit regression, 262-263, 314
program, 362-363
promax rotation, 319, 322-325
p weight (probability or sampling weights),
54-56
pwcorr (pairwise Pearson correlation)
160, 172-173, 174-175
Q
qladder, 128-129
quality-control graphs, 67,105-108
quantile
defined, 102
quantile plot, 102-103
quantile-normal plot, 67, 104
quantile-quantile plot, 104-105
regression, 239-256, 389-394
quartile, 91, 125-126
quietly, 175, 182, 188
R
r chart (quality control), 67, 106, 108
7
I
I
Index
407
I
I
i
r-class, 381,387, 390
Ramsey specification error test (RESET),
197
random data, 56-60, 241, 387-394
random number, 30, 56-59, 241
random sample, 14, 60
range (create data over range), 236
range plot, 89
range standardization, 334-335
rank, 32
rank-sum test, 142. 148-149, 152
real function, 35-36
regress (linear regression), 159-165, 239,
386,389-394
regression
absorb categorical variable, 179-180
beta weight (standardized regression
coefficient), 160, 164-165
censored-normal, 264
confidence interval, 110-112, 163,
169-171
constant, 163
curvilinear, 189-191,216, 223-232
diagnostics, 167, 196-214
dummy variable, 176-185
hypothesis test, 160, 175-176
instrumental variable, 161
line, 67, 110-112, 159-160, 168-171,
190,242,244,247
logistic, 262-287
multinomial logistic, 264, 278,
280-287
multiple, 164-165
no constant, 163
nonlinear, 232-238
ordered logistic, 278-280
ordinary least squares (OLS), 159-165
Poisson, 290-291,309-313,317
polynomial, 188-191
predicted value, 165-167, 169
probit, 262-263, 314
residual, 165-167, 169, 205-207
robust, 239-256, 389-394
robust standard errors, 256-261
stepwise, 161, 186-188
tobit, 188,263
transformed variables, 189-191. 216,
223-232
two-stage least squares (2SLS), 161
weighted least squares (WLS). 161,
245
relational operator, 20
relative risk ratio, 264, 281-284
rename, 16, 17
replace, 16, 25-26, 33
RESET (Ramsey test), 197
reshape, 49-52
residual, 159-160, 167, 200-208
residual-vs.-fitted (predicted values) plot,
160, 169, 188-191, 198,200
retrieve graph, 116
robust
anova, 249-255
mean, 255
regression, 239-256
standard errors and variance, 256-261
ROC curve (receiver operating
characteristic), 264
rotation (factor analysis), 318—319,
322-325
rough, 345
rreg (robust regression), 239-256,
389-394
rvfplot (residual-vs.-fitted plot), 160,
188-191,198,200
rvpplot (residual-vs.-predictor plot
S
sample (draw random sample), 14,60
sampling weights, 55-56
sandwich estimator of variance, 160,
256-261
SAS data files, 42
save (save dataset), 14,16, 23
save graph, 6
saveold (save dataset in previous Stata
format), 14
scatterplot. Also see graph twoway
scatter
axis labels, 66, 72
basic, 66-67
marker labels, 67, 74-75, 202-204
408
11
1
•f
n
II
i
Statistics with Stata
marker symbols. 72-73. 119. 182-183
matrix, 66, 77. 173-174
weighting, 66, 74-75, 207-208
with regression line. 66, 110-112,
159-160, 181-182
Scheffe multiple-comparison test. 150-151
score (factor scores), 318-319. 323-325
scree graph (eigenvalues), 318-319,
321-322
search, 8-9
seasonal difference (time series). 349-350
serrbar (standard-error bar plot), 143,
155-157
set memory, 14, 62-63
shading
color, 86
intensity, 91
Shapiro-Francia test. 127
Shapiro-Wilk test, 127
shewart, 106
Sidak multiple-comparison test. 150,
172-173
sign test, 144-145
signed-rank test, 143 146
skewness, 122-124, 126-127
sktest (skewness-kurtosis test). 126-127,
383
slope dummy variable, 180
SMCL (Stata Markup and Control
Language), 376-377
smoothing, 340-341, 343-346
sort. 14. 19,21-22, 166
Spearman correlation, 174-175
spectral density, 340
spike plot, 84, 87-88, 347
spreadsheet data, 41-42
SPSS data files, 42
standard deviation, 122-124, 126. 135
standard error
ANOVA, 155-157
bootstrap. See bootstrap
mean. 124
regression prediction, 167, 169-171
robust (Huber/White), 160,256-261
standardized regression coefficient, 160,
164-165
standardized variable, 32, 331
Stat/Transfer, 42
Stata Journal, 10-11
Statalist online forum, 10
stationary' time series, 340, 355-356
stcox (Cox hazard model), 290, 299-303
stcurve (survival analysis graphs), 290,
307
stdes (describe survival-time data), 289,
292-293
stem-and-leaf display, 124-125
stepwise regression, 161, 186-188
stphplot, 290
streg (survival-analysis regression), 290,
305-309
string to numeric, 32-35
string variable, 17, 40-41
sts generate (generate survivor function),
290
sts graph (graph survivor function), 289,
296,298
sts list (list survivor function), 290
sts test (test survivor function), 290, 298
stset (define survival-time data), 289,
291-292, 297
stsum (summarize survival-time data), 289,
293, 297
studentized residual, 167, 205, 207
subscript, 39-^40, 343
summarize (summary statistics), 2,17,20,
31-32.90-91, 120-124,383
sunflower plot, 74-75
survey sampling weights, 55-56, 161, 263
survival analysis, 288-309
svy: regress (survey data regression), 161
svyset (survey data definition), 56
sw (stepwise model fitting), 186-188
symmetry plot, 100, 102
I
Index
syntax (programming), 368-369
T
*
t test
correlation coefficient, 160, 172-173
means, 143-149
robust means, 255
unequal variance, 148
table, 121, 134-136, 152
tabstat, 120, 123-124
tabulate, 4, 15, 36-37, 56, 121, 130-133
136
technical support, 9
test (hypothesis test for model), 160,
175-176,312
text in graph, 109-110, 113, 222
time plot, 77-84, 343-348
time series, 339-360
tin (times in), 346-347, 350, 359
title in graph, 109-110, 112-113
tobit regression, 188, 263
transfer data, 42
transform variable, 126-129,189-190,216
transpose data, 47-49
tree diagram, 319, 329, 331-337
tsset (define time series data), 340, 342,
346
tssmooth (time series smoothing).
340-341, 343-346
ttest, 143-149, 392
Tukey, John, 124
twithin (times within), 346-347
two-sample test, 146-149
two-stage least squares (2SLS), 161
U
unequal variance in t test, 143, 148-149
uniform (random number generator), 30
56-58,241
unit root, 355-356
use, 2-3, 15
V
variance, 122-124, 135,214
variance inflation factor, 197, 211-212
varimax rotation, 319, 322-325
409
version, 364
W
web site, 9
Weibullregression (survival analysis), 305,
307-399
weighted least squares (WLS), 161, 245
weights, 55-57,74-75,122-124.138-140
161
Welsch’s distance, 167, 206-210
which, 374
while, 365-366
white noise, 341, 351, 354. 357-358
Wilcoxon rank-sum test, 142. 148-149
152
Wilcoxon signed-rank test. 143. 146
Windows metafile (.wmf or .emf) eraph 6
116
wntest (Box-Pierce white noise O test)
341
word processor
insert Stata graph into. 6
insert Stata table into, 4
X
x axis in graph. See axis label in graph,
axis scale in graph
x-bar chart (quality control), 106-108
xcorr (cross-correlation), 353-354
xi (expanded interaction terms), 160
183-185
xpose (transpose data), 48-^19
xtmixed (multilevel mixed-effect models)
162
xtreg (panel data recession), 161,
191-195
Y
y axis in graph. See axis label in graph,
axis scale in graph
Z
z score (standardized variable), 32, 331
j
Your Guide to a Powerful, State-of-the-Art Statistical ProgramNow updated for use with Version 9!
For students and practicing researchers alike, Statistics with Stata opens the door to full use of the popular Stata
program—a fast, flexible, and easy-to-use environment for data management and statistical analysis. Now integrating
a a s impressive new graphics, this comprehensive book presents hundreds of examples showing how you can apply
Stata to accomplish a wide variety of tasks. Like Stata itself, Statistics with Stata will make it easier for you to
move fluidly through the world of modern data analysis. Its contents include:
A A complete chapter on database management,
including sections on how to create, translate,
update, or restructure datasets.
A A detailed, example-based introduction to the
new graphical capabilities of Stata. Topics
range from simple histograms and time plots to
regression diagnostics and quality control
charts. New sections describe methods to
combine or enhance graphs for publication.
A Basic statistical tools, including tables, para
metric tests, chi-square and other nonparamet
ric tests, t tests, ANOVA/ANCOVA, correlation,
linear regression, and multiple regression.
A Advanced methods, including nonlinear,
robust, and quantile regression; logit, multino
mial logit, and other models for categorical
dependent variables; survival and event-count
analysis; generalized linear modeling (GLM),
factor analysis, and cluster analysis—all
demonstrated through practical, easy-to-follow
examples with an emphasis on interpretation.
A Guidelines for writing your own programs in
Stata—user-written programs allow creation
of powerful new tools for database management
and statistical analysis and support computa
tion-intensive methods, such as bootstrapping
and Monte Carlo simulation.
Data files are available at http://www.duxbury.com, the Duxbury Web site.
THOMSON
——--------------BROOKS/COLE
Visit Brooks/Cole online at www.brookscole.com isbn
M
049510972X
• H STata vcrs q P
statistics with
.
.
tor your learning solutions: www.thomson.com/learning
4
I
HAM ILTON
JiiinBiiiiiiijiiiiiiil
- Media
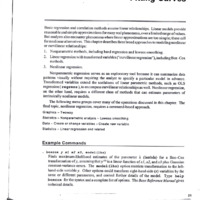 10002 PART-2.pdf
Position: 365 (62 views)