Cleaner air and better transport making informed choices
Item
- Title
-
Cleaner air and better transport
making informed choices - extracted text
-
CHOICES FOR SUSTAINABILITY: 1
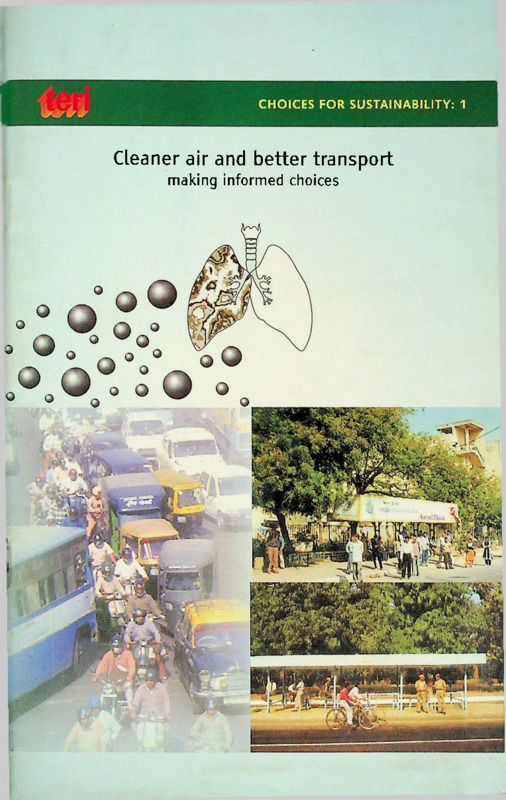
Cleaner air and better transport
making informed choices
Cleaner air and
better transport in cities
making informed choices
©Tata Energy Research Institute, 2000
ISBN 81-85419-69-8
No material in this publication can be reproduced, as presented, in
any form or by any means without prior permission of the publisher.
Published by
Tata Energy Research Institute
Darbari Seth Block
Habitat Place
Lodhi Road
New Delhi - 110 003
India
Telephone 460 1550 or 462 2246
E-mail outreach@teri. res. in
Fax 462 1770 or 463 2609
Web site www.teriin.org
City code 11
Country code 91
Printed in India by Multiplexus (India), 94 B D Estate, Timarpur, Delhi - 110 054
O turn a clean sheet of white paper into a sheet of carbon
paper within 8 hours, all you need to do is to filter ordinary air
through it—air pollution will do the rest. If you find that hard to
believe, here are the details of what researchers at teri (Tata Energy
Research Institute) observe virtually every week.
At a spot only a few metres away from Lodhi Road, one of the
leafier roads of New Delhi, stands a strange-looking contraption
(Figure 1).Twice every week, at 6 o’clock in the morning, a fresh,
spotless, white sheet of paper is placed atop the device, resting flat on
a supporting platform. The sheet is of the same size as that used in
most photocopiers. Air is sucked through the sheet of paper at a steady
rate. The paper is porous but the openings are so fine that only parti
cles that are 1 micrometre or smaller can pass through. (A human
body’s in-built filter - the hair inside the nose and the moist lining of
the air passage - can retain only those particles that are ten times as
large.) Eight hours later, when the paper is removed, you can hardly
distinguish it from carbon paper: it is thickly coated with dust and
soot, some 160 milligrams of it on an average day (Figure 2). Over the
24-hour sampling period, the paper is changed every 8 hours, which
means that we have a good sample of air as found in three periods:
6 o’clock in the morning to 2 o’clock in the afternoon; 2 in the
afternoon to 10 in the evening, and 10 in the evening to 6 the next
T
Figure 1 Airsamplerto measure air pollution
2
Cleaner air and better transport in cities
Figure 2 Pollutants turn a white filter paper to grey or black
morning. By analysing the substances retained on the filter paper, it is
possible to guess their source in some cases: silica would indicate the
sandy soil of the desert; lead points to traffic; ash means the thermal
power stations that burn coal; and so on.The device is also used for
sampling gases, namely nitrogen dioxide, sulphur dioxide, and ozone,
that are serious pollutants.
How does polluted air affect your health?
Severe air pollution can kill.The week that followed the infamous
‘peasouper’ fog in London in December 1952 left 4700 people dead.
The elderly and those suffering from heart or lung diseases were the
most common victims. Pregnant women, children, and the elderly are
particularly susceptible to polluted air and so are those - traffic police
men, taxi- and autorickshaw-drivers, and garage attendants, for in
stance - who are exposed to polluted air for many hours a day at a
stretch. The Central Road Research Institute in New Delhi carried out
a study that compared such health problems as irritation of the eye
and the throat among traffic policemen and those who work in offices.
The study found that irritation of the eye was far more common
(94%) among the policemen than among office workers (28%).
Problems related to the throat were equally high in the policemen
whereas the figure among office workers was less than 15%.
The most common air pollutants
3
An active adult breathes in, on an average, about 15 000 litres of air
each day but those engaged in hard manual labour or physical exercise
inhale many times that amount during the physical activity. Children
can be particularly susceptible to air pollution because they not only
take in more air (if compared to adults on the basis of body weight)
but their airways are narrower, their lungs are not fully developed, and
they are more active than adults.
The most common air pollutants are (1) fine particles of soot, dust,
etc., collectively known as spm (suspended particulate matter) or tsp
(total suspended particulates), (2) nitrogen dioxide and other oxides
of nitrogen, (3) sulphur dioxide, (4) carbon monoxide, (5) hydrocar
bons, and (6) ozone. Lead is also a serious pollutant in the developing
world where the use of lead-free petrol is not yet common.
Suspended particulate matter (which includes fine soot, dust,
pollen grains, and so on found floating in the air) consists of particles
that are smaller than 100 micrometres (the diameter of a human hair
is about 50 micrometres). The larger of such particles (greater than 10
micrometres across) are filtered out before they can reach the air
passage but the smaller ones collect in the middle of the respiratory
tract—particles smaller than a micrometre penetrate as far as the
remotest parts of the lungs, namely the alveoli or the air sacs. It is
through walls of the alveoli that oxygen taken in with breath is ex
changed for carbon dioxide, which is expelled as we breathe out. A
study carried out by theVallabhbhai Patel Chest Institute in Delhi that
compared the residents of two areas - one had a much higher concen
tration of suspended particles in the air than the other - showed that
the lungs of those who lived in the more polluted locality clearly
performed worse than of those from the less polluted locality.
Literature on pollution talks of two grades of particulate matter,
PM10 and PM2.5, which tell us the size of particles: PM10 includes
all particles with a diameter of up to 10 micrometres; PM2.5 refers to
even finer particles, namely those that are 2.5 micrometres or smaller.
The finer the particles, the deeper they penetrate and the longer the
remain airborne.
Nitrogen dioxide is transformed in the lungs to nitrosamines,
some of which are carcinogenic. When exposed to high concentrations
of nitrogen dioxide, the tubes that form a part of the respirator}'
system can contract, thus narrowing the air passage.
Sulphur dioxide, a colourless but sharp-smelling gas, affects
breathing: air passages, the fine tubes that transport air to the lungs,
can become narrower when exposed to it, which means that those
4
Cleaner air and better transport in cities
with coughs, colds, or lung diseases, and the very young and the very
old, are particularly affected.The characteristic smell in streets con
gested with lorries, buses, and other diesel-powered vehicles is mainly
due to sulphur dioxide.
Carbon monoxide, a colourless and odourless gas, combines
more readily with blood than oxygen does, thus cutting down the
amount of oxygen that reaches our blood. Even in small quantities
(100 ppm, or 100 parts of carbon monoxide per million parts of air),
carbon monoxide makes us feel drowsy and slows down our reflexes;
in large doses, it can make us unconscious and can even be fatal.
Hydrocarbons are fine particles of unburnt petrol and oil. Some
of the chemicals associated with hydrocarbons are very strong irritants
for the eye and the throat, some are carcinogenic, and most are re
sponsible for unpleasant smells.
Ozone is a colourless gas with a pungent smell. It is formed when
nitrogen dioxide reacts with some of the hydrocarbons in the presence
of sunlight. Ozone can make eyes itch, bum, and water; lower our
resistance to colds and pneumonia; and make breathing harder,
especially for children and the elderly and those engaged in vigorous
physical activity. Ozone is worse for those who suffer from asthma
because it increases the effect of allergens.
Two or more of the pollutants often act in tandem. Particles of
suspended matter act as carriers for gases by trapping them within the
fine cavities present inside some porous particles. Air in cities is pol
luted with these and several other pollutants, though different pollut
ants are present at times and in differing amounts, depending on the
season, time of day, and the sources of pollution. Thermal power
stations that burn coal, for example, release large amounts of ash into
the atmosphere and cotton mills emit fine particles of cotton. It is
necessary to know what the major sources of pollution are in a given
city and how much each of them contributes to the pollution—hence
the need to measure the extent of pollution and to maintain accurate
statistics.
What do the statistics on air pollution really mean?
‘In Delhi, motorized transport (buses, cars, scooters and motorcycles,
and so on) is responsible for 64% of the total pollution.’This must be
one of the most frequently quoted statistic in any debate or article
about air pollution. Revised estimates are even higher (67% in the
1997 White Paper on pollution in Delhi and 70% in the June 1999
issue of Parivesh, the newsletter of the Central Pollution Control
Looking beyond pollution statistics
5
Board). No matter what the number is, we should look beyond it:
what does the number really mean? Pollution is not a concrete, ho
mogenous entity that can be precisely apportioned. It is not as though
there is this large pie called pollution and two-thirds of it is contrib
uted by motorized transport—the facts are a little more complicated
than that. First, what the oft-quoted statistic takes as pollution is the
total, by weight, of five pollutants, namely (1) suspended particulate
matter, (2) oxides of nitrogen, (3) sulphur dioxide, (4) carbon monox
ide, and (5) hydrocarbons, emitted to the atmosphere every day. That
total is estimated to be 1825 tonnes (data for 1998/99) by the Central
Pollution Control Board.
However, the five pollutants are not strictly comparable weight for
weight. Carbon monoxide, for example, can be deadly even in very
small doses whereas smoke or dust has less serious immediate conse
quences. Secondly, the actual quantities of each of the pollutant are
arrived at by a series of elaborate calculations and not by direct meas
urement. And estimates of how much pollution is caused by each of
the major sources, namely motorized vehicles, thermal power stations,
factories, and households, are the result of even more assumptions and
calculations.
Thirdly, a city is not a closed box that retains all the pollutants
generated within its four walls; die atmosphere is a dynamic system,
turbulent and complex, that respects no boundaries. Simply measur
ing the mass of pollutants is not adequate; we must consider how
much room do the pollutants have to disperse. Just as smoking in a
small, poorly ventilated room has greater impact on air quality than
smoking in large, open spaces, though the amount of smoke is more or
less the same, so it is with pollution due to transport. Pollution figures
are, therefore, often expressed in terms of the quantity of a pollutant
within a given space, grams or micrograms per cubic metre of space,
for instance. It is these figures that are quoted for different cities, as a
part of the weather report, in the Star News on the television. The
concept of air quality standards is explained in Appendix A.
All this is not to say that air pollution in cities is not a serious
problem. Something that shortens life, makes hundreds of drousands
of citizens more prone to diseases, and lowers the quality of life for all
is very serious indeed. But what we have set out to do in this little
book is to help you make sense of what you read or hear about die
topic through the mass media - and you are going to see a lot of that
in the years ahead - and to let you figure out how best you could
contribute to making our cities healthy and liveable once again.
6
Cleaner air and better transport in cities
How does transport contribute to air pollution?
All vehicles that are powered by petrol, diesel, natural gas, or any
other petroleum product emit, or give out, pollutants as the fuel is
burnt inside their engines. However, some vehicles are more polluting
than others, depending upon the kind and quality of fuel, how effi
ciently they burn it, what mechanisms — if any — they have in place to
‘neutralize’ pollutants, and so on.Thus, petrol-driven vehicles have a
different pattern of pollution than diesel-powered vehicles; four-stroke
engines (used in cars, some motorcycles, and the newer models of
three-wheelers) emit less of unburnt oil than two-stroke engines (used
in most scooters, mopeds, some motorcycles, and the older models of
three-wheelers) do; and cars that use catalytic converters are less
polluting because the pollutants are neutralized to carbon dioxide,
water vapour, and nitrogen (an inert gas).
Broadly speaking, petrol-driven vehicles (cars and those motorcy
cles, scooters, etc. that use the more efficient four-stroke engine) emit
more of unburnt petrol and carbon monoxide whereas diesel-powered
vehicles (buses and lorries) emit more of soot (the technical term for
which is ‘suspended particulate matter’) and oxides of nitrogen.
Autorickshaws, scooters, motorcycles, mopeds, and so on that run on
two-stroke engines use petrol mixed with lubricating oil and, as a
result, emit large quantities of unbumt petrol besides carbon monox
ide and soot. The problem is aggravated if petrol and the lubricating
oil are not mixed in the right proportion; there is incentive enough to
add excess of oil because it is cheaper. That is why it is now manda
tory to use pre-mixed 2T oil. Tyres, brake linings, and clutch pads are
also a source of fine particles of aluminium, asbestos, cadmium,
chrome, cobalt, copper, nickel, and zinc.
A toxic metal that can be directly traced to transport-related pollu
tion is lead added to petrol. Making the use of lead-free petrol manda
tory will eventually reduce the concentration of lead. The Central
Pollution Control Board has already reported a decrease in the con
centrations of lead after lead-free petrol was introduced in Delhi.
In cities, a large number of vehicles ply within a small area, and
the pollutants they release cannot escape easily because open spaces
are few; most of the area is taken up by buildings, and high-rise
buildings, in particular, often act as barriers to quick dispersal of
the pollutants.This makes motorized transport the major cause of
air pollution.
It is not just the number of vehicles but the way they are driven on
city roads that contributes to pollution. A drive on the city roads is
qualitatively different from that on long stretches of straight roads. A
How air pollution is estimated
7
car speeding along a highway at, say, 45 kilometres an hour burns fuel
more efficiently than a car in a city that has to slow down and stop
frequently.
Typical journeys are represented by a ‘driving cycle’.The Indian
Institute of Petroleum in Dehra Dun once carried out a detailed study
of typical driving cycles in Delhi. The researchers selected four sample
routes, each representing a typical journey through (1) a business area,
(2) an area with high concentrations of slow-moving vehicles, (3) a
highway, and (4) a residential area. As expected, trips on city roads are
far from smooth and efficient: within the time it took to cover only 4
kilometres, a car had to repeat the entire cycle of picking up speed,
driving at a steady speed, slowing down to a halt, and idling (waiting
at traffic lights, for instance) as many as six times. The average speed
was only about 25 kilometres an hour and a steady cruising speed was
a little under 40 kilometres an hour. It is important to know the
patterns of such representative trips in order to estimate the amount of
pollutants emitted by different types of vehicles.
So, how much does the transport sector contribute to the air
pollution? A rough estimate is that it is responsible for about twothirds of the pollutants in Delhi, half of those in Mumbai, and a dtird
of those in Calcutta. Such figures are gross approximations, if we see
how they are arrived at.
How is air pollution estimated?
The amount of pollution is taken to be the quantity of pollutants, in
tonnes, emitted within a day or over one year. Five pollutants are
taken into account for such calculations, namely (1) spm (suspended
particulate matter, which includes airborne dust, pollen grains, fine
droplets of oil, soot, and so on), (2) sulphur dioxide, (3) oxides of
nitrogen,
(4) carbon monoxide, and (5) hydrocarbons. To arrive at any mean
ingful estimates, we need to know the following items of information.
n How many vehicles of each type (cars, buses, two- and three
wheeled vehicles, and so on) ply regularly within a city?
° How many kilometres does each type of vehicle travel in a typical day?
a How much fuel is consumed to cover that distance?
° How much of each of the pollutants - carbon monoxide, oxides of
nitrogen, particulate matter, and so on - is emitted by each type of
vehicle (expressed in milligrams per litre of fuel, for example)?
° What is the total quantity of pollutants from all other sources thermal power stations, factories, natural sources, and so on released into the air every day?
8
Cleaner air and better transport in cities
Appendix B shows how the amount of pollutants emitted by
different categories of motorized vehicles is calculated step by step,
taking the example of diesel-operated buses in Delhi. As you can see,
each number can only be an approximation. Secondly, each number is
subject to change, depending on many factors: season, quality of fuel,
quality' of maintenance, quality of roads, accuracy in recording data,
and so on. Thirdly, at least some of the numbers keep changing all the
time: new vehicles come on the road, old ones are discarded, more
efficient machines are developed (which changes the amount of
pollutants given out for each kilometre), and so on.
The extent of pollution is expressed in different ways: as a total
quantity, as a concentration, and as exposure. It is essential to under
stand the difference because different agencies often choose the num
bers most convenient to them. Earlier in this section, and in the above
list, we talked of pollution as a total quantity, expressed in grams,
tonnes, or other units of mass. This is a broad measure, most conven
ient but least meaningful because it does not relate easily to air quality.
To take a simple example, half a kilo of salt gives us no indication of
how salty it can be: it can be extremely salty if dissolved in a litre of
water and not salty at all if dissolved in 1000 litres.
Concentration is a better measure because it relates pollution to air
quality: it tells us how much pollutant there is in a given quantity of air
(usually expressed in micrograms per cubic metre). Air quality stand
ards use concentrations and not total quantity. In the above example,
the water is salty in the first case because there is 500 grams of salt per
litre of water (50% concentration) and not salty at all in the second
case because there is only 0.5 gram per litre of water (0.05%).
To assess the effects of pollution on health, however, it is important
to know not only the concentration but also the time over which one is
exposed to it. Within certain limits, higher concentrations by them
selves may be less harmful if one is exposed to the pollutants for a
short time compared to a longer exposure to lower concentrations.
The exposure is thus a function of not only how bad the air is but also
of how long one is exposed to such bad air. Exposure is accordingly
expressed in, say, micrograms per cubic metre per hour. It is this that
makes indoor air pollution a serious matter especially for the poor,
who cannot afford such clean fuels as gas or electricity: women and
very young children spend long hours in ill-ventilated kitchens full of
smoke from firewood or coal.
Learning and perception influence travel behaviour
9
Traffic, congestion, and pollution
Polluted air is a symptom, not a cause—the cause is the absence of a
coherent, integrated policy for transport. Attempts to control air
pollution without improving the way transport is managed in cities is
like dipping the thermometer in a bucket of ice to escape summer
heat. To find out why more and more people now prefer using their
own transport — scooters and motorcycles, cars, vans, and so on - to
public transport such as buses, we must find out why they travel in the
first place and the basis on which they choose one ‘mode’ of transport
over the others; in the jargon of management, we need to consider
‘travel demand’ and then see how that demand can be met effectively.
In fact, OECD (Organisation for Economic Co-operation and Devel
opment) sponsored two major workshops on individual travel behav
iour that brought together social scientists including psychologists and
cultural anthropologists to discuss how insights from these fields could
be used to influence transport choices of people and transport policies
of governments. The report of the workshop that investigated culture,
choice, and technology offers a rich fare to transport planners and
describes how learning and perception influence travel behaviour and
how childhood experience of mobility shapes the choices made on
reaching adulthood. Since travelling to school or a college ranks next
only to travelling to the place of work as the most common purpose of
travel, the modal choice - whether schoolchildren use public transport
(including school buses) or are ferried by their parents in cars or on
motorcycles and so on - can have a substantial impact on the trans
port scenario in any city. ‘Because of parents’ fear of traffic acci
dents, children are increasingly ferried around in cars. This leads to
the vicious circle in which the streets and public transport become
even more dangerous leading to still greater dependence on the car. As
this cycle progresses from generation to generation, people develop
new car-based cognitive maps of their surroundings and lose accumu
lated knowledge of non-car travel, further reinforcing the inevitability
of car use. Participants [in the workshop on travel behaviour] felt that
one important policy objective would be to help children and young
adults develop new cognitive maps of their world based on a number
of different transport modes. This necessarily involves allowing chil
dren to experience non-car-based mobility.’
Finding out why people travel and providing them acceptable
alternative means can effectively reduce the number of vehicles on the
10
Cleaner air and better transport in cities
road. And the reasons for undertaking the journey may not be the
same for men and women. A survey in Delhi showed that travelling for
work accounted for 66% of the trips in the case of men but only 32%
in the case of women: education, on the other hand, was the purpose
behind 55% of the trips undertaken by women but only 26% by men.
(Education in this case included taking children to school.) One
survey in Britain found that many parents use cars to take their chil
dren to school, and a safe and efficient bus sendee can serve the
purpose equally well: soon after such a bus service was introduced, the
number of car trips fell markedly. A bus operator in Nottingham
provided ‘seven days of free travel to 200 motorists who had not used
the bus for five years. ••• Of the 200 motorists, 60% were still using the
bus on at lease three days per week two years later.’
In terms of efficiency, public transport wins hand down against
personal or private motorized transport on nearly all the counts. In
one hour, buses can transport 1400 people along a distance of 10 km
whereas cars can transport only 320. Similarly, a bus emits only about
110 grams of pollutants to move 1000 passengers over a distance of
10 kilometres whereas cars would emit roughly 150 grams in the
process. In terms of fuel, the cost would be roughly 80 litres of diesel
for the bus and 270 litres of petrol for the car. And these
differences multiply when we consider the extent of travel: in Delhi,
more than 4 million people travel every day over distances that range
from 2 to 20 kilometres. For large cities, the average travel demand
runs to billions of passenger-kilometre a day. (A passenger-kilometre
is a useful unit in transport; 5 passengers who travel 10 km each
amount to 50 passenger-kilometres and so do 25 passengers travelling
2 km each.)
Transport planners talk in terms of‘trips’ and ‘modal split’. A trip
refers to a single journey performed by one individual. If you com
mute to work every day, it amounts to two trips but if you return
home for lunch, it would mean two more trips. ‘Modal split’ means
the share of each ‘mode’ of transport - walking, cycling, a ride on a
public bus or railway, hiring a taxi, or using your own transport (a car
or a motorcycle and so on) - in the total number of trips made in a
day in one city. For example, one survey, carried out in 1994, showed
that public buses accounted for roughly 62% of the nearly 4 million
trips in Delhi; cars and two-wheeled vehicles accounted for nearly
25%; cycles, another 6.6%; and taxis and autorickshaws, 2.9% (Fig
ure 3). In Mumbai, on the other hand, buses and railway accounted
for 80% of the trips. A study conducted by the Central Road Research
Modal split: shares of different modes of transport
11
Institute showed that on many arterial roads of Delhi, during peak
hours, bicycles make up more than 30% of the traffic.
However, such information too is based on many assumptions and
subject to all the limitations that apply to it.To collect reliable infor
mation, in quantities that are adequate for the purpose of planning, is
expensive. The Central Institute of Road Transport in Pune, the
Central Road Research Institute in New Delhi, and rites (Rail India
Techno-Economic Services), also in New Delhi, are some of the major
institutions that undertake surveys of transport demand, modal split,
and so on, and so do the corporations that run public transport. The
latest years for which such data are available are 1995 for Delhi and
Chennai and 1986 for Mumbai.
As cities continue to grow and expand, the number of vehicles on
the road also goes up, and so does the amount of pollutants (Fig
ure 4). As cities expand, more and more people need to travel over
increasingly longer distances. But the network of roads grows very
slowly, if at all. A useful measure is the space occupied by roads as a
percentage of the total area of a city. The standard for metropolitan
12
Cleaner air and better transport in cities
cities is 30% whereas in most Indian cities, the figure is below 10%.
Another indicator is the number of vehicles for every kilometre of
road, a figure that runs to more than 500 for Delhi and about 350 for
Mumbai and Calcutta but less than 100 for Chennai.The higher this
number, the greater the need for efficient traffic management.
Given such congested roads, traffic jams are inevitable. Buses and
cars move much more slowly on the city roads than before. In Delhi,
average speeds dropped by as much as 65% between 1985 and 1995.
In central Delhi, the average speed ranges from 15 to 28 kilometres
per hour. On Lady Jamshedji Road in northern Mumbai, the average
speed was 32 km in 1962; by 1979, it was only 16 km.The average
waiting time at traffic signals also continues to increase—and slowmoving or idling cars emit more pollutants than those moving at
cruising speeds.
Hundreds of vehicles - scooters and motorcycles, cars, buses, and
lorries - idling at traffic intersections is a common sight in many cities.
What do such hold-ups cost? The more obvious cost is that of the
wasted fuel, which could well be the tip of the iceberg. The true costs,
in terms of pollution, wasted time, and effects on mental and physical
health can be staggering. In terms of fuel alone, the figure was over
100 000 litres of diesel and over 320 000 litres of petrol a day, as
estimated in a recent study of major traffic intersections in Delhi by
the Central Road Research Institute. The Tata Energy Research
Institute made a detailed study of one of the busiest intersections in
Delhi, namely the ITO (which takes its name because of the income
Managerial and technological strategies
13
tax office).'Hie results of the study are particularly illuminating:
during a typical day, cars and two-wheelers account for 65% of the
vehicles that arrive or pass through the ITO junction but carry only
18% of the commuters: buses form only 9% of the vehicles but carry
77% of the commuters. Imagine, then, the chaos at this busy junction
with hundreds of vehicles of all sorts vying for the limited space,
moving at a snail's pace or waiting for traffic lights to go green, and
pumping pollutants into air all the time—small wonder that the
junction has been rated the most polluted in Delhi.
Seven basic strategies to reduce air pollution
Whether it is fine particles of soot, tiny droplets of unburnt petrol or
diesel, or such gases as carbon monoxide and sulphur dioxide, all air
pollution caused by motorized vehicles - cars, motorcycles and scoot
ers, buses, and so on - can be ultimately traced to the burning of fuel
within the engines of these vehicles. Logically, therefore, strategies to
reduce such pollution aim at reducing fuel consumption, using cleaner
fuels, and trapping the pollutants. Seven strategies are presented here,
grouped into management strategies and technological strategies.
Management strategies redefine the problem of controlling air
pollution as that of meeting the travel needs of a large population
efficiently and effectively. And a successful approach to that problem is
unlikely to be ‘predict and provide’, as the recent white paper on
transport in the UI< puts it. No city can expand its road network to
keep pace with the number of automobiles on its roads; there is
neither room nor money for that. Perhaps transport planners should
look at those who work in the power sector; after all, meeting public
demand for a regular supply of electricity and meeting the public’s
travel needs have a great deal in common. ‘Demand-side manage
ment’ is a well-recognized concept in the power sector: it aims at
influencing die ways in which consumers use electricity to ensure that
it is used efficiently. Advising consumers to avoid wasting electricity,
encouraging them to use energy-efficient appliances, and promoting
the use of such alternatives as solar water heaters and solar cookers are
all examples of good ‘demand-side management’.These measures
seek to check demand instead of increasing supply.
Technological strategies typically treat the problem of containing
air pollution not as a management issue but a technical problem: that
of reducing the amount of pollutants emitted from different engines
and of trapping the pollutants once they are produced. The source of
all pollutants is the fuel itself.The way it is burnt within an engine also
14
Cleaner air and better transport in cities
determines the amount of pollutant emitted from the engine. Accord
ingly, strategies to reduce pollution include such options as using
alternative fuels, using cleaner grades of conventional fuels (petrol and
diesel), burning them more efficiently, neutralizing or trapping the
pollutants before they are released, and preventing them from spread
ing by putting barriers. Each of these approaches has its own pros and
cons. Lead-free petrol is free of lead all right but contains benzene,
which increases the amount of another pollutant, known to be carci
nogenic, namely polyaromatic hydrocarbons. More practically, leadfree petrol is not as commonly available outside die major metropoli
tan cities, at least at present (early 2000).
Here are the seven strategies, each of which is elaborated later.
1 Reduce the demandfor travel. By reducing the need to travel in the
first place - by relocating offices and factories, by ensuring that
newer cities are better planned, by encouraging ‘telecommuting’,
and so on - or by providing such alternative means of transport as
car pools and public buses, we can reduce the total number of
kilometres covered by a given fleet of vehicles.
2 Manage travel demand more efficiendy. No matter how successful we
are in cutting down the total travel in motorized vehicles, they are
here to stay. Therefore, we need to see how we can make that travel
least polluting. Good traffic management (e.g. disciplined parking,
synchronized traffic lights, priority’ for buses) is the key to manag
ing travel demand. We must remember that using road space
equitably' means focusing more on moving people, not vehicles,
more efficiently.
3 Use fuels that do not contain the polluting component at all. These
alternative fuels include not only such futuristic fuels as hydrogen,
electricity, and solar power but also the more traditional ones as
animal power (horse-drawn carriages, bullock carts, etc.) or even
human power (cycle rickshaws and bicycles, for example).
4 Use fuels that contain only traces ofpollutants. Using low-sulphur
diesel, which contains only 0.05% sulphur (whereas the diesel
commonly used in India contains five times as much), is an exam
ple of a strategy that seeks to check pollution at source by using
superior-quality fuels.
5 Burn fuels more efficiently.The amount of pollutants emitted by an
engine depends not only on the quality of fuel but also on how
efficiently that fuel is burnt. Lean bum engines, for example,
achieve better combustion by ensuring that air and fuel are mixed
in the right proportion in the combustion chamber of an engine.
Eliminating or reducing the need to travel
15
Trap the pollutants before they escape into the atmosphere. Catalytic
converters illustrate this approach. These devices, fitted near the
exhaust pipes of cars, neutralize three major pollutants, namely
carbon monoxide, hydrocarbons, and oxides of nitrogen, by con
verting them to harmless gases, namely carbon dioxide, nitrogen,
and water vapour. Devices that trap the pollutants have also been
developed for diesel-powered buses.
7 Prevent pollutants from spreading by putting barriers in their path.The
last strategy aims at reducing the extent to which we are exposed to
pollution by putting barriers in the path of the pollutants. Leafy
trees, for instance, can remove dust from the atmosphere. Face
masks are perhaps the last bastion in the battle against pollution.
6
In the following pages, each of these seven strategies is discussed
briefly.The management strategies are discussed in greater detail
because they are about actions that we can take right now - without
waiting for the more refined technologies - and about actions that are
more cost-effective.
Reduce the demand for travel
Eliminate or reduce the need to travel
As cities expand, more and more people are forced to cover increas
ingly longer distances. Mumbai provides an extreme example: several
hundred, living as far away as Pune and Surat, travel to Mumbai daily
for work-train journeys that take at least 3.5 hours each way, claiming
nearly a third of every commuter's total working life. Planning may
eliminate such long commutes but, as a solution, it offers little hope to
cities that are already bursting at their seams. Staggering working
hours, relocating large offices, and streamlining civic administration to
reduce the number of visits citizens are required to make for routine
tasks (paying electricity bills, for instance) are some of the measures
that can reduce travel demand.
Perhaps the most promising way to cut down the need to travel is
offered by information technology, particularly the Worldwide Web.
Just as e-mail has caused a perceptible drop in the volume of mail
handled by the post office, transacting routine tasks over the Internet
or telephone can eliminate thousands of trips. Recent newspaper
reports put the total cost of constructing the 20 flyovers planned for
Delhi at over four billion rupees: it will be interesting to estimate the
potential benefits of investing that amount in promoting public trans
port and information technology.
16
Cleaner air and better transport in cities
Make public transport good enough to compete with
private transport
Public transport may be seen as ‘a good thing’; a high-profile figure
travelling on a public bus - as Delhi’s chief minister did on the day he
ceased to be one - generates about as much impact on pollution as a
vip planting a sapling does on afforestation. However, public trans
port must compete with the automobile and win (with a helping hand
from policy-makers, technocrats, and those who influence public
opinion). At present, a typical commuter in any of the large Indian
cities chooses public transport only because it is cheap (and for many,
it is not particularly cheap either—the poor can end up spending as
much as 30% of their monthly income on transport) whereas public
transport must be made attractive to those who do not use it at
present—the owners of cars, motorcycles, and scooters. And they can
be persuaded to leave their cars and motorcycles home only if they
can be assured of a service that is not only cheap but reliable, comfort
able, fast, frequent, and easily accessible as well.The passengers’
charter published by London Transport, for example, promises to
provide at least one bus route within 400 metres of most homes; cut
‘extra waiting time’ to 1 minute and 30 seconds; repair minor damage
to bus-shelters within one working day and major damage within a
month; and ensure that the number of buses running early does not
exceed 4%.The charter even mentions refunds: ‘If you are delayed
more than 15 minutes because of our failure, we will give you a refund
voucher to the value of the delayed journey.’Table 1 highlights what
constitutes a quality service standard for buses.
Table 1 Quality service standards for buses
Parameter
Average recommended
value
Maximum permissible
value
Waiting time
5 to 10 minutes
Not more than 20 minutes
Distance to the nearest bus stop
300 to 500 metres
Not farther than half a
kilometre
Journey times
30 to 45 minutes
Not more than 1.5 hours
Expenditure on travel (as a
percentage of household income)
10%
-
Source Armstrong-WrightAandThiriezS. 1987. Bus services: reducing costs, raising
standards. Washington, DC: The World Bank. 97 pp. | World Bank Technical Paper No. 68,
Urban Transport Series]
Information about services, timetables, and fares
17
In a survey to find out what exactly makes the ‘chartered’ buses in
Delhi more attractive to their users, the participants were asked to
choose any one reason for their choice from among such factors as
speed, regularity, comfort, assured seating, and so on. Comfort turned
out to be the most common reason: 58% of the respondents said they
preferred a chartered bus because it is more comfortable. Regularity
was next (18%), followed by assured seating (12%). Such charter
services are privately operated and provide a daily service for regular
commuters between residential areas and the central business district.
Usually, only two trips are run every day, one in each direction. Regu
lar commuters can buy a monthly pass whereas others may choose to
pay for each trip. A survey of commuters in Hyderabad showed similar
results: commuters said that when they preferred ordinary services to
special services (Metroliners and Metro expresses), it was not because
the ordinary services were cheaper but because they were more fre
quent.The survey requested commuters from different incomegroups, namely very low, low, intermediate, and high, to rank such
factors as cost, punctuality, travel time, comfort, and ease of board
ing—comfort was at the top in all the income-groups.
Let us follow a user of public transport - a city bus in this case along a trip and make stops along the way to explore what makes the
trip a pleasant or an unpleasant experience. In particular, we shall see
the difference information can make to making such travel smoother.
In the words of Darien Goodwin, who chaired a recent conference
titled Promoting travel by bus: how to make publicity pay, ‘If you have not
used buses, how do you start? What number bus do you get? Where do
you get it? What ticket do you ask for: a single, a return or something
else? How much cash do you need? Will the driver refuse to change
your £20 note? How do you know when you have reached your
alighting stop?
Information for passengers. One of the most neglected areas in public
transport in India is passenger information. As mentioned earlier, if
public transport is to succeed in persuading those who use scooters
and motorcycles to travel by public buses, it must offer incentives
other than money. And detailed and up-to-date information about
services, timetables, and fares is one of the crucial factors. The conclu
sions of a survey by John Hibbs, a British expert on transport manage
ment, state the argument clearly enough:
the availability of infor
mation to the public has been suicidally neglected, and of innovation
there has been little or none. Your local paper is filled with advertise
ments offering every imaginable service—except bus services.There is
18
Cleaner air and better transport in cities
turn-over to be gained from potential customers waiting to find out
where buses run and at what price, and it’s no good expecting some
one else to tell them.’
Granada Television’s World in Action programme (in the UK) once
investigated the extent to which people are dependent on the car. As
an experiment, one family in Lancashire gave up using cars for a week.
The resulting documentary, in one of the scenes, showed the family
grouped around the dinner table studying bus timetables for the first
time in years, trying to extract some useful information from them. It
was clear that the timetables had been difficult to obtain, and were
thoroughly confusing.
Birmingham Friends of the Earth, a voluntary group that cam
paigns on environmental issues, recently identified some practical
measures that would make the city’s bus services more attractive and
easier to use. One Saturday in April, a few volunteers stuck timetables
to six bus stops on a busy street. They also put up posters that dis
played the destinations of all the buses calling at those bus stops. As
the group reports, ‘passengers queuing at the bus stops loved it’.The
report concludes that even such a simple measure as displaying the
destinations and routes at all bus stops goes a long way in serving the
commuters. The BEST (Brihanmumbai Electricity Supply and Trans
port undertaking) bus service in Mumbai has been providing such
displays at major junctions for several years now. It also publishes a
city map (and another for its suburban services) for the convenience of
passengers. On its web site <www.bestundertaking.com>, it even
offers a small map with the requested route picked out in another
colour (Figure 5). Another pilot project in the suburbs of Mumbai
makes use of gis (geographical information systems) to display
information on bus routes and bus stops: for any location selected by a
user, it is possible to display the route numbers of bus services serving
that location, their respective routes, the names of bus stops, and the
locations of those stops.
London Transport is an outstanding example of the commitment
to providing better information to passengers (Figure 6). Each bus
stop displays not only a map of that area but a detailed timetable of all
the buses that call at the bus stop. Such displays are continually re
vised and their designs tested with actual users to check whether the
format meets their needs. Individual leaflets are published for each
route giving detailed information about the timetable, fares, and so on.
Compare this with the route guide published by the Delhi Transport
Corporation, which has not been updated since 1989. Besides, all it
20
Cleaner air and better transport in cities
Figure 6 London Transport is committed to providing quality information to its users
does is to offer a route-by-route listing of services, which is of little use
to prospective passengers who want to know what direct bus, if any,
links their starting point and destination and if it does not, the points
at which they must change buses.They would also want to know the
timetable and how long it might take to complete the journey.
time. Let us assume that our hypothetical user now turns
up at the appropriate bus stop. The first thing that confronts the user
is the crowd; it may not deter the regular user but remember that we
are talking about persuading those who use their own vehicles, par
ticularly two-wheelers and cars, to use public transport.The best,
which operates buses in Mumbai, has introduced the concept of‘zero
waiting time’ on some routes during peak hours at points that serve a
large number of people, such as close to railway stations, central
business districts, and large housing colonies. ‘The best ensures that
a bus is always waiting for a passenger rather than having it the other
way around’, as the best’s web site puts it. Overcrowding particularly
deters women. A survey of commuters in Pune asked men and women
whether they found public transport safe, acceptable, and comfort
able.The difference between sexes was marked: only 45% women said
that public transport was safe and only 40% said it was comfortable
Signs on buses and bus stops
21
whereas as much as 65% of men thought it was safe and 55% found it
comfortable. However, only 2% of women favoured ‘women only’
buses; 32% wanted more buses to ply and 39% wanted the buses to
run more regularly.The best in Mumbai not only runs some womenonly trips but allows women to board first on some routes at peak
hours, a feature it calls ‘Ladies first at Starting Points’.
Signs on buses and bus stops. The bus stops themselves need to be
signposted clearly. Not only is the new colour combination (red on
blue) seen on bus stops in Delhi harder to read but the name of the
stop itself is completely masked by advertisements (Figure 7).Then
there is the matter of finding out whether the bus approaching your
bus stop is the bus you want. Signage specifications for transit vehicles
(developed by the American Foundation for the Blind) recommend
that destination boards displayed at the front should be in letters that
are at least 15 centimetres tall, with the route number displayed even
more prominently, in numbers at least 20 centimetres tall. Displays at
the side must be in letters at least 5 centimetres tall and route num
bers should be at least 10 centimetres tall. Mr Vincent B McKenna, of
McKenna Brothers, a British firm that supplies destination boards
and related material, has this to say on the topic: ‘In the ’80s we saw
the introduction of electronic dot displays on buses. Whilst these type
of displays are convenient for the operator to use, they have proved
difficult to read for the passenger, especially the partially sighted. ••• we
presented printed displays for appraisal by partially sighted groups.
These displays were placed side by side with other systems such as
Dot-matrix, Red LED [light-emitting diodes] and Seven Segment.The
unanimous decision by the groups was our printed displays were far
easier to read. Research shows that yellow on black ••• destination
blinds [boards] ••• are the best and most effective medium.’
Figure 7 Advertisements completely mask the name of a bus stop, already poor
owing to the weak contrast between the background (blue) and the foreground (red)
22
Cleaner air and better transport in cities
Take the citing of bus stops, for instance. There are stops in Delhi
that serve as many as 50 to 60 routes. The ‘bus boxes’ that mark off a
strip of the road as the point at which a bus is expected to stop can at
best be only of cosmetic value because it can accommodate only one
bus at a time whereas it is far more likely that several buses would
arrive at such busy points at the same time.
Buying a ticket. Now that our commuter has managed to board a
bus, the next step is to buy a ticket. In Mumbai, as in most other cities,
it is the bus conductor who walks up and down the aisle to collect
fares and to issue tickets. The buses operated by the Delhi Transport
Corporation offer a complete contrast: it is the passengers who have to
make their way to the conductor to buy a ticket, with the resultant
overcrowding around the conductor’s seat, which is aggravated by the
delay in issuing the tickets as the conductor laboriously tears each
ticket at two points in a crude attempt to mark the starting point and
the destination point for each ticket.The best in Mumbai has already
introduced smart cards for AFC (automatic fare collection) on some of
its services, beginning with No. A-l, an air-conditioned service plying
between Oshiwara Depot and the WorldTrade Centre. Regular com
muters buy the card for Rs 200/- in advance. On boarding a bus, the
commuter flashes the card in front of a machine that can read the
card. The minimum fare is deducted automatically. While getting off,
the commuter presents the card again, and the machine deducts the
correct additional fare depending on the journey. Information on
correct fare is not always easy to come by. In Delhi, this information is
displayed inside a bus (Figure 8) whereas, ideally, a user would like to
know the fare beforehand.
Buses run by private operators in Delhi, on the other hand, ‘mar
ket’ their services aggressively indeed. Overcharging is rampant but so
is overcrowding. In one incident, a commuter who protested against
overcharging was beaten up by the staff. This prompted a public
interest litigation ‘seeking to end the ill treatment of passengers by the
staff of local buses plying in the city’, as reported in a newspaper
recently. The High Court in Delhi has admitted the petition and
issued a notice to the transport authorities.
Completing the trip. Once inside, passengers must know in advance
that they are approaching their destination. Whereas timetables and
maps provide information for planning a journey, commuters need ‘on
board’ information as well. For instance, bus conductors should be
encouraged to announce each stop clearly as the bus approaches that
stop. Similarly, ‘live help’ can be stationed at major bus stops to
announce the next bus due, its destination, and the bus stops along its
Automatic notification of arrival time
23
Figure 8 Afarechartdisplayedinsideabus
route.Those who offer such a service may even carry pagers so that
they can offer ‘real time’ information.
Getting off a bus, by itself, can prove to be an ordeal, especially for
the elderly and the infirm. Low-floorboard buses score over other
models in this regard. Curitiba, in Brazil, offers another solution,
namely raised platforms for boarding and alighting.
The return journey. Our hypothetical commuter is now at work but
would like to return home in the evening, preferably without having to
wait for a long time for the bus. Many innovative information systems
are already in place in major European cities and include ‘countdown’
displays at bus stops that show the next bus due and approximate time
of arrival, real-time information about late running buses, easy-to-use
maps and folders about individual bus routes, and so on. It is even
possible to track the progress of Superoute 66 (between Ipswich
railway station and Martelsham Heath in the county of Suffolk in the
UK) on the Internet. Commuters can even request automatic notifica
tion: every evening, for example, you will receive a message on your
pager or cellphone that your regular 5.30 p.m. bus is now expected to
arrive at the usual stop in ten minutes. The same information is also
available on telephone in the form of IVR (interactive voice response),
as shown using a made-up example in Figure 9.
In Marshall, Minnesota, and Bangor, Maine, in the United States,
for about $10 a month, residents can subscribe to a telephone infor
mation service that automatically calls them to let them know that the
24
Cleaner air and better transport in cities
Atypical dialogue between a userand the ivr (interactivevoice response)
system
1 The user dials the i vr telephone number.
2 IV R: Welcome to the real-time information service. At which bus stop
will you board the bus?
3 User: Gandhi Market.
4 IVR: Whichdirection, ABC HospitalorXYZTerminus?
5 User:ABC Hospital.
6 The next bus to A B C Hospital is expected to reach your bus stop at 4.50
in the evening. The next bus after that will be at 5.30 in the evening.
Figure 9 Interactive voice response system supplies current information
daily school bus is only a few minutes away. A global positioning
device tracks the movement of the bus and a telephone data channel
relays that information to a central control point. The central station
then automatically calls the subscribers with a pre-recorded message.
The recent government white paper on the future of transport in
Britain, titled A new dealfor transport: betterfor everyone, repeatedly
emphasizes the need for ‘wider availability and provision of informa
tion on timetables, route planning and fares’. Britain’s Transport
Research Laboratory has recendy published a report, titled Information
for bus passengers: a study of needs and priorities, which reviews die
provision and use of information; assesses how useful it is to the
general public and the extent to which it influences travel demand;
identifies deficiencies; and suggests how the supply of information
could be improved.
Nearer home, a pilot project is already under way in Hyderabad.
The avlds project (for automatic vehicle location display system) will
supply current information to those waiting at bus stops. Special
display boards at bus stops will show expected arrival times 10 min
utes in advance for city services and 30 minutes in advance for district
services.The system consists of a vhf (very high frequency) monitor
mounted atop each bus, which lets a central computer track the
movement of the bus. The central system then relays that information
to appropriate bus stops.The avlds project also seeks to transmit
information on how many seats are vacant, a particularly useful piece
of information on long-distance routes, so that those many seats can
be sold in advance.
Matters such as siting of bus stops, the possibility of buying tickets
in advance, and orderly queues can all do their bit to attract passen
Marketing public transport effectively
25
gers. If the idea is to attract those who use two-wheelers to public
transport, the inducements need to be such that public transport is
seen as a comfortable and dependable means of travel.
Market public transport effectively
Public transport offers good value for money but do potential buyers
of that service know about it? More important, do those potential
buyers who are likely to be willing to pay more know about it? Subsi
dized public transport does fulfil a social need and, for many, it is the
only option. But if public transport is to attract those who currently
ride motorcycles or drive cars, it has to offer much more than merely
the means of getting cheaply from A to B.The ‘Greenline’ and
‘Whiteline’ buses in Delhi, the ‘Metroliners’ of Hyderabad, and the
luxury and air-conditioned buses in Mumbai are examples of special
services but they have not been successful enough to reduce conges
tion. Public transport needs far more sophisticated marketing, selling
different services to different segments. Stagecoach Manchester, for
instance, ‘have segmented the market by socio-economic group, and
by time of day: different people travel at different times of day, and
people’s needs are different at different times of day.’ Mumbai, for
instance, is a narrow rectangle with clear traffic patterns: in the morn
ing, southbound services run at peak capacities whereas northbound
services have spare capacity; in the evenings, it is just the opposite.
Effective marketing can certainly help in tapping that spare capacity, if
only such information is made available to people. Most transport
operators run special services to clear the rush due to such specific
events as fairs and festivals but they are not marketed aggressively
enough. However, marketing will not sell badly designed products.
Take reliability and punctuality: for users to be confident enough to
leave their own cars home and take a bus, they must be convinced that
the promised bus will turn up and turn up on time. People with higher
incomes tend to place a higher value on their time and expect a higher
standard of service—public transport must offer that if it is to capture
that segment of the market. Nottingham City Transport engaged the
services of a market research company to find out what people
wanted, what they disliked, and what they saw as barriers. Most
respondents cited lack of knowledge about the bus system as a major
obstacle.
Concern for personal safety is yet another factor that may deter
potential users of public transport. A study in Britain estimates that
patronage of public transport could be boosted by at least 10%,
26
Cleaner air and better transport in cities
mainly during off-peak hours, if commuters, especially women, felt
safer when travelling.
Improve the image of public transport
Public transport has a poor image in many cities, which costs it dear in
terms of customers. The costs to society are even higher if we take into
account the loss of productive hours spent on driving, the ill effects of
pollution on health, the cost of fuel, and so on. Increased awareness of
how our day-to-day activities affect the environment has served to
promote recycling, vermi-composting, energy conservation and so on
and corporate houses are turning increasingly ‘green’. Public transport
must cash on this trend to promote itself as a green service.
As mentioned earlier, those who use public transport when young
are less likely to avoid it later. This idea can be extended to positively
encouraging schoolchildren to use public transport by promoting it as
an interesting activity; holding a quiz competition to test how well they
know the transport system in their own town or city, organizing a
‘treasure hunt’ in which the participants are allowed to use only public
transport, and even getting celebrities to travel on public buses are
some possibilities to give public transport a more upmarket image.
Involving ng Os, citizens’ groups, and schoolchildren in supplying
information - the ‘live’ help at bus stops mentioned earlier - is another
possibility.
Discourage private modes of transport
If cheap, reliable, and comfortable travel is the carrot, stiff parking
fees, expensive fuel, and heavier toll charges make up the stick. Other
deterrents include denying the use of some lanes on major roads to
those vehicles that have only one occupant and keeping some roads
(or one or more lanes within a road) exclusively for buses. All such
measures have cumulative benefits: they make roads less congested,
which means traffic moves faster, and attract more commuters to
public buses because they move even faster in their own reserved
lanes; the smoother and faster the traffic, the lower the amount of
pollutants it emits.
Parking charges. Stiff parking charges and setting a limit to the
number of parking slots available within a locality can have a marked
impact on driving habits. A study carried out by the US Department
ofTransportation found that the number of employees who drive to
work alone can come down by 20% if they have to pay for parking.
Administrative measures to check emissions
27
Haphazard parking disrupts traffic: if roads are the blood vessels of
a city, undisciplined parking is the clot that can block circulation. A
recent TE RI study of a busy market in New Delhi estimated that
organized parking can speed up traffic by nearly 150%.
Charges for road use. Yet another strategy is to impose toll charges at
peak hours. Just as you can make telephone calls at discounted rates
so long as the calls are made outside the peak hours, drivers are
charged extra for the use of roads during those times of the day when
the demand is higher.
Administrative measures to check emissions. The recent directive from
the Supreme Court banning commercial vehicles that are more than
15 years old from plying on the streets of Delhi is just one example of
administrative intervention to check pollution.The periodic checks on
emissions of pollutants from all motorized vehicles is another. How
ever, the extent of benefits from such measures is far from clear. Let us
imagine for a moment that, overnight, all the motorized vehicles
plying on the streets of Delhi bring the amount of carbon monoxide
and suspended particulate matter they emit within the prescribed
limits. Will it also make Delhi’s air healthy overnight? What will be the
likely levels of carbon monoxide and suspended particulate matter
then? Even rough estimates of such figures are seldom provided. In a
survey conducted by the Indian Institute of Petroleum in Dehra Dun
in 1984, only 30% of the cars tested met the standards; the figure
dropped to only 20% in the case of relatively new cars (5 years or
less), for which the norms are more stringent. Some ten years later,
when the Automobile Association of Upper India conducted a series
of random checks in Delhi in May 1995, the results were better:
approximately 44% of the older cars and 56% of the newer cars
passed the test. But these figures are much lower than those given by
the state-owned vehicle inspection unit in Burari in Delhi, where the
success rate is 80% to 85%. So how reliable are the data?
The automobile association also offers another interesting statistic:
it says that only about 50 vehicles can be properly checked in an 8hour day (assuming that it takes about 10 minutes to check each
vehicle). If you relate this figure to the total number of registered
vehicles in Delhi - 3.8 million in January 1999 - and keep in mind
that the ‘pollution under control’ certificate is valid only for 3 months,
the total number of checks works out to more than 10 million a year—
a massive undertaking indeed, the futility of which can be apparent to
anyone. A recent newspaper report (from The Hindu, of 14 April 2000)
28
Cleaner air and better transport in cities
seems to confirm this: quoting the official figures available with the
Delhi Pollution Control Committee, it says that 2.9 million vehicles
underwent the PUC (pollution under control) check in 1997 but the
figure was down to 2.2 million in 1998 and to 1.7 million in 1999.
Manage travel demand more efficiently
As tire executive summary of the report Blueprints for sustainable
development puts it, ‘Solutions to road-transport derived pollution such
as catalytic converters and road pricing and even improved public
transport do not properly tackle the problem: tire demand for trans
port itself needs to be managed rather than try to satisfy a thirst that
can never be quenched’.
In a market-driven economy, public transport faces stiff competi
tion from private, individually-owned transport. This competition is
not as straightforward as that between, say, rival brands of soap—if
you prefer one brand, that by itself has no influence on the choice
made by others. But as more and more privately-owned personal
modes of transport - cars, scooters and motorcycles, and so on begin to appear on city roads, all modes are affected because of tire
resulting congestion. If buses have to compete with cars and motorcy
cles for road space, buses are going to be heavily outnumbered.This
makes them slower and thus less attractive as a mode of transport and
in turns drives even more people to choose their own means of trans
port, bringing even more vehicles on the roads. And those who cannot
afford to do so get a progressively worse deal.This also raises the
question of equity: is the road space being shared fairly by all? Do all
citizens have access to affordable means of transport?
So where does this vicious circle end? We need to turn to market
forces and state intervention for answers because, as mentioned
before, public transport can compete only if it is cheap, reliable,
comfortable, fast, frequent, and easily accessible—attributes that cost
money and require both political will and enlightened management.
Market forces alone cannot provide a solution because even the
minimum fare charged by buses is beyond the means of many: a
recent survey in Delhi showed that just the minimum fare amounts to
20% to 30% of the monthly income of nearly half of the city’s popula
tion living in unauthorized colonies.
Managing travel demand. The argument so far has been that air
pollution in Indian cities is serious and continues to get worse; that
motorized transport contributes to it substantially; and that encourag
ing people to choose public transport - to take a bus or a train -
Curitiba, Brazil: a success story
29
instead of individually-owned transport (using a car or a two-wheeled
vehicle) is one of the most effective means to reduce air pollution. This
is easier said than done, and at once raises many questions: How to
make public transport more attractive? Who should do that? How
much will it cost? How long will it take? How do we know whether the
methods are working?
It is neither possible nor within the scope of this book to offer
definitive answers to these and similar questions. Many experts, over
many years and in many different forums, have offered many solutions.
Some of these have been implemented and many more are likely to be
implemented.
Demand-side management. ‘Demand-side management’ in the
context of transport in cities includes such measures as staggered
working hours and staggered weekly offs, providing alternative means
of transport (bicycle tracks, efficient parking facilities near railway
stations and major bus depots), promoting safer and high-quality
services to transport schoolchildren, and so on. In broader terms,
demand-side management is all about analysing what makes people
travel in the first place instead of simply estimating travel requirements
and then providing for them.
Curitiba, in Brazil, is an outstanding example of what integrated
transport planning can achieve: though Curitiba ranks second in the
country in terms of car ownership (one car for every three people), the
city’s petrol consumption is only 70% of that in any of the eight
comparable cities. Public buses in Curitiba carry 50 times more
people than what they did 20 years ago. Instead of investing money on
such conventional solutions as underground or above-ground rail,
Curitiba managed to channel its growth along existing and established
traffic corridors that ensured that public transport continues to remain
an attractive option for its citizens.
More than anything else, Curitiba’s success is rooted in planned
use of land. Most Indian cities have grown haphazardly. Their pattern
of growth is based not so much on long-distance commuting by
individually-owned transport as on non-motorized, short-distance
trips: on an average, most people in Indian cities travel short distances,
and they either walk or use a bicycle. Again, to cite a survey conducted
in 1994 in Delhi, 40% of the trips were 2.5 kilometres or shorter and
another 17% were between 2.5 and 5 kilometres. And bicycles ac
counted for 70% of those trips. The proportions could be different for
Mumbai because it offers suburban railway as a reasonably cheap
alternative but the conclusion remains much the same, namely that
30
Cleaner air and better transport in cities
making streets safe for cyclists and pedestrians can effect substantial
savings in the use of petrol and diesel, thereby reducing both pollution
and traffic congestion.
Bus-only streets and priority for buses. Considering that buses carry
many more people, giving buses priority over other modes of transport
sounds logical enough. A study by teri of one of the busiest traffic
intersections in Delhi, which is also one of the most polluted, showed
that keeping a few critical corridors open only to buses during peak
hours could cut delays by as much as 80% (with such attendant
benefits as reducing fuel consumption and pollution). Bus-only
streets, in effect, bring the benefits of rail transport at a fraction of the
cost incurred on building a rail network. Urban planners, unfortu
nately, perceive a motorist’s time to be more valuable than that of a
pedestrian, a cyclist, or a user of public transport.
Use fuels that do not contain the polluting component at all
Walking, cycling, and using animal power (horses, mules, camels, and
so on) for transport are some of the cleanest option available to us: in
the simplest terms, this mode of transport bums sugar and gives off
carbon dioxide.Transport experts use the term nmv (non-motorized
vehicles) or nmt (non-motorized transport) to refer to such means of
travel.
Bicycles are becoming an increasingly attractive option in many
European cities, which have introduced several innovative schemes to
encourage cycling. A pilot project in Amsterdam allows any citizen to
pick up a bicycle from any of the bicycle depots using a prepaid smart
card and either return it to the same spot or leave it any other depot.
The citizens gain points for using the bicycle and may use those points
to obtain other services. Copenhagen has made not only made the
operation simpler but free of charge: commuters use coins to release
the bicycles from racks and the coins are automatically returned when
the bicycles are ‘parked’ again in their slots.
Cycling and walking may be merely recreational or ‘green’ in
Europe; in much of the developed world, these are the only means
that many can afford and are estimated to account for as much as 50%
of all the trips in Indian cities and 60% to 90% in China. A survey in
Delhi showed that walking and cycling made up 65% of all the trips
undertaken by the poor (and buses accounted for 31%). Gender is an
issue as well, as revealed in another survey: only 8% of men walked,
compared to as much as 17% of women; 38% of men used buses
whereas for women the figure was nearly 58%.
'. C J
'• '■ ’• T
Using cleaner fuels
31
Most of us automatically assume that such slow-moving vehicles as
bicycles and cycle rickshaws are more likely to congest the roads;
however, this is a fallacy: a car needs roughly 4 times as much space as
a bicycle when on the move and as much as 16 times the space for
parking.
Use fuels that contain only traces of pollutants
As mentioned earlier, diesel-powered vehicles emit more of particulate
matter - the thick, black smoke that comes out of the exhaust pipe of a
bus or a lorry - compared to petrol-powered vehicles.Though this is
mainly because of the way the two fuels are ignited in their respective
engines, diesel that contains more sulphur produces more smoke. At
present, sulphur content of the diesel sold in the metropolitan cities in
India is about 0.25% by weight (roughly 2 grams for every litre of
diesel). Low-sulphur diesel, sometimes referred to as ‘city diesel’, is a
highly refined fuel especially effective in eliminating the smell and
smoke normally associated with diesel engines. In initial trials by
London Transport’s Buses Emissions Research Programme, which
involved over 700 buses and was conducted over 3 months, city diesel
decreased smell and visible smoke, cut down emissions of particulate
matter by as much as 40%, and also reduced carbon monoxide and
oxides of nitrogen. More important, it was the emission of finer parti
cles (smaller than a micrometre), which are far more dangerous
because they penetrate the body’s respiratory system the deepest, that
was cut down the most by the high-quality diesel.
Cars that run either on electricity or on CNG (compressed natural
gas) are certainly environment-friendly. Battery-operated vehicles are
zero-emission vehicles and practically noise-free. However, they have a
limited range: the batteries need to be charged every 90 kilometres or
so, a far from feasible option in India. (In Agra, they are used to ferry
tourists between die car park and the Taj Mahal in an effort to reduce
pollution around the monument.) Compressed natural gas appears a
more promising candidate. About 2000 taxis in Mumbai reportedly
use cng. Compared to petrol, cng is not only cheaper but gives
better mileage. It is practically soot-free and prolongs engine life. On
die other hand, it requires a higher initial investment; reduces storage
space in the trunk of a car; makes a car slightly slower in picking up
speed; and is available only at few petrol pumps. In Delhi, at the end
of 1999, it cost about 33 500 rupees to convert a car so diat it could
run on cng.The means to store and distribute die gas are not in place
sofar-
3 o G,
A5 < 7 "
l
C .
' > <'
32
Cleaner air and better transport in cities
Burn fuels more efficiently
The amount of pollutants emitted by an engine depends not only on
the quality of fuel but also on how efficiently that fuel is burnt. Lean
bum engines, for example, achieve better combustion by ensuring that
air and fuel are mixed in the right proportion in the combustion
chamber of an engine.
Insistence on more stringent norms (the Euro II norms, for in
stance, which lay down maximum permissible limits for emissions) is a
typical techno-fix. However, in India, motorized vehicles are used for
many more years than they are in the West. It takes more than 40
months’ earnings for a person to buy a basic car in India; in USA, only
9 months’ income is enough to do that. No matter how stringent the
norms for new vehicles, most vehicles in any city will be old vehicles.
Even in five years’ time (in 2005), roughly only 10% of the twowheelers plying in Delhi is likely to be compliant with the norms laid
down for 2000: roughly 40% will be pre-1991 vehicles (no limits on
emissions were in force then), about 15% will be compliant with the
1991 norms, and another 18% will be compliant with the 1996
norms. Mandating that emissions of carbon monoxide be cut from up
to 30 grams per kilometre to 2 grams per kilometre (which is the
norm for two-wheelers from April 2000) is no doubt impressive but to
what extent such norms will succeed in cutting down total pollution
has not been estimated.
However, some data are now available on the quality of air in Delhi
after about 4000 old buses (8 years or older) and 17 000 autorick
shaws were withdrawn from the city's fleet from 1 April 2000. Sixteen
traffic intersections were monitored across the city to determine the
concentration of key pollutants. 'Though it will take time to calculate
the figures, there has been a drop of about 15% in the air pollution
levels', said the secretary of the Delhi Pollution Control Committee, as
reported in the press. The concentration of suspended particulate
matter, for example, was found to have dropped from 1417
micrograms per cubic metre to 1204 micrograms per cubic metre at
the ito junction.
Trap the pollutants before they escape into the atmosphere
Catalytic converters offer yet another approach to cutting down
pollution. These devices, fitted near the exhaust pipes of cars, neutral
ize three major pollutants, namely carbon monoxide, hydrocarbons,
and oxides of nitrogen, by converting them to harmless gases, namely
carbon dioxide, nitrogen, and water vapour. It is mandatory for all
cars manufactured after 31 March 1995 to be fitted with catalytic
Leafy trees for trapping pollutants
33
converters. However, the converters begin to work only when the
exhaust is warm, which happens only after the engine has been run
ning for a while—at the point of start, when emissions are maximum,
the converters are ineffective. Secondly, cars fitted with converters
cannot run on petrol that contains lead because it ‘poisons’ the catalyst.
Devices that trap the pollutants emanating from diesel-powered
vehicles, especially buses and lorries, are known as 'after-treatment'
devices. However, most of them can work only with ultra-low-sulphur
diesel (0.005% sulphur), which is currently not available in India. A
diesel particulate filter with additives (a mixture of iron and stron
tium) is reported to work with low-sulphur diesel (0.05% sulphur)
and reduce the emissions of fine particles, which are a particular
health hazard.
Prevent pollutants from spreading by putting
barriers in their path
The last strategy aims at reducing the extent to which we are exposed
to pollution by putting barriers in the path of the pollutants. Leafy
trees, for instance, can remove dust from the atmosphere. Detailed
studies show that most of the particles recovered from leaves are of the
so-called PM 10 category (10 micrometres or smaller), which are a
greater health hazard because such fine particles can reach our lungs.
Some trees are more efficient than others in trapping the particles,
probably because their leaves are covered with fine hair.
Face masks are perhaps the last bastion in the battle against pollu
tion. The rising number of two-wheelers is often blamed for contribut
ing most to the pollution but the alleged villains of the piece are
perhaps the worst sufferers at the same time, as a TERI study showed.
The study involved sampling the air that a traveller would actually
breathe in during the journey by using different modes of transport,
and it turned out that those who ride scooters and motorcycles
breathe in more than seven times as much of pollutants as those taken
in by those who drive a car. Those who travel in autorickshaws and
buses are exposed to roughly the same amount of pollutants, which is
twice the amount car drivers are exposed to.
Information technology for better transport
Whereas the technological solutions mentioned above relate directly
to emissions of pollutants, a totally different set of technologies attacks
the problem from another angle, aimed more at managing traffic than
at controlling emissions.The Japanese government estimates that
more than 10% of die fuel used in automobiles is wasted only because
34
Cleaner air and better transport in cities
of traffic jams.To help traffic move faster and more smoothly, infor
mation technology' is being put to greater use. Imagine how much it
would help the drivers if they are provided with up-to-the-minute
information as they drive: how dense is the traffic at particular loca
tions; whether any of the roads is closed for traffic; what processions, if
any, involving large crowds on foot, are in progress at any given time;
how easy it is going to be to find a parking space; and so on. Broad
casting such information on the FM band has been common enough,
particularly in the West, but information technology has moved far
faster: Panasonic in Japan has developed an advanced car navigation
system that collects traffic information sent from several sources,
including radio broadcasts and optical devices, which can help drivers
in planning alternative routes to their destinations that avoid the more
congested roads. Driver-assistance systems can even sense when a car
is too close to the one ahead and alert drivers accordingly. Large
databanks that monitor traffic can store traffic patterns in their huge
memories act as early-warning systems that enable those who guide
the traffic and operate traffic signals to take timely action and thus
avoid worse traffic jams.
Electronic toll collection systems linked to central databanks make
it possible to pay toll charges without the car having to stop. Users buy
a small hand-held device, which serves as an identity tag, and hold it
behind the wind shield as their vehicles approach a toll gate. A sensor
at the toll gate ‘reads’ the tags, automatically deducts the appropriate
amount, and lets the vehicles pass. Users are also automatically alerted
when it is time to recharge the device. The signals can even be linked
to a bank account, which is debited automatically.
Telecommuting, which allows people to work from home instead of
in an office, is another of the ‘futuristic’ technologies that have a
bearing on city traffic, at least in theory. In practice, it is a question of
traffic patterns: cities in which the ‘white collar’ workforce is
significant and trade, services, and the ‘knowledge-industry’ are major
activities stand to gain more from telecommuting than those with
predominantly ‘blue collar’ workforce in which manufacturing is the
major industry'.
Technical solutions can be innovatively combined with known
social patterns. Most car journeys in cities are short and typically
undertaken with only one occupant. ‘Marrying the environmental
benefits of EVs (electric vehicles) with the personal flexibility offered
by cars, the Crayon EV commuter system is designed for efficient,
short-distance transportation. It is a practical system based on the
Integrated strategies for better transport
35
latest technology, and is now being road-tested by Toyota for local
transport between company facilities in Toyota City, Japan.’ Crayon is
an electric car; once charged, it can cover about 100 kilometres. It can
be recharged at home from the mains supply or at charging points
available at each of the Crayon depots located at strategic points
throughout the city. Each depot maintains a fleet of cars ready for use.
The cars are available to members, who use smart cards not only to
unlock the cars but also to maintain a log. Each car is fitted with a
mobile telephone and a navigation device linked to a central computer
and an online information system. Users can book a car over the
Internet (or even a corporate intranet) or simply visit any convenient
depot and collect a car.
Integrated strategy for better transport in cities
Each of the seven strategies can be considered separately only for
convenience; to be effective, they need to be combined into an inte
grated strategy aimed at better transport: transport that is reliable,
comfortable, quick, and environment-friendly and offers value for
money.
However, current initiatives related to transport have focused more
on air pollution and less on meeting the transport needs of people. In
the absence of a coherent policy, different players have attacked the
problem piecemeal. As TERl’s report titled Transportation in megacilies:
a comprehensive analysis of sustainability in developed and developing
economies puts it, *••• fragmentation and overlapping of responsibility
and authority have made planning and management of urban trans
portation a complex task, - as many as 16 agencies directly or indi
rectly influence the provision of transportation infrastructure, its
operation and regulation in Delhi.’
Whether it is oil companies, who need to supply cleaner fuel;
automobile manufacturers, who need to produce cleaner engines;
traffic police, who need to enforce discipline on the roads; or transport
corporations, who need to run a more efficient service, every agency
has a role to play—including every individual. If you would rather
light a candle than curse the darkness, here are some ways to begin.
n Cut down your use of cars and two-wheelers; cover short distances
on foot where possible and explore such alternatives as cycling.
° Ensure that traffic flow is not obstructed when you park.
» Keep your vehicles well-tuned; service them regularly.
o Use public transport and encourage others to do so.
° Organize car pools.
36
Cleaner air and better transport in cities
Conclusion
It is customary to conclude with a list of recommendations - who
should do what or, more often, what ‘should be done’ (the passive
voice ensures that no agent is identified) - aimed at reducing pollution.
However, the purpose of this book is not so much promote direct
action as provide insights, not so much provide answers as prompt the
right questions, and not so much provide information as influence
attitudes. A few key suggestions offered in the document arc listed
below as a brief recap; this is what the concerned citizens should
demand collectively.
■ Focus more on better transport than on air quality: aim at curing
the disease instead of merely attacking the symptoms.
■ Accord priority' to buses or keep some roads open only for buses at
peak hours.
■ Make information about public transport easily accessible to all
users and potential users.
■ Collect and maintain up to date and reliable statistics on all aspects
of transport and use such statistics for better management.
■ Set performance objectives for services instead of insisting on ‘static
compliance’ (e.g. specify that every commuter should get a bus
within 10 minutes on a busy corridor between 8 a.m. and 8 p.m.
instead of stipulating that a service provider should increase the
fleet by adding 200 buses).
■ Promote equitable use of road space.
Air pollution is a problem that cannot be wished away. If present
trends continue, it can only worsen in the future—and motorized
transport will contribute the most to it. If we wish that bumper-tobumper traffic, air full of acrid smoke that literally moves you to tears,
and hopelessly overcrowded buses are not to be our lot in the 21st
century, the time to act is now. Mere insistence on the right to clean
air, increasingly stringent regulations with little prospect of imple
menting them, or proclamations of dire consequences for future
generations will not make the air in our cities any cleaner: informed
judgement, action backed with adequate reflection, and a healthy
mistrust of simplistic solutions and quick fixes will.
How clean is clean: air quality standards
37
Appendix A
Air quality standards and what do they tell us
What are these guidelines, and what do they tell us? Take suspended
particulate matter for example, which consists of dust, soot, fine
droplets of oily substances, and so on. The national ambient air quality
standards, stipulated by the Central Pollution Control Board, offer no
fewer than 6 figures - ranging from 70 to 500 - all expressed in
micrograms per cubic metre. This is because the standards are differ
ent for different areas; for residential areas, for example, the require
ments are more stringent than those for industrial areas.The cpcb
recognizes three categories, namely (1) sensitive areas, (2) residential
areas, and (3) industrial areas. Also, there are separate standards for
long-term averages and short-term averages. Carbon monoxide, for
example, is so dangerous that even a brief exposure, say for 15 min
utes, can be hazardous if the gas is present at high concentrations.
Therefore, standards for carbon monoxide are stipulated for periods
ranging from 15 minutes to 8 hours—the so-called ‘time-weighted
averages’. The effects of exposure to suspended particulate matter are
less acute, and standards are prescribed for two periods, namely 24
hours and 1 year: for residential areas, the 24-hour standard is set at
240 micrograms per cubic metre and the annual standard at 140
micrograms per cubic metre.Though the term ‘standard’ is used, it
does not imply a desirable value that the city administration should
aim at: it is not quite the same as saying that the standard body weight
for an adult male who is 1.75 metres tall is 65 kg. Rather, think of the
air quality standard as an upper limit or a threshold that should not be
exceeded.
38
Cleaner air and better transport in cities
Appendix B
How the statistics related to air pollution in Delhi are calculated
The Central Pollution Control Board estimates that motor vehicles
release as much as 1046 tonnes of pollutants a day in Delhi (as pub
lished in the June 1995 issue of its newsletter, Parivesh). However, this
figure was presumably obtained simply by assuming a 120% acrossthe-board (in all the twelve Indian cities and for all the five pollutants)
increase in its estimates as on 31 March 1987.The abridged report on
assessment of vehicular pollution in metropolitan cities, published by
CPCB in 1988/89, puts the figure at 872 tonnes.
TERI researchers estimate that, in Delhi, motorized vehicles of all
types taken together add 1730 tonnes of pollutants to the atmosphere
every day. This is how the amount emitted by just one category,
namely buses, was calculated.
1 The average distance covered by each category of vehicle - cars,
bus, motorcycles, and so on - was estimated. Each bus, for exam
ple, was found to cover approximately 186 kilometres every day on
an average.
2 By the end of 1997, about 2.85 million vehicles were registered in
Delhi out of which 29 572 were buses (statistics published by the
Ministry of Surface Transport). However, not all of them would be
on the road on any given day. On the other hand, a large number of
vehicles plying in Delhi at any given moment are not registered in
Delhi. In this example, the number of buses was taken to be
16 572.
3 By multiplying the two estimates (average distance travelled by
each category of vehicles and the number of vehicles in that cat
egory), the total number of kilometres covered by each category of
vehicle was calculated.Thus, all the buses in Delhi, taken together,
cover 3 082 392 kilometres a day, on an average.
4 Indicative figures are available on how much of each pollutant is
given out by each category of vehicle for each litre of fuel: for
instance, for every litre of diesel that it consumes, a bus emits
roughly 6.5 grams of particulate matter, 4 grams of sulphur diox
ide, 70 grams of oxides of nitrogen, 7 grams of hydrocarbons, and
42 grams of carbon monoxide.
5 Assuming that a bus covers 3.3 km per litre of diesel and taking the
total distance covered by all the buses in Delhi in a day as
3 082 392 km, the total diesel consumption works out to be
934 058 litres.
For more information
6
39
Multiplying the ‘emission factors’ (in grams per litre) men
tioned earlier in Item 4 by the amount of diesel consumed
gives us how much of each of the pollutant is emitted by each
category of vehicles (buses, in this example, add 121 tonnes of
pollutants to the atmosphere a day, as shown inTable Bl).
Table B1 Calculating the total amount of pollutants emitted by buses
Pollutant
Emission factor (grams of
pollutant emitted per litre
of fuel consumed)
Amount emitted per
day (tonnes) from
934 058 litres of diesel
Particulate matter
Oxides of nitrogen
Sulphur dioxide
Carbon monoxide
Unburnt hydrocarbons
Total
6.5
70.0
4.0
42.0
7.0
—
6.07
65.38
3.74
39.23
6.54
120.96
Similarly, we can calculate the amount of pollutants added by each
category of vehicle so as to build an ‘emissions inventory’.
For more information
Printed sources
Armstrong-Wright A. 1993
Public transport in third world cities
London: H M S 0. 110 pp. [Transport Research Laboratory State-of-the-art
Review 10]
Armstrong-Wright A andThiriez S. 1987
Bus services: reducing costs, raising standards
Washington, DC: The World Bank. 97 pp. [World Bank Technical Paper No. 68,
Urban Transport Series]
Central Institute of Road Transport. 2000
[special issue on] IT for public transport
Indian Journal ofTransport Management 24(2). 110 pp.
[published by cirt for the Association of State Road Transport Undertakings]
Central Pollution Control Board. 1989
Assessment of vehicular pollution in metropolitan cities. Part 1: abridged
report
New Delhi: CPCB. 34 pp. [Control of Urban Pollution Series: CUPS/17/1988-89]
Central Pollution Control Board. 1995
Standards for liquid effluents, gaseous emissions, automobile exhaust,
noise and ambient air quality
New Delhi: CPCB. 70 pp. [Pollution Control Law Series: PCL/4/1995-96]
Central Pollution Control Board. 1999
[special issue on] Auto emissions
Parivesh 6 (1). 16 pp. [June 1999 issue of the cpcb newsletter)
Cleaner air and better transport in cities
40
Cropper M L, Simon N B, Alberini A, Sharma P K. 1997
The health effects of air pollution in Delhi, India
Washington, DC:The World Bank. 40 pp. [Policy Research Working Paper 1860]
European Conference of Ministers ofTransport. 1995
Urban Travel and Sustainable Development
Paris: OECD (Organisation for Economic Co-operation and Development).
238 pp.
Maunder D A C and Fouracre P R. 1983
Specialised bus services in three third world cities
Crowthorne, Berkshire, UK: Transport and Road Research Laboratory. 24 pp.
[TRRL Supplementary Report 811]
Ministry of Environment and Forests. 1997
White Paper on pollution in Delhi with an action plan
New Delhi: moef. 67 pp.
OECD. 1997
Second
workshop on individual travel behaviour: culture, choice and
technology: Final report (University of Sussex, Brighton,
UK; 17-19 July 1996)
Paris: Organisation for Economic Co-operation and Development. 31 pp.
[OECD/GD(97)1]
Palmer C J, Astrop A J, and Maunder D A C. 1997
Constraints, attitudes and travel behaviour of low income households in
two developing cities
Crowthorne, Berkshire, UK: Transport and Road Research Laboratory. 19 pp.
[TRRL Report 263]
Patankar P G. 1989
Urban Transport (in India) in Distress
Pune, India: Central Institute of Road Transport. 114 pp.
Sharma A and Roychowdhury A. 1996
Slow Murder: the deadly story of vehicular air pollution in India
New Delhi: Centre for Science and Environment. 148 pp.
[State of the Environment Series No. 3]
Tiwari G. 1999
Road designs for improving traffic flow: a bicycle master plan for Delhi
New Delhi: TRIPP, Indian Institute ofTcchnology. 22 pp. [Transportation
Research and Injury Prevention Programme]
Web pages and web sites
■ Air pollution
■ Public transport
http://envfor.nic.in/cpcb/
www.oecd.org/env/ccst/est/
www.epa.gov/otaq/
www.londontransport.co.uk/reports.htm
www.wri.org/wr-98-99/airpoll.htm
www.analytics.co.uk/
www.arb.ca.gov/html/cando.htm
www.ertico.com/eu_china/its_tool/
www.deq.sta te.or.us/aq/airpollu.htm
pub_tran.htm
www.nsc.org/ehc/mobile/airpollu.htm
Sponsored by Ford India Limited
Ford
Ford India Limited
Via S. P Koil Post
Chengalpattu - 603 204
India
Telephone 91 -4114-54375
Fax 91 -4114-54278
Website www.india.ford.com
Air in India’s metropolitan cities is'so severely polluted that it can
make a white sheet of paper look like carbon paper within 8 hours. If
this strikes you only as a cosmetic effect, consider another statistic:
more than 2% people in the prime of their life (from 15-year olds to
44-year olds) die prematurely of breathing- or heart-related disorders
in Delhi because of the increased pollution. The single largest con
tributor to pollution is urban transport.
Cleaner Air and Better Transport in Cities: making informed choices
emphasizes the need to make public transport attractive enough for
those who currently use cars, motorcycles, and scooters and highlights
the role of Information Technology to achieve that objective by pro
viding quality information to users of public transport. This little book
presents facts objectively to help you make sense of what you read or
hear about the topic through the mass media and to make informed '
choices and judgements.
If you have ever sought answers to any of the following or similar
questions, this book is for you.
■ Which pollutant contributes most to air pollution?
■ How is air pollution actually measured?
■ Why is carbon monoxide injurious to health?
■ How can public transport be made more efficient?
■ Where can I find more information?
Air pollution is a problem that cannot be wished away. If present
trends continue, it can only worsen in the future—and motorized
transport will contribute the most to it. If we wish that bumper-tobumper traffic, air full of acrid smoke that literally moves us to tears,
and hopelessly overcrowded buses are not to be our lot in the 21st
century, the time to act is now. Mere insistence on the right to clean
air, increasingly stringent regulations with little prospect of imple
menting them, or proclamations of dire consequences for future
generations will not make the air in our cities any cleaner: informed
judgement, action backed with adequate reflection, and a healthy
mistrust of simplistic solutions and quick fixes will.
T.E RI
Darbari Seth Block
Habitat Place, Lodhi Road
New Delhi -110 003 / India
ISBN 81-85419-69-8
- Media
 7306.pdf
Position: 1908 (10 views)