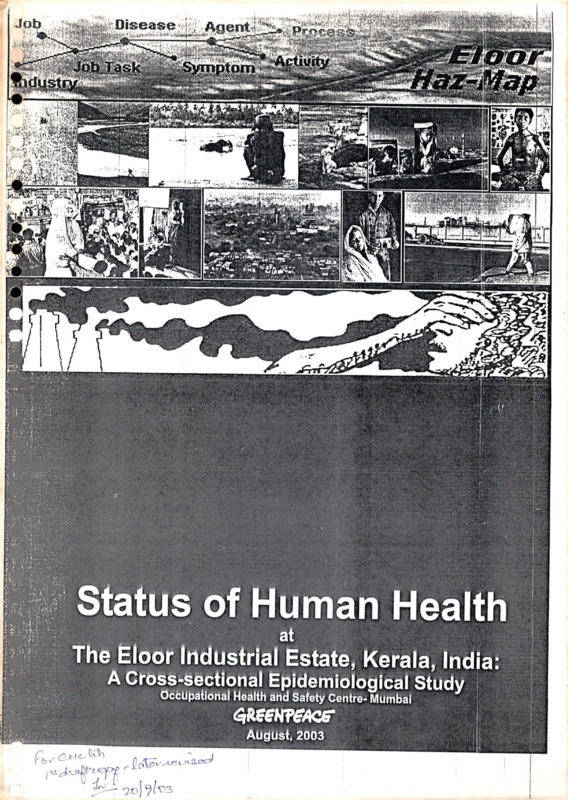
Status of Human Health
Item
- Title
- Status of Human Health
- extracted text
-
nSv)
■;.
/■.”
-r
:>;.
?,
;>:
Wl
•M*
Status of Human Health
at
The Eloor Industrial Estate, Kerala, India:
A Cross-Sectional Epidemiological Study i
Occupational Health and Safety Centre- Mumbai
August, 2003
<1
a-G
Status of Human Health
at the
Eloor Industrial Belt, Kerala- India '
Oecupationa
I Health and Safety Centre- Mumbai & Greenpeace India
September, 2003
I
!r
■
1
|V.
Principal Investigators:
Research Coordinator:
Research Manager:
Community Relations:
Collaborators:
Team Advisory:
External Peer Group;
IJ
h
I
1
Dr. Murlidhar/ Manu Gopalan
Manu Gopalan
Thangamma Monnappa
VJ Jose, Periyar Riverkeeper.
S “Sm KSS’iS.'aiS™'ratat AS Moh.mmed> Dr. Mmo Vm ef Sr.
Johns Medical College Bangalore.
.
Jayakumar C, of Thanal Conservation and Action Network, Trivandium.
Prof. Dr. Peter Orris, School of Public Health- Illinois.
IF
r
iti
I
I
I.
MAIN RESEARCH AND POLICY FINDINGS:
Contrary to the expectations based on the initial literature survey on increases in particular types of
diseases due to air and water pollution; this health assessment has discovered that there is a general
increase in all types of systemic diseases across Eloor (target village) when compared to Pindimana
(reference village). Broadly one can say that the cocktail of poisons in the air and water of Eloor affects
all body-systems adversely. Potentially the immune system seems to be affected too." Increased
prevalence and incidence of diseases and symptoms at Eloor have been observed from the database of
health information of the community and workers at Eloor and Pindimana generated by the Field
Investigation based on an exploratory format questionnaire."1
A Stratified Random Sample of the Eloor,v (target) population when compared with those at Pindimana7
(reference) shows a significant increased disease incidence in many body systems. The key systems that
are affected are the Neoplasm71 (2.5 times odds), Blood & blood forming organs7" (2.1 times odds),
Endocrine, nutritional and metabolic system71" (1.17 times odds). Mental and behavioural1* (3.03 times
odds), The Nervous system* (1.59 times odds), The eye & adnexa*1 (1.21 times odds), The Ear & mastoid
process*" (1.49 times odds), The Circulatory system*111 (1.59 times odds), The Respiratory system*17 (1.29
times odds), The Digestive system*7 (1.69 times odds), Skin & subcutaneous tissue*71 (1.69 times odds),
the Musculo-skeletal system & connective tissue*v,1(1.17 times odds), the Genitourinary system*7111 1.09
times odds), Congenital malformations, deformations & chromosomal*1* (2.63 times odds), Injury,
poisoning & certain other consequences of external causes** (2.65 times odds), External causes of
morbidity & mortality**1 (1.36 times odds). All systemic classification was based on the International
Classification of Diseases-10 (ICD-10).
One of the body systems worst hit seemed to be the nervous system when combined with the mental and
behavioral effects (odds- 1.59:1 & 3.03:1). Congenital malformations, deformations and chromosomal
aberrations follow (odds- 2.63:1). Accidental injury and poisonings are leading causes of mortality
(Odds- 2.65:1). Diseases affecting the Neoplasms (2.5:1) and Blood and blood forming organs (2.1:1) are
significantly great Eloor.
Clinically confirmed*™ Cancer Incidence is greater in Eloor in a statistically significant rate. When 13
cases of incidence were reported in the Eloor set, only one was reported in the sampling set at Pindimana.
The combined odds ratio across Eloor and Pindimana is (2.85:1). This is alarming to say the least.
I
’Hi
l,!'
I
■■
I
Medical Verifications were performed using the lung function tests (Spirometry) on a random sample of
the reference and target populations. These confirmed high rates of actual incidence?*"1
" Despite the fact that Pindimana, the reference village, was going through an epidemic of Leptospirosis and Dengue Fever, the rate of occurrence of
infectious diseases under Category-1 of the ICD(International Classification of Diseases) in Eloor Section A and Eloor Section B, two target areas
within Eloor(which was not facing an epidemic) was slightly more than the rate at the reference! This clearly shows that there is an ongoing live
epidemic in Eloor which is not being perceived as one that requires attention as it is on all the time.
Please see Appendix 1 for details.
IV Sampling Ratio was 1.4
' Sampling Ratio was 1:7
” Chapter-2 of the International Classification of Diseases, the 1CD, Version-10, http://www.wcllcool.demon.co.uk/ltmhi/PBarkerICDIO.htm
ibid Chapter-3
™ ibid Chapter-4
,x ibid Chapter-5
x ibid Chapter-6
x‘ ibid Chapter-7
ibid Chapter-8
xiii ibid Chapter-9
ibid Chapter-10
ibid Chapter-11
xvi ibid Chapter-12
™ ibid Chapter-13
xviii ibid Chapter-14
xlx ibid Chapter-17
xx/6WChapter-l9
xx’ ibid Chapter-20
xxii Clinical Confirmations were obtained by follow-up house visits with a team of doctors from the Occupational Health and Safety Centre- Mumbai
using Spirometry for Respiratory Illness (Chapter-10, ICD-10) and examinations of medical records (Chapter-10, ICD-10) for ascertaining Cancer
Incidence.
XX,H For Eloor the figure was 10- severely affected under FEV1 or FVC or both below 60% of the predicted values, the expected values in healthy
persons. 7 are moderately affected and 9 showed that their values for lung function are just below the 80% of predicted values. Totally 26 out of 45
tested for lung function are affected ie 57.8% confirmed respiratory illness rates. Lung function test could be administered to 43 persons. Three persons
were obviously affected and could not perform the test. Eight had reported respiratory problems but did not want to go through the lung function test
(5)
?
'1^J;
It is clear that the nature of illness spreads across practically all body systems in an almost unpredictable
manner. This is clearly due to the fact that it is a cocktail of chemicals (a few score heavy metals a few
hundred organic chemicals) and that are in the air and water of Eloor. There is very little medical research
globally that accounts for synergistic effects of synthetic chemicals in human beings. The evidence that
one finds at Eloor clearly shows that the synergistic effects of these chemicals are more devastating than
expected.xxlv
i
These findings have implications on industrial planning policy globally. The paradigm of designing
industrial estates recklessly with no regard for the effects on public health needs to change. The chemical
cocktail that is released into the air and water needs to be stopped. When there are a complex group of
chemicals in your air and water it becomes almost impossible to predict and remedy the human diseases
that may be caused by them, not to mention the near impossibility of treatment and clean-up of the
contaminated air and water.
■I
■
v!
If
■
Industrial Estates must be allowed to exist only in the rare exception, when they are planned like
ecological neighborhoods where all the chemicals used within the estates are self contained using closed
loop systems and zero-discharge is effectively implemented by online regulation.xxv The new planning
paradigm must accommodate clean production technology as its integral part.XXVI
-
II.
EXECUTIVE SUMMARY
An Introduction to Eloor:
Eloor is a river island on the river Periyar around 17 kms from its mouth at the Arabian Sea near the city
of Cochin. It occupies an area of 11.21 square kilometres. Eloor supports the largest industrial belt in
Kerala with over 247 chemical industries. The industries make a range of chemicals- petrochemical
products, pesticides, rare-earth elements, rubber processing chemicals, fertilizers, zinc/chrome products
and leather products. Most of these industries are over 50 years old and employ the most polluting of
technologies. The industries take large amounts of fresh-water from the River Periyar and in turn
discharge concentrated effluent with very little treatment. This leads to the large-scale devastation of
aquatic life in the river and the farmlands in the region. There are 35 illegal pipes spewing effluent into
the river directly from the industry.xxviiAir emissions range from acid mist to sulphur dioxide, Hydrogen
Sulphide, Ammonia and Chlorine gas.xxviii There are close to 40,000 people living and working on the
island, 29,064 of whom are part of the village community not employed by the industries. The rest are
employees and stay in the company quarters. The Woman to Man ratio is 1000:1054.xx,x
r■
The Background to the Community Health Assessment:
Four persons were in good health with no problems so tests were not administered. Totally 28 persons interviewed (and tested or only checked) have
respiratory system affected.
J-’'
I
I
■
XXIV See www.ourstolenfuture.orq/NewScience/sYnerqY/synerqy.htm
Also http://www.health.state.mn.us/divs/eh/qroundwater/hrlmix.html for some new action on groundwater contamination and
synergistic effects.
Also http://www.nmenv.state.nm.us/aqb/proiects/Corrales/ DOH Synergistic Effects.pdf
xxv See http://www.indigodev.com/ADBIIBCh2Foundations.doc
Also Erkman, Suren and Ramaswamy, Ramesh. 2000. Industrial Ecology as a Tool for Development Planning—Twinning Industrial Ecology and
Cleaner Production. UNEP’s 6th International High-level Seminar on Cleaner Production, Montreal, Canada. http://www1agrifoodorum.net/db/cp6/Input to CP6.doc
See wwAV.cleanproduction.org for details ofclean production techniques and success stories from around the world.
XXVI See Cornell Work and Environment Initiative http://www.cfe.cornell.edu/wei/ Includes eco-industrial roundtable newsletters and proceedings,
case profiles, and papers on eco-industrial parks and networks.
xxv" From a joint assessment done by the Periyar Malineekarana Virudha Samithi and the Kerala State Pollution Control Board.
xxviii There are many unidentified chemicals that are in the plumes of the industries of the area. The Pollution Control Board has not comprehensively
monitored these.
XXIX |4,|44 women and 14,920 men. Most people are employed in the services industry-serving the government or private industry. Many run local
businesses. Traditional occupations including fishing and farming have been entirely wiped out by polluting industry. There is a section of people that
are migrant and are involved in illegal sand-mining from the bed of the river. A small population on the island is unemployed..
3
I
i- ■
■ >!
Despite the fact that the pollution of the River Periyar and the land has been established unequivocally
there has been little action by regulatory authorities.™* It seemed to us at the beginning of the research
like there needs to be stronger arguments and actions from the community that backs up the new research.
We decided to back our existing research on contamination by the local pesticide industry, Hindustan
Insecticides Ltd and Merchem Ltd.xxxi Meanwhile a resident of Eloor was appointed by Greenpeace as the
Riverkeeper for the Periyar to monitor water quality of the river and alert local government, regulatory
authorities and the pollution control boards of the need to take immediate action to stop pollution.™*"
The fact that the Community Health Problems of Eloor were quite apparent and that a similar reality was
observed across the country along the 24 hotspots identified by Greenpeace India prompted us to go for a
health assessment that shall establish prima facea the problem.***1" Greenpeace initiated an alliance with
Occupational Health and Safety Cell- Mumbai, which has prior experience in the matter of
Epidemiological Research. The broad framework of OHSC taking the lead with Medical Verifications of
the primary data collected using a questionnaire research was arrived at jointly, with Greenpeace taking
the primary role in the field based research and the survey. The Ethical Guidelines developed by the
National Committee for Ethics in Social Science Research in Health (NCESSRH2™X1V
hi
The Health Assessment Method:
The Greenpeace team stared active field based work in on the health assessment in April, 2003.
I
The first step was to obtain Community consent to do the assessment and ensure participation and
cooperation from the local Panchayat and local community leaders.**™ Next came a comprehensive literature
survey of all available material on health status of the community.*™''' All available maps were digitised to
produce one comprehensive map that would capture all the data from secondary sources on it.(See the Maps
in Appendix-5)
’ of\people with ill health and1 cases of death due to diseases with environmental factors on this
After plotting
detailed map, we made the decisions on identification of the Target and Reference Group. We also looked at
the available state averages could have been used instead of the reference group.
We arranged for a visit of the partners in research, the OHSC-Mumbai to Eloor to observe the reality of the
island and help us with developing the medical aspects of the study. We incorporated strategic thrust into the
basic study design along-with them.
In setting the criteria to develop the study questionnaire, we concluded that it is in the best interest of the
study to increase the study power to assess the maximum possible number of people by eliminating as many
questions as possible from the study questionnaire. We assume that the studies that would be done in follow-
I
xxx The local pollution control board has been entirely ineffective in ‘controlling pollution’ if not preventing it. Therefore the local community
agitations have more often focused on the pollution control board to initiate immediate action against polluting bodies Refer the Kerala Pollution
Control Board Website for developments: http://vww.kspcb.nic.in
XXXI After the Greenpeace Sampling mission of 1999 when it was established that a large amount of polluting chemicals have been released by certain
specific industries (Hindustan Insecticides ltd, Merchem Ltd), the local community took direct action against the polluting agencies by damming the
polluting stream-Kuzhikkandam Thodu. The companies have ever since been forced to enter into a dialogue with the panchayat and local people to
come up with a plan to clean up the mess along the stream. They have failed to come up with a safe protocol for doing so. Their current plan involves
dredging the sludge and dumping it in a nearby wetland permanently destroying the water table. There is currently a court injunction on any such
action.
***" He has also addressed the people of Cochin city with the dangers of using the polluted river water for drinking purposes.
xxxi" The local people have been complaining of large-scale health problems on the island. These include respiratory disorders, cancers, congenital
problems like mentally/ physically challenged children, chronic depression and reproductive problems.
XXX,V Ethical Guidelines for Social Science Research in Health: By National Committee for Ethics in Social Science Research in Health (NCESSRH).
www.cehat.org/publications/ethical 1 .htrnl
Also see , Notes on Qualitative Research and Ethics of Research On Disaster and Complex Political Emergencies by Fatima Alvarez-Castillo,
Professor,University of the Philippines Manila, Email: fatima.castillo@up.edu.ph
XXXV Several one-to-one meetings with the local panchayat (its president and secretary) and local community leaders (Purushan Eloor of PMVS and
Prasad/ Adv.Rajesh of JAV) ensured that the objectives were met.
XXXVI
The following were the sources for the secondary literature surveyThe Integrated Child Development Programme- A Compilation of the whereabouts of people with disease in the village.
1)
The Eloor Village Panchayat- The Death Register
2)
The Regional Cancer Detection Centre- The statistical averages of incidence of cancer in patients that approach the center.
3)
The Union Christian College, Aluva—An Environmental Impact Assessment of the Alwaye Industrial Belt, dept of Economics, August
4)
1993.
The Village& the Taluk Office: Census Data and Demographic information.
5)
4
!r
t ■
I
'f'
I j.-
up possibly by the institutions of the Govt of India and the WHO would ensure a comprehensive, cause-effect
look at all the health problems.
The Proposed Research Question in the first round of discussions was: “What is the prevalence of Chronic
Respiratory Illness and Cancer in the affected community around Eloor Industrial Estate?” This evolved into
the more broad and exploratory research question later as we interacted with the advisory board: “What are
the Health Problems faced by the resident community of Eloor Industrial Estate, due to increased pollution of
the air and water by chemical industries?” The meetings with the advisory board also discussed and thrashed
out issues like scientific biases, sampling sizes/ratios, training module for interviewers, ethics and statistical
analysis.
it
ilt •
'll'"
I
The Training of the interviewers’00™1, a community sampling exerciseXXXV1" and Pilot Surveys’00^ to identify
practical difficulties in the working of the Field Investigation were performed. This effectively launched the
team of 10 interviewers for 45 days of data collection at the end of which we have information about 9122
individuals across Eloor and Pindimana.
Throughout the investigation involving respondents all basic ethical norms were strictly followed. Prior
informed written consent was obtained from each participant.
The Analysis: We restricted oUr analysis to simple percentage analysis and lead it to the calculation of OddsRatios under the International Classification of Diseases (ICD-10) as we were told by the advisory that
campaign value of common-sense analysis is far greater than in-depth analysis.(Refer Appendix 6 for details)
Simple Office software was coupled with Manual Computation techniques to reach the figures on prevalence
percentages, incidence, statistical significance and overall patterns.
The Findings: The one simple and basic finding is that we observed is that without exception, all body
systems are adversely affected in Eloor as opposed to Pindimana. This shows that the cocktail of poisons in
the air and water of Eloor as opposed to Pindimana is exerting synergistic effects on the local population and
these effects seem to be unpredictable especially across particular age groups.
IF
.HI
L;i
The Conclusion: Immediate punitive action need to be initiated by the Government on the companies that are
criminally violating the right to Life of Communities and workers in the Industrial Estate and around.
Remedial action which includes, life-long medical rehabilitation, compensation and clean-up of contaminated
sites must be taken up by the polluting companies. Zero Discharge on the Periyar must ensure that the people
of Cochin are not poisoned.
IV
ACKNOWLEDGEMENTS
The authors wish to acknowledge the support of the Community Health Cell, Bangalore for all the research
support and advise. More specifically, we want to thank Dr. Thelma Narayan, Dr. Rajan Patil for their
guidance and help. We also want to recognize the valuable assistance of our Project Advisory Committee in
forming the study design and reviewing its progress. Finally, we want to thank the representatives of all of the
projects and organizations who contributed materials and information to this project.
.I
■
H
xxxv" Inhouse, for 3 days with the help of local doctors and the Community Health Cell in remote contact.
xxxviii With all the important people in the local community, the Panchayat Officials, the Community Leaders and youth.
xxx,x One day events that ended in another day of one-to-one review and amendments in the questions.
5
TABLE OF CONTENTS
V
I
Ti
J
II
111
IV
Main Research and Policy Findings
Executive Summary
Acknowledgements
Table ofContents
1. Research Problem/Context
Page
2
3
4
5
6
1.1 Eloor-A Brief Description
Geography
1.1.1
The Community
1.1.2
The Socio-Political Background
Pollution Problems
The Campaign Context
1.1.5
The Reported Health Problems
1.1.6
2. Methods and Limitations
3. Research Findings
3.1 Review of Indicator Reports
3.2 Field Questionnaire Survey
3.3 Ethnographic Accounts
3.4 Focus Groups
4. Implications for Health Action to protect Communities and Workers in Indian Industrial Estates
5. Implications for Policy and Practice
6. Dissemination/Knowledge Transfer
7. Bibliography
1.1.3
1.1.4
7
8
9
10
11
12
13
13
14
15
Appendix 1: Copy of Questionnaire Survey
16
Appendix 2: Follow-up Investigation Of Carcinoma Questionnaire:
Appendix-3: Follow-up Investigation-Respiratory Disability Questionnaire
17
Appendix 4: Pulmonary Function Tests at Eloor & its confirmation rate
18
Appendix 5: List of Maps of Eloor with Mortality/Morbidity information
19
Appendix 6: List of Findings transcribed into Charts
20
Chart 1: ICD-10 Chapter 1/Certain Infectious Diseases
Chart2: ICD-10 Chapter 2/Neoplasms
Chart3: ICD-10 Chapter 3/ Diseases of the Blood and Blood-forming Organs
Chart4: ICD-10 Chapter 4/ Endocrine, nutritional and metabolic diseases
Chart5: ICD-10 Chapter 5/ Mental and Behavioural Disorders
Chart6: ICD-10 Chapter 6/ Diseases of the nervous system
Chart?: ICD-10 Chapter 7/ Diseases of the eye & adnexa
ChartS: ICD-10 Chapter 8/ Diseases of the ear & mastoid process
Chart9: ICD-10 Chapter 9/ Diseases of the circulatory system
Chart 10: ICD-10 Chapter 10/ Diseases of the respiratory system
Chart 11: ICD-10 Chapter 11/ Diseases of the digestive system
Chart 12: ICD-10 Chapter 12/ Diseases of the skin & subcutaneous tissue
connective tissue
Chartl3: ICD-10 Chapter 13/ Diseases of the musculoskeletal system &
Chart 14: ICD-10 Chapter 14/ Diseases of the genitourinary system
Chart 15: ICD-10 Chapter 15/ Pregnancy, childbirth and the puerperium
Chart 17: ICD-10 Chapter 17/Congenital malformations, deformations & chromosomal-abnormalities.
Chart 18: ICD-10 Chapter 18/ Symptoms, signs & abnormal clinical and lab. findings, not elsewhere
classified.
Chartl9: ICD-10 Chapter 19/ Injury, poisoning & certain other consequences of external causes
Chart20: ICD-10 Chapter 20/ External causes of morbidity & mortality
Chart21: ICD-10 Chapter 21 / Factors influencing health status & contact with health services
Appendix 7: List of Resources for Community and Research groups
Appendix 8: The Abridged Ethnographic Interviews for Eloor.
35
6
1
1. RESEARCH PROBLEM/CONTEXT
t'
METHANAM FERRY
ELOOR GRAMA PANCHAYATH
N
10th FIVE YEAR PLAN
ROADMAP
VARAPUZHA
PAM3HAYATH
KADUNGALOOR PANOiAYATH
TOEDAYAR
CnooimUra
Panchayain
->r
iB’
I -
I"
\
TOKALAUASSERY
CHERANALLOCR
PANCHAYATH
CHERANALLOOR
FERRY
V
S'
KALAMASSERY
MUNICIPAL TOWN
1
KOCHI CORPORATION
TO CHERAW
Fig. I: Map of Eloor Island on River Periyar.
1.1 Eloor: A Brief Description1.1.1 Geography:
Eloor is a river island on the river Periyar around 17 kms from its mouth at the Arabian Sea near the city of
Cochin. It occupies an area of 11.21 square kilometers. (See Fig-1) There is one high point on the island
within the industrial estate near FACT and the TCC from where all the drainage originates.
ill .■
■
i
1.1.2 The Community:
There are close to 40,000 people living and working on the island, 29,064 of whom are part of the village
community, mostly not employed by the industries. The rest are employees and stay in the company quarters.
The Woman to Man ratio is 1000:1054. (14,144 women, 14,920 men)
1.1.3 The Socio-Political Background:
Most people are employed in the services industry-serving the government or private industry. Many run
local businesses. Traditional occupations including fishing and farming have been entirely wiped out by
polluting industry. There is a section of people that are migrant and are involved in illegal sand-mining from
the bed of the river. A small population on the island is unemployed too.
The Village of Eloor is governed by the local Pachayat- Eloor Grama Panchayat. The hierarchy of local self
governance in the ascending order of power is as follows: Eloor Panchayat—Alangad Block Panchayat—
North Paravur Taluk Office-Ernakulam Zila Parishad. It comes under the Aluva Assembly constituency and
the Ernakulam Lok Sabha Constituency.
H
BI
!
1.1.4 Pollution Problems:
Eloor supports the largest industrial belt in Kerala with over 247 chemical industries some of which are across
the bank of the river at Edayar. The industries make a range of chemicals- petrochemical products, pesticides,
rare-earth elements, rubber processing chemicals, fertilizers, zinc/chrome products and leather products. Most
of these industries are over 50 years old and employ the most polluting of technologies.
7
The siting of the factories is such that they trap the island community, as the connecting bridges to the
mainland, are off the industrial part of the island, away from community households. In the event of a
chemical accident like the one that happened in Bhopal, they have no choice but to swim across the river for
cover, which could lead to massive injury and loss of life.
The industries take 17 million cusecs of fresh-water from the River Periyar and in turn discharge roughly
1.5 million cusecs of concentrated effluent with very little treatment. This leads to the large-scale
devastation of aquatic life in the river and the aquaculture farms in the region. There are 35 illegal pipes
spewing effluent into the river directly from the industry.
%
I'^3':' 1
I:
Air emissions range from acid mist to Sulfur dioxide, Particulate matter, Carbon Black, Ammonia and
Chlorine gas. There are many unidentified chemicals that are in the plumes of the industries of the area.
The Pollution Control Board has not been monitoring these in a comprehensive manner.
I?
1.1.5 The Campaign Context:
The local pollution control board has been entirely ineffective in ‘controlling pollution’ if not preventing
it. Therefore the local community agitations have more often focused on the pollution control board to
initiate immediate action against polluting bodies.
I kt
IF
After the Greenpeace Sampling mission of 1999 when it was established that a large amount of polluting
chemicals have been released by certain specific industries (Hindustan Insecticides ltd, Merchem Ltd and
Indian Rare Earths), the local community took direct action against the polluting agencies by damming
the polluting stream-Kuzhikkandam Thodu.
rI
bi
It'
fw?-
The companies have ever since been forced to enter into a dialogue with the panchayat and local people
to come up with a plan to clean up the mess along the stream. They have failed to come up with a safe
protocol for doing so. Their current plan involves dredging the sludge and dumping it in a nearby wetland
permanently destroying the water table. There is currently a court injunction on any such action.
Meanwhile VJ Jose, a resident of Eloor was appointed by Greenpeace as the Riverkeeper for the Periyar
as the ‘1000 Bhopals Bus Jatha’ was passing through ELoor. His primary role has been monitoring water
quality of the river and alerting local government, regulatory authorities and the pollution control boards
of the need to take immediate action to stop pollution. He has also addressed the people of Cochin city
with the dangers of using the polluted river water for drinking purposes.
Greenpeace has also made a compilation of all the chemicals in raw materials, products, effluents and
emissions, which also enlist, detailed information on potential health problems to workers and
community. This is in continuance with the Community Right to Know Campaign in the area.
1.1.6 The Health Problems’^1:
The local people have been complaining of large-scale health problems on the island. These include
respiratory disorders, cancers, congenital problems like mentally/ physically challenged children, chronic
depression and reproductive problems. It was noted that the time to do a meaningful assessment of the
same had arrived.
I
The Proposed Research Question for the study was “ What are the Health Problems faced by the
resident community of Eloor Industrial Estate, due to increased pollution of the air and water by
chemical industries?”\
2. METHODS AND LIMITATIONS
The answer was researched involving four strategies:
1) A Review of literature from around the world and Eloor (March-April 2003);
2) A questionnaire based survey of people in Eloor and Pindimana (May-July 2003);
3) Follow up Medical Verifications for Respiratory Illness and Cancer.(May-July,2003)
4) Ethnographic interviews of two subsets of people at Eloor (August, 2003); and
xl Identified mostly through observational studies done by the local community and the local self Government
8
I®’
TS.
I
J
■
fl.
5) Focus group discussions (August 2003).
In all strategies involving respondents all basic ethical norms were strictly followed. Prior informed written
consent was obtained from each participant. The people were informed of the results of the medical
examination as soon as the Spirometer displayed results. All patients were ]given medical advise to the best of
the understanding of the doctors. Some were also given legal advise on using the Public Liabilities Insurance
Act to claim some compensation from the Industries via the State.
Here is a detailed account of each of the five strategies:
1) Health Information Gathered From Secondary Sources:
The following were the sources for the literature surveya) The Integrated Child Development Programme- A Compilation of the whereabouts of people with
disease in the village.
b) The Eloor Village Panchayat- The Death Register
c) The Regional Cancer Detection Centre- The statistical averages of incidence of cancer in patients that
approach the center.
d) The Union Christian College, Aluva—An Environmental Impact Assessment of the Alwaye Industrial
Belt, Dept of Economics, August 1993.
e) The Village& the Taluk Office: Census Data and Demographic information.
I
Number of Mentally& Physically 111 in the Overall Population (ICDS Data): 159
Death Register- Death Rate:
I'
•i-
!r-
S'
IF
4.425 per 1000
Cancer Death Rate
0.361272
Ashtma Death Rate
0.481696
Rhuematism DR
0.275255
Heart Attack DR
0.946188
Paralysis DR
0.395679
Renal Failure DR
0.240848
Others
1.376273
Death Rate 98-99__________________________
4.077209
Figure 2: Mortality figures compiled for the period from 1998 to 1999.
Mortality rates, Socio-economic indicators and other factors that influence the Health of Communities were
considered while taking design decisions for the health survey. The design decisions- including those of
which village to choose as a reference to Eloor (target) and what sampling technique to follow was taken at
the advisory board meetings. The Advisory met three times during the survey and recommended meaningful
amendments in structure and approach which was implemented almost in its entirety in the field by the
Greenpeace and OHSC team. Mapping of Mortality patterns on the detailed map of Eloor. This graphically
portrayed the patterns across the industrial belt in terms of local geography, wind patterns, water flow and
other ecological processes greatly enhancing our capacity to analyse the data.
THE TARGET VILLAGE- ELOOR
Population:__________ 29,064
11.21 sq kms
Total Area:______
1054:1000
Male/Female Ratio:
A PROPOSED CONTROL- AAVOL1
Population:___________ 21,636
18.6 sq kms
Total Area:______
1000:1120
Male/Female Ratio:
Occupations: Service sector, Business, Chemical
Factory Based, Ex-Agriculture, Ex-fishing-Fishing
(few fish), Dairy, Tailoring, Animal HusbandryChicken, Pig, Vegetables, Banana (no large scale
farming)______________________________ _
Riverine Status: River Island- locked on all sides
Number of Industries: 18 large chemical industries
Occupations: Agriculture-Vegetables, Banana,
Areca nut. Rubber, Pineapple, Tapioca,
Traditional Fishing, Tailoring, Food Processing,
Animal husbandry- Dairy, Chicken, Pig,
Matchstick production_________________
Riverine Status: Locked by the river on two sides
Number of Industries: 1 Food processing Unit
9
i
at.
I
I
I
Figure 3: An early comparative study between the target and a proposed reference village, Aavoli next to
Pindimana.
■
I
2: A Questionnaire based Survey was conducted across the target and reference villages:
The Questionnaire was exploratory in nature and observed the prevalence and incidence of various types of
diseases that are normally caused due to toxic pollution. The details of a sample questionnaire is attached
herewith. (See Appendix 1)
The format and the content of the questionnaire was finalised after several rounds of discussions with the
advisory board in Bangalore. The Questionnaire got abridged from four pages to one page. The sampling unit
changed from individual to the household. A key informant was to be chosen by the interviewer using a
standard criteria- that the key informant is the person in the household who is in charge of the family’s health.
The key informant was to report the health status of all the living members of the family and the last two
deceased members. The interviewer would take the family health information down in a table using a set of
codes given to him, which were later classified during analysis under the International Classification of
Diseases.
The questionnaire was administered to the populations sampled out randomly from three strata in
Eloor(target) and one in Pindimana (reference). The Sampling ratio for Eloor was 1:4 and that of Pindimana
was 1:7. Roughly all the strata (A,B,C) and Pindimana(D) had similar population sizes. All in all we
generated information about 9122 alive people, both villages put together. The information about deceased
has also been collated.
3) Follow up Medical Verifications for Respiratory Illness and Cancer.(May-July,2003)
These were planned and conducted by the Occupational Health and Safety Centre- Mumbai. The tollow-up
medical verification was done using house-calls and primarily relied on Spirometry for verification of
Respiratory Illness cases and examination of medical records for cancer verification. Conducted by doctors of
the Occupational Health and Safety Centre, under the leadership of Dr. Murlidhar V and Vijay Kanhere, this
was a 6-day event in June when they diagnosed the degree of disability in communities. This information was
used to objectively verify and qualify some of the observations of the questionnaire survey.
i;
4) Ethnographic interviews of two subsets of people at Eloor (August, 2003);
Collecting Ethnographic Information from Various Individuals classified according to age and occupation
using open questionnaires: (Refer Appendix-7)
5) Focus group discussions (August 2003).
The focus groups were held as the community sampling exercise was being conducted and later as the final
debrief was being conducted within the community after the survey. Both sessions confirmed our earlier
understanding from individual interviews. They also confirmed the common sense understanding of the
findings of the preliminary literature survey.
3. A Limitation:
One of the limitations of the study is that it does not examine in detail the range of specific health problems
faced by the community and workers at the Industrial Estate because we decided to perform an exploratory
investigation.
Our understanding of health and the influencing indicators of community health is based on an existing
conceptual framework of characteristics of the health of communities, the "Indicators That Count" framework
(henceforth termed only as the "framework") developed by Hancock et al. (1998 and 1999) (see Figure 1).xl1
xli
The framework presents a logical progression from inputs to processes of change to outputs. The inputs are determinants of health (environmental
viability, liveable built environments, community conviviality, social equity and economic adequacy). Next, education and governance are related
to processes-of-change which underpin community health. Finally, population health outcomes include measures of both positive health (e.g., quality
of-life) and negative health (e.g.. disability/morbidity/mortality, functional health measures). For the purposes of our research, we
refer to Sustainability, Viability, Livability, etc. as "categories" while the sub-levels within these categories are referred to as "elements" (e.g., energy
use. water consumption, etc.).
10
HEALTH STATUS
Positive Health and Quality of Life: Well-being/self-reported health; Life satisfaction; Happiness
Mastery/Self-esteem/Coherence
Health-promoting Behaviours
Negative Health: Stress/anxiety; Other morbidity/disability measures; Health utility index
Mortality: Overall mortality rate; Infant mortality rate; Suicide rate; Life expectancy
Figure 2: Health Status in the "Indicators That Count" framework developed by Hancock et al. (1998 and 1999)
w-'1
n
y
I' - •
Ml;
IC.
r
a:
DETERMINANTS
Sustainability
Water consumption; Renewable resource consumption Waste production and reduction; Loca
production of resources; Land use (allocation of use); Ecosystem health; Ecological footprint
Viability
Air quality; Water quality; Toxics production and use; Soil contamination; Food chain contamination
Livability
Housing quality; Density and land use in the built-environment; Community safely and security:
Transportation/automobile dominance; Walkability; Green/open space; Smoke-free space; Noise pollution
Conviviality
Family safety and security; Sense of neighbourhood/place; Social support networks; Charitable donations
Commitment to public services; Demographics
Equity
Economic disparity; Housing affordability; Discrimination and exclusion; Access to power and control
Prosperity
Diverse economy; Local control of businesses; Employment/unemployment; Quality of employment
Traditional economic activity indicators
PROCESSES
Education
Early childhood development; Education attainment/school quality; Adult literacy; Lifelong learning
Governance
Voluntarism/associational life; Citizen action/civic ness; Human and civil rights; Voter turnout; Perception ol
political leaders and government services; Healthy public policy
Figure 3: Indicator Categories and Elements of the "Indicators That Count" Fraineworkftext in black signifies
criteria that have been observed in the current survey’)
If"
r,
IF'
jk
L
4. IMPLICATIONS FOR REMEDIAL HEALTH ACTION TO PROTECT COMMUNITIES AND
WORKERS IN INDIAN INDUSTRIAL ESTATES
Of the five types of relevant research listed by Frankish et al xl,‘ (1- conceptualxl,n, 2- needs assessment*11'', 3„„MMM tools developmentxlv, 4- implementationx,vl and 5- intervention outcome researchxlv11); in the area of
xl" Institute of Health Promotion Research, University of British Columbia, September 2002- www.ihpr.ubc.ca/pdfs/frankish-cphifinal_v4.pdf
1 1
■
-hi :
Community Health that warrant further attention, future research, and immediate corrective measures ours
would fall under the final category.
Intervention outcome research would in all probability lead to action from the concerned parties in the
direction of affirming the rights of the communities affected.
I
The immediate interventions that this project would suggest regulators and criminal parties take up:
1) The Comprehensive Assessment of damage to Health
Health of
of every
every individual
(community/worker) in Eloor.
2) Immediate steps to stop the poisoning of the water-system of Eloor and Cochin (the
Periyar) ie Zero Discharge on the River and in streams.
3) Immediate steps to cap the emissions of industries with strict online monitoring systems.
4) Based of the above-said Comprehensive Health Assessment of Individual damages on
I
Immediate punitive action need to be initiated by the Government on the companies that are criminally
violating the right to Life of Communities and workers in the Industrial Estate and around. Remedial action
which includes, life-long medical rehabilitation, compensation and clean-up of contaminated sites must be
taken up by the polluting companies. Zero Discharge on the Periyar must ensure that the people of Cochin are
not poisoned.
3. IMPLICATIONS FOR POLICY AND PRACTICE
It is clear that the nature of illness spreads across practically all body systems in an almost unpredictable
manner. This is clearly due to the fact that it is a cocktail of chemicals (a few score heavy metals a few
hundred organic chemicals) and that are in the air and water of Eloor. There is very little medical research
globally that accounts or synergistic effects of synthetic chemicals in human beings. The evidence that one
finds at Eloor clearly shows that the synergistic effects of these chemicals are more devastating than
expected.xlv,n
These findings have implications on industrial planning policy globally. The paradigm of designing industrial
estates recklessly with no regard for the effects on public health needs to change. The chemical cocktail that
are released into the air and water needs to be stopped. When there are a complex group of chemicals in your
air and water it becomes almost impossible to predict and remedy the human diseases that may be caused by
them, not to mention the near impossibility of treatment and clean-up of the contaminated air and water.
Industrial Estates must be allowed to exist only in the rare exception, when they’ are planned like ecological
neighborhoods where all the chemicals used within the estates are self
< J ~ contained using closed loop systems
and zero-discharge is effectively implemented by online regulation, xlix The new planning paradigm must
accommodate clean production technology as its integral part.
xliii Conceptual research is needed to better articulate the key characteristics of interest as they relate to community health We need to better
understand how Indians (both lay people and decision leaders) conceptualize health and quality of life at a supra-individual (i.e .neighbourhood or
community level). We also need research on the values underlying these perceptions and their implications for program and policy development.
X|1V Needs assessment research should involve five aspects: identification of users and uses of community-levelindicators; better description of target
populations and service environments; more complete description of problems and potential solutions); assessment of the relative importance and
nature of specific needs; and communication of these needs to decision makers and relevant audiences.
X,V Tool development is needed to develop, validate and test new ways of measuring community-level indicators. At present, sufficient tools do not
J
exist or they are poorly validated and not rigorously or widely used.
XlVI Implementation research is needed to examine the factors influencing the successful execution of indicator projects. Many project are developed
with the intent of fostering change in a given jurisdiction. If they "fail", it is often difficult to ascertain if they were provided sufficient resources (e.g..
time, people, money) so as to be successful.
XlV" Intervention outcome research is needed. Many indicator projects are developed with the goal of launching some form of "intervention" and
linking indicators of "community health" to important outcomes such as changes in health behaviours, health status and use of health or social services.
At present, we lack sufficient knowledge to say which interventions are effective and to elucidate the causal pathways between community-level
factors and the outcomes of interest.
xlviii See www.ourstolenfuture.org/NewScience/svnerqv/sYnerqy.htm
.
Ako http://www.health.state.mn.us/divs/eh/qroundwater/hrlmix.html for some new action on groundwater contamination and
synergistic effects.
.
t
..
Also http://www.nmenv.state.nm.us/aqb/proiects/Corrales/ DOH Synergistic Effects.pdf
xllx See http://www.indigodev.com/ADBHBCh2Foundations.doc
12
li.
||
■h
x
4. DISSEMINATION/KNOWLEDGE TRANSFER
.
.
u
,
We have adopt a participatory approach to our research activities.1 The Dissemination plan is also based on
an understanding of the needs and concerns of our audience, the community, workers, scientists, media
persons, policymakers, politicians and the medical community.
5. BIBLIOGRAPHY
Frankish J. (1999) Background Paper on Community Health Indicators for the Canadian
Community Health Survey. Report for the Policy Development & Coordination Division,
Health Canada.
Hancock T, Labonte R and Edwards R (1998). Indicators That Count! - Measuring Population
Health at the Community Level. [Report]
Hancock T, Labonte R and Edwards R (1999). Indicators That Count! Measuring population
health at the community level. Canadian Journal ofPublic Health 90 (Suppl 1):S22S26.
Shiell, A. & Hawe, P. (1996). Health promotion, community development and the tyranny ot
individualism. Health Economics 5(3):241-247.
s.
W'1
Also Erkman Suren and Ramaswamy, Ramesh. 2000. Industrial Ecology as a Tool for Development Planning-Twinning Industrial Ecology and
C|eaner
’
Production. UNEP’s 6th International High-level Seminar on Cleaner Production, Montreal, Canada.
http://www.agrifood-forum.net/db/cp6/lnput toCP6.doc
See www.cleanproduction.org for details of clean production techniques and success stories from around the world.
1 See Cornell Work and Environment Initiative http://www.cfe.cornell.edu/wei/ Includes eco-industrial roundtable newsletters and proceedings, case
profiles, and papers on eco-industrial parks and networks.
'' We define participatory research as "systematic inquiry, with collaboration of those affected by the issue being studied, for purposes of educatio and
taking action or effecting social change." As such, our work was designed to make our research questions more relevant to our community people, our
methods more acceptable, and our results more useful to decision makers.
13)
W1A
Appendix 1: COPY OF THE QUESTIONAIRRE SURVEY.
2003 HEALTH SURVEYS’ - FIELD INVESTIGATION QUESTIONNAIRE!
Identification Number (Area Code+ Interviewer code+ Ward Number+ House Number)
DATE
TIME
Number of Family Members
Address+ Phone Number (H/PP):
1.
2.
3.
^1
5
NAME
OF
FAMILY
MEMBER
A S Ky
G E Inf
E X mt
OCCUPATION
EDUC
ATION
# of yrs
Over
all
Health
DOCTOR-DIAGNOSED
HEALTH PROBLEM
1
Y/
N
2
3
4
Perceived Health
Problem
1
2
3
Habits? Smoking/
Drinking/ Chewingtobacco- CT n/y / SnuffSN n/y /
Tobacco-paste- TP n/y
Sn/y
D n/p
CT n/ySN n yTP n/y
Ml)
M2)
M3)
M4)
M5)
M6)
M7)
M8)
Deceased Member:
DI)
D2)
a
g
e
5
e
x
Year
of
Deat
h
Occupatio
n
Educat
- -ion
Over
all
Healt
h
Cause of death ?
Any chronic
disease?
Any addictive habits?
.
DISEASE INDEX FOR INTERVIEWER)
A: Asthma, AL: Allergies, AD: Allergic Dermatitis. ATD: Attention Defects,
ADR: Allergic to Drugs, ART: Arthritis, ANM: Anemia. AC-R: Accident Road,
A C-F: Accident Factory.________________________________________________________
B: Bronchitis, BD: Blood Disease, BRD: Birth Defects,
BS: Breathlessness sudden, LBP: Blood Pressure. HBP: High
Blood Pi essure, BR: Breathlessness regular, BP: Back Pain.
C: Cancer, CB: Cancer of the Breast. CT: Cancer of the testicles, CPR:
Cancer of the Prostrate, CL: Cancer of the Lungs, CBL: Cancer of the
Bladder, CUDT: Cancer of the Upper Digestive Tract, CLDT: Cancer of the
lower Digestive Tract, CST: Soft Tissue, CAS: Angiosarcoma, CA: Cardiac
Arrest, CP: Chest Pain, CNT: Contraceptive Pills/ implants /injections, CC:
Cervical Cancer, CNF: Confusion, CS: Severe Cough,
CCS: Severe Cough & Cold
___________________________
E: Endometriosis, EP: Early onset of Puberty, ED: Erectile Dysfunction, EL:
Epilepsy, EFL: Early Foetal Loss, EP: Eye Pain, EO: Eye Operation, G: Gall
Bladder Stone__________________________ __________________________________________
I: Infection, IE: Infection of the Ear. IT: Infection of the throat. IL: Infection of
the Lungs, IC: Infection-Common Cold, IO: Other infection, INF: Infertility,
IRT: Irritation, IA: Induced Abortions, IMN: Immunisation, ID: Indigestion.
F: Fibroid in the Uterus, FR: Fever recurring, FCR: Cold & Fever recurring
D: Diabetes, DP: Depression, DZ: Dizziness, DH: Diarrhea, DNP:
Dental Problem
M: Migraine, MP: Menstrual Problems, ML: Memory Loss, MN:
Menhorragea, MA; Missed Abortions, MD: Mental Disease
O: Obesity, OP: Osteoporosis
R: Rheumatism, RP: Reproductive illness, RTI: Reproductive Tract Infection
T: Thyroid problem, TB: Tuberculosis, TH: True Hermaphrodite
VDE: Vomiting with direct exposure, VL: Vision Loss, V: Varicose Vein
Dysfun ction_____________________
le Key intbrman
ions to be aske<
How would you rate your overall Health?
15
iself and other
HL: Hearing Loss, HR: Headaches Recurring, H: Headaches,
HD: Heart Disease, HP:Hepatitis
J: Jaundice, K: Kidney Failure, KS: Kidney Stone.
L: Leukemia, LD: Liver Disease, LGY: Lethargy, LSC: Low
Sperm count: LGS: Lymph Gland Swelling, LP: Leg Pain
N: Nasal Septum Perforation, NS: Nausea
P: Paralysis, PS: Paralysis-Stroke, PCOS: Poly-cystic Ovarian
Syndrome, PLS: Piles, PM: Psychiatric Morbidity, PU: Prolapse
Uterus_______________________________ _ ____________________ _________
SD: Skin Disease, SIV: Shuffling when walking, STD: Sexually
Transmitted Diseases, SU: Suicide Urge, STU: Stomach Ulcers,
SNS: Sinusitis, SI: Stress Incontinence, SP: Surgical
Procedures? SPN: Stomach Pain
U: Urinary Tract Dysfunction, VMM: Uncontrolled Muscle
Movements, UT: Undescended Testis______________________
W: Weakness, WZ: Wheezing
-
■
■
a
i,
i
Appendix 2: FOLLOWUP INVESTIGATION OF CARCINOMA QUESTIONNAIRE:
Identification Number (Area Code+ Interviewer code+ Ward Number^ House Number+
followup number-(two digits)
2.
d ate:
3.
AGE
4. Male/Female
SEX
5. Type of cancer
6. Organ affected
7. TNM Stage
8.In which year was it detected?
9.How was it detected?
10.local doctor
11 .Senior doctor in a major hospital
12. Pathology confirmation
13. Was surgery performed?
14. Was chemotherapy administered?
15. Was radiotherapy administered?
16.1s there pain at present?
17.1s there bleeding from the site?
Appendix 3: FOLLOWUP INVESTIGATION OF RESPIRATORY DISABILITY QUESTIONNAIRE:
Identification Number (Area Code+ Interviewer code+ Ward Number* House
Number* FOLLOWUP NUMBER-(TWO DIGITS)
2.
DATE:
3.
AGE
4. Male/Female
SEX
5. Y/N
Do you smoke? Y/N Did you smoke earlier?
6.
$ (n)/(y)- Smoking n=number of cigarettes/bidis per day/ y= number of years of
smoking
ft/
I
7. Y/N Do you get up due to cough?
8. Y/N is the problem for more than two months?
9. Y/N is the problem for more than two years?
10.Is there a particular season when the problem is faced?
1 l.Y/N is the cough with expectoration?
12. Y/N are you suffering due to asthma?
13. Y/N are you diagnosed to be asthamatic?
14. Y/N is there a family history of asthma?
15. Y/N.have you associated this problem with any cause?
16. what is the cause you have identified?
________________
17. What is the medication you take for asthma?
18. what is the frequency of medication?
BREATHLESSNESS:
Do you become breathless while:
19. climbing stairs
20. walking at usual speed
21 .walking for even 100 steps/ performing activities of daily living
22. even at rest
23. GRADE OF BREATHLESSNESS:
READINGS OF LUNG FUNCTION TEST
Sr. No.
FEV1
FVC
PEFR
MEFR
Selected
| MEFR
| Selected
1.
2. ____
I
3. ____
4. ____
__________
AFTER BRONCHODILATOR:
| Sr. No.
| FEVI ~
| FVC
| PEFR
1.
2.
3.
I
4.
24. FEV1 _____
26. COMMENTS
% of predicted ; 25. FVC
APPENDIX 4: PULMONARY FUNCTION TESTS AT ELOOR AND ITS CONFIRMATION RATES
4
5____ 6____ 7
8
9____ 10____
11_____
QI 2___ 2
Sr
Code F
M
PFT
FEV1 FEV1 FVC
FVC
Breath Lung
No
done? <60% <80% <60% <80% lessness function
grade
affected
1
N
3______ Nk
2
N
N
j______ Nk
3
Y
N
0______ N_____
21
4
Y
N
n
N
N
0_____
y_
5
N
J____
X
X
6_
Y
N
n
Y
1
y
7
Y
N
Y
I______
8
Y
N
n
Y
0_____
y
9
Y
N
lF
N
N
Y
1
Y
10
Y
N
nk____ Nk
11
N
0______
12
n
n
n
N
n
1
N_____
y
y
13
N
Nk____
X
14
n
n
n
n
0
N
_____
y
y
15
N
3
X
X
16
n
n
n
N
2
N_____
y
y
17
N
N
1
N_____
X
X
18
n
n
N
n
2
y
y
y
19
N
N
2
X
X
X
20
n
n
n
n
I
N_____
y
y
21
N
N
N
Y
1
X
X
22
n
n
0
N_____
y
23
N
0
N_____
X
X
24
n
n
N
n
0
y
y
y
25
N
1
X
X
X
26
n
n
N
n
n
I
N
y
y
27
Nk
Nk____
X
X
28
n
n
0
N_____
y
29
Y
N
N
N
N
0
N_____
30
n
n
Y
n
4
y
y
y
31
N
N
N
1
N_____
X
32
n
n
n
n
2
N_____
y
y
33
N
Y
I
X
X
34
n
n
nk
y
y
y
35
N
Y
N
0
Y
X
X
n
36
n
N
N
n
0
N
y
y
37
N
2
X
X
X
38
n
1
y
X
y
y
39
N
Y
Y
N
Y
N
Y
1
Y
x
x
x
x
x
x
x
x
x
x
x
x
x
x
x
x
x
x
x
x
x
x
x
x
x
x
x
x
x
x
IIf
HL •
% of predicted;
x
x
x
x
x
x
x
x
x
x__
x
x
x
x
x__
x__
x__
x
x
x__
x__
x
x
x
x
x
x
x__
x
x
x
I
■
x__
x__
x__
x__
17
K
x__
x
x
I'
x__
x__
x__
x__
x__
Oh - > co
08U65'
P
if
I"; 5 .'
40 ___
41 ___
J__
jf.l
tf
1
4
II
42 ___
43
44 ___
45 ___
46 ___
47
48
49
50 __
51 __
52 __
53 __
54 __
55
2
n______ y_____ y
N______ Y ____ Y
n
N
5
6_
3_______ 4____
jn_______ y____
y_
N
N
9_
0
0
10
N
X
1
N
n
n
Y
N
Y
N
Y
N
V
Y
N
N
Y
_N
N_
7
y_
n
N
£
N______ Y ____ N
n______ 1__ y
N______ Y ____ Y
N______ Y ____ Y
N______ Y ____
Y ____ V
N
N______ Y ____ Y
N______ 2__ Y
N
N______
N
Y
N
_N_____ Y ____ Y
N____ Y
Y
N_____ Y ___ N
N_____ Y ____ Y
Y _____ N____ Y
Y _____ N____ _N_
45
25
33
Females Males
n
N
Y
N
Y
N
Y
N
Y
n
Y
Y
2
Y
£
N
_1_
2_
£
0
N
N
N
N
N
N
N
n
11
_1_
2
2_
0
Y
Y
Y
N
N
N
N
Y
N
N
N
N
N
56 __
Y
Y
Y
2
57 __
N
o
58 __
28
17
9
10
10
Total
Of
yeses
25
13
Total
of
nos
05
03
Total
of
nks
Nk=not known
10 tested are severely affected with FEV1 or FVC or both below 60% of the predicted values (the
expected values in healthy persons). 7 are moderately affected and 9 showed that their values for lung
function are just below the 80% of predicted values.
Totally 26 out of 45 tested for lung function are affected. Lung function test could be administered to 43
persons. Three persons were obviously affected and could not perform the test. Eight had reported
respiratory problems but did not want to go through the lung function test. Four persons were in good
health with no problems so tests were not administered.
Totally 28 persons interviewed (and tested or only checked) have respiratory system affected.
APPENDIX 5: LIST OF MAPS WITH MORTALITY FIGURES
(To be inserted in colour)
f
jte
P
18
Certain infectious and parasitic diseases- Chapter 1 ICD-10 (International Classification of Diseases)
Male
Female
Pindimana liEloor
i
Pindimana E3 Eloor
61+ years
20-35 years
6-12 years
20.00
15.00
10.00
A
B
1
:
J
0-12 months
5.00
0.00
0.00
(A+B
Age Group
B
C
A+B+CX+B+C (A+B+C)
C
2.00
6.00
4.00
8.00
Affected
+C) Affected
Affected
Population D
Total Population C
Populati Popu Populati Populatio
male
0-12 montr
female
male
female
male
female
o'
0
0
1
______0
10 _______ 6 ’
3
______0
_____ 6 : ___ 2 _____ 4
16 ' ___ 15 ____ 16
3
0
0
_____ 4
1-5 years
■________ 3
________ 5
5-12 years
_______ 6
________ 8
12-19 year
______ 8
________ 5
_____ 9
19-35 year
_____ 34
______ W
___ 38
35-60 year
46
______ 44
__ 42
60+ yearly
18
15
28
____ 57 ___30
27’
8
male female
3
0
on -
latio
on (%)
n (%)
Male
n
male
female
male
female
1
0
male
female
10.00
12.00
Affected
Affected
Male
Female
(D)
(D)
Populatio
Population
n (%)
(%)
77
71
3,90
0.00
____ 8 _____ 9
256
225
3.13
4.00
___ 19 ___ 14
314
318
6,05
4.40
5
4
85 ______ 67
5.88
5.97
___ 19 ___ 15
356
355
^5.34
4.23
___ 5
_____ 13_
70 ______ 88
7,14
14.77
___ 87 ___ 48
2_ 2 ______ 2
___ 8
14
58 ______ 43
12.50
_______ 0.00
3.45 _______ 4.65
1212 1104
7,18
4,35
___ 15
_____ 20
217
233
6,91
____ 17
118
118
1168 1206
10.10
9.78
34
:_____ 24
249
248
13,65
3.58
_______ 9.68
5
54
47
376
14.36
11.24
14
11
129
126
10.85
8.73
418
14.00
16.00
Neoplams- Chapter 2 ICD-10 (International Classification of Diseases)
Male
Female
Pindimana E3 Eloor i
! □ Pindimana E3 Eloor I
61+years
36-60 years
ESSmrf 20-35 years
i 13-19 years
i-
I 6-12 years
|4MCWWMWWWWW«WCWW|
1-5 years
• 0-12 months
1.80
1.60
Age Group
0-12 months
1-5 years
6-12 years
13-19 years
20-35 years
36-60 years
61 + years
1.40
1.20
A
male
0
’___ 0
__ 0
__ 0
___1_
___1_
2
female
0
______ 0
______ 0
______ 0
______ 0
______ 4
1
1.00
0.80
B
C
male female male female
0
0
0 '
0
__ 1_ ____ 0 ___ 0 ____ 0
____ 0.
0 ____ 0
__ 0 ____ 0 ___ 0 ____ 0
____ 2
____ 0
2_ io ___ 2 ____ 4
4
4
0
1
~_ I
2_ x
2_ 5
2_ o
0.60
0.40
A+B+C
male
female
0
____ 1_
____ 1_
____ 0
____ 2
____ 8
6
0
______0
______0
______0
_____ 2
_____18
6
0.20
0.00
(A+B+C)
0.00
(A+B+C)
Affected
Populati
(A+B+C)
Total Population
on
Population (%)
Male
Female
male
__ 77
256
314
356
1212
1168
376
71
225
318
355
1104
1206
418
6~oo~
_________ 0.39
_________ 0.32
_________ 0.00
_________ 0.17
_________ 0.68
1.60
0.20
0.40
Affected
(A+B+C)
Population (7«)
female
0~00
__________ 0.00
__________ 0.00
_______ow
0.18
__________ 1.49
--1.44
0.60
Affected
Population D
0.80
1.00
Total
Population D
1.20
1.40
Affected
Male
1.60
Affect e
d
Female
(D)
(D)
Population Populat
ion (%)
(%)
male female male
female
0
0
__ 8
14
0.00
___ 0
58 ____ 43
0.00
0
0
85 ____ 67
0.00
70 ____ 88
___ 0 __0
0.00
233 ______ 0.00
217
2_ 0 ___ 0
___ 0 ___ 0
248 ______ 0.00
249
2
129
126
1.55
2
^2_ o
0.00
0.00
0.00
0.00
0.00
0.00
1.59
J. 80
Diseases of blood & blood forming organs & certain disorders- Chapter 3 ICD-10 ( International Classification of Diseases
Male
□ Pindimana
Female
□ Pindimana SEIoor
Eloor
61+years
i
36-60 years
20-35 years
13-19 years
5
■
6-12 years
■■I 1-5 years
0-12 months
45.00
40.00
35.00
30.00
25.00
20.00
10.00
15.00
(A+B+
Age Group
A
male
0-12 months
1 -5 years
6-12 years
13-19 years
20-35 years
36-60 years
61+ years
B
female
0
1
3
2
17
72
35 .
0
2
1
6
18
91
62
male
0
4
2
0
21
61
63
C
A+B+C
male
female
0
0
1
0
1
1
4
1
24
14
98 111
82
50
0
0
1
0
15
118
77
female
(A+B+C)
C)
Popul
)
)
ation Populat Populat
Femal ion (%) ion (%)
female
____ 0 _____ 0
__ 77
__ 71
0.00
0.00
_____ 3
256
225
1.95
1.33
_____ 3
314
318
1.91
____ 10
____ 57
356
355
1212
1104
1168
3761
1206
0.84
4,29
20.89
39.36
0.94
2.82
____ 5
____ 6
____ 3
___ 52
244
148
307
221
418
20.00
Affected Population
Effected Affected
D
Total Population D
Total
Population
Male
male
10.00
0.00
0.00
5.00
30.00
40.00
Affected
Male
Affecte
d
Female
(D)
(D)
Population Populat
male
female male
__ 0 _____ 0 ____ 8
__ 0 _____ 0 ___ 58
__ 0 _____1_ ___ 85
__ 1_ ____ 2 ___ 701
(%)
female
14
ion (%)
67
0.00.
0.00
0.00
88
1.43
43
0.00
0.0,0
1r49
2.27
5.16
3 _____ 3
217
233
1.38
1.29
25.46
18 ____32
249
248
7.23
12.90
129
126
25.58
23.81
52.87|
- 33
30
50.00
60.00
Endocrine, nutritional and metabolic diseases- Chapter 4 ICD-10 (International Classification of Diseases)
Male
Female
□ Pindimana BEIoor
□ Pindimana 0 Eloor
■ 61+years
EE
5 36-60 years
20-35 years
13-19 years
S
6-12 years
E
1-5 years
0-12 months
9.00
8.00
7.00
6.00
5.00
4.00
3.00
2.00
1.00
0.00
0.00
1.00
2.00
4.00
5.00
6.00
Total Population D
Affected
Male
Affected
Female
3.00
(A+B+
Age Group
A
male female
0-12 mont
0
0
1-5 years ___ 3
6-12 year; ~__ 5 ____ i_
13-19 yea
2_ ii_
20-35 yea __ 23 ____14
36-60 yea __ 32 ___ 28
7 '
61+ years
6
2_ o
_ £
B
male
female
0 ___ 0
0 ___ 0
1 ____ 3
2 ___ 1_
16 ____ 9
27 _ 1£
10
7
C
male
•
0
___ 2
_____ 5
______ 3
11
__ 31_
4
A+B+C
female
0
1
3
_5
11
28
7
C)
(A+B+C)
:fecte Affected Affected Population D
Popul
Total
+C)
)
ation - Population Pop Populat
male female Male
Female
ulati ion (%)
0
0
77
71 0.00
0.00
____ 5 ____ 1_
256 _______ 225 1.95
0.44
_ ___ 11 ____ 7
314 _______ 318 3.50
2.20
_____ 9 ___ 17
356 _______ 355 2.53
4.79
____ 50 ___ 34 1212
1104 4,13
3.08
74 1168
___ 90
1206 7,71
6.14
21
376
20
418 5.32
5.02
male
0
___ 0
____ 0
_ __ 3
____ 8
___ 13
5
female
male female
_0
8
0 ___ 58
__ 85
___ 70
7_ 217
_4 249
4
129
2
(D)
(D)
Populatio Populati
on (%)
n (%)
14
43
67
88
233
248
126
0.00
0.00
0.00
4,29
3.69
5.22
3.88
0.00
0.00
1.49
3.41
3.00
1.61
3.17
7.00
Mental and behavioural disorders- Chapter 5 ICD-10 (International Classification of Diseases)
Male
Female
□ Pindimana H Floor
□ Pindimana B Floor
61+ years
■
36-60 years
20-35 years
13-19 years
6-12 years
1-5 years
0-12 months
5.00
4.50
4.00
Age Group
0-12 months
1-5 years
6-12 years
13-19 years
20-35 years
36-60 years
61+ years
3.50
3.00
A
2.50
2.00
B
male
female
male
0
______ 0
______ 1_
______ 4
______ 7
_____ 26
12
0
______ 2
______ 0
______ 3
_____ 16
_____ 48
22
0
_____ 0
_____ 1_
_____0
_____ 1_
_____ 4
5
1.50
C
female
______ 0
______ 0
______ 0
______ 0
______ 6
10
6
male
female
0
0
_____0 _____ 0
a _____ 0i
___ _____ 0
_____ 4 ______ 1_
_____ 4 ______ 4
0
3
1.00
0.50
A+B+C
male
0.00
0.00
female
0 _____0
0 _____2
2
0
5 ____ 3
12 ___ 23
34 ___62
17
31
(A+B+C)
Total
Population Male
__ 77
256
314
356
1212
1168
376
(A+B+C)
1.00
Affected
2.00
Affected
Total
Populatio Populatio
Populatio
n (%)
n (%)
n Female
male
female
77
225
318
355
1104
1206
418
0.00
0.00
0.6-4
1.4g
0.99
2.91
4.52
0.00
0.89
0.00
0.85
2.08
5.14
7.42
3.00
Affected
Population D
4.00
5.00
Total Population D
6.00
7.00
Affected
Male
Affected
Female
(D)
(D)
Populatio Population
male
female male
female
n(%)
(%)
14
0
0
8
0.00
0.00
____ 0 _____ 1_ ____ 58
43
0.00 _______ 2.33
____ 0 _____ 0 ____ 85
67
0.00
0.00
88
____ 0 _____ 1_ ____ 70
0.00 _______ 1.14
217
____ 0 _____ 0
233
0.00
0.00
249
0.81
____ 2 _____ 2
248
0.80
2
6
129
126
4.76
1.55
8.00
Diseases of the nervous system- Chapter 6 ICD-10 (International Classification of Diseases)
Male
Female
Pindimana £3 Floor
i
Pindimana E3 Eloor i
I 61+ years
f
j
I 20-35 years
[■xwxx-x-x^x^^xx-x^-w-xx^w^xwx^w^
XX-X-XxX
I
J i
0.00
1.00
:xvX<-:-x-x-x<-x-x-x-xx-x-:-x-x->
v 6-12 years
l
0-12 months
6.00
5.00
4.00
A
male
B
male
female
0~
0
female
o’
_____ 0
_____ 2
6-12 years
____ Of _____ 2
_____ 0
13-19 years
_______ 4 '
20-35 years
______ 9 ‘
10|
male
0
______ 4 "
61 + years
1.00
C
1
1-5 years
36-60 years
2.00
0.00
2.00
(A+B+C
Age Group
0-12 months
3.00
____
_________ 4 '
______ 6
______ 7
_____ 19
_____ 4
___n
~__ n
_______ 11 ‘
11
13
9|-
_______ 16 ‘
A+B+C
female
Affected Population
Affected
(A+B+C)
Affected
Affected
Populat
Total
(A+B+C)
(A+B+C)
(D)
(D)
Population
Population
Populati
(%)
on (•/•)
ion -
Populatio Population
Male
n Female
1
1
77
77
_______ 1
7
_______ 1_
256
225
2.73
0.44
0
___ 1_
_2
_______ 0
2
______ 4
314
318
1 26
__3
_____2_
0.64
__ 1
11
_____ 11
356
355
_______ 3.09
3.10.
_6
_______ 6
26
1212
1104
2.15
2.17
13
_____ 19
1168
1206
2.91
4,48
3
3
34
19
_____ 24
_____ 54
23
376
418
5.05
5.50
(’/•) male
(’/•) female
1.30'
1.41
Total Population D Affected Male
D
1
female
6.00
5.00
)
_0
1
male
4.00
3.00
male
____ 1
____ 3
__ 5
2
male
female
0
0
............ Q
1
________ 2
____ JO
5
female
__ 8
Female
14
________ 0.00
0.00
58 ________ 43
________ 1.72
0.00
85 ________ 67
70 ________ 88
217 _______ 233
249 _______ 248_
129
126
________ 1.18
0.00
________ 1.43
1.14
________ 1.38
0.86
________ 2.01
4.03
1.55
3.97
Diseases of the eye & adnexa- Chapter 7 ICD-10
Male
Female
□ Pindimana S Floor
□ Pindimana ■Eloor
61+ years
36-60 years
I
20-35 years
13-19 years
6-12 years
1-5 years
0-12 months
14.00
12.00
Age Group
A
male
0-12 months
0
female
male
0 '
______ 0
0 ’
____ 0
____ 2 ______ y
____ 4_ ______ 5
36-60 years
61+ years
____ 6
__ 16
______ 7
11
21
____ 23
4.00
C
female
0
1 -5 years
20-35 years
6.00
B
6-12 years
13-19 years
8.00
10.00
(A+B+C)
Total
Population Male
female
male
0
0
0
0
0.00
0.00
A+B+C
female
male
2.00
0
77
(A+B+C)
Affected
Total
(A+B+C)
Population Population
Female
(%) male
71~
0.00
5.00
10.00
Affected
Affected
Population D
(A+B+C)
Population
(%) female
0.00~
20.00
15.00
Total Population D
Affected
Male
25.00
Affected Female
(D)
Population
female
male
0
______ 0
female
male
___ 8
(%)
(D) Population (%)
14 _______ 0.00
_______________ 0.00
______ 0
_____ 0
_______ 0
______ 0
0.00 _______ 0.00;
_ ___ 0
______ 0
58 ____ 43 _______ 0.00
_______________ 0.00
_____ 1_
_______ 1_
4
_______ 0 ________ 256
________ 4_ ________ 314
________ 225
___ < ______ 0
___ o _______ 1_
________ 318
1.27 _______ 1.26
____ 0
_______ 1^
851 ____ 67 _______ 0.00
_________________ 1.49
_____ 3
_______ 0
______7
________ 6 ________ 356
1.97 _______ 1.69
_____ 1_
_______ 1
70 _____ 88 _______ 1.43
_________________ 1.14
4 _______6
20 ~ _____ 31_
_____ 6
_____ 16
______ 15 _______ 1212
1.32 _______ 1.36
____ 1
_______ 2
217
233
0.46
________________ 0.86
___ 28
_______ 2
______ 45
________ 355
_______ 1104
_____64
______ 99 _______ 1168
_______ 1206
5,48
8.21
____ 7
_____ 13
249
248 _______ 2.81
_________________5.24
19
30
47
418
12.50
17.94
16
27
129
126
12.40
21.43
17 '
24
75
376
Diseases of the ear & mastoid process- Chapter 8- (International Code of Diseases)
Male
Female
□ Pindimana B Floor
□ Pindimana 0 Floor
61 + years
36-60 years
20-35 years
13-19 years
6-12 years
1-5 years
0-12 months
4.50
Age Group
0-12 months
1-5 years
6-12 years
13-19 years
20-35 years
36-60 years
61+ years
4.00
3.50
A
male female
0
1
____0 _____ 0
___ 2 __1^
1 _____ 4
___ 2 _____ 3
6 _____ 9
6
3
3.00
2.50
2.00
B
male
____ 0
_____ 1_
____ 3
____ 0
_____ 9
_____ 7
7
1.50
C
female
0
_____ 0
_____ 0
_____ 2
_____ 5
_____ 6
11
male
female
0
0
____ 0 _____ 1_
____ 3^ ____ 2
____ 1_ _____ 1_
____ 1_ ____ 3
____ 3 ____ 10
2
9
1.00
0.50
A+B+C
0.00
0.00
(A+B+C)
(A+B+C)
Affected
1.00
Affected
Total
Total
(A+B+C)
(A+B+C)
Population - Population Population Population
male
Male
female
Female
(%) male
(%) female
0
1 _________ 77
71
0.00
1.41
____ 1_ ______ 1_ ________ 256
225
0.44
0.39
____ 8 _____ 3 ________ 314 ______ 318
2.5510.94
____ 2 _____ 7 ________ 356
355
0.56
1.97
___ 12 ___
_______ 1212
1104
0.99
1.00
___ 16 ____ 25 _______ 1168
2.07
1206
1.37
12
26
376
418
3.19
6.22
2.00
Affected
Population D
4.00
5.00
Total Population
D
Affected
Male
3.00
6.00
7.00
Affected Female
(□)
male female male
female
14
0
0
__ 8
58 ___ 43
___ 0 ____ 0____
85 ____67
____1_ ____ 0____
70 ____ 88
___ 0 _____1_____
___ 1_ ____ 0____ 217
233
248
___ 3 _____ 4_____ 249
5
5
129
126
Populatio
n (%)
0.00
0.00
1.18
0.00
0.46
1.20
3.88
(D) Population (%)
0.00
______________ 0.00
______________ 0.00
______________ 1.14
______________ 0.00
______________ 1.61
3.97
Diseases of the circulatory system- Chapter 9 ICD-10 (International Classification of
Male
Female
□ Pindimana 0 Floor
□ Pindimana ■ Floor
61+ years
[3
13-19 years
E3
EZ2SZ3 6-12 years
1-5 years
0-12 months
14.00
12.00
Age Group
0-12 months
1 -5 years
6-12 years
13-19 years
20-35 years
36-60 years
61+ years
10.00
8.00
A
male
____ 0
____0,
____ 1_
____ 0
___ 3
__ 17
15
6.00
B
female
male
0
______ 0
______ Oj
______ 0
______ 0
_____ 11
12
0
____ 0
____ 2
_____ 1_
_____ 4
____ 17
22
4.00
C
female
0
_____ 0
_____ 1_
_____ 0
______ 1_
13
- 19l
male
female
0
0
_____ 0 ____ 0
_____ 0 ____ 0
_____ 0 ____ 0
_____ 0 ____ 2
____ 12 ___ 12
10
9
2.00
A+B+C
male
0
0
___ 3
____ 1_
____ 7
___ 46
46
0.00
0.00
2.00
4.00
Affected
Population D
(A+B+C)
(A+B+C)
Affected
Affected
Total
Population Male
Total
Population
Female
7~
(A+B+C)
Population
(%) male
(A+B+C)
Population
(%) female male
0.00~
0
______ 0.00 ___ 0.
______ 0.31 ___ 0.
______ 0,00
_0
______ 0.27 ___ 2
2.99 ___ 6
9.81
8
female
0
17
_____ 0 _______ 256
1 _______ 314
______ 0 _______ 356
_____ 3 ______ 1212
____ 36 _______ 1168
41
376
________225
________318
_______ 355
_______1104
_______ 1206
418
0.00
0.00
~L0-96
_______ 0.28
_______ 0.58
3.94
12.23
6.00
female
0
_____ 0
_____ 0
_____ 0
_____ 0
4
8
8.00
10.00
Total Population D
male
female
__ 8 _______ 14
58 ______ 43
85 _______ 67
70
■
881
217
233
249
248
129
126
12.00
Affecte
d Male
Affected
Female
(D)
Populat
ion (%)
(D)
Population
0.00
0.00
0.00
0.00
0.92
2.41
6.20
_______ 0.00
_______ 0.00
_______ 0.00
_______ 0.00
_______ 0.00
_______ 1.61
6.35
(%)
Diseases of the respiratory system- Chapter 10 (International Classification of Diseases)
Male
Female
□ Pindimana ■ Floor
□ Pindimana Q Floor
61 + years
36-60 years
f
5 20-35 years
S
• 13-19 years
J 6-12 years
0-12 months
30.00
25.00
Age Group
20.00
A
male
0-12 months
1-5 years
6-12 years
13-19 years
20-35 years
36-60 years
61+ years
15.00
0
8
17
22
48
44
26
B
female
2
_____ 5
_____ 16
____ 12:
____ 33
____ 83
29
C
male
female
3
_____ 25
_____ 16
5
______ 16
______ 14_
___ n
______ 18
_____ 46
_____ 75
27
69
_____ 78
38
10.00
male
female
____ 3
8
____ 17 ____ 23
____ 24 ____ 30
____ 40: _____29
____ 82
61
____ 78 ____ 85
28
35
5.00
0.00
A+B+C
male
6
_____ 50
_____ 57
_____ 73
199
200
92
0.00
(A+B+C) (A+B+C) Affected
5.00
Affected
Populati Populati Populati
(A+B+C)
on on
on (%)
Population
Male
Female
male
(%) female
female
71
15 _____ 77
7.79
21.13
44
256
225
19.56
19.53
_____ 60
314
18.87
318
18.15
-355
_____ 59
356
20.51
16.62
140
1212
1104
16.42
12.68
243
1168
17.12
20.15
1206
91
376
24.47
21.77
418
10.00
15.00
Affected Population
Total Population D
D
male
0
____ 14.
____ 11_
____ 10
____36
____33
22
25.00
20.00
Affecte
d Male
Affected
Female
(D)
(0)
Populat Population
ion (%)
female male
female
(%)__
14.29
2
__ 8 ______ 14
0.00
23.26
24.14
58 ______ 43.
______ 10
14.93
67
12.94
85
_____ 10
14,77
70 _______ 88
14.29
______ 13
16.59
11.16
_____ 26
217
233
13.71
_____ 34
249
248
13.25
12.70
16
129
126
17.05
Diseases of the digestive system- Chapter 11 ICD- 10(lnternational Classification of Diseases)
Male
Pindimana
Female
Floor
Pindimana B Floor
j 61+years
ZE
36-60 years
SB
20-35 years
13-19 years
J5
QBS
M2 years
J 1-5 years
| 0-12 months
12.00
10.00
8.00
Age Group
A
B
0-12 months
1-5 years
6-12 years
13-19 years
20-35 years
36-60 years
61+ years
male female male female
0 ~
0
0
0
____ 1_ _____ 3 ___ 1_ _____ J •
____ 8 _____ Z ____ 3 ____ ct;
____ 2 _____ 2
1 _____ 2 _
____ 8 _____ 1_ __ 22 _______ 6’
__ 16 ____ 13
28 ~__ 34
15 ~
‘
3
8
21
6.00
4.00
C
male
0
3
0
0
11
26
13
2.00
A+B+C
0.00
0.00
1.00
(A+B+C)
(A+B+C)
Affected
Affected
Total
Population Male
Total
Population
Female
71~
(A+B+C)
Population
(%) male
(A+B+C)
Population
(%) female
1.41~
female
male
female
1
______ 0
______ 2
______ 3
_____ 16
_____ 32
13
0
_____ 5
____ 11
_____ 3
____ 41
____ 70
42
1 _________ 77
_____ 4 ________256
4 ________ 314
_____ 7 ________ 356
____ 23 _______ 1212
_____ 79 _______1168
31
376
________ 225
________ 318
________ 355
_______ 1104
_______ 1206
418
0.00
_______ 1.95
_______ 3.50
_______ 0.84
_______ 3.38
_______ 5.99
11.17
_______ 1.78
_______1.26
_______1.97
______ 2.08
______ 6.55
7.42
2.00
3.00
Affected Population D
5.00
4.00
7.00
6.00
> Total Population D
Affected
Male
8.00
Affected Female
(D)
Population
male
female
0
_____ 1
_____ 4
_____ 1_
_____ 5
____ 10
5
0
_______ 2
_______ 2
_______ 1_
_______ 6
_______ 3
5
male
female
__ 8
58
85
70
217
249
129
(%)
(D) Population (%)
0.00:
14
0.00
4.65
43 _______ 1.72
67 ______ 4.71 _____________ Z99_
1.14
88 _______ 1.43
2.58
2.30
233
1.21
4,02
248
3.97
3.88
126
Diseases of the skin & subcutaneous tissue- Chapter 12 ICD-10 (International Classification of Diseases)
Male
Female
□ Pindimana HEIoor
□ Pindimana SEIoor
• 61+years
36-60 years
J 20-35 years
13-19 years
6-12 years
1j5 years
0-12 months
10.00
9.00
8.00
Age Group
0-12 months
1-5 years
6-12 years
13-19 years
20-35 years
36-60 years
61+ years
7. CO
6.00
5.00
6|
3.00
2.00
1.00
0.00
0.00
1.00
2.00
3.00
4.00
(A+B+C
A
male
_____1_
13
___ 17
11
33
28
4.00
B
female
_______2
3
-- 10
8
______ 16
_____ 35
7
male
0
______ 5
______ 5
______ 9
_____ 10
_____31_
14
C
female
_______ 0
_______ 5
_______ 7
_______ 3
______25
______35
12
male
_____ 1_
_____ 5
_____ 5
_____ 6
15
____ 25
8
A+B+C
female
0
_______2
_______ 4
_______ 5
______ 11
______ 27
9
(A+B+C)
)
Affected
Affected
Total
Populat (A+B+C)
(A+B+C)
Population ion
Population Population
male
Male
female
Female
(%) male (%) female
2
2 _________77
7?
2.60
2.82
_____ 23 _____ 10 ________ 256
225
8.98
4.44
_____ 27 _____ 21
314
318
8.60
6.60
_____ 26 ____ 1£ ________ 356
355
7,30
4,51
_____ 58 _____ 52 _______ 1212
1104
4,79
4.71
84 _____ 97 _______ 1168
1206
7,19
8.04
_____ 28'
28
376
418
7.45
6.70
5.00
6.00
Affected
Population D
male
7.00
8.00
9.00
Total Population Affecte
D
d Male
female male
female
0
0
14
__ 8
' 3| ____ 1______ 58 _____ 43
______ 1_ ____ 1______ 85 _____ 67
_____ 1^
__ 5_____
70 _____ 88
_____ 7 ___ 12_____ 217
233
6 ___ 11 _____ 249
248
5
11
129
126
10.00
Affected
Female
(D)
(D)
Populat Population
ion (%)
(%)__
0.00
5.17
1.18
1.43
3.23
2.41
3.88
0.00
2.33
1,49
5.68
5.15
4,44
8.73
Diseases of the musculoskeletal system & connective tissue- Chapter 13 ICD 10 (International Classification of Diseases)
Female
Male
□ Pindimana B Floor
□ Pindimana 0 Floor
j 61+years
1
E
J 36-60 years
J
'•.gi
j 20-35 years
13-19 years
2I2Z2ZZZZ
6-12 years
____ '
I
1
I•
years
0-12 months
45.00
40.00
35.00
30.00
25.00
20.00
15.00
10.00
5.00
0.00
0.00
5.00
10.00
(A+B+C
Age Group
A
B
C
A+B+C
(A+B+C) Affected Affected
)
Popula Populati Populati
tion on
on (%)
Male
Female
male
Populati
on (%)
female
15.00
Affected
Population D
male
female
male
male
female
_____ 2
______ 0
_____ 3
__ 1_
_____ 3 _____ 0
____ 8
______ 1_
77
71
10.39
1.41
1 -5 years
_____ 7
______ 6
_____ 2
__ 6
_____ 3
___ ij
___ 12
_____ 13
256
225
4.69
5.78
6-12 years
____ 12
______ 5
_____ 3
__ 6
_____ 6_ _____ 6
___ 21
_____ 17|
314 -
318
6.69
5.35
13-19 years
____ 13
_____ 22
_____ 2
__ 8
_____ 6 _____ 9
211
39
356 -
355
5.90
10.99
20-35 years
___ 55
53
____42
39
____ 52
67
149
159
1212
1104
12.29
14.40
21
9
44
36-60 years
126
162
____ 90
145
139
199
355
506
1168
1206
30.39
41,96
71
|61 + years
52
54
52
69
50
74
154
197
376
418
40.96
47.13
54
male
female
30.00
35.00
Total Population D
40.00
Affected
Male
45.00
Affected
Female
(D)
Population (D) Population
0-12 months
female
25.00
20.00
male
2
15
female male
(%)
female
(%)
2
8
14
25.00
14.29
10
8
17
26
27
26
58
43
25.86
23.26
85
67
24.71
11.94
70
88
12.86
19.32
217
233
20.28
11.16
249
248
28.51
10.89
129
126
41.86
20.63
50.00
Diseases of the genitourinary system- Chapter 14 ICD 10 (International Classification of Diseases)
Male
1
Female
Pindimsna □ Eloor'
Pindimana £3 Eloor.
i
61+ years
36-60 years
___ __
_ ___ _ ____ __ _______ ~
20-35 years
ES
I
13-19 years
4
6-12 years
I
1-5 years
I
0-12 months
8.00
6.00
7.00
3.00
5.00
1.00
2.00
I
0.00
0.00
1.00
4.00
3.00
2.00
6.00
5.00
7.00
A
male
1-5 years
0
5-12 years
13-19 years
LL
20-35 years
24
20
4
36-60 years
61 + years
female
0
0-12 months
C
B
1
1
2
26
25
4
A+B+C
(A+B+C)
(A+B+C)
Affected
Affected
Total
Total
(A+B+C)
(A+B+C)
Population -
Population
Populatio
Population
Male
Female
n (%) male
(•/•) female
1
0 ___ 0[ ____ 0
1 _____ H ____ 3 ____ 0
0
1
77
71
0.00
1.41
4
2
4
3
6
70
62
15
12
67
96
22
356
225
318
355
_______ 3.38
1212
1104
1168
1206
1.56
1.27
1.69
5.78
5.31
0.89
___ I
256
314
376
418
3.99
5.26
male
1
2
24
19
-5
female
*4
female
male
_____ 2
____ 3 _____ 8
20; ___ 22 ;___ 21_
42j
23
29
___
6
9
female
male
Population D
_______ 7.96
Total Population D Affected Male
Female
(D)
female
male
0
0
_______ 0.94
_______ 6.07
9.00
Affected
Affected
Age Group
8.00
3
8
0
1
u
3
12
I a
female
male
(D) Population
Population
(%)
(%)
8
14
0.00
58
85
43
67
0.00
1.18
4.29
3.69
6,83
6.98
70
88
217
249
129
233
248
126
0.00
2.33
0.00
3.41
5.15
5.24
7.14
Pregnancy, childbirth and the puerperium- Chapter 15 ICD 10 (International Classification of Diseases)
Male
Female
□ Pindimana QEIoor
□ Pindimana BEIoor
61+ years
36-60 years
20-35 years
13-19 years
6-12 years
1 -5 years
0-12 months
1.00
0.90
0.80
Age Group
0.70
0.60
A
0.50
0.40
B
0.30
C
6-12 years
female male female male female
___ 0 _____ 0 ___ 0 ____ 0 ___ 0
0
____0 _____ 0 ___ 0
0
0
0
___ 0 _____ 0 ___ 0
_0
0
0
1 -5 years
0.10
male
0.00
0.00
(A+B+C)
A+B+C
male
0-12 months
0.20
female
____ 0 _____ 0
(A+B+C)
0.05
0.10
Affected
Affected
Total
Populati,
(A+B+C)
Population on
Population
Male
Female
(%) male
Populatio
__ 77
__ 7]_________ 0.00
n (%)
female
0.00
0
_____ 0
256
225
_______ 0.00
0.00
0
_____ 0
314
318
.
0.00
0.00
13-19 years
___ 0 _____ 0 ___ 0
0
0
£ ____ 0 _____ 0
356
355'"
0.00
0.00
20-35 years
___ 0 _____2
___ 0
2
_0
1
____ 0
_____ 5
1212
1104
0.45
36-60 years
___ 0 ____ 0
0
Q
£
0.00
_1_
____ 0
1
1168
1206
0.00
0.08
0
0
0
0
0
0
376
418
0.00
0.00
61+ years
0
0
0.15
0.20
0.25
Affected
Population D
male
0
0
0
0
0
0
0
0.30
0.35
Total Population D
0.40
0.45
Affected
Male
0.50
Affected
Female
(D)
(D)
Population Populati
on (%)
(%)
female male
female
0
0
0
0
0
0
0
__ 8 _______ 14
0.00
58 _______ 43
0.00
0.00
85 _______ 67
0.00!
0.00
0.00
70 ________88
0.00
0.00
217
233
0.00
0.00
249
248
0.00
0.00
129
126
0.00
o.oo|
Congenital malformations,deformations & chromosomal abnormalities- Chapter 17(lnternational Classification of Diseases)
Female
Male
Pindimana
Pindimana ■Eloor
Eloor
61+ years
36-60 years
I
20-35 years
1 13-19 years
6-12 years
1-5 years
0-12 months
0.90
0.80
0.70
Age Group
0.60
0.40
0.50
A
0.30
B
0.20
C
(A+B+C) :
A+B+C
female
male
female
0-12 months
_____ 0
______ 0
____ 0
0
__ 0 _____ 0
____ 0 _____ 0
1-5 years
_____ 0
______ 0_
___ 0
0
2 _____0
___ 2 _____ 0
6-12 years
_____ 0
______ 0
____ 0
2
0
1
____ 0 _____ 2
13-19 years
2
______ 0
__ 0
1
_1_
1
____ 3 _____ 2
20-35 years
1
______ 3
____ 3
1
2_
£ ____ 6 _____ 6
36-60 years
5_
2
3
J
3
9 _____ 6
61+ years
0
0
0
0
0
0
0
female
(A+B+C)
Total
Total
Population Population
- Male
Female
female
male
male
0.00
0.00
0.10
male
. 0
77
256
314
356
1212
1168
376
0.10
Affected
0.20
0.30
Affected
(A+B+C)
(A+B+C)
Population Population
(%) male (%) female
71
0.00
0.00
225
0.78
0.00
318
0.00
0.63
355
0.84
0.56
1104
0.50
0.54
1206
0.77
0.50
418
0.00
0.00
Affected
Population D
male
0
0
0
0
0
0
0
0.60
0.50
0.40
0.70
Total Population D
0.80
0.90
Affected
Affected Female
Male
(D)
Populatio
(D) Population
n (%)
(%)
female male
female
0
0
0
0
8 _____ 14
0.00
0.00
58 _____ 431
0.00
0.00
85 _____ 67
0.00
0.00
70
88
0.00
0.00
217
233
0.00
0.43
249
248
0.00
0.81
129
126
0.00
0.00
1
2
0
Symptoms,signs & abnormal clinical and lab. Findings.,- Chapter 18 (International Code of Diseases)
Female
Male
□ Pindimana B Floor
□ Pindimana 0 Floor
61+ years
E
E
36-60 years
] 20-35 years
I
J 13-19 years
L
E
6-12 years
1.
1-5 years
0-12 months
60.00
50.00
Age Group
40.00
30.00
A
20.00
10.00
B
0.00
(A+B+C)
A+B+C
C
5.00
0.00
male
female
male
female
male
female
male
female
0-12 months
___ 4
______ 10
______ 3
______ 6
_____ 4
_______ 8
____11
____ 24
1-5 years
___ 29
_______ 301
_____ 18
_____ 19
____20
______27
67
76
6-12 years
___ 41
______ 42
_____24
_____ 39
___ 40
______44
105
125
13-19 years
___ 40
______ 52
22
37
48
44
110
133
20-35 years
119
135
106
103
141
139
366
377
36-60 years
110
145
____ 91_
111
129 j
147
330
403
61+ years
22
30
27
39
19
32
68
101
10.00
15.00
(A+B+C) Affected Affected
Total
Total
(A+B+C)
)
Populatio Populatio Populat Population
n - Male n Female ion (%) (%) female
77
256
314
356
1212
1168
376
20.00
25.00
Affected Population
D
30.00
35.00
40.00
45.00
Affected
Total Population D Affected Male Female
(D)
Population
male
71
14,29
33.80
225
26,17
33,78
-318
"355
33,44
39,31
30.90
37,46
1104
30.20
34,15
1206
28,25
33,42
4
24
39
22
61
75
418
18.09
24.16
41
female male
female
6
18
31
8 ______ 14
58 ______ 43
85 ______ 67 j
70
88
2171
233
249
248
129
126
39
81
97
37
50.00
(%)
50.00
(D)
Populati
on (%)
42.86
41,38
41,86
45.88
46,27
31.43
44,32
28.11
34,76
30.12
39,11
31.78
29.37
Injury, poisoning & certain other consequences of external causes- Chapter 19 ICD 10 (International Classification of nibses)
Male
Female
□ Pindimana QEIoor
□ Pindimana HEIoor
3 61+ years
3 36-60 years
3 20-35 years
■ 13-19 years
E
J 6-12 years
1 -5 years
0-12 months
3.50
3.00
Age Grout:
2.50
2.00
A
male
1.50
1.00
B
female
male
0.50
C
female
male
female
0.00
0.00
0.50
A+B+C
(A+B+C) (A+B+C)
Affected
1.00
Affected
Populati
Total
Populatio Populati
on Populatio
on (%)
n (%)
Male
n Female
male
female
male
female
0-12 mon' ____ 0
0
0
______ 0
0
0
_____ 0
______ 0
77
71
0.00
0.00
1-5 years
0
0
0; ______ 0
1
_____ 1_
______ 1_
256
225
0.39
0.44
6-12 year
1
1
2
4
0
2
_3
_____ 7
______ 5
318
2.23
1.57
13-19 yea
3
0
1
_2
_0
_____ 5
______ 4
314
356' 1..
355
1.40
1.13
20-35 yea
7
_4
13
1
8
5
___ 28
______ 10
1104
2.31
0.91
36-60 yea
16
J2
1212
_9
4
7
____ 38
_____ 23
1168
1206
3.25
1.91
61+ years
4
4
2
4
3
7
3761
418
1.86
2.63
1
Hl
1.50
2.00
Affected
Population D
male
1
0
1
2
2
0
0
0
0
2
1
3
3.00
Total Population Affected
D
Male
Affected
Female
(D)
Populati
on (%)
(D)
Population
__ 8 ______ 14
0.00
0.00
58 ______43
0.00
0.00
85 ______67
1.18
0.00
female male
0
0
2.50
female
(%)
70 ______ 88
0.00
0.00
217
233
0.46
0.86
249
248
0.80
0.40
129
126
1.55
2.381
External causes of morbidity & mortality- Chapter 20 (International Classification of Diseases)
Male
Female
□ Pindimana QEIoor
□ Pindimana HEIoor
61+ years
E
J 36-60 years
I
J 20-35 years
LZZZ3 13-19 years
6-12 years
1-5 years
0-12 months
4.00
3.50
3.00
Age Group
2.50
2.00
A
male
1.50
B
female
0-12 months
____ 0 ____ o|
1-5 years
___ 0
6-12 years
___ 1_ _____ 1
oi
e
1.00
C
female
_____0 _____0
male
0.50
0.00
A+B+C
female
__ 0 _____ 0
male
0.00
0.20
(A+B+C)
Affected
Affected
Total
Total
Population - Population
Male
Female
Populatio
(A+B+C)
Population
(%) female
(A+B+C)
female
____ 0 _____ 0 _________ 77
71
0.00 _______0.00
225
0.00 ______ 0.00
318
0.32I _______ 0.63
13-19 years
___ 1_ _____ 1_
_____0 _____ 0i ___ 0; _____0; ____ 0 _____ 0 ________ 256
____ 0 _____ 1_ ___ 0_ ____ 0 _____ 1_ _____ 2j ________ 314
____ 0 _____ 0 ___ 0 ____ 0 ____ 1_ ______ 1_ ________ 356
20-35 years
____ 2 _____ 2
____ 2 ____ 3
36-60 years
61+ years
0.60
0.80
Affected
Population D
male
0
0
(D)
Population
(%)
(%)
0.00
85 _______ 67
1.18
0.00
70 _______ 88
0.00
0.00
217
233
0.92
0.43
249
248
T20
0.40
129
126
0.78
0.79
0.28 _______ 0.28
___ 13
_____ 15
1168
1206
1.11
1.24
3
1
1
13
5
376
418
3.46
1.20
1
1
1
(D)
Population
0.00
0.33 _______ 0.45
1
Affected
Female
58 _______ 43
355
4
Affected
Male
0.00
1104
2
Total Population D
female
______ 5 _______ 1212
8
1.40
__ 8 _______ 14
___ 4
3 _____ 4 ___ 1_ ____ 3
1.20
0
0
0
0
___ 0 ____ 0
8
1.00
female male
1
0
2
__ 9
2
n (%)
male
0.40
0.00
Factors influencing health status & contact with health services- Chapter 21 (International Code of Diseases)
Female
Male
□ Pindimana B Floor
□ Pindimana S Floor
61+ years
QB
36-60 years
20-35 years
13-19 years
6-12 years
1-5 years
0-12 months
1.40
1.00
1.20
Age Group
0.60
0.80
A
0.40
B
A+B+C
C
0.00
0.00
0.20
0.02
0.04
0.06
(A+B+C)
(A+B+C)
Affected
Affected
Total
Population
Female
(A+B+C)
Population
(%) male
(A+B+C)
Population
(%) female
female
male
female
Total
Population Male
0-12 months
____ 0 _____ 0
1
0 ___ 0 _____ 0
____ 1_ _____ 0
77
__________ 71
_______ 1.30 _______ 0.00
1-5 years
____0 _____ 0]
0
0 ___ 0 _____ 0
____ 0 _____ 0
256
________ 225
_______ 0.00 _______ 0.00
6-12 years
___ Oj ___ oj
0
0 ___ 0 _____ 0
____ 0 _____ 0
314
________ 318
0.00 _______0.00
13-19 years
____ 1_ _____ 0
0_
£ ___ 0 _____0^ _____1_ _____ 0
356
________ 355
0.28 _______0.00
20-35 years
___ 0 _____ 0
0_
Q_ ___ 0 _____ 2!
1212
_______ 1104
________0.00 _______ 0.18
_______ 1206i _______ 0.00 _______ 0.08I
male
female
male
female
male
____ 0 _____ 2
36-60 years
0
1
0
0
0
0
O'
1
1168
61+ years
0
0
0
0
0
0
0
0
37.6
4181
0.00
0.00
0.08
Affected
Population D
male
female
0
0
0
0
0
0
0
0
0
0
0
0
0
0
0.16
0.14
0.12
0.10
Total Population
D
female
male
0.18
0.20
Affected
Male
Affected
Female
(D)
Population
(D)
Population
(%)
(%)
8 _____ 14
0.00
0.00
58 ______ 43
0.00
0.00
85 ______ 67
0.00
0.00
70
88
0.00
0.00
217
233
0.00
0.00
249
248
M0 ______ 0.00
129
126
0.00
0.00
Blood disease Mortality- Eloor/Pindimana 1994-2003
1
0.8
0.6
-^-Deaths due to Blood
disease
Deaths due to Blood
disease
0.4
0.2 -
0
x
x
x
x
U
k
U
Year of Scrutiny
U
2.5
Sudden Breathlessness Mortality - Eloor/Pindimana 19942003
2
Deaths due to
Sudden
breathlessness
at Floor
~
“•“Deaths due to
Sudden
breathlessness
at Pindimana
1
0.5
0
4
$
T?
Year of Scrutiny
Cancer Mortality- Eloor/Pindimana 1994-2003
12 n
10
8
6
Deaths
4
due to
Cancer
2
0
Year of Scrutiny
Asthma Mortality - Eloor/ Pindimana 1994-2003
4.5
4
3.5
3
2.5
2
1
o 0.5
0
c
o
(5
♦
'
1994 1995 1996 1997 1998 1999 2000 2001 2002 2003
Year of Scrutiny
—___
Deaths due
to Asthma
at Eloor
eaths due
to Asthma
at
Pindimana
Cardiac Arrest Mortality - Eloor/Pindimana 1994-2003
3.5 i
3
2.5
-♦-Deaths due to
Cardiac Arrest at
Floor
••-Deaths due to
Cardiac Arrest at
Pindimana
2
1.5
1
0.5
0
oP?1 Ov3 o!°
6^ O\^ cP
qQP qQT
Year of Scrutiny
•
cflz ry>
Heart Disease Mortality - Eloor/Pindimana 1994-2003
12
10 -
8
6 -
“’S’™Deaths due to
Heart Disease:
at Eloor
4 n
Deaths due to
Heart Disease
at Pindimana
2
i
o
*
Cx^
$
ojo
5^
9
o?>
\J
Year of Scrutiny
Kidney Failure Mortality - Eloor/Pindimana 1994-2003
2.5
2
1.5
-♦-deaths due to
Kidney Failure at
Eloor
•♦•Deaths due to
Kidney Failure at
Pindimana
1
0.5
0
$
i
0^
iM
ft—
o!b
$
‘1?
Year of Scrutiny
$
Paralysis Mortality - Eloor/Pindimana 1994-2003
4.5 -
4 j
3.5 Deaths due to
Paralysis at Eloor
2.5
2 -
-•-Deaths due to
Paralysis at
Pindimana
1 H
0.5 .
0 K
do cf?1
d^
&
P t t nP nP
Year of Scrutiny
Tuberculosis Mortality - Eloor/Pindimana 1994-2003
2.5
2
Deaths due to
Tuberculosis at
Eloor
♦ Deaths due to
Tuberculosis at
Pindimana
i
1
0.5
0
W— >
&
Year of Scrutiny
$
'r
I '
i •
I
I
w
^1^1 '
APPENDIX 7: LIST OF RESOURCES FOR COMMUNITY AND RESEARCH GROUPS
(Community Health Assessment Guidebooks)
India:
Title: The Manual of Lay Epidemiology
Contact: The Community Health Cell
Address: # 367, Srinivasa Nilaya,
Jakkasandra 1th Main????
Koramangla Block 1
Bangalore-560034
Tel:+91-80-5525372/5531518
Website: www.sochara.org, www.phmindia.org
Description: The Community Health Cell is a group of Organised Health Professionals based in Bangalore, India
dedicated to the cause of “Health for All” and the paradigm shift from ‘disease-treatment’ to ‘health
preservation’. Their Library is a fabulous collection of rare manuscripts from around the world, most of them
original works.
Canada
Title: Community Sustainability Auditing Resource Kit
Contact: University of Victoria
Address: PO Box 1700 STN CSC,
Victoria, BC V8W 2Y2
Canada
Tel: 250-721-7211
Web site: http://web.uvic.ca/~csap/frbc/reskit/menu.html
Description: An online resource for sustainable community auditing. This kit is mainly intended for communities
with a threatened resource-based economy and has useful information about the development and use of
sustainability auditing protocols.
Title: Environment and Sustainable Development Indicators (ESDI)
Initiative
Contact: National Roundtable on Environment and the Economy
Address: National Round Table on the Environment and the Economy
344 Slater Street, Suite 200
Ottawa, Ontario K1R 7Y3
Canada
Tel: 613-992-7189
E-mail: admin@nrtee-trnee.ca
Web site: http://www.nrteetrnee.
ca/eng/programs/Current_Programs/SDIndicators/Approach_to_Indi
cators/SDIndicators_Approach_e.htm
Description: A three-year project aimed at developing and testing indicators. Workshops are available for training
in indicator selection and data gathering.
Title: Pilot Project to Develop a Community Health Measure for Small and
Rural Communities
Contact: The Canadian Federation of Agriculture and Federation of Canadian
Municipalities
Address: Federation of Canadian Municipalities
24 Clarence Street
Ottawa, Ontario KIN 5P3
Canada
Tel: 613-241-5221
E-mail: federation@fcm.ca
Web site: http://www.fcm.ca/english/national/ruralhealth-e.pdf
Description: This web site provides a description of a 1999 pilot project in three small Canadian communities.
The report presents suggestions to be used as tools for small and rural communities to undertake future
community discussion and action.
Title: Signs of Progress, Signs of Caution
Contact: Ontario Healthy Communities Coalition
Address: 1202-415 Yonge Street
1
I
5i’.
i.
t
[if
K.
Toronto, Ontario M5B 2E7
1-800-766-3418
Web site: http://www.opc.on.ca/ohcc/publications/signs/signspdf.htm
Description: The goal of this guidebook is to help the user(s) make “communities healthier and more sustainable”.
A number of steps necessary for developing health and sustainability indicators are described and worksheets to
accompany each step are provided. A useful listing of potential indicators of health and sustainability is also
included.
Title: Sustainable Community Indicators Program - User’s Manual
Contact: CMHC and Environment Canada
Address: scip-pidd@ec.gc.ca
Web site: http://www.ec.gc.ca/scip-pidd/English/indicators.cfm
Description: Detailed manual and guide to conceptualizing sustainability, identifying target markets, choosing a
framework and developing and evaluating indicators. The manual accompanies the Sustainable Community
Indicators Program database. A copy of the database and manual can be downloaded from the address listed
above.
Title: Sustainable Community Resource Package
Contact: Ontario Roundtable on Environment and Economy
Address: The Ontario Roundtable was disbanded in 1995, but the resource can found at the web site listed below.
Web site: http://www.law.ntu.edu.tw/sustain/intro/ortee/
Description: A resource package on sustainable communities featuring case studies of community sustainability
initiatives in Ontario. This package also provides a step-by-step guide to profiling a community including
methods for looking at community activities in terms of four quadrants: environmental,
economic, social and health. The package also outlines action plans and evaluation processes for healthy
community development as well as literature about models of sustainable community living.
United States
Title: Check Your Success. A Guide to Developing Indicators for
Community Based Environmental Projects.
Contact: Department of Urban Affairs and Planning, Virginia Tech, US. EPA
Address: Dr. JoAnne Carmin
Department of Urban Affairs and Planning
105 Architecture Annex, MC 0113
Virginia Polytechnic Institute and State University
Blacksburg, VA 24061
USA
Tel: 540-231-5426
Web site: http://www.uap.vt.edu/checkyoursuccess
Description: Although the primary focus of this guide is environmental, the authors adopt a broad vision of
environment (social, economic, environmental, social and organizational). The first part of the manual provides
information on the benefits of developing and measuring indicators and then leads into a number of case studies.
One of the most useful sections of this book is the “Indicator Workshop” which is presented in the appendices.
This section is easy to follow and contains a number of useful worksheets and exercises.
Title: Community Based Environmental Protection: A Resource Book for
Protecting Ecosystems and Communities.
Contact: US EPA
Address: Community Based Environmental Protection
1200 Pennsylvania Avenue, NW
Mail Code 1807T
Washington, DC 20460
USA
Tel: 202-566-2182
Web site: http://www.epa.gov/ecocommunity/tools/resourcebook.htm
Description: This resource book includes sections on how and why to select and use community indicators. It also
includes discussion of how the ecosystem is integrally linked to the economy and to the quality of life and social
aspects of each community. The guide is available in PDF format on the US Environmental Protection Agency
web site.
Title: The Community Health Indicators Handbook
Contact: Redefining Progress
Address: One Kearny Street
69
»■
IL
I
J
ri
I
Fourth Floor
San Francisco, CA 94108
USA
Tel: 415-481-1191
Toll Free: 1-800-896-2100
Web site: www.rprogress.org
.
Description: A detailed handbook for creating measures of community health, wellbeing and sustainability
progress toward community sustainability. The handbook contains extensive information on community
indicators including a step-by-step guide to developing an indicator project, a glossary, case studies, resources
and a national directory of indicator projects.
Title: Community Outcomes Toolkit
Web site: http://ag.arizona.edu/fci7fs/nowg/prodev_newlinks.html
Description: This toolkit is part of the University of Arizona’s web site for Evaluating National Outcomes. It
contains a step-by-step plan for identifying and evaluating community building indicators. The web site provides
examples of indicators and lists tools and resources available to help communities set goals and develop, measure
and evaluate community indicators.
Title: The Community Toolbox
Contact: ToolBox@ukans.edu
Web site: http://ctb.lsi.ukans.edu/tools/EN/tools_toc.htm
Description: This web site was created by the University of Kansas Work Group on Health Promotion and
Community Development in Lawrence, Kansas. The core of the Tool Box is the “how-to tools.” The how-to
sections use simple language to explain how to do the different tasks necessary for community health and
development. There are sections on developing indicators, leadership, strategic planning, community assessment,
advocacy, grant writing and evaluation. Each section includes a description of the task, advantages of doing it,
step-by-step guidelines, examples, checklists of points to review and training materials.
Title: Community Visioning and Strategic Planning Handbook
Web site: The handbook is available at
www.scs.unt.edu/classes/CSAG/5790/001/CmtyVisioning/com_visioning_
handbookl.htm
.
.
Description: The University of North Texas has posted this community visioning and strategic planning handbook
on its student web site. The handbook was developed through a grant from the Ford Foundation and the Carnegie
Corporation of New York and produced by the Alliance for National Renewal and the National Civic League. It
presents steps toward developing a “community vision’ and includes sections on selecting and evaluating key
performance areas.
Title: Green Communities Assistance Kit
Contact: r3green@epa.gov
Web site: http://www.epa.gOv/greenkit/indicator.htm#select
Description: The US Environmental Protection agency has a Green Communities
Project Web site that details how to select, use, evaluate and report on community indicators..
68
Title: Guide to Sustainable Community Indicators
Contact: Maureen Hart
Address: Sustainable Measures
P.O. Box 361
North Andover, MA 01845
USA
Tel: 978-975-1988
Web site: http://www.sustainablemeasures.com/
Description: This comprehensive guide covers all the steps necessary for developing indicators. It begins with a
description of the issues associated with sustainability, and then leads the reader through the necessary steps foi
organizing and measuring sustainability indicators. The appendices contain helpful information such as. a listing
of community indicators used by other projects, resources and examples of other community indicator
projects.
Title: Measuring Community Success and Sustainability: An Interactive
Workbook
Contact: Northern Central Regional Center for Rural Development
Address: Iowa State University
108 Curtiss Hall
70
Jr"
ho
!
Ames, IA 50011-1050
USA
Tel: 515-294-8321
Web site: http://www.ncrcrd.iastate.edu
Description: This guide was developed to help communities learn how to measure the effects of rural
development and conservation efforts. The focus of the guide is on five key outcomes that were developed by
rural communities. The outcomes range from “increase in knowledge, skills and ability of local people” to
“appropriately diverse and healthy economics”. The guide begins with a general introduction to measuring
indicators and then outlines a measurement plan and year-end assessment for each of the five outcomes stated.
Title: Monitoring Community Sustainability
Contact: Izaak Walton League
Address: 707 Conservation Lane
Gaithersburg, MD 20878
USA
Tel: (301) 548-0150
Toll-Free: (800) IKE-LINE (453-5463)
E-Mail: general@iwla.org or sustain@iwla.org
Web site: http://www.iwla.org/sep/pubs/monitor.html
Description: This 23-page workshop guide, published in 1998, provides directions for identifying and measuring
indicators that reflect a community's progress toward goals that promote sustainability.
Title: Neighborhood Sustainability Indicators Guidebook
Contact: Crossroads Resource Center
Address: P.O. Box 7423
Minneapolis, Minnesota 55407
USA
J
I
Tel: 612-869-8664
kmeter@crcworks.org
Web site: http://www.crcworks.org/guide.pdf
Description: This guidebook was produced for the Urban Ecology Coalition of Minneapolis. It is aimed at
building “strong, self-determined, sustainable communities.” The guidebook defines “neighborhood sustainability
indicators” and provides a guide to developing and refining indicators.
Title: Outcomes Toolkit: The Results Oriented System for Community
Improvement
Contact: Michael Bilton, Director, ACT National Outcomes Network
Address: The Healthcare Forum Foundation
180 Montgomery St. Suite 1520
San Francisco, CA 94104
USA
p
I
I,
Tel: 415-248-8411
Fax:415-248-0411
E-mail: mbilton@healthforum.com
Web site: www.act-toolkit.com
Description: Web-based application for developing and tracking community indicators. On this web site,
stakeholders can develop a community profile, receive technical assistance in developing indicators and share
information.
Title: Sustainability Starts in your Community
Contact: earthday@earthday.net.
Address: Earthday Washington, D.C., USA
1616 P Street NW, Suite 200
Washington, D.C. 20036 USA
Tel: 202-518-0044
Fax:202-518-8794
Earthday Seattle, USA
811 First Avenue, Suite 466
Seattle, WA 98104 USA
Tel: 206-876-2000
Fax:206-876-2015
Web site: http://www.earthday.net/pdf/goals/Sustainability_Guide.pdf
71
|!1
V"
bi’
+ '‘'v
s
i"
4
Sl[
w
14
ip
Hil-
I'
Description: This community indicator guide was produced in April 2002 by Redefining Progress and Earth Day
Network. It is a step-by-step guide to developing and reviewing community indicators. The guide also provides
suggestions for ways to involve the larger community in indicator projects.
Title: Sustainable Community Indicators: a Review of National Methods
and Suggestions
Contact: Long Island University, Institute for Sustainable Development
Web site: www.luinet.edu/sustain/si.html
Description: Review and comparison of ten leading indicator projects, definitions of sustainability and indicators
and discussion of how to start an indicator project. Online tools are also available toward developing and
maintaining community indicator projects.
Title: The Sustainable Development Toolkit
Contact: John Lambie, Director, Florida House, Institute for Sustainable
Developmentjl@i4sd.org
Address: Florida House Institute for Sustainable Development, Inc.
4600 Beneva Road
Sarasota, Florida 34233
USA
Tel: 941-927-2020
Web site: http://www.i4sd.org/toolkit.htm
Description: A toolkit of process and design tools to support citizen-based sustainable community development
planning processes. One of the sections in the toolkit is aimed at helping citizens and other stakeholders develop
sustainable community indicators.
Europe
Title: Cities Environment Reports On the Internet (CEROI)
Contact: CEROI Secretariat
Address: UNEP/GRID-Arendal
Longum Park
Service Box 706
N-4808 Arendal
Norway
Fax: +47 37 03 50 50
E-mail :ceroi@grida.no
Web site: http://www.ceroi.net/ind/index.htm
Description: This project follows up on Chapter 40 of Agenda 21. CEROI provides a template and software
including an Encyclopedia of Indicators for member cities wishing to create and use indicator data on the Internet.
71
Title: Communities Count: The LITMUS Test
Contact: New Economics Foundation
Address: Cinnamon House
6-8 Cole Street
London SEI 4YH
UK
Tel: 020-7407 7447
Web site: http://www.neweconomics.org/uploadstore/pubs
Description: This useful guidebook describes the necessary steps to develop and monitor indicators. It also
describes the approach taken and lessons learned from the LITMUS project (local indicators to monitor urban
sustainability). The guide is user friendly and easy to follow.
Title: The Dashboard of Sustainability
Contact: Consultative Group on Sustainable Development Indicators (CGSDI)
Address: CGSDI Secretariat
International Institute for Sustainable Development
161 Portage Avenue East, 6th Floor
Winnipeg, Manitoba R3B 0Y4
Canada
Tel:+1-204-958-7700
E-mail: phardi@iisd.ca
Web site: http://www.iisd.org/cgsdi/intro_dashboard.htm
72
■
■ ‘
i
J
i
Ir '
'1
Description: The Dashboard of Sustainability is an online tool designed to be understood by experts, the media,
policy-makers and the general public. Using the metaphor of a vehicle's instrument panel, it displays
countryspecific assessments of economic, environmental, social and institutional performance toward (or away
from) sustainability.
Title: Local Quality of Life Counts
Contact: Mark Jeffcote, Sustainable Development Advisor
Address: Department of the Environment, Transport and the Regions
Free Literature
POBox 236
Wetherby LS23 7NB
UK
Tel: 0870 1226 236
Web site: http://www.defra.gov.uk/environment/sustainable/index.htm
Or http://www. I a21 -uk.org.uk
Description: A handbook offering a guide for measuring sustainable development and quality of life in local
communities. It presents a menu of 29 indicators, guidance for preparing community strategies and developing
indicators, suggested methodologies for collecting data, a checklist of issues to stimulate discussion and a list of
eight “best value” performance indicators.
72
Title: Local Sustainability: Campaign Interactive.
Contact: European Commission
Mr. Anthony Payne
Campaign Co-ordinator & Head of Office
E-mail: campaign.anthony@skynet.be
Address: European Sustainable Cities & Towns Campaign
Rue de Treves/Trierstraat 49-51
box 3
B- 1040
Brussels
Phone: +32 2 230 53 51
E-mail: campaign.office@skynet.be
Web site: http://www.sustainable-cities.org/subl2a.html
Description: The European good practices Information Service and Best Practices Database. Contains examples
of good practices and policy documents on sustainability and the urban environment.
Title: Towards a Local Sustainability Profile
Contact: Ambiente Italia
Address: Instituto di Ricerche (responsabile del coordinamento scientifco)
all’attenzione di Claudia Semenza
Via Poerio 39
20129 Milano, Italy
Tel: 0039 02 277441
E-mail: ecip@ambienteitalia.it.
Web site: http://www.sustainable-cities.org/indicators/index2.htm
Description: The European Common Indicators is a monitoring initiative focused on sustainability at the local
level. The project is ongoing and accepting new participants. Support services are provided to participating
authorities during the testing phase: technical support (scientific expertise, helpdesk, workshops, etc.),
methodological development, pilot activities on the Ecological Footprint, good practice collection and exchange,
dissemination activities, and evaluation, reporting, recommendations and guidelines.
Title: Urban Indicators Toolkit
Contact: United Nations Center for Human Settlements (Habitat)
Address: Global Urban Observatory and Statistics
Urban Secretariat, UNCHS (Habitat)
PO Box 30030
Nairobi
Kenya
Tel: 254-2-623119
Fax: 254-2-623050
E-mail: guo@unchs.org
73
Web site: www.urbanobservatory.org/indicators>
Description: UNCHS offers a toolkit and guide for cities participating in the implementation of the Habitat
Agenda. The guide includes detailed indicator methodology sheets and examples of toolkit spreadsheets for
reporting.
Title: WHO Healthy Cities Project
Contact: WHO Center for Urban Health
WHO Regional Office for Europe, Healthy Cities Project
Address: 8 Scherfigsvej
DK-2100 Copenhagen
Denmark
Tel: 45 39 17 12 24
Web site: http://www.who.dk/healthy-cities/hcp.htm
Description: Worksheets for 32 urban health indicators are presented in this booklet. The indicators listed have
been developed from the data collected from the European Healthy Cities project. The worksheets provide
definitions, methods of calculation, unit of measurement and a number of other descriptors.
APPENDIX 8: THE ABRIDGED ETHNOGRAPHIC INTERVIEWS AT ELOOR.
A8.1 TESTIMONIES OF SENIOR CITIZENS:
(the addresses of the respondents have been altered in the interest of their safety and confidentiality)
Name: SP Sadananda Pillai
Age: 75
Address: Floor
He is a resident of the locality for the past 75 years. An employee of Ogale Glass Factory, he retired
from there.
$
■
W.
Pollution in Floor is a serious problem. Water is a major cause for concern here. None of the ground
wells have any amount of water and they all are forced to depend on the water authority. This
distribution is far from regular.
He still remembers the time before all the companies came. There were a number of houses here in this
area. On an average, each coconut tree yielded 40 coconuts then. This was also a major source of the
local people’s livelihood. Nowadays they hardly can get good coconuts and they are far from sufficient
even for a single family. Then again a lot of medicinal plants seen then are hardly to be seen nowadays.
The pollution in the area has made him Asthmatic. There a lot of people like him here. The people living
here have a lot of allergic complaints; some of them have skin allergies while others have various scalp
infections etc.
A8.2 Name: EM Sundareshan
Address: The Cooperative Bank, Floor
!
1®
L
1
As told by the person himself. He has always been here. Going down memory lane he remembers the
existence of just two factories way back then. They were FACT and TCC. There was a small rubber
plantation near these factories. He still remembers bathing in the periyar when he was very small. Just
25 years ago this became impossible because of irritation that it caused to the skin and eyes.
He strongly feels that it was with the coming of Merchem Factory that people began complaining of
breathing difficulties and chest pain, and other respiratory illnesses. For years the mercury that flows out
of TCC has killed almost all fish in the river. But the mercury does not go away. It is entering all the
bodies of people living in and around the river who come in contact with the water here.
A8.3 Name: VS Sultan
74
fi.jteh
Address: Eloor south
Age: 70 years
!;T
II
He has been living here all his life. The China nets and toddy shops have been his chief source of
income and livelihood. That was sufficient to look after his family well. Then he got a job in the Indian
Aluminium Company and worked there for 32 years. Looking back on yester years he feels people
never ever went to English doctors. The medicinal plants were all that was required to heal then of their
little ailments. Whereas his coconut trees yielded 700 coconuts then today he can hardly get 100
coconuts. His brother had serious Asthma problems, which he feels is largely due to the pollution in the
area. Both his brother and his son died due to severe asthma attacks. Even the domestic animals that
flourished in these parts no more can be seen living healthily here if at all they manage to survive.
A8.4 Name: All Raj
Address: Manamthuruthu
Age: 75 years.
■A,
.■!
Bir
J-1.
He has been in the fishing business for the past 60 years. During his early days he still remembers the
bounty offish that had always his pocket full of money. But all that has changed now. For the past two
years he has been unable to go out fishing due to his Asthma. Before the coming in of companies, there
was no shortage of water and the ground well was sufficient for every household. Domestic animals
have also slowly vanished. If s been nearly 20 years that the company wastes have caused serious
damage to the fauna here. In a river that had innumerable china nets to catch fish, now you hardly see
them; the river itself has become murky.
A8.5 Name: Jacob VM
Address: Eloor
Age: 53 years
j
If
For the past 70 years he has been a resident of Eloor. His father was an employee of a nearby mill. He
has 10 children of which three are no more. Fishing had always been the family’s chief livelihood. He
still remembers that before the companies came, each day’s catch came to up to 750 kgs of fish. None of
the kind of illnesses was even known to them then.
When the companies started dumping their wastes into the river (which he feels was when he was 15
years old or so) all the fish began mysteriously dying. Apart from fishing, they also had a lot of
domestic animals. But today none of them can be seen in this part of Kerala. Whereas in his youth they
used to get around 40 healthy bunches full of coconuts per tree, today they hardly manage two nuts per
tree.
When the factories came, a lot of people started coming in with their families. But he feels the locals per
se hardly found any employment in these factories. The river could boast of various kinds of prawns and
shrimp but sadly none of the catches today manage even one of its kind. Equally distressing is this water
shortage in the area. He does know that all these are direct outcomes of the pollution of the river and
surrounding areas.
A8.6 Name: Prema
Address: Eloor South.
'‘ \
As told
by ‘herself. ’Itt was in 1961 that her parents returned to their ancestral home in Eloor from
Bombay. She was a student of class 1 then. The only factory in the area was FACT. She had no health
problems whatsoever when she came here. It was their father’s death that had brought them to Eloor
where they had an own house and some property to call their own. When she was in class 8 there was a
chlorine leak from the TCC factory. Recollecting memories of that day, she says she remembers running
to school and falling faint in the school corridors. The school authorities admitted her in JNM hospital
and she regained consciousness three days later. Her health woes have started ever since then. She gets
-.
75
w
breathing difficulty and bouts of unconsciousness whenever the fumes are very strong. Chronic Cough
has been with her ever since then. She spends around 400 rupees every month on barely keeping away
from the major bouts of breathlessness and cough. None of the doctors have conclusively told her that
her health will see a fine day. Her husband too suffers from breathlessness.
Talking of her surroundings, she still can remember the number of domestic animals that were seen in
and around Eloor in those days. She does not believe that the local community has benefited from all the
factories. A few that got jobs carried on in their jobs and hence traditional livelihoods have totally been
wiped out. The factories and the pollution have also led to a serious water shortage. The ground well in
their house no longer can be used for the quality of water it has. But she cannot use the water supplied
by the authorities for its chlorine content. So she manages with the well water available.
II '
I'
Factories have led to varied problems not the mention the spate of health complaints it has caused to the
people living here. She wonders how she can inch forward her difficult life.
A9 TESTIMONIES OF PARENTS ABOUT AFFECTED CHILDREN:
(the names and addresses of the respondents have been altered in the interest of their safety and
confidentiality)
A9.1 Name of Child: Bidhan
Age: 2 years
Address: Eloor
Father’s name: Ananthapadmanabhan
Mothers name: Kavitha
As Told by the father. It was in 1965 that the family settled down in Eloor. The wife’s maternal home is
in the district of Alleppey. They had a baby boy by tubular pregnancy the delivery of which was by
caesarean section. The baby, Bidhan was diagnosed as 40% mentally retarded. Two years old now, he
still has difficulty in walking. There are occasional attacks of fits in between. Doctors in Amrita
Hospital, Cochin are treating the baby. He has speech difficulties as well. The medicines being
administered are Norma Brain and Digital?.5mg.
Others in the family do complain of severe headaches and bouts of breathing difficulty. They have
already spent around 2 lakhs on the child’s treatment. Though Physiotherapy was also advised they have
discontinued the same due to its high costs.
The child’s aunty ,Sarasamma has been in Eloor for the past six months. She is pregnant now and ever
since she has been here she has acute headaches and breathing problems. Previously a resident of
Cherthallai locality, Sarasamma admits that she has never ever had such health complaints. Living in the
vicinity of the Leather factory and inhaling the ammonia fumes has led to a major deterioration of their
health, they family avers.
II
I
I1
A9.2. NAME OF baby: Gopal
Age: 7 months
Address: Aluppuram
I
n
>
■
As told by the baby’s mother, Vinuta.
Marriage brought her to Eloor three years ago from her home in trivendrum. Pollution in Eloor has
caused a whole lot of problems in her health. Consuming the water in this locality has led to
discoloration of her teeth during her pregnancy, her sugar levels shot up which had to be checked with
Insulin shots. The baby was delivered by Caesarean section and weighed 3.250kgs at birth. Since the
time of her birth, the baby has had respiratory problems. Chronic Cough is one of the many that keep
surfacing. An unusual skin problem seems to be troubling the baby as well. A normal bath gives rise to
redness and rashes all over the body of the baby that has then to be treated. (Each treatment costs 500076
6000 Rupees.) unable to afford this they are now consulting a homeopath in Cherthallai regularly. She
feels that the poisonous fumes are more during the monsoon. The fumes are almost always coupled with
a stinking smell. When she goes to her maternal home in Trivandrum, she does not have any of the
health complaints that she has here. The present house they are staying is slightly better than their
previous residence in the staff quarters. It was the unbearable pollution that compelled the shift to their
present place of residence. But they sadly have realized that nowhere around Eloor can be really safe
from pollution.
1
I
II ■
■I
-
w
A9.3 Name of the child: Tito
Age: 2 1/2 years
Address: Eloor South
As told by the mother, Aditi. She is from Chirayil. Marriage brought her to Eloor four years back. Her
husband works in Saudi Arabia. She was also in Saudi Arabia for a while. That was where the baby was
conceived and delivered. Medical history during pregnancy was uneventful. The baby weighed 2.800
kgs at birth. All the regular vaccinations were administered on time. When the baby was a year old, they
returned to Eloor. Ever since there has been a spate of health problems. They stay hardly 200 meters
away from the Merchem factory and HIE factory yards. The baby has had chronic cough and phlegm
since his stay here. Every time antibiotics have been administered. If the fumes are unbearable, there is
also a bate of cough. Doctor visits have now become a regular routine affair for this family. Not to
mention the drain of money associated with every visit. They can hardly bare to bathe the baby for fear
of it falling ill. A couple of times they have had to rush him to the hospital at night. Febrile temperatures
are many a time over the 100 mark. Smitha also says that none of these bother them when they are away
form this place. Before marriage she has never had serious health problems. Ever since she has been
here, she has had frequent bouts of headaches. Whenever the fumes are let out from the adjoining
companies she gets acute feelings of Nausea as well.
A9.4 Name of infant: Sanjiv
Age: 1 1/2 years
Address: Eloor North
As told by the mother, Nina. It’s been ten years since she came here from her maternal home in
Pookattupadiyil. Her husband is an Autorickshaw driver. She feels it’s at night that the fumes are
unbearable. This does cause a fair amount of breathing difficulty as well. It also causes strange rashes in
the baby’s body with a lot of redness and itching. At nights this is fairly severe too. It has been traced to
the water available in the area. They have totally stopped using the ground water available in their well
making them fully dependant on the public distribution system. The baby had been very normal at birth
and they had given him all the normal vaccination. A fever triggered off a seizure and required hospital
stay and treatment for a month. The temperature has gone up to around 104 degrees during these fever
bouts.
The fumes cause a lot of discomfort for everyone in the family. Cough and breathing difficulty are very
common. She finds none of these complaints in her home in Pookattupadiyil. The baby is being
administered Valium 2.5 mg every time for the seizures. During monsoons the rainwater that clogs and
wells up creates rashes in their legs.
A9.5 Name of the children: Divya, (5) Ashesh (3)
Address: Manjummil
Name: Kavitha Gubra
Kavitha says they have been in Eloor for the past one year. Before this they were in Palarivattom,
Cochin. Divya was born in the Lissy hospital, Cochin and weighed 3.100 kgs at birth and the younger
one Sneha, was born in the Medical Center, Cochin. She weighed 3.250 at the time of birth. They have
both been given all the stipulated vaccination shots. They have had a lot of health complaints ever since
77
ft,
I
fl
they have been in Floor. The elder daughter has had a lot of respiratory troubles along with headaches
They frequently have been falling ill because of which a fair amount of money goes into medical
treatment alone There have been times when they have had to shell out 150 rupees per day. They had
always been healthy in Palarivattom. Their illnesses seem to be more during the
'the^
are more fumes and then the whole family suffers from headaches and nausea. The brief stay of a year m
this vicinity has caused so much of health related discomfort to the children as well as everyone in
i
I. ■
B
family.
A9.6 Name of Child : Sameera
Age: 3 years
Address: Manjummel.
They have been residents of this locality for many generations. Adarshan, the child’s father has been
married for three years now. The baby was delivered in MAJ hospital and weighed 2.900 kgs.
mother had taken proper care and followed all doctoral advice during her pregnancy. However the baby
has severe cough, fever and breathing difficulty. They have been incurrmg huge costs over the child
treatment alone. Over 10,000 rupees were spent in the Medical Center, Cochin alone.
It is during the dusk that obnoxious fumes and the strong smells fill the place. In fact the family feels
ta over the pS four or five years this has increased manifold. They have swnohed over from
Allopathy to homeopathy treatment for the child. The main reason for the witch was the monetary one.
In spite of this they end up spending over 200 rupees each visit.
tl
I
r
A9.7 Name of the infant: Ramapati
Address: Manjummel
Thet^has^eeXTng hLtXtethTTOs^Shailendra Panikkar was working in FACT in the Product
Sue Department as Supervisor. He retired in 1989 and has had a lot of health Prob
sever joint pain and a nagging back problem. His younger daughter, Jayasn stays with him. She has
daughter by name, Reshma. She is three years old. The child has already had three heart scenes done
on her There was a problem of insufficient blood circulation from the heart to the lungs This was the
reason for the first operation. Then the second surgery was to correct a hole in her heart. After these two
a
ii"
IF
medical interventions she had a severe digestion problem that necessitated a third surgery.
The baby weighs 9.5 kgs while she weighed 2.450 kgs at the time of her birth. For her age she should
weigh 12 250kgs, the doctors say. The mother, Jayasri has sever headaches and congestion related
heafth problems. The grandmother has a skin disease for the past 25 years and has severe ear pain too^
She has had an operation done on her ear, but that has hardly helped. The whole family seems to be
suffering form various health problems.
w
I
A9.8.Name: Ameer
Age: 2 .5 years.
Address: Kuttikattukara
The mother Thankamma says the following. She is a resident of Perumabavoor near Alwaye. She
came here when she got married. Her husband has always suffered from breathing problems since his
childhood Their second child was hardly six months old when the first bout of respiratory trouble
surfaced. The baby was normal at birth, weighed 3 kgs and was given all the vaccmabons on time He is
constantly under medical treatment under Dr. Varma’s care for a long time now. He ha been in the
hospital for fairly long periods. Each visit incurred around 2000 rupees in costs alone. The child gets
fever bouts whe/temperatures shoot over 102 degrees. Sometimes the fever persists beyond the normal
time. The child has shown symptoms of asphyxia too. The mother and the child have none of these
St
78
I
F.r
1
problems when they are in her home in Perambavoor. The grandmother has something interesting to
say. She used a lot of medicinal plants abundantly available in her courtyard during her children s
childhood. All these plants are no longer to be found in the area now.
A9.8 Name of child: Keerthi
Age: 2.5 years.
Address: Manjummel
■
I
I
As told by the mother, Namrata. She has been here since her marriage. Her in-laws, husband, and two
children comprise her family. Anakha was born in KMK hospital in Alwaye. She weighed 3.800 kgs at
the time of birth. The air pollution in this area is primarily the reason for the kind of cough and fever it
causes in children like Keerthi. There is a fair amount of breathing difficulty as well. Of late, she has
been suffering from severe cough too. The elder son, Antony is comparatively healthier but they have
had times when his health costs alone cost them 5000 rupees. She also finds that none of these illnesses
raise their heads in her maternal home in Pookattupally. Everybody in the family suffers from some
amount of breathing and respiratory troubles.
?,;l
A9.9 Name of children: Mathew(3) Sarah(l)
Address: Pathalam
Astoldby the mother, Julie
f
Both her children keep getting bouts of fever. They are always under treatment of Dr. Somasundaram o
JNM hospital. They require medical treatment thrice every month. Each visit demands 300 rupees each.
The parents live in a one-room home and both of them too suffer from headaches and breathing
difficulty. They have been in Eloor for six
Years now. Before when they were in Coimbatore none of them had any health problems. They are
aware that it is the nearby factories and their fumes that are playing havoc with theii health.
A9.10 Name of the children: Bidhana.(9); Sanjiva(6); Ramapati(3)
I
III' ■
f'I'll'i
If
WP
■
As per the mother, Kavitha. They have been residents of eloor for the past 45 years. They have all had
varied health problems varying from headaches to cough, breathing difficultyjoint pains and cramping
of the legs. The eldest daughter, Bidhana has been suffering form Easnophilia for the past five months.
She also&gets headaches and cold very often. She had a heart valve complication when she was three
years old. Now she does not have that. Now 9 years old, she has a gland growing under her ears near the
neck. The second daughter, Sanjiva complains of leg pains and cramps very often. The youngest one
suffers from cold and fever very often that requires hospitalization too. The oldest member in the family
, Sicily has rashes in her leg and Kavitha herself has severe headache and other discomforts as well.
A9.ll Name of twins: Archana and Kiran
Age: 15 years
Address:Eloor North.
e
Aditi the mother gives this account. She is a native of the neighboring Cheranalloor. Ever since her
marriage 16 years ago she has been living in Eloor. Her husband is a daily wages laborer and they find it
verv difficult to meet their daily ends with the work he gets. They live in a three-room house provided
by the Panchayat. They have twins, Archana and Kiran both of whom are paralyzed down the hips.
Their delivery was before the eighth month. They have gone to the school upto the third standard.
Archana likes to write and read but they could no longer afford their studies. In the evenings the fumes
from the factories fill the whole surrounding region. They often lead to skin irritations and breathing
difficulty. They incur an expenditure of 1400 rupees every month on medicines alone. The children have
been shown to an Aired doctor in Coimbatore. The charges there have come to 30,000 rupees. The
daughter is slightly better than the son. They believe that their disability should be overcome by good
medical treatment.
79
- Media
 8065.pdf
Position: 1908 (10 views)