Health Care Budgets in a Changing Political Economy
Item
- Title
- Health Care Budgets in a Changing Political Economy
- Creator
- Ravi Duggal
- Date
- 1998
- extracted text
-
I
' f. .i
.■
Health Care Budgets hi a Changing Political
V
1
Ravi Duggal
A meaningful analysis of recent health budgets can only be made in the context of the direct and indirect
encouragement given by the state to the growth of the private sector in health services. First, the slowing down
of state investment in the hospital sector and the subsidies, soft loans and duty and tax exemptions offered; second,
the creation of a market for modern health care through the setting up of PHCs and cottage hospitals in the
rural areas; and third, the consistent expansion in highly qualified medical personnel who could not be absorbed
in the state sector.
WHILE the 1980s saw the beginning of a
process for economic change towards greater
' liberalisation and privatisation of the Indian
economy, the 1990s have accelerated the
pace of change under the umbrella of
structural adjustment. This has also meant
increase in borrowings with the debt burden
burgeoning and making interest pay ments
rapidly increasing proponion of the state
^^judget. This state of the economy has its
bearing on slate spending, and social sectors
are the first to get the axe. The little hope
which remained of a welfare state evolving
in India is now fading away.
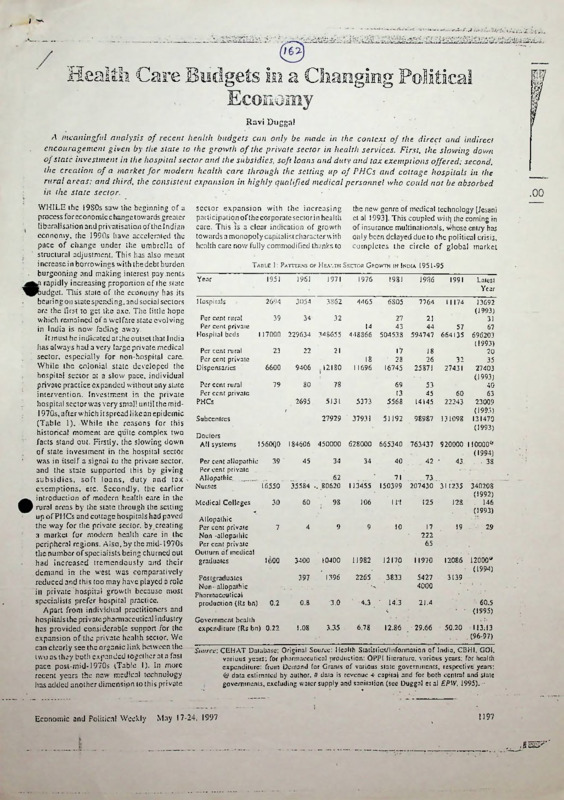
It must be indicated at the outset that India
has always had a very large private medical
sector, especially for non-hospital care.
While the colonial state developed the
hospital sector at a slow pace, individual
private practice expanded without any slate
intervention. Investment in the private
hospital sector was very small until the mid1970s, after which it spread likcan epidemic
(Table 1). While the reasons for this
historical moment are quite complex two
facts stand out. Firstly, the slowing down
of state investment in the hospital sector
was in itself a signal to the private sector,
and the state supported this by giving
subsidies, soft loans, duty and tax '
exemptions, etc. Secondly, the earlier
introduction of modern health care in the
rural areas by the state through the setting
up of PHCs and cottage hospitals had paved
the way for the private sector, by creating
a market for modern health care in the
peripheral regions. Also, by the mid-1970s
the number of specialists being churned out
had increased tremendously and their
demand in the west was comparatively
reduced and this too may have played a role
in private hospital growth because most
specialists prefer hospital practice.
Apart from individual practitioners and
hospitals the private pharmaceutical industry
has provided considerable support for the
expansion of the private health sector. We
can clearly see the organic link between the
(wo as they both expanded together at a fast
pace post-mid-1970s (Table 1). In more
recent years the new medical technology
has added another dimension to this private
Economic and Political Weekly
sector expansion with the increasing
participation of the corporate sector in health
care. This is a clear indication of growth
towards a monopoly capitalist character with
health care now fully commodified thanks to
the new genre of medical technology [Jesani
cl al 1993]. This coupled wilt) the coming in
of insurance multinationals, v)hose entry has
only been delayed due to the political crisis,
completes the circle of global market
Table I: Patterns of Health Sector Growth in India 1951-95
Year
1951
796?
1971
1976
1981
1986
1991
Latest
Year
Hospitals
2694
3054
3862
4465
6805
7764
11174
39
34
32
14
448866
27
43
504538
21
44
57
594747 664135
18
11696
17
28
16745
18
26
25871
32
27431
5373
69
13
5568
53
45
14145
60
22243
27929 ' 37931
51192
98987
131098
13692
(1993)
31
67
696203
(1993)
20
35
27403
(1993)
40
63
23009
(1993)
131470
(1993)
Per cent rural
Per cent private
Hospital beds
Per cent rural
Per cent private
Dispensaries
Per cent rural
Per cent private
PHCs
117000 229634 348655
23
22 '
9406
.12180
79
80
78
2695
5131
Subcentres
Doctors
All systems
I560Q0 184606 450000 628000 665340 763437 920000 110000*
Per cent allopathic
39
Per cent private .
Allopathic...........
Nurses
16550
Medical Colleges
21
6600
34
34
40
62
35534 .. 80620
113455
71
150399
45
42 '
43.
. ..73...
207430 311235
(1994)
. 38
340208
(1992)
. 146
(1993)
30
60
98
106
111
125
128
7
4
9
9
10
17
222
65
19 . ■
1600
3400
10400
11982
11170
11970
12086 12000y
(1994)
397
1396
2265
3833
5427
4000
3139
0.2
0.8
■3.0
4.3
14.3
21.4
Government health
expenditure (Rs bn) 0.22
1.08
3.35
6.78
12.86
29.66
Allopathic
Per cent private
Non -allopathic
Per cent private
Outturn of medical
graduates
Postgraduates
Non- allopathic
Pharmaceutical
production (Rs bn)
‘
29
60.5
(1995)
50.20
I13;I3
.(96-97)
Source: CEHAT Database; Original Source: Health Statistics/Information of India, CBH1, GOI.
various years; for pharmaceutical production: OPPI literature, various years: for health
expenditure: from Demand for Grants of various state governments, respective years;
& data estimated by author, it data is revenue + capital and for both central and state
governments, excluding water supply and sanitation (see Duggal et al EPW, 1995).
May 17-24. 1997
1197
.00
I
I
|
•
consolidation of the health sector in India. • social levellers and help blunt inequities in . advocating and supporting programmes it
Illis is like Alisha Chinai’s ‘Made in India’
society continue to be neglected.This despite considers to have national importance, and
which had busied all popularity charts and
the promise of the current government of with control over a major chunk of tax
supposedly given Indians a pride in the ‘Made
assuring basic minimum services by 2000 revenues it can twist arms of the states to
in India' label but most arc not aware that
AD, which include 100 per cent coverage accept its policies and programmes.)
this album was produced and recorded in
for safe drinking water in rural and urban
When the central government presents its
London, UK! This is what globalisation of areas, 100 per cent coverage of primary budget there is a lol ofeuphoria and expectation
India is in reality - the label will become
health care services in rural and urban areas, - reliefs in taxes, excise and customs duties,
Indian but the surplus will be appropriated
univcrsalisation of primary education, etc.
defence spending, interest burden, subsidies.
by the new genre of imperialists.
among other basic needs [GO1 1997]. It The middle classes and business look
Apart from private sector expansion and
must be noted here that all thcbasic minimum
forward to the budget eagerly but (he same
corporatisation, another strong and
needs being talked about arc state subjects enthusiasm is not shown in the ease of state
undesirable character of the health sector and the allocation of the centre is a very and local-government budgets/expenditure
in India is its neglect of rural areas where small proportion. Hence even real increases which affect their lives more closely. In fact
in allocations by the centre (often linked to
there is a complete lack of concern for the
still over 70 per cent of the population
new schemes) may have a negligible impact, social sector allocations. Even the media
resides. Today there arc over 1 1 lakh
unless the state governments take some ignores this and highlights only special
registered medical practitioners of various
systems in the country of which 60 per cent
radical measures on their own. (This is not schemes or concessions which the finance
minister announces in his budget speech like
arc located in cities. In case of modern
to say that the centre has no influence; in
system (allopathy) practitioners as much
fact with a small proportion of funding the the ‘cheap’ hospitalisation policy for the low
as 75 per cent arc located in cities and
centre dictates policies in terms of income groups announced in the 1996-97
especially metropolitan areas. For irstancc,
Table 2: An Overview of Central and State Health BuDGErs 1989-97
of all allopathic medical practitioners
(In rupees billion)
registered with the state medical council in
Maharashtra 55 percent arc in Mumbai city
1988-89 1989-90'1990-91 1991-92 1992-93 1993-94 1994-95 1995-96 1996-97
Category
alone which has only 12 per cent of the
RE
RE
state’s population. The main reason, thus,
1
Total
central
for the underdevelopment of health care in
17.22 21.48 22.95
26.08 28.72
health budget 10.12 10.28
12.73
13 82
rural areas is this vast rural-urban gap in
2 GOl’sown
the provision of and location of health care
12.77
3.78 4.47
4.92
5.56
6.33
7.43
9.47
14.71
expenditure
resources. With rural areas being 3 Disbursement
underserved two things have happened - a
to states and
large number of unqualified people have set
6.34 5.81
13.48
10.89
14.05
13.31
14.01
UTs(!-2)
7181
8.26
up medical practice and the rural population 4 Health expendi
85.38 94.42
ture of states # 34.77 39.60 45.86 50.83 56.62 66.69 74.28
exerts pressure on facilities in the cities and
5. Per cent central
towns thus affecting the efficiency and
capacity of the latter. In spite of planned . component in
state budget #
development over the last 45 years the state
21.1
19.2
18.1
15.6
14.8
18.2
14.7
17.0
16.2
(3/5x100)
‘
has failed in narrowing the rural-urban gap,
Notes: # The state government expenditures are only from 25 states (excluding UTs) and exclude and in fact at the behest of imperialist
capital expenditures, hence the actual.percentage of central component should be less by
influence it has promoted strategies for rural
about 0.5 to 2 .
health care which cause more harm than
good for the health of the people. Under Source: 1 Expenditure Budget 1996-91, Vol I, GOI, July 1996, 2 and 4 Report on Currency and
Finance, RBI, various years.
the umbrella of community health the state
has given rural areas third rate health care
. Table 3: Selected Public Health Expenditure Ratios. All India, 1981-95
through its PHCs and that too only
1980-81 1985-86 1991-92 1992-93 1993-94 1994-95 1995-96 1996-97
preventive (immunisations) and promotive Year
RE
BE
(family planning) care; curative care which
is the main demand of the people has been
Health expenditure as
ignored in terms of investment and . per cent to total govern
allocations and hence people in rural areas
2.71
2.71
2.63
3.29 ■ 3.29
ment expenditure
3.29
3.29
3.11
are left to the mercy of the exploitative
Expenditure on medical
care as per cent to total
private health sector which more often than
NA
NA
43.30
37.82 26.78 2,7.66 27.46 25.75
health expenditure
not in rural areas comprises unqualified
Expenditure on disease
providers. I: is important to see the health
programme as per cent
budgets in the above context for making a
NA
10.41
9.51
NA
10.84
12.96
11.69
10.59
to total health
meaningful analysis...................................... •
Capital expenditure as
While there is a lot of talk about the latest
per cent to total health
budget (1997-98) being remarkable, it has
4.27
3.66
4.00
4.47
7.78
7.54
4.03
8.45
expenditure
not really diverted from the path it has been
Total health expenditure
78.67
97.93
108.60
.
62.0?
71.83
traversing now foranumberof years. While
52.01
27.15
11.89
(Rs bn) - Revenue
Including capital
the salaried class and the bourgeoisie may
29.66 56.39 64.64 75.18 S2.17 101.65 113.13
expenditure
12.86
- have a lot to cheer in terms of saving taxes
and having L-rgcr disposable incomes, there Source: CEHAT Database; Original Source: up to 1985-86, Combined Finance and Revenue
is nothing in the budget to bring cheer to
Accounts, Comptroller and Auditor General of India, respective years, other years.
the toiling masses. Social sector in
Demand for Grants, respective stales, various years. The percentage for capital expenditure
terventions like health care, education,
is based on revenue + capital total whereas for others it is as a per cent of revenue
expenditure. NA = not available, RE = revised estimate.
housing, etc. which are regarded as important
I
1198
' Economic and Political Weekly
May 17-24, 1997
budget or the opening up of health insurance
a the private sector in this year’s budget.
It is important to note that the central
icallh budget in itself has a very limited
scope. It includes expenditures on central
pvcrnmcnt-owned hospitals, dispensaries,
ie CGHS (health insurance for central
pvernment employees and their families),
zedieal research (support for ICMR and
died institutions) and medical education
central government colleges). Apart from
tis the budget also includes the centre’s
attributions and grants to various health
jogramm.es of national importance like
attrol and eradication of communicable
Sscases like malaria, tuberculosis, leprosy,
UDS, as well as support for the family
tanning programme (almost entirely
rntrally funded) immunisation, blindness
sttrol. etc. The larger part of health care
vdgets come from state and union territory
pvcrnmcnls’ own resources or from their
bare of revenues disbursed by the centre,
h an average during the last decade the
contribution (grants and plan fund
of special programmes) has been
»ut 17 per cent to the overall state health
edgets. Table 2 gives an overview of
idgets for the last one decade.
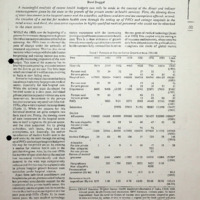
It is evident from Tables 2-6 that state
jvernments arc clearly the dominant
xnders on various health care programmes,
bwever. given the lamentable state of
lairs of public health scrviccs/institutions
id their inability to meet demands of
lizens, it is also clear that allocations to
c health sector are both inadequate and
tfficicnt. Further, it is also evident that
ere is a declining trend in public health
ipenditurcs and when this is viewed in the
atext of the introductory remarks above
becomes apparent why the private health
rtor has such a strong hold of the health
re market.
Year
1985-86 .
1991-92
1992-93
I993-94(RE)
1994-95 (BE)
Union government
Major States
Andhra Pradesh
Assam
Bihar
Gujarat
Haryana
Jammu and Kashmir
Karnataka
Kerala
•
■
Madhya Pradesh
Maharashtra
Orissa
Punjab
Rajasthan
Tamil Nadu
(
Uttar Pradesh
West Bengal
Other States
Arunachal Pradesh
Goa. Daman and Diu .
Mizoram
Pondicherry
Himachal Pradesh
Manipur
Meghalaya
Nagaland
Sikkim
Tripura
All India
0.52
.0.45
0.42
0.45
0.42
6.61
6.75
5.68 1
7.51
7.00
7.61
6.60
7.85
6.69
5.97
7.38
7.24
8.11
7.70
9.75
8.92
5.82
5 23
5.66
5.42
4.19
6.37
5.96
6.92
5.78
5.25
5.94
4.32
6.85
6.72
6.00
7.31
5.87
5.57
5.87
4.79
4.56
6.87
6.44
6.29
5.48
5.33
5 63
5.78
6.64
5.73
5.81
7.55
5.75
5.14
6.24
5.09
. 3.60
7.71
6.56
7.13
5.65
5.34
6.00
5.32
6.34
6.64 .
5.48
7.15
5.63
6.00
6 89
5.21
2.90
6.20
6.39
7.44
5.55
4 67
5 00
5.33
6.97
6.59
5.38
6.58
5.85
8.22
6.80
9.11
7.39
6.15
9.20
6.96
4.03
6.53
3.29
6.28
8.33
5.21
8.91
7.24
5.74
6.73
<!7
6;0l
5.54
3.11
6.37
8.10
5.10
7.93
7.73
6.01
7.19
5.64
7.87
4.97
8.07
8.08
5.24
7.51
5.39
6.10
5.16
2.71
6.39.
7.52
4.99
8.03
8 19
4.54
7.33
4.78
6.78
5.10
2.63
anomic and Political Weekly
6.8!
4.90
2.71
I
1
Is 45.'
Noles: ’ = Not available, RE = Revised Estimate; BE = Budget Estimate
Source: CEHAT Database; Original Source: Same as Table 3.
Table 5: Expenditure on National Disease Programmes by States
(As Percentage of Total HealthExpendilure)
Year
Union government
Major States
Andhra Pradesh
Assam
Bihar
Gujarat
Haryana
Jammu and Kashmir
Declining Health Expenditures
Karnataka
Kerala
The state’s commitment to provide health
Madhya
Pradesh
a^ur its citizens is reflected not only in
Maharashtra
^adequacy of the health infrastructure
Orissa
tilow Icvclsof financing but also in declining *
Punjab
pport to various health care demands of the
Rajasthan
oplc, and especially since 1980s from when
Tamil Nadu
pn theprtKcssof liberalisation and opening
Uttar Pradesh
West Bengal
lof the Indian economy to the world
Other States
irkcts. Medical care and control of
Arunachal Pradesh
mmunicablc diseases arc crucial areas of
Goa, Daman and Diu
ncern both in terms of what people demand
Mizoram
priority areas of health care as well as
Pondicherry
bl existing socio-economic conditions
Himachal Pradesh
stand. As with overall public health
Manipur
siding allocations to both these subsectors
Meghalaya
Nagaland
.
a show declining trends in the 1980s and
________
Sikkimdisinterest of the
?0s.___
This
increasing
te in allocating resources for the health
Tripura
All India
;ior is also reflected in investment
xndilurc with very large decline in capital
jcndilurcs during the 1990s.
Further, when we look at expenditures
y
Table 4: Revenue Expenditure on Health by States 1935-96
(Per Cent of Total Government Revenue Expenditure)
)
1994-95 (BE)
1985-86
1991-92'
4.47
5.4!
6.56
4.93
$
17.29
17.00
18.77
9.90
10.90
14.09
11.91
20 75
15.17
___ 3.10 ............
10.02
5.37
3.78
12.33
11.25
10.63
16.03
11.95
12.84
15.84
8.53
13.55
9.10
11.91
12.13
2.89
18.60
13.52
8.14
9.93
16.85
11.55
12.24
I4.58
18 09
9.41
11.75
13.04
15.95
"18.79
7.26
10.34
13.76
15.33
5.28
4.57
9.90
11.81
12.46
10.18
8.89
11.61
18.83
9.37
5.96
5.29
9.34
11.26
11.33
6.48
8.66
11.65
16.51
‘ 9.20
5.58
5.98
8.84
11.87
10.98
6.90
■ 8.18
6.20
17.35
' 9.18
. 13.21
5.67
11.19
8.84
13.04
17.66
5.60
12.81
S.70
11.40
11.73 ’
5.13
11.83
8.97
11.24
4.50
3.10
> 12.66
7.64
8.86
10.41
4.04
16.62
8.66 ’
9.42 ’
’ 9.51
23.82
6.92
13.67
9.90
12.86
16.88
13.06
13.88
10.38
16.20
11.69
9.98
4.85
11.00
8.96
10.92
18.38
14.32
16.16
8.68
6.23
10.59’*
1992-93
9.32
9.49
10.84
1993-94(RE)
,te
niexi
’
Notes: * = Not available, RE - Revised Estimates: BE = Budget Estimates; S = 1994-95 (BE) union
government breakup not available.
Source: CEHAT Database: Original Source: Same as Table 3.
May 17-24, 1997
1199
Hon
i
Anecdotal accounts from various stales, as
well as data from the performance budget of
the ministry of health in Maharashtra reveal
that the net impact of introduction of user
charges and issuing of prescriptions to
purchase drugs, injections, syringes,
bandages, etc, from outside have reduced
public hospital utilisation in most districts
- and these would of necessity mean the
poorest. All this ultimately pushes the poor
to increasingly use private health providers,
often al a cost of personal indebtedness, and
makes public health institutions restricted to
those who can exert influence to grab the
restricted but quality services.'
Most of these changes have been at the
behest of World Bank whose World
Development Report (J993) focused on
‘Investing in Health’. This report is directed
at third world governments to reorient public
health spending for selective health
programmes for targeted populations where
it clearly implies that curative care, the bulk
of health care, should be left to the private
sector. In keeping with this, the Andhra
Pradesh government set up an autonomous
body called the Andhra Pradesh Vaidya
Vidhan Parishad to make the functioning
of laluka level hospitals independent of the
government and flexible to accommodate
interaction with the private sector and is
making further 'reforms’ with assistance
from World Bank. Punjab, West Bengal
and Karnataka governments have followed
suit to reform the public health sector under
Table 6: Expenditure on Medical Care by States
the guidance of World Bank [World Bank
(As Percentage of Total Health Expenditure)
1996]. In fact Punjab has gone one step
1985-86
1991-92
1992-93
1993-94(RE) 1994-95 (BE)
furlhcr and set up a corporation for managing
Year
public hospitals with private sector
11.90
14.61
Union government
18.49
13.76
participation. In many states the First steps
Major Slates
towards privatisation have been taken
34.72
32.03
3I.31..-.Andhra Pradesh
42.23
31.73
■ through contracting out certain services in
9.24
15 75
Assam
45.22
2S.39
24.53
the hospi tai to private bodies. In Maharashtra
13.14
12.79
15.07
Bihar
48.17
29.34
26.62
26.46
Gujarat
32.85
26.S6
two municipal hospitalsin Mumbai arcbeing
20.24
19.18
21.59
Haryana
19.88
17.98
considered for handing over to private
Jammu and Kashmir
52.65
medical colleges on a lease contract. In a
24.34
—22.91
24.32
20 93
43.65
Karnataka
- —number, of states. PHCs and selected
42.14
42.17
44.61
51.28
Kerala
39.11
programmes in selected districts arc being
'j
24.34
25.16
Madhya Pradesh
37?69
28.58
2S.5I
handed over to NGOs co run them more
23.07
.Maharashtra
24.99
26.61
26.15
25.25 •
‘efficiently’. All in all, thestatcis gradually
25.34
24.60 •
24.17
Orissa
42.46
21.85
abdicating responsibility in the health sector
30.72
Punjab
50.86
' 23.21
35.36
30.56
and that too under the garb of a progressive
27.37
27.59
25.09
Rajasthan
28.09
40.78
36.44
43.52
35.87
43.42
slogan, ‘peoples’ health in peoples' hands’.
Tamil Nadu
57.46
Uttar Pradesh
25.80
28.69
32.33
32.33
30.09
References
West Bengal
36 25
37.18
44.65
37.86
38.93
Other Slates
Duggal. Ravi, S Nandraj and A Vadair (1995):
60.41
Arunachal Pradesh
6S.85
74.00
62.67
71.63
‘Health Expenditure Across States’ (Special
Goa, Daman and Din
54.62
68.22
49.54
53.35
53.23
Statistics), EPW, April 15 and 22.
19.64
Mizoram
19.54
23.17
: • 63.73 •
21.72
GO! (1997): EctmamicSttrvey 1996-97, Ministry
Pondicherry
71.58
55.07
53.30
66.22
57.85
of Finance. Government of India, New Delhi.
40.52 ’
Himachal Pradesh
26.04
10.14
Jesani Amar, and S Ananthram (1993): 'Private
24.89
25.87
Sector and Privatisation in the Health Care
I
Manipur
50.72
20.88
Services’, FRCH, Bombay.
Meghalaya
33.86,
36.62
34.63
50.88
34.79
iI
Tuiasidhar V (1993): ‘Structural Adjustment’
Ii
Nagaland
60.15
37.01
38.30
42.93
Programme-Its Impacton the HcalthSector’,
j
Sikkim
51.48
46.26
46.73
49.45
53.03
N!PFP\
Delhi.
;
36.28
Trioura
43.76- -41.92 .
36.39
66.45
World
Bank
(1996):
‘
India
A
Comparative
........
27.46
25.75
37.82
27.66
All India
2e.78
__
Review of Health Sector Reform in Four
States: An Operational Perspective', Report
Noles: * =
- Not available, RE = Revised Estimates; BE = Budget Estimates.
No 15753-IN (Draft Version), Washington.
|
Source: CEB AT Database; Original Source: Same as Table 3.
across states not one state shows a
significantly different trend in spite of (he
fact that health care is a state subject under
the Constitution! This only goes to show
how strongly the centra! government
influences the state’s financing decisions
and that too with average grants of less than
10 per cent of the state’s health budgets,
very similar to how international agencies
with even smaller grants exert large
ideological influences.This lack of initiative
on part of state governments to meet
demands of the people is in part due to the
light grip that the centre has over Plan
resources, which arc also largely investment
expenditures. 131113 the mcchanismof‘planned’
development is used by the centre to make
states tow their line even when the slates may
have opposition governments in power.
Under struclural^djustincnt since 1991
there has been further compression in
government spending in its efforts to bring
down the fiscal deficit to the level as desired
by the World Bank. The impact of new
economics unleashed on people comes via
income and prices and affects people through
final consumption and/or employment, and
for the poorest sections the development
expenditures like IRDP. JRY, health care,
education, housing and other welfare arc
crucial in the context of the existing overall
life chances available to such sections. There
is clear evidence that expenditures on such
1200
social programmes arc declining in real terms
and its bcnciils arc accruing to fewer people.
For instance the GOI budget expenditures
havedcclincd from 19 8 percent of the GDP
in 1990-91 to 16.58 per cent in 1993-94 and
the central health sector has been even more
severely affected [Tuiasidhar 1993]. The
states’ share in health expenditure has
increased and that of the centre declined
drastically, and especially so for the centrallysponsored disease control and other national
programmes which arc mostly of a preventive
nature. If the stales do not pick up the added
burden of allocating additional resources for
these programmes then tuberculosis, malaria,
AIDS, leprosy, etc, would be plaguing the
Indian people more severely.
The situation regarding medical care
expenditures, which arc the responsibility
of state governments, is even worse. The
decline in these expenditures have been
much more severe and this has affected
particularly the poorcrscctions of the urban
population.Thecutbacks within this account
arc on commodity purchases such as dings,
instruments and otherconsumables. Patients
in public hospitals arc now increasingly
being given prescriptions to purchase drugs
from outside at their own cost and this too
against the background of drug prices havi ng
increased two to three times during the last
twotofouryears. In many states small amounts
of user charges have been introduced.
Economic and Political Weekly
i
May:J7=24. 1997
Position: 1130 (19 views)