SDA-RF-CH-1A.15.pdf
Media
- extracted text
-
&
;.1'£nS
■
SDA-RF-CH-1A.15
CH- 'A- pr
.I
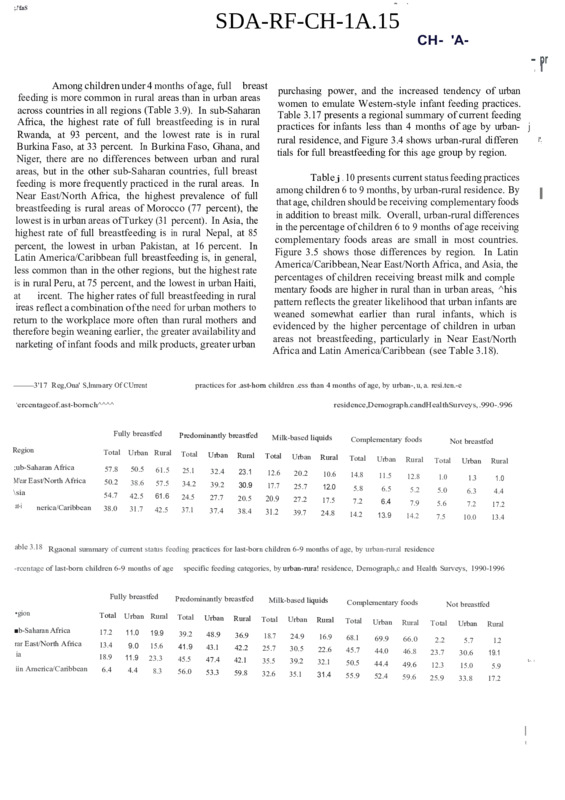
Among children under 4 months of age, full breast
purchasing power, and the increased tendency of urban
feeding is more common in rural areas than in urban areas
women to emulate Western-style infant feeding practices.
across countries in all regions (Table 3.9). In sub-Saharan
Table 3.17 presents a regional summary of current feeding
Africa, the highest rate of full breastfeeding is in rural
practices for infants less than 4 months of age by urban- j
Rwanda, at 93 percent, and the lowest rate is in rural
rural residence, and Figure 3.4 shows urban-rural differen
Burkina Faso, at 33 percent. In Burkina Faso, Ghana, and
tials for full breastfeeding for this age group by region.
Niger, there are no differences between urban and rural
areas, but in the other sub-Saharan countries, full breast
Table j . 10 presents current status feeding practices
feeding is more frequently practiced in the rural areas. In
among children 6 to 9 months, by urban-rural residence. By
Near East/North Africa, the highest prevalence of full
that age, children should be receiving complementary foods
breastfeeding is rural areas of Morocco (77 percent), the
in addition to breast milk. Overall, urban-rural differences
lowest is in urban areas of Turkey (31 percent). In Asia, the
in the percentage of children 6 to 9 months of age receiving
highest rate of full breastfeeding is in rural Nepal, at 85
complementary foods areas are small in most countries.
percent, the lowest in urban Pakistan, at 16 percent. In
Figure 3.5 shows those differences by region. In Latin
Latin America/Caribbean full breastfeeding is, in general,
America/Caribbean, Near East/North Africa, and Asia, the
less common than in the other regions, but the highest rate
percentages of children receiving breast milk and comple
is in rural Peru, at 75 percent, and the lowest in urban Haiti,
mentary foods are higher in rural than in urban areas, ^his
at
ircent. The higher rates of full breastfeeding in rural
pattern reflects the greater likelihood that urban infants are
ireas reflect a combination of the need for urban mothers to
weaned somewhat earlier than rural infants, which is
return to the workplace more often than rural mothers and
evidenced by the higher percentage of children in urban
therefore begin weaning earlier, the greater availability and
areas not breastfeeding, particularly in Near East/North
narketing of infant foods and milk products, greater urban
Africa and Latin America/Caribbean (see Table 3.18).
—3'17 Reg,Ona' S,lmm-ary Of CUrrent
practices for .ast-horn children .ess than 4 months of age, by urban-, u, a. resi.ten.-e
‘ercentageof.ast-bornch^^^^
residence,Demograph.candHealthSurveys, .990-.996
Fully breastfed
Predominantly breastfed
Milk-based liquids
Region
Total
Urban Rural
Total
Urban
Rural
Total
;ub-Saharan Africa
57.8
50.5
61.5
25.1
32.4
23.1
M'ear East/North Africa
12.6
50.2
38.6
57.5
34.2
39.2
30.9
17.7
\sia
at-i
nerica/Caribbean
Urban
Complementary foods
Not breastfed
Rural
Total
Urban
Rural
20.2
10.6
14.8
11.5
12.8
1.0
1.3
1.0
25.7
12.0
5.8
6.5
5.2
5.0
6.3
4.4
Total
Urban
Rural
54.7
42.5
61.6
24.5
27.7
20.5
20.9
27.2
38.0
17.5
31.7
7.2
42.5
37.1
6.4
37.4
31.2
7.9
38.4
5.6
7.2
17.2
39.7
24.8
14.2
13.9
14.2
7.5
10.0
13.4
able 3.18 Rgaonal summary of current status feeding practices for last-born children 6-9 months of age, by urban-rural residence
-rcentage of last-born children 6-9 months of age
Fully breastfed
specific feeding categories, by urban-rura! residence, Demograph,c and Health Surveys, 1990-1996
Predominantly breastfed
Milk-based liquids
Complementary foods
•gion
Total
Urban Rural
Total
Urban
Rural
Total
Urban
Rural
■b-Saharan Africa
17.2
11.0
19.9
39.2
48.9
rar East/North Africa
ia
36.9
18.7
24.9
13.4
16.9
9.0
68.1
15.6
41.9
43.1
42.2
25.7
30.5
18.9
11.9
22.6
23.3
45.7
45.5
47.4
42.1
iin America/Caribbean
35.5
39.2
6.4
32.1
4.4
8.3
50.5
56.0
53.3
59.8
32.6
35.1
31.4
55.9
Total
Urban
Not breastfed
Rural
Total
Urban
69.9
66.0
2.2
5.7
1.2
44.0
46.8
23.7
30.6
19.1
44.4
49.6
12.3
15.0
5.9
52.4
59.6
25.9
33.8
17.2
Rural
L-. ■
I
t
i".
■
I
I
Table 3.12 presents
_______current status feeding practices
Among children 12 to 15 months of age, there are
months
W
23
for children 20 to
- by- urban-rural resi- «
-------- of age,
•stantial differences between urban and rural areas m
dence. The proportion of children not breastfeeding at this
t-year breastfeeding continuation rates, with rural areas
age is important because it represents the inverse of the i
astfeeding significantly longer, as shown in Table 3.11.
second-year breastfeeding continuation rate. As with
tble 3.11 shows the percentage of children not breastchildren 12 to 15 months of age, urban children 20 to 23 |
ding, the inverse of the first-year continuation rates.) In
months are more likely to not be breastfeeding than their
rural counterparts, reflecting the fact that they are weaned t
i-Saharan Africa, urban Namibia, at 51 percent, has the
earlier. The lowest second-year continuation rates are .»
hest rate of non-breastfeeding at 12 to 15 months (i.e.,
found in urban areas of the Dominican Republic, Paraguay, |
lowest first-year continuation rate), followed by urban
Turkey, and Morocco; the highest second-year continuation 1
meroon at 32 percent. In Near East/North Africa,
rates are in the rural areas of Bangladesh, Nepal, Rwanda, |
>rocco has the highest urban non-breastfeeding rate (64
and Burkina Faso. It is evident from Figure 3.7, depicting 1
cent); in Asia, the Philippines (56 percent); and in Latin
overall urban-rural differences in the second-year breast- J
..lerica/Caribbean, the Dominican Republic (86 percent),
feeding rate by region, that the longest breastfeeding occurs |
mre 3.6 shows the overall urban-rural differences in nonin Asia, followed by sub-Saharan Africa. This pattern was |
at 12
>a. iding rates
to 15 months of age
seen Inwith the median breastfeeding duration data (see ■ |
------------~ byi region.
tin jAmerica/Caribbean and Near East/North Africa, rural sectjon 2.4). Latin America/Caribbean and Near East/North |
ren are
are breastfed about 30 percent more often Jhan
have similar second-year continuation rates overall f |
ildren
|
and in rural areas; in urban areas the second-year continuaban children, in sub-Saharan Africa about two-thirds
tion rates are higher in urban Latin America/Caribbean than I
)re often, and in Asia about twice as often. Table 3.19
in urban Near East/North Africa. Table 3.20 is a regional |
esents a regional summary of current status feeding
summary of current status feeding categories for children 20 v
actices for children 12 to 15 months of age, by urban-rural
to 23 months of age, by urban-rural residence.
j
sidence.
Figure 3.6 Percentage of children 12 to 15 months
of age not breastfeeding, by urban-rural
residence and region
Percent
60 ----------
40
Sub
Ne
Asi
La
■:i I •
42
34
33
29
30
0
Reg
53
40
10
Perc
50
50
20
Tab]
.n
I
E3Total
□Urban
■ Rural
---
20
16
17
6
Sub-Saharan
Africa
Note: Based on last-born children only
-•'Mi HI
Near East/
North Africa
1
Asia
Latin America/
Caribbean
Source: DHS Surveys 1990-1996
Current status feeding practices for children less
than 4 months of age by mother’s education are shown in
Table 3.13. Full breastfeeding is most common among
children of mothers with no education across all regions. In
Asia, however, there is no overall difference in prevalence
of full breastfeeding between children of mothers with no
education and those with mothers having primary school
education. In general, full breastfeeding declines with
increasing level of education. The largest differences are in
sub-Saharan Africa and Asia, where children of women
with primary education are more than 20 percent more
likely to be fully breastfed than children of women with
higher education. Children of more educated women
receive more water- and milk-based liquids. A regional
summary of current status feeding practices for children less
tHn 4 months of age, by mother’s education is presented in
i & 3.21. Figure 3.8 shows the regional prevalence rates
for full breastfeeding by mother’s education.
Current status feeding practices for children 6 to 9
months of age by mother’s education are shown in Table
3.14. As noted, the indicator of interest at this age is the
percentage of children receiving complementary foods. In
Latin America/Caribbean, the proportion of infants breast
feeding and receiving complementary foods declines with
increasing level of education (see Figure 3.9), whereas the
opposite is true in Near East/North Africa and sub-Saharan
Africa. This may reflect the tendency among more edu
cated women in Latin America/Caribbean to wean infants
earlier, thus lowering the overall prevalence of breastfeed
ing in this group. In Asia, the percentage of infants receiv
ing complementary foods is lowest among uneducated
mothers, followed by those with secondary education or
r e, and highest among the group with primary education.
A icgional summary of current status feeding practices for
infants 6 to 9 months of age by mother’s education is
presented in Table 3.22.
At 12 to 15 months, mother’s level of education
affects first-year breastfeeding continuation rates, as shown
in Table 3.15 and Figure 3.10. There is a strong positive
relationship between the proportion of children not breast
fed at this age and mother’s level of education, particularly
in Latin America/Caribbean, where the first-year breast
feeding rates are lowest among the most educated women.
Clearly, with increasing education women discontinue
breastfeeding earlier. This pattern is due to a variety of
factors including the return to the workplace, increasing
demands on women’s time, and exposure to Western infant
feeding practices. Regionally (Figure 3.10), Latin Amer
ica/Caribbean countries have the widest variation in the
proportion not breastfeeding according to mother’s educa
tion, and Near East/North Africa countries the least. A
regional summary of current status feeding practices for
children 12 to 15 months of age by mother’s education is
shown in Table 3.23.
At 20 to 23 months of age (see Table 3.16), the
relationship between mother’s education and the proportion
of children not breastfeeding is similar to the pattern seen
at 12 to 15 months. As expected at this age, many more
children are not breastfed across all countries and levels of
education, i.e., the second-year breastfeeding continuation
rates are lower than the first year’s. As Figure 3.11 shows,
the second-year continuation rates are highest in the Asian
countries, again reflecting the tradition of long breastfeed
ing duration in this region, and lowest in Near East/North
Africa. A regional summary of current status feeding
practices for children 20 to 23 months of age by mother’s
level of education is shown in Table 3.24.
Table 3.21 Regional summary of current sunus feeclinu practices for last-born children less than 4 months of age, by mother's education
Percentage of last-born children less than 4 months of age in specific feeding categories, by mother’s education. Demographic and Health Surveys, 1990-1996
Fully breastfed
cation
Sub-Saharan Africa
62.9
Near East/North Africa
55.8
Asia
62.9
Latin America/Caribbean 65.8
82
Milk-based liquids
Complementary foods
Not breastfed
higher
Second No
No
SecondSecond
ary or edu
eduary or
ary or
cation Primary higher cation Primary higher cation Primary higher cation Primary higher
57.0
38 6
20.1
25.2
34.6
9.8
12.0
30.0
13.1
16.0
13.9
0.5
1.1
1.5
42.7
42.2
33.8
40.8
40.7
14.7
18.9
19.8
5.1
6.9
5.2
2.3
5.7
5.3
63.0
40.0
21.0
19.0
35.6
15.2
16.1
31.1
10.0
8.9
6.7
1.8
3.3
7.4
54.2
49.3
17.5
26.6
29.1
12.1
14.9
19.3
8.5
13.3
13.5
0.7
2.2
2.4
Second
ary or
No
edu
Region
Predominantly breastfed
Primary
No
edu-
Second- No
ary or edu
=1 :
43
Figure 3.11 Percentage of children 20 to 23 months of age
not breastfeeding, by mother's level of education and region
100
Percent
81
74 H
- -77
80
■
76
64
62
60
□No education
□ Primary
M Secondary+
41
40
33
20
0
Latin America/
Caribbean
Near East/
North Africa
Sub-Saharan
Africa
Asia
Note: Based on last-born children only
Source: DHS Surveys 1990-1996
Table 3.24 Regional summary of current status feeding practices for last-born children 20-23 months ol aizc, by mother's education
Percentage of last-born children 20-23 months of age in specific feeding categories, by mother’s education. Demographic and Health Surveys, 1990-1996
Fully breastfed
Predominantly breastfed
Second
Second- No
ary or eduary or
Primary higher cation Primary higher
Not breastfed
Region
Sub-Saharan Africa
4.2
1.2
0.3
22.4
23.1
14.5
8.6
7.6
10.0
59.8
43.2
20.1
32.7
53.9
76.1
Near East/North Africa
2.4
0.7
0.2
18.1
15.0
12.3
13.0
14.1
7.4
29.2
22.6
17.0
64.4
73.5
81.3
Asia
4.3
1.3
0.1
48.4
43.4
32.8
27.9
28.4
25.4
69.5
57.3
36.9
19.1
33.2
61.7
Latin Amenca/Caribbean
1.2
0.4
0.2
50.1
25.8
21.7
14.7
12.6
16.7
55.7
25.4
20.2
41.1
70.7
77.2
Feeding practices were examined by sex of child as
; well as by socioeconomic characteristics (see Tables 3.25
through 3.28). In this section as in the previous, full breast
feeding is presented in the tables rather than exclusive breast
feeding because of the small number of cases of exclusive
breastfeeding in most countries. The results indicate that
feeding practices do not vary substantially by sex, at any age, in
> any of the countries studied Among infants under 4 months,
S however, in all regions there was a slightly greater proportion of
T female infants fully breastfed overall (Figure 3.12), probably
g. indicative of an earlier introduction of complementaiy foods to
No
edu
cation
Complementary foods
No
education
Sex Differentials
JI
Milk-based liquids
Second No
ary or eduPrimary higher cation Primary
Second
ary or
higher
No
Second
edu
ary or
cation Primary higher
males overall. Among infants 6 to 9 months, only in Asia was
there a slightly greater overall tendency for females to be given
complementary foods (Figure 3.13), a difference not observed
in the other regions. At 12 to 15 months, no differences by sex
in the first-year breastfeeding continuation rates were observed
(Figure 3.14). At 20 to 23 months, the lack of overall sex
differences in second-year continuation rates is similarly seen
(Figure 3.15), although in Near East/North Africa countries
females were 8 percentage points more likely than males not to
be breastfed, that is, boys were breastfed more often in the
second year than girls. The regional summary of feeding
practices by sex of child is shown in Table 3.29.
85
4
Table 3.29 Regional summary of current status feeding practices for last-bom children 20-23 months of age, by sex
Percentage of last-bom children 20-23 months of age in specific feeding categories, by sex of child and region. Demographic and Health Surveys, 1990-1996
Milk-based liquids
Fully breastfed
Predominantly breastfed
Female Total
Male
Female Total
Male
Female Total
Male
Female
Total
Male
Female
47.9
21.0
47.7
48.3
47.2
47.1
47.4
24.1
17.5
74.9
71.4
78.7
53.9
25.3
49.5
51.5
38.3
38.5
38.1
25.1
25.6
71.7
71.6
71.7
Region
Total
Male
Sub-Saharan Africa
3.1
1.6
3.1
3.1
21.6
22.6
20.6
9.1
9.3
8.9
1.3
1.8
15.3
19.4
10.9
9.8
10.3
9.3
2.6
2.4
2.8
41.1
0.6
0.5
0.7
25.0
Near East/North Africa
Asia
Latin America/Caribbean
3^
38.3
24.8
36.9
26.9
23.9
23.2
25.1
12.9
12.6
13.1
MEDIAN AGE AT INTRODUCTION OF
COMPLEMENTARY FOODS
Table 3.30 and Figure 3.16 show the median age of
introduction of complementary foods among last-bom children
less than 3 years old currently breastfeeding. Median age ranges
vary widely across countries and regions. In sub-Saharan
Africa, the median age of introduction varies from a low of 2.1
months in Malawi to a high of 9.8 months in Ghana, with an
overall median of 5.6 months for the region. In general, children
in West African countries are introduced to foods later in life
than children in East and Central African countries. In Asia, the
median age ranges from a low of 2.8 months in Indonesia to a
high of 13.2 months in Pakistan, with the exception of Bangla
desh, where no median could be determined. 5 For the region,
excluding Bangladesh, the overall median is 7.5 months. In
Latin America/Caribbean, the median ranges from 0 months in
the Dominican Repubhc, to 6.7 months in Guatemala, with an
median for the region of 3.9 months (excluding Brazil).
L ue Near East/North Africa, median age at introduction of
complementary foods was calculated at 7.3 months. Additional
tables showing the median age at introduction of complementary
foods by other selected differentials are included in Appendix H.
Not breastfed
Complementary foods
The wide range of ages for introduction of foods across
countries is illustrated in Figure 3.16. If those ages earlier than
4 months are considered “too early” and those later than 8
months are “too late,” it is clear that children in 9 of 18 subSaharan countries, in 2 of 4 Near East/North African countries,
in 3 of 7 Asian countries, and in 2 of 8 in Latin America/Caribbean countries, are being introduced to foods at inappropriate
ages. Timely introduction of appropriately prepared, nutrition
ally adequate complementary foods should be a focus of
programs or improve the health and nutrition status of young
children in many developing countries.
-
1
I
aL
|
|
|
I
I
K-
Socioeconomic Differentials
It is important to remember that the median age
represents the age at which 50 percent of children are introduced
to complementary foods. The remaining 50 percent are intro
duced to foods either at an earlier age or a later age. Thus, in
many countries, although the median age may be around the
recommended time (i.e. 6 months), many children are being
given foods much to early or too late. Both of these situations
may be detrimental to the infant’s health: Too early introduc
tion is associated with increased risk of diarrhea. Late introduc
tion may have adverse effects on growth and development.
Differences in the median age at introduction of J|
complementary foods are shown by urban-rural residence in 1
Table 3.30, and by mother’s level of education in Table 3.31. ■ j
The differentials are of interest in understanding the influence of
socioeconomic status on feeding practices, as proxied by area of
residence and mother’s educational attainment. In sub-Saharan
Africa, only slight differences in the age of introduction of I
complementary foods exist between urban and rural areas. In
Asia, differences of a half month or more (in both directions)
exist between urban and rural areas in 4 of the 5 countries where
medians could be determined, with the exception of Indonesia,
where there was little urban-rural difference. In Pakistan and the
Philippines, median age could not be determined for urban
areas, but it is probably higher than in rural areas, as indicated
by the total figures. In Egypt, complementary foods are
introduced to children in rural areas almost a month later than to
children in urban areas. In the other Near East/North Africa |
countries, medians could not be determined for children still ■
breastfeeding. 6
5 The Bangladesh median could not be calculated because less than 50
percent of breastfeeding children received complementary foods at the
age covered by the survey.
-t of
6 The medians could not be calculated because less than 50 percent
'cred
breastfeeding children received complementary foods at the age cove,
by the surveys.
06
I.
O
. .n
■
Figure 3.16 Median age at introduction of complementary
foods, children less than 3 years old currently breastfeeding
Age (months)
14
13
12
10
10
8
6
4
2
0
9
8
8
illllll I III Jll
6 7 7 7 7
: 7
ii
o,6,<V> o>
Note: Based on last-bom children only
For mother’s level of education, in most countries
where medians could be determined, complementary foods were
introduced earlier with increasing level of education. The
differences are clearest in sub-Saharan Africa because medians
could be calculated for most countries, although among children
of mothers with the highest educational level, cell sizes are
small. In the other regions, the tendency toward earlier introduc
tion of foods with higher level of education is discernible, but
meralizations are problematic because of the lack of median
data or small cell sizes. The earlier introduction of foods with
higher maternal education may reflect the tendency for more
educated women to return to the work force soon after birth,
greater exposure among educated women to information
regarding appropriate timing of complementary foods, greater
economic ability to purchase complementary foods, better
access to markets, or a combination of these factors.
Sex Differentials
Differences in the median age of introduction of
complementary foods by child’s sex are shown in Table 3.32.
Regional averages for sex differences are shown in Figure 3.17,
which additionally illustrates the overall differences in median
age at introduction of complementary foods among regions. In
Latin America/Caribbean and sub-Saharan Africa, there were
few differences in age of introduction by sex, although in both
regions foods were introduced to girls slightly earlier than to
98
8
aS.oJ’-CK'-cfe.o?5 oKcP-.ofc.dv’
Source: DHS Surveys 1990-1996
boys. In the Asian countries, sex differences were more
pronounced, with girls being started on complementary foods talmost a month earlier than boys on average (7.7 vs. 8.4
months). In the Near East/North Africa, median age data were
available only for Egypt, where boys were given complementary
foods almost a month earlier than girls (6.9 vs. 7.7 months). Sex |
differences in the age of introduction of foods may reflect
cultural/religious biases and may partially explain differences in
nutritional status, morbidity, and mortality rates, although many
other factors also influence these outcomes.
3.3
TYPES OF FOODS EATEN BY CHILDREN
In addition to breast- and bottle-feeding patterns and
feeding
practices within different age groups of children, .
general
it is important to know what kinds of foods children are eating,
and how often they are fed. Beginning with the third phase of
the Demographic and Health Surveys program (DHS-IH) only, h
mothers were asked what types of food were given to their
children in the 7 days before the interview, and the number of
days in the week the children were given those foods. Table
3.33 presents the results of the weekly recalls for all children
over the age of 6 months. Because the results are from surveys ,
conducted only during DHS-HI, the data are limited to a f relatively small number of countries from sub-Saharan Africa,
Asia, and Latin America/Caribbean.
■
Figure 3.17 Median age at introduction of complementary
foods, by sex and region
10
Age (months)
8
- 8
8
6
6
6
ESMale
□ Female
4
4
3
2
0
Sub-Saharan
Africa
Near East/
North Africa
Asia
Latin America/
Caribbean
Note: Based on last-bom children only
Source: DHS Surveys 1990-1996
Water-based liquids (e.g., juice, tea, broth) are given to
children in most countries about 2 to 3 times per week. In subSaharan Africa, about a third of children are given water-based
liquids in the four countries studied. In Asia, a third of children
are given water-based liquids, on average, but the range is from
10 percent in Indonesia to 53 percent in Kazakhstan. In Latin
America/Caribbean, the range is from 16 percent in Colombia
to 45 percent in Peru.
Feeding of grains (reflecting cereals made from grain or grain
flours) was reported unevenly, with 40 percent or more in the
Central African Republic, Uganda, Bolivia, and Guatemala, but
less than 20 percent in the remaining countries where the foods
were reported. However, the frequency of feeding grains was
3 to 4 times per week. Tubers and plantains (again, probably
reflecting cereals made from these foods) were given to a third
or more of children in all the countries where those foods were
reported. Tubers and grains were given from about 2.5 to 4
times per week. Other complementary foods were also given to
children, ranging from 10 percent in Zimbabwe to 67 percent in
the Central African Republic. Other complementary foods may
include fruits, vegetables, snacks and sweets, garnishes, food
mixes, or other processed foods. When foods of any kind were
considered, more than 90 percent of children in most countries
were given some type of food. In Mali, Brazil, and Colombia,
only 77, 65, and 71 percent of children, respectively, were
reportedly given any foods in the last week. Interestingly, in
Latin American/Caribbean countries, the frequency of feeding
any type of food was about 4 times per week, which is higher
than the average number of times foods were given in either
sub-Saharan Africa (2.9 times per week, on average) or Asia
(3.3 times per week, on average).
Milk-based liquids (i.e., milks other than breast milk)
are also given to children; this type of feeding varies from 3
percent of children in Indonesia to 33 percent of children in
I Zimbabwe. As with water-based liquids, the weekly frequency
of giving milk-based liquids is about 2 to 3 times per week.
At least half of the children in most countries were
\ given eggs, fish, and poultry about 2 to 3 times per week on
average. Nepal was the exception with only a third of children
g receiving these foods, and less than 2 times per week on
; H average. Half or more of the children in sub-Saharan Africa and
llLatin America/Caribbean received red meat about 2.5 times per
iM^Week. Fewer than half of all children in Asia received red meat,
i.. jSwith Nepal at 27 percent again having the lowest prevalence.
101
Figure 3.18 Percentage of children 0 io 11 months of age bottle-fed
Central African Republic 19$
Burkina Faso
12
a.2
B3
P3
■"3
Madagascar 1992
S
K33
SL3
Tanzania 1991-92
Senegal 1992-93
Zambia 1992
Zimbabwe 1994
Uganda 1995
Kenya 1993
Cameroon 1991
Ghana 1993
Nigeria 1990
Namibia 1992
Near East/North Africa
Egypt 1992
Morocco 1992
Turkey 1993
Jordan 1990-91
a. 30
«
Asia
Bangladesh 1993-94
Nepal 1996
India 1992-93
Indonesia 1994
Pakistan 1990-91
Philippines 1993
Kazakhstan 1995
114
, . 15 •
54
Latin America/Caribbean
Haiti 1994
Guatemala 1995
Bolivia 1993-94
Peru 1996
Paraguay 1990
_ brazil 1996
. . .
Colombia 1995
Dominican Republic 1991
31
■
3737
0
85
20
Note: Based on last-born children only
3.4
BOTTLE-FEEDING
Bottle-feeding is not recommended for the vast
majority of infants in developing countries because of the
potentially adverse effects of contamination from water, utensils,
and hands during preparation and storage of formula and other
bottle-feeds, and the potential for overdilution of instant formula
•with water, rendering the bottle-feed nutritionally inadequate.
F’^mre 3.18 presents the percentage of last-bom infants 0 to 11
aths of age currently receiving a bottle. By region, bottle
feeding is least prevalent in sub-Saharan Africa and most
common in Latin America/Caribbean. In sub-Saharan Africa,
the use of bottles is less than 10 percent in most countries; the
highest rate of use is in Namibia, where one-third of infants
receive a bottle. In Latin America/Caribbean, on the other hand,
bottle-feeding ranges from 23 percent in Haiti to 85 percent in
the Dominican Republic. In Near East/North Africa countries,
the prevalence is intermediate, with a range of 20 to 43 percent.
The range of bottle-feeding rates is quite wide in Asia, probably
a result of the varied mix of countries in that regional grouping.
Overall, as countries move higher on the economic development
ladder, bottle-feeding rates increase, and become closer to the
rates found in developed countries.
40
60
Percent of children
80
100
Source: DHS Surveys 1990-1996
Summary
The data from 37 countries indicate that there is
substantia] divergence from the WHO recommendations for
infant feeding. Exclusive breastfeeding of infants younger than
4 months is rare in all but a few countries. In contrast, most
young infants are predominantly breastfed, i.e., given breast
milk with some other liquids. Equally troubling is the fact that
in a third of the countries studied fewer than half of children 6
to 9 months of age are receiving complementary foods, as is
recommended. At the same time, the median age at introduction
of complementary foods among children under age three years
is as young as 1,2, or 3 months in 13 of the 37 countries. Thus,
liquids and solids other than breast milk are being given to
children at very early ages, increasing the risk of diarrhea. From
the age of 6 months onward, when breast milk alone is nutrition
ally insufficient and complementary foods are needed, many
children over 6 months are not fed any solid foods, or are not
fed them on a daily basis.
There is still an urgent need to promote adequate and
safe feeding of young children. Breastfeeding patterns in the
countries
studied
J are far from optimal, with few young infants
---------------103
Definitions Used in the WHO Global Data Bank on Breastfeeding
»
Category of
infant feeding
Does not allow the infant
to receive
Allows the infant to
receive
Exclusive breastfeeding
Breast milk (including
milk expressed or from
wet nurse)
Drops, syrups (vitamins,
minerals, medicines)
Anything else
Predominant
breastfeeding
Breast milk (including
milk expressed or from
wet nurse) as the.
predominant source of
nourishment
Liquids (water, and water
based drinks, fruit juice),
oral rehydration therapy,
ritual fluids, and drops or
syrups (vitamins, minerals,
medicines)
Anything else (in
particular, nonhuman milk,
food-based fluids)
Complementary feeding
Breast milk and solid or
semisolid foods
Any food or liquid
including nonhuman milk
Breastfeeding
Breast milk
Any food or liquid
including nonhuman milk
Bottle-feeding
Any liquid or semisolid
food from a bottle with
nipple/teat
Any food or liquid
including nonhuman milk.
Also allows breast milk by
bottle
•i
I
Requires that the infant
receive
i
Source: WHO, 1996
1
kJ \-¥o
IO
f
165
OA1
£ .
'< U!!FP4
ffl oB^emves of study
..
J
K7---'
3 rr
i
A Study Commissioned by
7
.
;
• To assess Incidence of Induced
abortions In these two states.
• To assess contribution of sex linked r
abortions in total Induced abortions.
• To understand Imnact of inriiinefi
abortions and sex linked abortions on
Total Fertility Rate.
UNFPA
METHODOLOGY
■
• Indirect estimates.
• Large scale data sets used Le.NFHS I and II
andSRS.
• Proximate variable model used for
Decomposition of total fertility.
•. Index of sex discrimination at birth
calculated on the basis of deficit in
number of girls at birth, expected ratio
being 100/106.
%
Table 1: Total Induced Abortions
Per 100 Live Births
(1992-1998J
Haryana
Punjab
Urtaa
Total
Rural
Urtsu
Total
14.7
30.9
17.9
19J
44.9
262
199? IT
112
Ml
Ilf
165
1992
nr
Table 3: Impact of SSA on TFR
j
Table 2: Ratio of Sex- selective Abortions to
Total Induced Abortions (in Percentage)
(1992-1998).
Haryana
;
Punlaii
Total
Total
18.1
112
69.9
57J
35J
455
W90 712
671
oiT
lol
19J
nT
1992
Punjab
Haryana
Brttaa Total
OT
Roral
Ortna
Total
Rural
1992
442
3.14
llT
109
240
1991
3.13
218
225
242
TFR in Case No. Sex Sex selective abortions
4.71
1992
328
4J2
3.31
Tro"
2.69
114
2jf
103
Im
1991
m
nr
251
2J2
m
Percentage Increase in TFR, had there been no sex selective abortions
9.1
1392
12
11
72
15
15
1991
8.7
22J
lol
6J
124
~15
'•
~
■
w
■'
3
■ w
POUCy IMPLICATIONS
&
j^UJIFRa
- Value of girl child
- Dowry as social evil
- Consequence of declining sex ratio
on family formation patterns
- Commercialization of sex
'■
POLICY IMPLICATIONS
rwww r»3
1 Advocacy on Issues related to:
.
-
2 Legal framo work:
- Expand scope of PNDT act to include other
methods of pre-selection of sex.
- Ensure effective implementation of MTP
and PNDT Act
3 Improve service delivery for safe
abortion
POLICY IMPLICATIONS....
Contd
■■
4 Research:
- Demographic Impact
-Bata Collection Methodologies on
Abortions
- Changing Patterns in Method Mix and Its
impact on TFR
- In-depth studies
on socio-cultural
determinants of SSA
2
Position: 2397 (5 views)