10641.pdf
Media
- extracted text
-
n
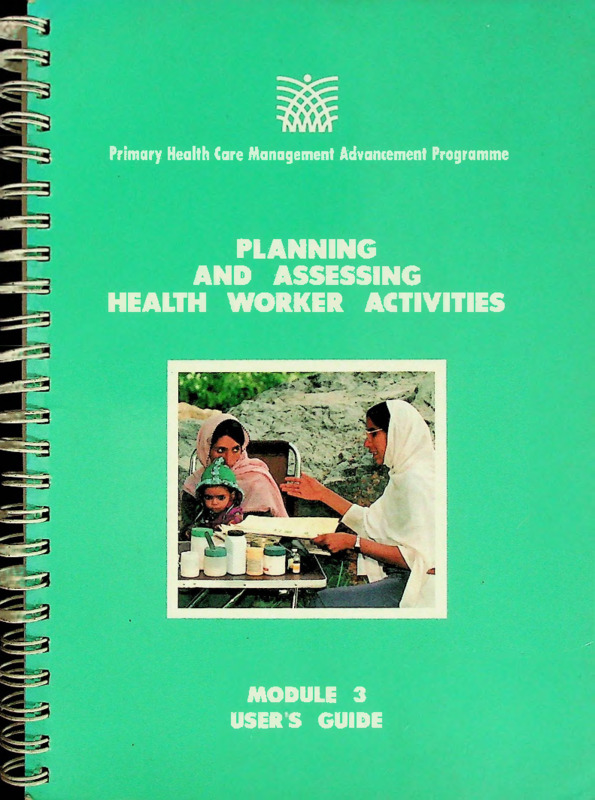
Primary Health Care Management Advancement Programme
PLANNING
AND ASSESSING
HEALTH WORKER ACTIVITIES
MODULE 3
USER S GUIDE
In Bangladesh, health workers use a major share-:of^'eif~
time to train other women about measurepl^ ctaptap'
to promote health and preventyjifisease
■ p,Y
Photo by Jean-Luc Ray for A
ISBN: 1-882839-02-1
Library of Congress Catalog Number: 92-7546
an°
1NfobM’ Tl°”
CENT- E
fMNGZ
pH C • \ 00
hntL'i '^3
w w \ij
1
□
S S
S 15
is
iL
*
u» d) dJ dJ &
l dl iki tki ill
ill uj w
B IB 1 I X i t a i l l l B H i n B f f i
W Slffll 1
Dedicated to
Dr. Duane L. Smith (1939-1992),
Dr. William B. Steeler (1948-1992)
and all other health leaders, managers and workers
who follow their example in the effort to bring quality health
care to all in need.
In Kenya, a community health nurse trains and helps
plan the work of the community health volunteers
Photo by Jean-Luc Ray for AKF
An overview of PHC MAP
The main purpose of the Primary Health Care Management Advance
ment Programme (PHC MAP) is to help PHC management teams collect,
process and analyse useful management information.
Initiated by the Aga Khan Foundation, PHC MAP is a collaborative programme
of the Aga Khan Health Network1 and PRICOR.2 An experienced design team and
equally experienced PHC practitioner teams in several countries, including
Bangladesh, Chile, Colombia, the Dominican Republic, Guatemala, Haiti, India,
Indonesia, Kenya, Pakistan, Senegal, Thailand and Zaire, have worked together to
develop, test and refine the PHC MAP materials to make sure that they are
understandable, easy to use and helpful.
PHC MAP includes nine units called modules. These modules focus on essential
information that is needed in the traditional management cycle of planning-doingevaluating. The relationship between the modules and this cycle is illustrated below.
PHC MAP modules and the
planning-evaluation cycle
MODULE g
PHC MAP
MODULES
1. Information needs
2. Community needs
3. Work planning
4. Surveillance
5. Monitoring indicators
6. Service quality
7. Management quality
8. Cost analysis
9. Sustainability
1. The Aga Khan Health Network includes the Aga Khan Foundation, the Aga Khan Health Services,
and the Aga Khan University, all of which are involved in the strengthening of primary health care
2. Primary Health Care Operations Research is a worldwide project of the Center for Human Services,
funded by the United States Agency for International Development
ii
Managers can easily adapt these tools to fit local conditions. Both new and
experienced programmers can use them. Government and NGO managers, man
agement teams, and communities can all use the modules to gather information
that fits their needs. Each module explains how to collect, process and interpret
PHC-specific information that managers can use to improve planning and moni
toring. The modules include User’s guides, sample data collecting and data
processing instruments, optional computer programs, and Facilitator’s guides, for
those who want to hold training workshops.
The health and management services included in PHC MAP are listed below.
Health and management services
HEALTH SERVICES
GENERAL
PHC household visits
Health education
MATERNAL CARE
Antenatal care
Safe delivery
Postnatal care
Family planning
CHILD CARE
Breast feeding
Growth monitoring
Nutrition education
Immunization
Acute respiratory infection
Diarrhoeal disease control
Oral rehydration therapy
OTHER HEALTH CARE
Water supply, hygiene and
sanitation
School health
Childhood disabilities
Accidents and injuries
Sexually transmitted diseases
H1V/AIDS
Malaria
Tuberculosis
Treatment of minor ailments
Chronic, non-communicable
diseases
MANAGEMENT
SERVICES
Planning
Personnel management
Training
Supervision
Financial management
Logistics management
Information management
Community organisation
Several Manager’s guides supplement these modules. These are: Better manage
ment: 100 tips, a helpful hints book describing effective ways to help managers
improve what they do; Problem-solving, a guide to help managers deal with common
problems; Computers, a guidebook providing useful hints on buying and operating
computers, printers, other hardware and software; and The computerised PRICOR
thesaurus, a compendium of PHC indicators.
IB
Community women are a powerful force for improving family
and community health when they are well-trained, supervised
and logistically supported
Photo by Jean-Luc Ray for AKF
The Primary Health Care Management Advancement
Programme has been funded by the Aga Khan Foundation
Canada, the Commission of the European Communities, the
Aga Khan Foundation U.S.A., the Aga Khan Foundations
head office in Geneva, the Rockefeller Foundation, the
Canadian International Development Agency, Alberta Aid,
and the United States Agency for International Develop
ment under two matching grants to AKF USA. The first of
these grants was "Strengthening the Management, Monitor
ing and Evaluation of PHC Programs in Selected Countries
of Asia and Africa" (cooperative agreement no. OTR-0158A-00-8161-00, 1988-1991); and the second was "Strength
ening the Effectiveness, Management and Sustainability of
PHC/Mother and Child Survival Programs in Asia and
Africa" (cooperative agreement no. PCD-0158-A-00-110200, 1991-1994). The development of Modules 6 and 7 was
partially funded through in-kind contributions from the
Primary Health Care Operations Research project (PRICOR)
of the Center for Human Services under its cooperative
agreement with USAID (DSPE-6920-A-00-1048-00).
This support is gratefully acknowledged. The views and
opinions expressed in the PHC MAP materials are those of
the authors and do not necessarily reflect those of the
donors.
All PHC MAP material (written and computer files) is in
the public domain and may be freely copied and distributed
to others.
Module 3: Work planning
Contents
QUICK START.............................................................................................. 1
INTRODUCTION
Planning and assessing health worker activities: ................................. 3
How Module 3 can help you.................................................................. 4
Some limitations of the module ............................................................. 5
How to use this guide............................................................................. 6
STEPS IN PLANNING AND ASSESSING HEALTH WORKER
ACTIVITIES.................................................................................................. 7
Step 1: Describe and map the catchment area................................... 9
Step 2: Identify community needs and available resources............. 19
Step 3: Set priorities and identify high-risk groups.................... .. .26
Step 4: Plan PHC activities ............................................................... 32
Step 5: Develop job descriptions and recruit staff............................ 62
Step 6: Develop individual work plans and schedules .................... 67
Step 7: Assess job performance......................................................... 75
APPENDICES ............................................................................................ 81
A. Examples of legends for map making ......................................... 81
B. Risk factors..................................................................................... 83
C. Assessment of community health facilities..................................91
D. CHW activity register booklet and instructions.......................... 95
E. Blank worksheets.......................................................................... 101
REFERENCES AND BIBLIOGRAPHY.................................................. 133
ACRONYMS AND ABBREVIATIONS .................................................. 134
GLOSSARY .............................................................................................. 135
Module 3: Work planning
Acknowledgements
A number of people and institutions have contributed to the development,
review, and testing of this module. The first outline was made by Lori DiPrete and
Jack Reynolds from the University Research Corporation/Center for Human
Services. Drafts of the module were reviewed by a number of PHC experts,
including Pierre Claquin, Aga Khan Foundation; Jack Reynolds, Center for Human
Services and Jack Bryant, Aga Khan University; and it was then field tested. The
module was revised and reviewed by participants at the International Conference
on the Management and Sustainability of the PHC Programmes, held in Bangkok
in May 1992. The final version was prepared based on that feedback.
A number of other individuals deserve special thanks for their contributions
to this module. Among these are Neeraj Kak and Maria Franscisco from the Center
for Human Services and Sohail Mushtak from the Aga Khan University. Special
acknowledgement and deep appreciation goes to Dr. Colin De’ath, Bangkok,
Thailand for his extra efforts during the final edits on this edition, all the work at
odd hours he has put in on the rest of the series and his continual encouragement
while working with a less than harmonious production team.
Field tests:
Countries, participating organisations, field test facilitators
India
Junagadh PHC Project, Gujarat, and the Sidhpur Sustain
able Health System Project, Gujarat; Aga Khan Health Ser
vice, India; Facilitators: Neeraj Kak, Center for Human
Services, Vijay Moses, Aga Khan Health Service, India
Kenya
Mombasa PHC Programme; Kisumu PHC Programme; Fa
cilitators: Maria Francisco, University Research Corpora
tion/Center for Human Services; Inaam-ul-Haq, Aga Khan
University, Pakistan
Module 3: Work planning
1
Quick start
Basic work planning
You may already have done some of the work planning activities described in this module.
To find out - and to identify the ones that interest you most - review the following Quick start
summary. Check off the sections that you want to read and begin with these. Most of these
sections include worksheets and sample forms that can help you develop work planning
procedures quickly.
Step 1: Describe and map the catchment area
Review this step if you need to: 1) define and map the physical boundaries of your
catchment (service) area; 2) describe the health services and population contained in that
area; and/or 3) develop a register of households and/or individuals located in the area.
Step 2: Identify community needs and available resources
Review this step if you need to: 1) identify community health problems and needs; 2)
assess the PHC services currently provided by other health providers in the area; and/or 3)
identify health resources that you can call on in the area.
Step 3: Set priorities and identify high-risk groups
Review this step if you need to: 1) identify priority health problems that your programme
will address; 2) set up a system for assessing risk factors in your area; 3) identify your primary
target groups; 4) identify high-risk groups and individuals in your area; and/or 5) establish
a system for monitoring high-risk groups.
Step 4: Plan PHC activities
Review this step if you need to: 1) identify strategies for providing needed health services
to your target groups; 2) develop a plan for community-based and outreach services; and/or
3) develop a plan for clinic-based services.
Step 5: Develop job descriptions and recruit staff
Review this step if you need to: 1) develop a role and task list for your staff; 2) prepare
job descriptions for your staff; and/or 3) make sure that staff job descriptions will produce
desired programmatic results.
Step 6: Develop individual work plans and schedules
Review this step if you need to: 1) develop individual work plans for each staff member;
2) assign work to fit priority health needs and the needs of high-risk groups; and/or 3)
schedule work so that staff have a reasonable work load and can complete their assignments
on time.
Step 7: Assess job performance
Review this step if you need to: 1) set up a performance-based system for assessing staff
work; 2) set up procedures to compare planned with actual work performance; and/or 3)
ensure that staff performance is contributing to programme objective.
Module 3: Work planning; quick start
2
In North Pakistan a health worker administers an oral dose
of iodinated oil for prevention of iodine deficiency disorders,
such as goitre
Photo by Pierre Claquin for AKF
a
3
3
3
3
3
3
3
3
-tS
-3
js
-3
3
3
3
3
4
3
3
Introduction
Planning and assessing health worker
activities
One of the major objectives of most PHC managers is to
find ways to increase coverage of the target populations
with basic health services. One of the major challenges is
finding simple, yet effective procedures for getting PHC staff
to do that. This module was designed to address this
problem.
The overall objective of Module 3 is to help your staff
develop realistic work plans that will lead to improved
coverage, early identification and attention to high-risk
women and children, and will not require additional effort
to manage.
To do this, you will need to set up a system that identifies
your various target populations, determines their health
needs, sets priorities among those needs, and then assigns
staff to provide services on a selective basis. The heart of
this system will be information. The system must provide
adequate information so that you and your health workers
can continually assess needs, adjust plans accordingly, mon
itor results, reassess needs, readjust plans, and so on. The
"system" described in this module is based on some of the
best features of several PHC programmes that have been
successful in that respect. Through the use of maps, simple
registers, risk analyses, prompt feedback, flexible work plans,
living job descriptions, supportive performance appraisals,
and other simple tools, these programmes have been able
Module 3: Work planning; introduction
Set up a
system
4
to increase coverage, improve health status, and raise job
satisfaction at the same time.
Module 3 picks up where Module 2 left off. Community
surveys provide a broad picture of health needs and program
effectiveness in meeting those needs. Module 3 shows how
to assess individual needs and develop specific work plans
to enable both clinic staff and field workers to meet those
needs.
The procedures described in this module do not require
sophisticated computers or advanced training in manage
ment. All of the procedures can be done by hand, and many
are designed to be used by front line field workers (CHWs,
nurses, midwives, field doctors, and the like). As with the
other PHC MAP modules, these tools are illustrative and
you are encouraged to adapt them to fit your specific needs.
How Module 3 can help you
How each step
will help you
This module is designed to help you to plan your PHC
activities. For example, you can use this module to;
• Identify the populations/individuals to be served.
Step 1 will help you to define and describe your
programme’s catchment area, to develop a map of the
area, and to compile information for a household register
from a community/village.
• Identify health problems, risk factors, and avail
able resources as well as assess existing health
services. Step 2 will help you to identify health prob
lems, demographic factors, and other risk indicators. It
will also help you to assess health services and other
resources available to you.
• Identify those in need of the various types of care
and target high-risk clients for intensive care.
Step 3 will help you in developing risk factors for the
various PHC components. You can use the risk factors
to identify individuals or households at risk of getting
diseases you are trying to protect them from, and to focus
your efforts on these high-risk groups.
Module 3: Work planning; introduction
Step 4 will help you to plan
outreach and clinic-based services to accommodate com
munity needs with available PHC resources.
• Plan PHC activities.
• Identify needs for additional staff and resources.
Step 4 can also help you to identify additional resources
that would be needed to improve coverage and to reach
those most in need.
• Improve health worker efficiency. The module will
show you and your staff how to set priorities and to
develop work plans for their day-to-day activities, to
monitor their own performance, and to manage their time
effectively. The tools can help your staff accomplish more
with no additional effort.
• Develop job descriptions and individual work
plans. Steps 5 and 6 show you how to develop job
descriptions and individual work plans that will help your
programme meet its overall objectives.
• Review performance, monitor and support health
worker activities, and give them constructive
feedback. Step 7 shows how to monitor staff perfor
mance in reaching individual, community and programme
objectives. And it shows how to set up a system to
provide objective and constructive feedback to your staff.
Some limitations of the module
The module does not deal with the overall planning of a
PHC programme. Rather, its purpose is to assist the man
ager and the team in planning their activities so that the
work that each person does contributes directly toward the
larger goals of the programme.
The module does not discuss specific ways to involve
communities in the planning process. However, that is
encouraged, and it is not difficult to see how they could be
involved in most of the steps, from assessing needs to
identifying high-risk children, to providing feedback on
CHW performance.
The module is not a comprehensive personnel manage
ment manual either. However, it does describe ways to focus
Module 3: Work planning; introduction
6
the health worker on those tasks that will lead to better
programme performance.
How to use this guide
Assessing
needs of the
target
population
This guide provides instructions for planning and assess
ing your programmes PHC and health worker activities. By
following the instructions and using the worksheets, you
should be able to identify the target population, to assess its
needs, to plan PHC activities, to determine staffing require
ments, to develop individual job schedules, and to evaluate
worker performance. You may skip a step or sub-step if you
think that the activity is already being undertaken in your
programme. However, you may still want to review the
skipped step to see if the existing process can be improved.
The steps and sub-steps for planning and assessing PHC
and health worker activities are summarised on the follow
ing page.
Module 3: Work planning; introduction
6
the health worker on those tasks that will lead to better
programme performance.
How to use this guide
Assessing
needs of the
target
population
This guide provides instructions for planning and assess
ing your programme’s PHC and health worker activities. By
following the instructions and using the worksheets, you
should be able to identify the target population, to assess its
needs, to plan PHC activities, to determine staffing require
ments, to develop individual job schedules, and to evaluate
worker performance. You may skip a step or sub-step if you
think that the activity is already being undertaken in your
programme. However, you may still want to review the
skipped step to see if the existing process can be improved.
The steps and sub-steps for planning and assessing PHC
and health worker activities are summarised on the follow
ing page.
Module 3: Work planning; introduction
7
Steps in planning and
assessing health worker
activities
Step 1: Describe and map the catchment area
Define the catchment area
Describe the catchment area
Make map(s) of the catchment area
Make a register of communities/villages
Make a household register
Step 2: Identify community needs and available
resources
Select indicators
Health problem indicators
Demographic indicators
Risk factors indicators
Existing health services and available resources
Identify source(s) of information
Develop a survey instrument
Step 3: Set priorities and identify high-risk groups
Set priorities among health problems
Determine the risk factors
Set priorities for risk factors identified
Identify main target and high-risk groups
Use risk factors to monitor high-risk groups
Step 4: Plan PHC activities
List services required, identify strategies and activities
Identify and plan outreach and community-based
activities
Determine number of units to be covered
Determine optimal time interval for each activity
Module 3: Work planning; overview of steps
8
Determine resource requirements
Compare resource availability with requirements
and identify an optimal number of visits
Develop tools to plan and monitor community
based and outreach activities
Identify and plan clinic-based activities
Determine client load
Determine staff capacity
Determine resource requirements
Determine availability of resources
Compare availability with need and identify an
optimal solution
Develop tools to plan clinic-based activities
Step 5: Develop job descriptions and recruit staff
Develop role, task and skills list
Prepare job descriptions and do a feasibility check
Post job announcement, recruit, screen, and select
candidates
Agree with selected candidates on role and task expectations
Step 6: Develop individual work plans and schedules
Advantages of work plans
Principles of good work plans
Scheduling of work
Step 7: Assess job performance
Principles of performance assessment
Continuous performance assessment
Formal performance assessment
If your programme is new, you will need to go through
the following steps. This module can be used for some of
these. Other PHC MAP modules can help you with those
steps not included in this module.
Module 3: Work planning; overview of steps
9
Steps
Module 3
steps
Other
modules
1. Define catchment area and target group
1
1
2. Identify community needs
2
2
3. Set priorities among health problems and
identify high-risk groups
3
2,4
4. Define goals and objectives
1
5. Identify services/components and
strategies
1
6. Plan activities
4
7. Plan resource needs
4
8. Develop job descriptions and recruit staff
4
9. Develop work plans and schedules
5,6
10. Implement and monitor progress
7
11. Assess job performance
7
5,6,7
12. Assess programme performance
7
4,5,6,7,8,9
13. Evaluate
8,9
4,5,6,7
2,4,8,9
Step 1: Describe and map the catchment
area
Skip this step if:
° Your catchment areas are adequately defined and mapped
• You already maintain adequate registers of households
and/or individuals in these areas
Review this step if:
• You need to define and map the physical boundaries of the
catchment area(s) and to describe the services and popula
tion contained within it
• You need to define and develop a register of households
and/or individuals located in these catchment areafs)
The purpose of this step is to help the manager to define
and describe the PHC catchment area or the geographical
area surrounding a health facility and the target population
it serves. The PHC manager needs to understand the
Module 3: Work planning; step 1
'ffM
10
ecology and economy of the local area because both will be
reflected in the health needs of the catchment population.
In each community, a detailed household listing will have to
be developed to identify women, children and other at-risk
individuals who may seek or require health services from
time-to-time. The sub-steps involved are described below.
• Define the catchment area(s)
• Describe the catchment area(s)
• Draw a map of the catchment area(s)
• Make a register of villages, communities
• Make a household register
Define the catchment area
Defining and
describing
PHC catch
ment area
If you have not already done it, this step can be a major
activity, but it is worth it. Most PHC programmes do some
sort of assessment at the onset. It is a good opportunity to
involve key members of the PHC team and the community.
The catchment area is defined as the geographical area
surrounding a single health facility or group of health
facilities and includes the target population living within it.
Catchment areas may be determined by the type of PHC
service or by geographical or administrative boundaries. For
example, the catchment area of a secondary hospital may
be a district serving a relatively large population; a commu
nity health centre serving the health needs of one sub
district of only five to ten villages; and at the lowest level, a
community-based worker with a village or sub-division of
the village as part of his or her catchment area.
Thus, the boundaries of the catchment area can be
defined by:
• an administrative unit which can be based on area and/or
population, e.g., district, sub-district, village, etc;
• a circle of a fixed distance, e.g. five or eight km around a
health facility;
• an area which includes the target population for a specific
PHC service, a socio-economic group, or a geographically
defined population; or
Module 3: Work planning; step 1
3
3
■3
3
3
3
3
3
3
3
3
3
3
11
• any practically defined working area, which may include
services offered in neighbouring areas or which is based
on an assessment of utilisation patterns.
A catchment area for a larger PHC programme can be divided
into sub-catchment areas for different types of PHC services.
For example, the catchment area for a programme’s EPI com
ponent may be larger than the one for basic curative care if the
neighboring health centre does not have electricity so it can
provide surgical services. The sub-catchment areas may also be
defined by the area where outreach MCH services will be most
concentrated. (It may not be possible to provide outreach
services to a large area because of transportation problems.)
The following is an example of a completed worksheet
that can help you define your catchment area. A blank
worksheet is provided in Appendix E.
Exhibit 1: Worksheet for defining catchment area
a) Select criteria to define the boundaries of your catchment area:
___ . Fixed distance of
kms around health facility
X Administrative unit (specify level and name)
Panqaana fsub district!
in Gununa Kidul/district}
PHC service target group, socio-economic or geographically defined.
population
A practically defined population (please specify)
3
b) Define sub-catchment areas for different services:
Curative care
X MCH
Family planning
X TB
-3
Describe the catchment area
_3
3
2
s3
Divide into
sub-catch
ment areas
Following the definition of the catchment area, the PHC
team must identify the target population residing in the
catchment area. For example, at the village level, house
holds or individuals will be identified as the target popula
tion for specific PHC components, while at the district level
the identification will only include communities. The iden
tification process may involve gathering data from existing
sources, such as administrative records or household regis
ters (described later in this module), or may require the
Module 3: Work planning; step 1
12
collection of data through community surveys (Module 2
and Step 2 of this module).
Information for a village or community level catchment
area should include:
• number of households, or individuals residing in the area
• composition of households (or characteristics of individ
uals, including age, sex, ethnic group, mortality, morbidity,
disability)
• such socio-economic factors as occupation, income, edu
cational level
• utilities (water, sanitation facilities, electricity, telephone, TV)
• social activities
• size and terrain of area, status of roads and houses
Exhibit 2: Worksheet for describing catchment area
Level
District level
Facility level
Village level
Information
No. of facilities
Name of facilities
Name of villages
No. of villages
Location of facility(s)
Size and terrain of area
No. households
Position of HHs
Source of income
Educational levels
Religion/ethnicity
Status of houses/roads
Distance to health facility
Data sources
Government offices
Government offices
Village registers
Village registers
Village registers
Observation
Household registers
Household registers
Community surveys
Community surveys
Community surveys
Interviews and observations
Interviews and observations
For larger catchment areas, you may need to aggregate
data for several villages or communities and include such
additional information as:
• road networks, distances, transport availability and cost
• social differences among populations (e.g., female mobility)
• industry, agriculture, and environment
• listings of communities/villages
Module 3: Work planning; step 1
&
13
The preceding is an example of a worksheet that can help
you to describe your catchment area. A blank worksheet
can be found in Appendix E. The example illustrates the
types of information that may be needed to determine target
groups and to plan PHC activities for the sub-district
catchment area.
Make map(s) of catchment area
You can use maps for planning work assignments, con
ducting surveys, monitoring services, and determining the
physical parameters of service coverage. Maps can be
drawn for different levels of the service delivery system:
Map A
At the district level, showing boundaries of
sub-districts and facility catchment areas, the
location of district headquarters and surround
ing villages, health facilities and their catchment
areas, and other major infrastructure in the
district (see Exhibit 3). Map A is often available
at government offices and can be used to illustr
ate an overall scheme for the planning of a PHC
programme.
Exhibit 3: District level map - Map A
Module 3: Work planning; step 1
Exhibit 4: Health facility level map - Map B
Map B
At the health facility level, showing the
catchment area for a single health facility with
surrounding communities/villages (see Exhibit
4). Map B is particularly important for planning
activities for a community-based health care
programme or outreach service. Several maps
can be made of the catchment area for a health
facility which illustrate sub-catchment areas for
different target groups or PHC services.
Map C
At the community/village level, showing a
single community or village with roads, houses,
services such as a health post or private clinic,
water sources, waste disposal areas, and schools
(see Exhibit 5). If the houses are assigned a
number before hand, then these numbers can
also be put on the map.
Module 3: Work planning; step 1
if 111 Lw 11/ liJ LW lk' ill Lki LkJ LkJ
M
111 Hi
LkJ 11
U.J til
LkJ 'll
11 ill
ill
dll
Module 3: Work planning; step 1
Exhibit 6: Village register
Sub-district: Juhu
District: Pakhowal
Village
s.
No
No. of
house
holds
Population Local
leaders
Health
volunteers
Priority
1. Anderi
150
1.000
Nasir
Nazima
2. Ba Iowa i
20
750
Aziz
Noor
3. Sapur
172
1.500
Kasim
Roshan
93
1.200
Ramsan
Amina
210
1.075
Mehndi
Sumi
4
Deogha
5 Jalma
Distance
to health
facility
(Km)
Health problems
Public
transport
available
Being
addressed
Poor
sanitation
Low
immunization
TB. parasites
yes
10
yes
yes
15
no
no
5
yes
Low
immunization,
yes
8
yes
MCH
Low
immunization
yes
2
yes
6 Hamsa
95
450
Rustam
Naseem
Hepatitis B
no
5
yes
7. Sa han
80
900
Munwar
Bano
Low
Immunization
yes
3
yes
8.
9.
10.
11.
12.
13.
Other
remarks
Education
needed
CHW inactive
Education
needed
Need to
train local
TBA
Household
reg. to be
updated
Education
needed
Update HH
reg. training
CHW
Exhibit 7: Household register
Sector # / house # / household #: 02,90/1/2
Name of head of household: Mohammad Hossain
HH income: 3000
ID No
Name
Registration date: 23/07/1989
Occupation: Gou'i service
Centre name: Grax
Father’s/
Date of
Sex
husband’s name birth/age
*
M/F
M AH
-1926 M
DI
Hasan Alt
D2
Bibi Masyam Hasan Ali
Chronic health Date of
problem
Death
Remarks
Migration out
TB
111929 F
Module 3: Work planning; step 1
F
M Hussain
Hasan Ah
3009-1948 M
M
Sakina
M. Hossain
23-061950 F
Cl
Sikundar
M. Hossain
01-03-1967 M
C2
Lai la
M. Hossain
24 04-1968 F
C3
Zatnab
M Hossain
19-05-1970 F
C4
Khalid
M. Hossain
21-01-1974 M
C5
Seema
M. Hossain
15-02-1976 F
C6
Zahail
M. Hossain
17-09-1980 M
C7
Haifa
M. Hossain
30-07-1984 F
C8
Aaman
M. Hossain
06-02-1986 M
26-06-1990 Left for Saudi Arabia
20-09-1970
05-04-1989 Left family after marriage
15-08-1984
Risk profile of household
’ List oldest member first and youngest last
m b b m j? h m w 0 m n
Score if
present
Al least 1 child < 1 yr
1
>2 Infant deaths in past 5 years
2
Score
>2 children < 5 yrs
1
Illiterate women
2
2
Restriction on mobility of women
1
1
Presence of TB case
1
1
Low family income
1
Improper /no use of toilet facilities
1
w m 0 m n ® n 41 m nj 0 m
■ ■■■
19
as education, income, access to water and sanitation, etc. An
example of a simple standard household register and the types
of information it should contain is presented in Exhibit 7.
You can determine the size of the target population for
specific PHC services by compiling information from these
registers. Using these registers, you should be able to
calculate the number of children who need immunization,
the number of women who need antenatal care, etc. in a
given year. However if you are unable to develop household
registers in some areas because of the dispersion of villages
and communities, you should estimate the size of the target
population. For example, demographic survey or census
data of an area or country can be used to estimate the
proportion of people in the various age groups and these
proportions can be applied to the total population to
estimate the population age pyramid of the area.
Example: A demographic survey of rural Pakistan provided the following overall
estimates for the area:
• < 5 children = 15% of the total population
• < 2 children = 6% of the total population
• married women = 20% of the total population
• pregnant women = 15% of married women
These percentages were multiplied by the population in the catchment area of the
Dhabeji health facility (about 25,000) Thus the estimated target population
• < 5 children = 25,000 x .15 = 3,750
• < 2 children = 25,000 x .06 = 1,500
• married women = 25,000 x .2 = 5,000
• pregnant women = 5.000 x .15 = 750
Step 2: Identify community needs and
available resources
Skip this step if:
• Your programme has already prioritised health problems
and identified high-risk groups
• You have already completed Module 1 and/or Module 2 and
have identified community needs
Module 3: Work planning; step 2
20
Purpose of
this step
Review this step if:
• You have not identified community needs
• You have not assessed existing health services
• You wish to determine available resources
The purpose of this step is to identify community needs
based on information from records and surveys as well as
from interviews with community members to determine
their perceptions. In addition, this step also addresses the
identification of resources that will help in providing better
service. These needs and available resources can be ascer
tained from;
• the health status of the community in terms of occurrence
of disease and death,
• factors that contribute to these outcomes, e.g., crowding,
sanitation, lack of water supply, illiteracy,
• the quality and adequacy of existing health services being
provided in the area,
• available resources, such as facilities, manpower, transpor
tation, etc., needed for the effective and efficient provision
of health care.
Sub-steps to identify community needs and available
resources are described below.
• Select indicators
• Identify source(s) of information
• Develop a survey instrument
Step 1 has helped you to define and describe the catch
ment area, to develop an area map, and to compile infor
mation for a household register from a community/viliage.
This information will help you when you proceed to Step 2.
Step 2 will help you to collect the necessary data to
determine the health needs of the community and the
existing resources which could be used for the provision of
PHC services.
Select indicators
The first thing that you will need to do is to determine
which indicators are necessary to assess the health status
of the community. This information will help you proceed,
Module 3. Work planning; step 2
21
together with the PHC team and the community, in setting
priorities and determining strategies for the provision of
effective and equitable health care.
These indicators fall into two broad categories: 1) indicators
that reflect the health status of the population and 2) indicators
that reflect the perceived needs of the community, which can
often prove contrary to what other data will show.
A community’s perceived needs are often different from
what other data indicate. The information which you will
need to select pertain to the following:
1. Health problems
2. Demographic information
3. Risk factors
4. Existing health services and available resources.
Health problem indicators. This category deals primar
ily with statistics of disease (morbidity) and death (mortality).
You need to characterise health problems in terms of WHO
is affected, WHEN the person was affected, and WHERE
it happened. These characteristics can be translated into
indices to help you analyse the current situation. They also
serve as a baseline with which to evaluate future PHC
interventions. In addition, this information can be pre
sented in the form of rates (see Module 5 for details of rates,
formulae, and examples) to facilitate comparisons over time
and between geographical areas. Examples of these indica
tors are:
• simple frequencies of those afflicted by a particular dis
ease
• community perceptions of what they consider to be major
health problems
• prevalence rates, preferably by age and sex
• mortality rates, e.g., crude death rate (CDR), infant mor
tality rate (IMR), under 5 child mortality rate, cause
specific death rates, etc.
If you are interested in setting up a permanent (or
temporary) surveillance system to monitor changes in mor
bidity and mortality, see Module 4.
Module 3: Work planning; step 2
Examples of
indicators
22
Demographic indicators. This category includes popu
Break data
down by age
groups and
sex
Determine
which
indicators are
necessary
lation composition, i.e., the total number of people within
the community, preferably with age and sex distribution.
Since both age-sex distributions and sex ratios are reflected
in reproductive behaviour, disease exposure rates, and death
rates, both factors need to be considered in determining
community needs. Data should be broken down by age
group. Useful categories include: less than 1 year (infants),
children aged 1-4 years, persons between the ages of 5-14,
15-44, and those 45 years and above.
Data on the number of births and deaths are also import
ant. Birth data are needed to determine the fertility level of
the area, whereas the number of deaths reflects the health
status and health services of the area. The more important
rates are:
• Crude birth rate (CBR)
• Crude death rate (CDR)
• Total fertility rate (TFR).
Population growth can be calculated from the rate of
natural increase (births minus deaths) and the net migration
(migration-in minus migration-out). It calls the attention of
a PHC team to future problems due to an increase in
population.
A note of caution: you need to have a fairly large popu
lation - at least 50,000 - to calculate accurate rates. See
Module 2 or Module 4 for a discussion.
Risk factors. A risk factor is a characteristic pertaining to
individuals or groups that is associated with an increased
chance of an unwanted outcome such as illness or death.
Risk factors may either indicate the possibility of such an
outcome or directly cause it and form part of the chain
leading to illness or death. These risk factors may be
amenable to change in which case the incidence of a disease
will drop. However, some risk factors, such as age, cannot
be changed and, therefore, require greater care (see Appen
dix B for details on risk factors).
The impact a certain risk factor may have on determining
an individual’s or community’s health status can be mea
sured by comparing the likelihood of the unwanted outcome
Module 3: Work planning; step 2
23
in the presence of the risk factor with the likelihood of
that outcome in the absence of the risk factor. This
measure is called the relative risk. Often in health pro
grammes it is also necessary to determine the attributable
risk. The attributable risk is the magnitude of risk that can
be solely attributed to the risk factor and which would
decrease in the absence of the risk factor.
In some cases, an outcome for one risk factor may be
considered to be a risk factor for another outcome. For
example, poverty (risk factor) is associated with low birth
weight (outcome). Low birth weight in turn could act as a
risk factor for infant death (outcome). A risk factor may also
be associated with several outcomes, e.g., low birth weight
is a risk factor for infants developing diarrhoea as well as
for infant death.
Risk factors are thus categorised into the following
groups:
• Environmental: These factors pertain to an individual’s
surroundings, e.g., poor sanitation, drought, lack of water,
lack of access to clean water, type of housing structure.
• Biological: These factors are intrinsic to the individual,
e.g., age, malabsorption, malnutrition, infections, de
creased immunity, developmental abnormalities, maternal
height.
• Socio-economic: These factors pertain to income, so
cietal status of women, education, employment, etc.
Some of the most important are poverty, illiteracy, large
families, and working mothers.
• Behavioural: These factors are primarily determined by
cultural and/or religious beliefs, such as male preference,
local beliefs regarding disease causation and manage
ment, local nutritional practices, and early marriage.
• Health care related: Some of the most important are
inaccessible health services, improper outreach pro
grammes, poor quality of health care, unavailability
and/or high cost of supplies and medicines.
Existing health services and available resources.
The information included in this section deals with the type
Module 3: Work planning; step 2
Some risk
factors cannot
be changed
24
Assessing the
quality of
health service
and quantity of health services being provided, e.g., curative
clinics, number of PHC centres, number of tertiary facilities.
In addition, knowledge of the health providers such as the
TBAs, doctors, dispensers, etc., helps in determining the
ratio of health service providers to population.
Included in this section is information on how to assess
the quality of health services being provided, access to the
health services in terms of distance, and availability of
supplies, e.g., vaccines, medicines, surgical supplies. Com
munity perceptions regarding availability, accessibility, qual
ity of services, etc., are also extremely important and cannot
be overemphasised, as community members are ultimately
the clients for such services.
In addition to health care services and providers, it is also
important to ascertain other resources such as available
transportation and other human resources, e.g., school
teachers, that can be utilised for the provision of health care
to the community.
Identify source(s) of information
You need to obtain information for the indices. This
information can be found in: 1) existing data sources, 2)
interviews with people, and 3) observation.
Existing data sources: A large amount of the required
data can be obtained from records of hospitals and clinics,
national registries, results of previous surveys, household
registers (described in Step 1), etc.
Ascertaining
other data
sources
Interviews: The source in this case is the people of the
community, and information can be obtained from them
through:
• surveys conducted through structured interviews of either
all or representative samples of the community (see
Module 2 for suggestions for designing and conducting
community surveys)
• interviews of a small number of particularly knowledge
able persons from the community (key informants).
Observation: To a great extent, data can also be collected
from observing the environment and behaviour of the
people of the community. This is especially needed for data
Module 3: Work planning: step 2
25
Exhibit 8: Worksheet for determining indicators
and source of indicators
INDICATORS
1. Health status indicators
Clinical morbidity
Prevalence rates
Age-specific morbidity rates
Frequency of cause of deaths
Cause-specific mortality rate
2. Demographic indicators
Age distribution
Sex ratio
CBR
CDR
3. Risk factors
Biological
malnutrition
immunization status
Environmental
water
sanitation
Socio-economic
literacy
Behavioural
4. Health service-related
Quantity
Quality
Accessibility
distance
cost
SOURCE
Clinic/hospital records
Community survey
Community survey
Community survey
Verbal autopsy
Community survey
Verbal autopsy
Community survey
Village household registers
Community survey
Village household registers
Community survey
Village household registers
Community survey
Village household registers
MCH card
MCH card
Observation
Observation
Community survey
Community survey
Facility survey
Facility survey
Community survey
Community survey
on sensitive issues like household cleanliness, economic
status, etc.
The source to be used depends on: 1) resources and; 2) the
stage of the programme. For example, if you want to
determine community needs but are unable to conduct a
community survey, you might use existing records as your
data source. If your programme is already in place, you will
easily be able to obtain information generated from the
Module 3: Work planning; step 2
26
periodic reports. Exhibit 8 is a worksheet that can help you
to determine indicators and the source of indicators. A
blank worksheet form is provided in Appendix E.
Develop a survey instrument
You will also require detailed information about the com
munity, the health services provided, and the resources
present, which cannot all be obtained from records. For
planning PHC programmes, you will need to conduct a
survey (see Module 2) to elicit information regarding;
« the community, and
0 health facilities.
Questionnaires, such as those in Appendix C, can be
designed to provide information covering the indicators that
you have selected. These questionnaires can be modified to
suit your needs. Models of questionnaires in Module 2 can
be used through a mix-and-match method to provide you
with the necessary survey instrument. Module 2 will also
provide you with details on how to analyse the data that
you obtain from these surveys.
Modify
questionnaires
to suit your
needs
S'"
S'
esi--
e**--
§
E
E ■
S’
E
©
Step 3: Set priorities and identify
high-risk groups
E.
Skip this step if:
° You know client load per facility or provider
° You have well planned outreach and clinic-based activities
E
Review this step if:
° You have not identified priority health problems
• Your programme does not have a way to identify at-risk
individuals or families
The purpose of this step is to help in setting priorities
among health problems and in the identification of at-risk
groups so that the PHC programme can: 1) provide equitable
health care, and/or; 2) increase the frequency of services for
those in greater need. The sub-steps for setting priorities
and identifying high-risk groups are described below.
• Set priorities among health problems
Module 3: Work planning; step 3
E'
Be
K
fe
27
• Determine the risk factors
• Set priorities for the identified risk factors
• Identify target groups and high-risk groups
• Use risk factors to monitor high-risk groups
Set priorities among health problems
Now that you have gone through the process of identify
ing community health problems (Step 2) you have some
basic information in terms of the pattern of disease prevail
ing in the area and the risk factors that are prevalent. Your
next step, therefore, is to work with the PHC team, along
with the community, to prioritise the health problems.
One method of setting priorities among health problems
(Exhibit 9) is based on such criteria as;
• seriousness of the disease (e.g., in terms of mortality,
disability)
• prevalence of the disease
« feasibility of control, i.e., available technology, cost,
resource constraints
• community acceptance with respect to their perceptions
and demands.
Each criterion can be assigned a score from 1 to 4 (or any
other scale that you choose). The scores for the different
health problems are tabulated using addition or multiplica
tion and then compared and priorities are set. Multiplication
may result in a more sensitive score for comparison between
health problems if addition results in equal scores for differ
ent health problems (e.g., malnutrition, cancer, and AIDS =
10). Thus, according to multiplicative scores in Exhibit 9,
diarrhoea is ranked as the highest priority followed by
malnutrition, AIDS, and cancer. A blank form of this
worksheet can be found in Appendix E.
Determine the risk factors
You now need to determine the risk factors that are
associated with the health problems you selected to empha
sise. You will find that identifying the risk factors will help
you to develop appropriate strategies for health promotion,
Module 3: Work planning; step 3
Tabulating
scores
28
Identifying
risk factors
tion, disease prevention, and the reduction of morbidity,
disability, and mortality in high-risk groups.
In order to use the risk approach in your PHC programme,
you can make use of the risk factors determined by:
• prior research
• analysing data from your programme site.
As mentioned above, many risk factors have been identified
and carefully documented and are easily accessible through
literature. For example, your survey might have identified
malnutrition as a health problem which was later determined
to be high on the list of priorities. Data obtained by you from
the catchment area might indicate that poverty, illiteracy, poor
sanitation, and lack of antenatal care facilities are potential
risk factors. A review of the literature and prior knowledge
will help you to decide whether these are risk factors that you
should consider in the priority-setting process. Appendix B
(see also Exhibit 10 for malnutrition risk factors) provides you
with risk factors for some health problems. In this appendix,
risk factors for selected diseases are tabulated. However,
caution must be taken and critical monitoring done when
applying them to your PHC programme.
In certain situations, you may feel that you are equipped
to determine the magnitude of risk associated with a factor.
In this case you may wish to calculate the Relative Risk (RR)
and Attributable Risk (AR) (see Appendix B). Because risk
factors vary among communities, information should be
collected (see Module 2 and Module 3 — Step 2) that
identifies the relevant risk factors.
Exhibit 9: Worksheet for setting priorities among health
problems
Prevalence Seriousness Feasibility Community Additive Multipli
of control acceptance scores
cative
scores (x)
Malnutrition
3
3
3
2
11
54
Diarrhoea/
3
4
2
4
96
13
dehydration
Cancer
4
1
1
4
10
16
AIDS
2
4
1
3
10
24
Health
Problems
Module 3: Work planning; step 3
Uffl MllIlWiillBI ■ ■ WH HBMtWniWUiUWlWWirai
iaU J*)
-mJ bi!
_*j
ui! ji Ik) li Cl 11 UU U tl
lu
Lb 111 Lb Uj Lu ui ui U
Module 3: Work planning; step 3
Exhibit 10: Malnutrition risk factors
Biological
Malnutrition
• Age
• Malabsorption
• Infections
• Pregnancy-related
nutritional disorders
• Infections and disease
during pregnancy
• Decreased gut
immunity due to lack of
breast feeding
Environmental
Socio-economic
Behavioural
Health care-related
• Unsanitary conditions
• Drought
• Desert ification
• Poverty
• Illiteracy
• Large family
• Working mothers
• \/iolence/war
• Unwillingness to weigh
children due to belief in
evil eye
• Feeding boys before
girls
• Lack or improper
antenatal care
• Preference of adults
in food distribution
• Distant health care
facility
• Unwillingness to
• Drugs
weigh children due to • Lack of drugs and
belief in evil eye
diagnostic equipment
• Attributing
• Other diseases which
malnutrition to
are untreated
supernatural causes
• Inadequate use of
and not food-related
services
• Breast feeding boys
longer than girls
• Diet
• Inactivity, smoking,
eta
• Dietary beliefs
/
Set priorities for risk factors identified
Module 3: Work planning; step 3
u u> (a to tsj ta it ii di tii di u si in
After health problems and the risk factors for your
catchment population are defined, you will need to identify
the individuals or households in the catchment area who
will be the target of your PHC services, as well as those who
are at greater risk of disease and death.
Identification of priority target groups and high-risk
groups is very much related. Target groups are determined
in order to focus on persons who will require services. Iden
tifying high-risk groups helps to recognise those individuals
(households/communities) most at risk of disease or death,
whose potential for these outcomes can be decreased if they
------------------ are targeted through specific strategies aimed at reducing risk
Determining
factors. For example, the target groups identified may be
target groups mothers with children under five who are most vulnerable.
In this case the high-risk group would be those children
under five who have been losing weight for three consecu
tive months.
You will find that the identification of all individuals/households in the target groups is relatively easy if these
groups are defined by age, sex, location, or other commonly
known demographic criteria. You can obtain this informa
tion through the household registers maintained by com-
ii iii Hi
Identify main target groups and high-risk groups
,
You will now have to set priorities for the identified risk
factors through a process similar to the one you used when
you set priorities among health problems. The same criteria
can also be used here with a few modifications;
• seriousness of the factor in terms of magnitude of risk (i.e.,
relative risk and attributable risk)
• prevalence of the risk factor
• feasibility of control (i.e., available technology, cost,
resource constraints)
• community acceptance with respect to their perceptions
and demands.
Here, too, you will need to assign each risk factor a score
for each criterion and then to calculate total scores either
by addition or multiplication. You will then compare the
scores to obtain priorities for the risk factors.
& to to to m h
30
31
munity health workers or village leaders. In case there are
no household registers, other means, such as surveys, reviewing administrative records, or interviewing key persons,
information
Can be used.
from houseYou can use risk factors in several ways to identify h°>d registers
individuals or households. For example, the maternal health -----------------record card of Pakistan has an in-built risk-identifying
mechanism to track high-risk pregnant women and children
under three years.
MODEL OF MCH CARD IN PAKISTAN
The MCH card being designed for use in Pakistan, is action-oriented
and focuses on risk identification. It uses the risk approach while
monitoring the individual One side of the card has information on the
pregnant woman and the reverse for the child from that pregnancy.
The Maternal side of the card has four panels, one each for general
information, past history, present pregnancy/labour, and outcome.
Each entry has a built-in alert signal which is a shaded area and points
to a risk factor. An entry in this area anywhere on the card makes the
card holder a high-risk case and requires action.
The reverse of the card is devoted to the child from that particular
pregnancy and has a panel for general information regarding the child,
some of which is similarly designed to show risk factors (areas shaded
in red). The rest of this side has a growth chart showing a cut-off for
normal growth and undernutrition
Below this are shaded areas to
mark bottle feeding and early weaning, which are both risk factors for
poor growth.
Use risk factors to monitor high-risk groups
You can assign households a risk score based on a "risk
profile" which indicates the risk of high morbidity and
mortality of its members. This score will help in the
identification and follow-up of "risk households." The basis
for creating the risk profile is a list of risk factors. The list
can be based on literature, prior knowledge or experience,
and local perceptions. A value is assigned on the basis of
whether the risk factor is absent (0) or present (1). A total
score is calculated and compared to a rating scale which
was designed earlier. Weights can be used for risk factors
when present, if deemed necessary.
Module 3: Work planning; step 3
32
For household no. 1, which has one infant death, three
children under the age of five, an illiterate mother who is
not allowed out of the house, low family income, and low
use of toilet facilities, the risk score is 8. This household
would be considered to be in the high-risk group. House
hold No. 4 has one child under five, an illiterate mother, and
low family income but is included in the low-risk category
because the risk score is 3.
Once these high-risk individuals, households, or commu
nities are identified, PHC services can be organised accord
ing to the special needs of the high-risk groups.
Exhibit 11: Worksheet to develop risk profiles of households
CONDITIONS
SCORE IF
PRESENT
Number of infant deaths in past 5 years
Number of children under the age of 5
Illiterate mother
Cultural/religious restriction on mobility
of women
Presence of infectious diseases (e g., TB)
Low family income (below locally
accepted level)
Improper/no use of toilet facilities'
Total risk score
HOUSEHOLD NO.
1
1
1
1
3
1
1
2
1
1
1
1
3
1
1
0
1
4
0
1
1
0
1
1
0
1
1
1
0
1
0
1
1
1
8
0
6
1
5
0
3
•
•
* Weights determined by number of children
Rating scale; Low risk Moderate risk High risk
0-3
4-6
>7
Step 4: Plan PHC activities
Skip this step if:
• Your programme is already set up and you have job descrip
tions
Review this step if:
• You want to plan community-based, outreach, and/or clinic
based activities
° You do not know client load in your facility
Module 3: Work planning; step 4
33
The purpose of this step is to develop a community-based
outreach and centre-based activities plan for delivering
services. In Step 2, you identified community need and
available resources. In Step 3, you determined the number
of households and/or individuals who are at-risk or afflicted
by health problems. At this point, you need to use Module
1 to determine your goals and objectives and the type of
services required to meet the health needs of the target
population. After deciding the type of service, you must decide
what strategy will be used to provide the service, the commu
nity-based outreach, and the centre-based activities that will
need to be performed. You will also need to know the type
and amount of resources that will be required to provide the
services. If you foresee that your existing resources cannot
fulfill the need in an appropriate manner, then you will have
to decide either to mobilise additional resources or to relocate
existing resources to improve efficiency.
To carry out this step, PHC teams with large catchment
areas must have assessed community needs (Module 2
and/or Step 2 of this module), identified priority or high-risk
groups (Step 3), defined programme goals and objectives
based on the needs of the community (Module 1), selected
PHC services (Module 1), and identified strategies for pro
viding the services.
The manager, the PHC team, and the community leaders
should together plan PHC services and activities. The
following section will focus on how to plan community
based, outreach, and clinic-based activities to deliver ser
vices. The following sub-steps will need to be modified
depending on the nature of the activity.
• List services required by the community and identify the
strategies that will be used and the activities that will need
to be performed to provide these services
• Identify and plan community-based and outreach activities
• Identify and plan clinic-based activities
List services required, identify strategies and
activities
In Steps 2 and 3, you identified the community needs and
the priority groups. You, the PHC team, and the community
Module 3: Work planning; step 4
Planning
strategy
Assessing
community
needs
34
Identify the
community
health
services and
activities
leaders will now need to work together to identify (use
Module 1) and list the services that should be provided and
the strategies for delivering those services.
For example, you may have decided that you need to
provide antenatal care, growth monitoring, immunization,
and basic curative care services. You now need to decide
how you will provide these services. You need to determine:
• the overall strategy that you will use to provide each
service.
• which activities are needed to provide the service. You
may need several.
• who will perform the activities, how, and at which
level (community vs. health centre). The activities needed
to provide a service may be activities done by different
people at different levels.
Exhibit 12 is an example of a worksheet that can be used
to list services, strategies, activities, those who should do the
activity, and where and how it should be done. A blank
form is provided in Appendix E.
Once you have listed the activities, identify which are com
munity-based, outreach, and/or centre-based activities. A com
munity-based activity is performed at the community level by
community members. An outreach activity is performed at the
community level by the health centre staff. A centre-based
activity is done at the centre by health centre staff. Organising
and conducting clinics is a major centre-based activity.
The first column of Exhibit 13 shows an example of
activities that can be done at the different levels. You can
use the first column of the worksheet provided in Appendix
E for listing your activities in the appropriate category.
In the following sub-steps you will be asked to plan for
each activity separately. However since many of the attri
butes involve the same resources, it is important to look at
the package of activities as a whole when assessing the
availability of resources. Resources should be allocated to
reach an optimal level of services for those at risk and to
maintain equity.
Module 3: Work planning; step 4
2
o
Exhibit 12: Worksheet for identifying services, strategies and activities
nT
Service/component
Strategy
Activities
Immunization
Will be provided regularly
at the health centre and
periodically in the villages
through camps.
Motivate mothers
CHW
Home visits
Maintain cold chain
Vaccinator
At health centre and during
transportation with proper
carriers
Centre and camps
I
Who will do it
List
00
TL
cv
□
2
5‘
lq
co
Q
T5
Basic curative care
Community organisation
Will be provided regularly
at the health centre.
Motivate community
members to participate in
improving their own health
through regular interaction
How and when
Vaccinate
Vaccinator
Maintain records
Vaccinator /CHW
Identify and refer cases from
community
Provide treatment
CHWsandLHVs
Centre, camps and home
visits
Home visits
CHN and CHD
CHN and CHD
In health centre
In health centre
COs and CHDs
Visits to vtllages-COs
Maintain reports
Dialogue with community
members
Visit to villages
Form village committees
with them.
Select volunteers
Form area health committees
Community members and
COs
COs and CHDs
Meeting with village
committee
Visit to villages and
meeting at health facility
COs
Village health centre
Have regular meeting with:
village committees
area committees
CO
= Community organiser
CHW = Community health worker
LHV = Lady health visitor
TBA = Traditional birth attendent
CHN = Community health nurse
CHD = Community health doctor
COs and CHDs
Vac. = Vaccinator
AA = Administrative assistant
SP = Security person
Exhibit 13: Worksheet for planning PHC activities (continued, page 37)
Services / activities needed
A. Community
based
Target
group
Manpower
Frequency
Logistics / supplies
Required
Available
Type
Number
(FTEs)
Required
Available
Type
Amount
Weighing scale
ORS packets
Registers
Stationery
10
Home visits for.
Growth monitoring
Build awareness of
ORS for diarrhoea
Motivate for FP
Motivate for
immunization and
ANC
Follow-up of high risk
Referral
etc.
1.000 HHs
Regular 1/month
High-risk 1/week
more if needed
CHWs
6
Community meetings
for health education
Mothers.of 10
villages
1/month
CHW
15
Flip Charts
Deliveries
lAbmen
delivering
30/month
TBAs
1
TBA kit
Community
organisation activities
10 Villages
1/two weeks
CO
1
Bus fare
Vaccination
300 women and
children
1/month per
village
Vac.
0.5
Vhccines
Carriers
Syringes
Van
10
days/month
Superuision/support
CHW
Others
1/month per
CHW regular
LHV
CHN
0.4
0.1
Van
15
days/month
4
Optimal
level of
services
given
resource
constraints
Visit HHs with
no women and
children
quarterly, the
rest monthly
10
B. Outreach
2
o
c
co
00
I
■O.
□
2.
5'
tp
CO
= Community organiser
CHW = Community health worker
LHD = Lady health visitor
TBA = Traditional birth attendent
CHN = Community health nurse
CHD = Community health doctor
W. W (V
Vac, = Vaccinator
AA = Administrative assistant
SP = Security person
[fl
pi m i'ffi /n st
st
[OitllHMllllfH'■ ■ ■ ■ ■/■WW'MWIISIBJBS1
war MimiTiiiihiiLi ■ ■HiBiHWwwnvtwwwwwlwfi
Li!
jU
A!
laj
-A)
uAJ
jlJ
Lil
Lit
Ld.
Ill
LAla
la
Lil
lil
lii
Hl
IdJ
LdJ
aJ
txJ
lAj
Module 3: Work planning; step 4
Exhibit 13: Worksheet for planning PHC activities
Services / activities needed
C. Clinic-based
Target
group
Manpower
Logistics / supplies
Frequency Required
Available
Type
Number
(FTEs)
Required
Available
Type
Amount
Drugs (by
type)
Equipment
Van
2 days/
month
Curatiue care
1000/month
(2096 ref. to
CHD)
Every day
LHV
CHN
CHD
0.7
0.65
0.2
Antenatal care
80/month
(2096 ref to
CHD)
1/week
CHN
CHD
0.15
0.03
Vaccinations
200/month
1/week
LHV
Vac
0.2
0.4
Family planning
200/mon th
1/week
LHV
0.5
Supervision/support
Staff at centre
Regular
CHN
CHD
0.1
0.3
Management activities
meetings
PHC Team
CHW/CHN
1/month
1/month
CHW
LHV
CHN
CHD
Vac
1.5
0.3
0.1
0.4
0.1
Stationery
Register and
Form
Administration
AA
Helper
SP
1
1
1
Van
Stationery
Cleaning
supplies, etc
2
days/month
Total
CO
CHWs
TBAs
Vac
LHVs
CHN
CHD
AA
Helper
SP
1
10
1
1
2.1
1.1
1
1
1
1
Van
Cost of other
equipment
and supplies
1
0.55
Optimal level of
services given
resource
constraints
May need to bring a
volunteer from time to
time
Vaccines
Syringes
Refrigerator
Equipment
0.40
1
8
10 for 10%
2
1
1
1
1
1
Condoms
Pills, etc
May need to bring a
volunteer in to help
with FP
i
ut
Im
38
—
lai
Ul Hi
H
ii iii ini' til it*
iHi
id id
hti
iiili
id
Determine number of units to be covered. For activ
ities like health education you will have to target the entire
village while for others, such as immunization, ORT, etc., you
21
I'
In developing countries, community-based activities play
an important role in ensuring that large populations have
access to basic health care, both curative and preventive. A
number of health services originate from clinics, but fre
quently community-based workers play an important role
as a source for referrals and for the provision of basic health
care and education.
The planning of some of the community-based activities, such
as selection of CHWs, home visits, and monitoring of CHWs,
should be conducted by the community members themselves
with some technical assistance from the health centre staff.
Community-based workers need to be trained and sup
ported by the clinical staff. Clinical staff often also monitor
the high-risk individuals in the community identified by the
community health workers. Outreach activities are very
important for the success of the community-based pro
gramme and can be done through meetings with commu
nity-based workers, community meetings, immunization or
growth monitoring camps, educational sessions with school
children, and home visits. Therefore, PHC teams need to
plan their clinic staffs outreach activities as well as to
participate in the planning of the activities that are to be
carried out by community-based workers. The sub-steps to
plan and carry out community-based and outreach activities
are described below.
» Determine number of units (individuals/households/villages) to be covered for each activity
• Determine optimal time interval for each activity
• Determine resource requirements
° Compare resource availability with requirements and
identify an optimal number of visits
0 Develop tools to plan and monitor community-based and
outreach
4m' ltd
Planning
each activity
iii ill
Identify and plan outreach and community-based
activities
ldi
:
id
Module 3: Work planning; step 4
39
may target specific households or individuals. You will have
to review the household or village register or a map of your
catchment area to determine the size and location of the
target populations for various activities. If you do not have
a household or a village register or a map, you should review
Step 1 for how to develop them.
Selecting
targets
Determine optimal time interval for each activity.
You will need to decide an optimal time interval for each
activity. For example, you may decide to conduct a com
munity-wide health education session once every three
months, while immunization services will be offered in a
village once a month. In some communities, monthly home
visits may be needed, while in others, quarterly visits may
be enough. Information from past experience, literature
reviews, and/or operational research could be used to deter
mine the frequency of visits that would be required to meet
community needs.
Determine resource requirements. For each activity,
you should determine the type and quantity of resources
required. For example, health education may be provided
by a community nurse, while contraceptive supplies could
be provided by community health workers. In this section
we will focus on how to determine staff requirements;
however, the same method can be used for other resource
requirements (for example a vehicle). Exhibit 14 formulae
can be used to determine the level of staff effort required for
each type of activity (for example, home visits) over a
specific time period.
Before you do the next step, you need to determine the
availability of resources. When calculating availability, keep in
Exhibit 14: Worksheet to determine staff requirements
Staff capacity per month - days/month x number of units that can be
covered/day per worker
Staff requirement - units to be covered/staff capacity
Note: When determining the number of units that can be covered for one type of
activity in a day, take into account the time it takes to effectively cover the unit for
that activity and travel time if needed.
Module 3: Work planning; step 4
Ito
40
Compare resource availability with requirements
and identify an optimal number of visits. In the last
tJi
If the total is one, all units can be covered every month.
If if is more than one, a special strategy is needed.
w
No. units/(staff capacity x No. of staff available)
= frequency of doing the activity
wl
sub-step, you determined the number of staff needed to
perform a particular activity in a specific time period. If the
existing staff is unable to cover every unit (village/household/individual) during the time interval, then you should:
• increase the time allocated for doing the activity;
• hire additional staff; or
• substitute resource intense activities with less resource
intense activities. For example, use group sessions as a
substitute for frequent home visits. However, focus on
high-risk groups/individuals should not be neglected.
You can use the following formula to determine the total
time (in months) needed to cover every unit in the catch
ment area:
ii ui ui tii tit, iul & & Hi idi Ei y
For example, if you were planning LHVs outreach support visits:
Number of villages in catchment area: 50
Frequency for visiting each village: once a month
Number of working days per month: 25
Number of villages that can be visited per day per LHV: 1
Staff capacity per month = 25 X 1 = 25 per LHVs
Staff requirement = 50/25 = 2 full time (FTE) LHVs
ill lii Aii
mind other activities which need the same resources. For
example, a health worker may need to conduct community
meetings, health education sessions, and immunization ses
sions in addition to home visits (see Exhibit 13). Personal
leave and administrative duties should also be considered
when determining availability. Since you need to see the
whole package of activities when allocating available re
sources, it may be a good idea for you to do the first three
sub-steps for all activities before you do the next step. An
example of the results of this process is shown in Exhibit
13. A blank worksheet form has been provided in Appendix
E for you to use.
B
Module 3: Work planning; step 4
41
For example, for planning home visits if:
Number of households = 600
Days/month = 20
Number of households that can be visited per day per worker = 5
Capacity per month per worker = 20 x 5 = 100
Available health workers = 4
Time to complete routine visits = 600/(100 x 4) = 1.5 months
Therefore, with the existing number of workers, it would take 1.5
months to visit every household.
In the example above, if each household could be visited
quarterly instead of once in 1.5 months, the remainder of
the outreach time could be used for high-risk cases, which
could be followed up monthly or weekly. However, if it is
felt that regular monthly visits are essential to meet the
needs of the community, two more workers will need to be
identified and trained.
In some situations the above method may not be useful
for community-based workers since they are often volun
teers and are not always available. In such a case, each
worker should be asked how much time she/he would be
able to give. This will help you to determine the number of
households/individuals she/he can monitor and the total
number of workers that will need to be selected and trained.
If there are not enough available volunteers, then the
frequency of visits/service may have to be decreased.
Develop tools to plan and monitor community
based and outreach activities. This step is the basis for
developing individual work plans in Step 6 and for assessing
performance in Step 7. Activity registers or lists of target
groups can be used to plan community outreach services
and to follow up high-risk cases. Some activities which are
done once a month, such as community meetings, may not
need a separate tool. A work schedule (see Step 5) can be
used to plan such activities. Activities such as immunization
camps need a list of villages, a map, and a schedule.
Supervisors can use supervisory checklists (Modules 5 and
6) to identify gaps in the quality of services being provided
by the service providers and to identify training needs. Five
models of tools for planning and monitoring community
based and/or outreach activities will be presented in this
section as examples.
Module 3: Work planning; step 4
Develop
individual
workplans
42
• CHW activity register — used by the Urban PHC
Programme of the Aga Khan University in which families
are visited on a monthly basis (see Exhibit 15).
• Pictorial CHW activity record — a part of it is
extracted from the record used by the Mombasa PHC
Programme of the Aga Khan Health Service, Kenya (see
Exhibit 16).
• Pictorial TB A activity record — not tested any where
as of yet (see Exhibit 17).
• LHV activity register — not tested anywhere as of yet
(see Exhibit 18).
• Target lists of women who need immunization — used
by the Aga Khan Community Health Programme in
Bangladesh (see Exhibit 19).
These formats can be adapted and used in various situations.
Module 3: Work planning; step 4
43
MODEL 1: AKU URBAN CHW ACTIVITY REGISTER FOR
MONTHLY HOME VISITS
At present, the CHWs in AKU’s Urban PHC programme focus their
attention on married women with children less than three years old.
Growth monitoring of children less than three years is done every
month. The CHWs list all the households, children, and married
women in their target area in the household register once a year and
update it during their home visits. The CHW also records information
about their activities (households visited, children weighed) and target
population (births, deaths, age, weight change, nutrition status, im
munization status, diarrhoea cases of children under five years, last
menstrual period, pregnancies, use of family planning, and immuniza
tion status of married women) during home visits. The CHW uses the
register to:
• plan her home visits and monitor the health status of the
target population,
• identify and monitor the high-risk women and children
• record and aggregate information to see if changes are
occurring over time and thus,
• revaluate her own performance.
The supervisors use the register for identifying problems and for
supporting the CHWs. The register is also used for summarising
information and preparing quarterly reports for management purposes.
The CHW has visited (columns 11-13) all seven families, 12
children, and eight women listed on this page in January and
March. In February, she visited six out of the seven families.
• She weighed and recorded weight change from one month to
the other (+ = increase, 0 = table, and — = decrease) of children
less than three years of age in January, February, and March
(columns 6-8). She must focus her attention on two children—
child C2 in House No. 245 has lost weight three times in a
row and child C4 in House No. 248 has not been putting on
weight and is a second degree malnourished child.
• Household 248 seems to be a problem household as all the
children seem to have nutritional problems and immunization
does not seem to be given importance.
• Three of the married women are pregnant (Household Nos.
243, 245, and 248).
• One woman has delivered a baby (house No. 243) during the
month of March and may need follow-up by a nurse. Her
other child seems to be neglected.
A model of the CHW activity register with instructions on
how to fill it is provided in Appendix D.
Module 3: Work planning; step 4
Exhibit 15: CHW activities register (continued, page 45)
W\
Children < 3 years
Srs.
Household ID No.
No.
Age
Newly identified birth
(Jan.-Mar.)
Live
(1)
(2)
(3)
m
Wt.
(5)
"Nut St ***lmmSt
• Wt.
• Wt.
’ Wt.
Ch
Ch
Ch
(6)
<7)
(8)
(9)
«1)
(10)
C5
2.1
10.5
—
N
c
C2
C3
8.3
+
0
I
I
c
1C
03
244
C6
2.7
NB
21
0
—
0
243
11.2
C2
C3
+
_
0
NW
—
—
IC
245
+
—
+
N
04
N
N
1C
A
05
246
C4
C5
—
—
+
0
I
I
c
c
06
247
+
0
0
+
—
—
—
—
c
248
Cl
C4
C5
C6
II
07
II
I
I
IC
IC
N
x
x
+= 7
0= 0
-=4
NW = 0
+=3
0=4
-=3
NW = 0
+=1
0=6
-=3
NW = 1
N=4
1=6
11 = 2
111 = 0
C=5
A=1
1C=5
N=1
WEIGHT CHANGE
r = Increase in weight
3 = Same weight
- = Decrease in weight
m r® w
12/3
2.4
1.8
0.8
2.9
1.8
2.6
10.4
8.2
10.1
8.3
8.5
2.1
1.1
0.2
12
7.6
8.0
3.4
00
m m
DT
242
Total
w
ro
BW
01
o
□
CD
Still
DT
March
Feb.
02
2
ST
a
□_
Jan.
1
BW = 1
LBW = 1
+
_
" NUTRITION STATUS
= Normci
I
= First degree malnourished
II = Second degree malnourished
III = Third degree malnourished
NW = Not weighed
N
ai w rm ip p
m wi m n?i m jfi ep g® ?® g® «$
■ffl in tKwiai
*
Watt ■ rirt'W ywiiiiitoisiiMiijjiBMi
rata m fflinintaiB
kij
d) 'ui d) d) U1 L*J Ii w li L li ii iJJ U1 iil Lu Lii Uj LU iti m li.
2
o
Exhibit 15: CHW activities register
ig; step 4
01
(11)
(12)
(13)
12/1
15'2
18/3
12/1
14/2
18/3
03
13/1
14/2
12/3
04
13/1
14/2
12/3
05
10/1
12/2
13/3
06
10/1
10/1
7
PR
PR
FP
PR
All
DLVD
(15)
(16)
(17)
(18)
(19)
(20)
(21)
(22)
M
8
IC
M
3
C
M
5
IC
M
6
IC
M
3
IC
IC
M
M
5
IMMUNIZATION STATUS
C = Complete
IC «= Incomplete for age
A = Appropriate for age
N = No immunization
NB = Newborn
6
C
7
8
4
5
C
25/12
6
13/3
13/2
6
13/3
7
Number
of
family
members
(14)
4
07
ID No
ID No.
DI
02
"’Immunization
status
March
Feb.
Jan.
O
Jan-Mar.
Mar.
D>
3
5.
5'
Married women
Deaths
Feb.
Jan.
1
2
3
1
C=3
1C=5
N=0
Birth weight
BW
Low birth weight
LBW
Pregnancy month of pregnant woman
PR
DLVD - Women who have delivered during the quarter
Family planning
FP
Date
DT
ii ii n
Work p
Srs.
oo^
Date of visits
^c5o
00
Cl
8
36
46
E
MODELS 2 AND 3: PICTORIAL CHW AND TBA
RECORDS
In some rural areas the TBAs and the CHWs are illiterate or
semi-illiterate. In such cases, these workers can use pictorial
records to plan and monitor their activities. However, recording
should be kept to a minimum, and only those indicators that can
be used by the workers themselves or the community should be
on the record.
An example of a pictorial CHW record is presented in Exhibit
16, and a TBA record in Exhibit 17. In developing pictorial records,
the end users should be involved because pictures should be
culturally sensitive and should be understood by the local people.
E
E
ET
a
I—“
r®-'-
E5t
B
MODEL 4: LHV ACTIVITY REGISTER
LHVs need a tool to plan their outreach services. Their outreach
activities often include support visits or training sessions for
community workers, meetings with CHWs or other community
members to plan community-based services, home visits to highrisk individuals, and group health education, growth monitoring,
and immunization sessions.
An example of a register she can use to monitor and plan her
outreach activities has been provided in Exhibit 18.
MODEL 5: COMPUTER-GENERATED LISTS
In project areas where it is feasible and cost-effective, computer
generated lists of default or high-risk cases can be used for
planning and conducting outreach services. Exhibit 19 shows a
list of women who need tetanus toxoid immunizations. This
format is currently being used by the Aga Khan Community
Health Programme in Bangladesh.
Some advantages of computer lists include the following:
1) they eliminate the burden of having to create the lists manually
and maintenance can be relatively simple,
2) the accuracy of the information may improve because comput
ers can reduce human error in the manipulation of data, and
3) computers can also aggregate information and generate differ
ent types of indicators for the different levels of workers and
managers.
Module 3: Work planning; step 4
£•
E
*
g
47
Exhibit 16: CHW activity record (continued, page 48)
Name of CHW:
Village:
INSTRUCTIONS: Fill one circle for every case seen.
Module 3: Work planning; step 4
Month.-
48
Exhibit 16: CHW activity record
Module 3: Work planning; step 4
49
Exhibit 17: TBA monthly record (continued, page 50)
Year:
OOOOO
Month:
Division:
_
Deliveries assisted QQQQQ
TBA name:
Abortions
ooooooooooooooooo ooooooooooooooooo
ooooooooooooooooo ooooooooooooooooo
Antenatal visits QQQQQ Family planning accepted
ooooo
ooooooooooooooooo ooooooooooooooooo
ooooooooooooooooo ooooooooooooooooo
Postnatal visits
Low birth weight
ooooo
ooooo
ooooooooooooooooo ooooooooooooooooo
ooooooooooooooooo ooooooooooooooooo
OOOOO
Antenatal referral QQQQQ
OOOOOOOOOOOOOOOOO
Full term
OOOOOOOOOOOOOOOOO
ooooooooooooooooo ooooooooooooooooo
INSTRUCTIONS: Fill one circle for every case seen
Module 3: Work planning; step 4
50
Exhibit 17: TBA monthly record
Year.
Month:
TBA name:
Division:
Postnatal referral QQQQQ
Pre- term
ooooooooooooooooo ooooooooooooooooo
ooooooooooooooooo ooooooooooooooooo
ooooooooooooooooo ooooooooooooooooo
ooooooooooooooooo ooooooooooooooooo
ooooooooooooooooo ooooooooooooooooo
ooooooooooooooooo ooooooooooooooooo
Puerperal fever
First week deaths
ooooo
ooooo
ooooooooooooooooo ooooooooooooooooo
ooooooooooooooooo ooooooooooooooooo
INSTRUCTIONS: Fill one circle for every case seen.
Module 3: Work planning; step 4
uj Uj Lb m Ui Lb Uu Lij k U & li k ill
u
Module 3: Work planning; step 4
Exhibit 18: LHV activity register
Name of LHV: Naseem Ali Hyder
Date Village
Mosa Goth
3
Babu Jo Goth
4
Ali Goth
5
Allah Goth
6
Nathan G.
9
Palijo Goth
10
ShahjoG.
11
Juman Jo Goth
12
Shahi Goth
13
Shams Goth
M
Mhmd Goth
A v
><s
ikjHii Vi & k
Month: November
Purpose of visit
Actions taken
Support Training Meeting
visit
session CHWs Com
munity
2
li)
X
Visit
high
risk
Sessions on
IMM
GMP Health
education
Others
No. of
(specify) participants
or persons
visited
X
X
X
X
X
X
X
X
X
X
X
X
X
X
X
X
X
X
X
X
Meeting
with TBA
and
teachers
MCHW =
VHP
=
9 Health talk given to
3 pregnant women and
diet info to Ill degree
malnourished child’s
mother
TS
SCMP
=
=
12
7
SV
=
3
CM
=
10
VHR
SI
=
=
2 Full term pregnant
11 with fits, refer to
hospital
SHE
=
12
TS
MTBA
=
=
10
6
SV
TS
VHR
=
=
=
3
13
3
MCHW =
MC
=
SIMM
=
9 Immunized women
8 who were present in
15 the session and had
not rec'd any
TS
VHR
=
=
10 Gaue health talk to
3 pregnant women
MTBA
VHR
MT
=
=
=
6 Prepared and gave
3 food to the III degree
5 malnourished child in
front of his mother
52
Exhibit 19: Target list of women to be immunized
Reg.#
Name
Age Preg TT1
nant
90001A Shahida Akhtar
90002F Shohida
90008F Husnera
90009A Fatema Begum
90012C Nurjahan
90013A Razia
90014F Monni
90015A Nayama Chowdharv
90016D Mazeda Chowdhary
90017C Halima Karim
90018D Ruma
90019A Runa
90020A Rita Ahmad
90021A Arifa Ahmad
90022C Jiauan Naher
90024F Rupaili
90025A Meheri Banu
90031A Nagwa Mata
90035A Fatema Bebum
90037A Jesmin Suitanta
90038A Hushneara
90043S Rezia
90047S Jaahanara
90048S Bebum
90049A Almina Arahiim
90050A Shilashen
90051A Farhana Karim
90052A Afsana
90055D Shana
90059A Rubina
90067A Shanjida
90070S Momitaz
90073A Peyara
90075A Shahida
18
36
15
25
27
18
19
45
34
25
27
23
45
34
24
34
23
33
23
34
19
17
23
24
16
23
19
34
27
46
19
17
25
31
Y
Y
N
N
N
N
N
N
N
N
N
Y
N
N
N
N
Y
N
N
N
N
N
Y
N
N
N
N
Y
N
N
N
N
Y
Y
N
Y
TT1
Date
/ /
/ /
/ /
/ /
/ /
/ /
/ /
/ /
/ /
02/31/91
/ /
/ /
/ /
/ /
15/01/92
/ /
/ /
/ /
/ /
/ /
01/01/90
/ /
/ /
/ /
/ /
20/03/91
/ /
/ /
/ /
/ /
/ /
01/01/89
10/06/91
/ /
TT2
N
N
Y
Y
Y
Y
TT2
Date
/ /
/ /
/ /
/ /
/ /
/ /
/ /
/ /
/ /
/ /
/ /
/ /
/ /
/ /
/ /
/ /
/ /
/ /
/ /
/ /
10/01/90
/ /
/ /
/ /
/ /
30/06/91
/ /
/ /
/ /
/ /
/ /
/ /
/ /
/ /
Booster Booster
Date
Y
Y
N
N
/ /
/ /
/ /
/ /
/ /
/ /
/ /
/ /
/ /
/ /
/ /
/ /
/ /
/ /
/ /
/ /
/ /
/ /
/ /
/ /
15/02/92
/ /
/ /
/ /
/ /
01/10/92
/ /
/ /
/ /
/ /
/ /
/ /
/ /
/ /
Identify and plan clinic-based activities
The planning of clinics is an essential part of a PHC
programme. It serves the purpose of supplementing field
based preventive services by providing a back-up referral
together with centralised preventive services.
It is also important to determine the types of services
which are or will be in demand. Examine the services which
Module 3: Work planning; step 4
&
53
are offered at the clinic and compare them to survey results.
Are the community’s perceived needs being met by the
services offered? Are there other services/schedules that
would better serve the population?
You should use the second half of the worksheet (Exhibit
13) to complete this step. The sub-steps to plan clinics are
listed below.
• Determine client load
• Determine staff capacity and resource requirements
• Determine availability of resources
• Compare availability with need and identify an optimal
solution
• Develop tools to plan clinic-based activities
Determine client load. You should project utilisation or
demand for various PHC services for a specific time period
(month, year, etc). You can base your projections on clinic
records from recent years or on community surveys. Keep
in mind that demand for services can be influenced by many
factors internal and external, to the PHC programme. For
example, a new mass media initiative, a social marketing
programme, the establishment or closure of another nearby
clinic, or a new market place can all positively or negatively
influence demand in your area. Some influences cannot be
foreseen, so you should plan within a range. Once you are
satisfied that your range realistically reflects the current
situation and foreseeable influences, this information can be
used to estimate requirements for manpower, equipment,
and supplies.
You can calculate demand for services or project client
load using the following two methods:
Method 1 - The average number of patients/clients expected to come for
the various services in a given month can be determined from past records
and/or community surveys (Module 2).
Example: If there are 200 pregnant women in a catchment area and past
records show that 30% of them come for ANC on a monthly basis, 10%
come occasionally, and the rest do not come, the expected ANC visits for
the month would be between 60 to 80.
Module 3: Work planning; step 4
54
Method 2 - Some people recommend that an arbitrary figure of one adult
visit and three child visits per person per year can be used to calculate the
clinic load.
Determine staff capacity. Looking at past experience,
one can determine on an average how many patients/clients can be seen by the service provider on any one day for
the various services. Using this average, the number of clinic
days needed for the services can be calculated.
Example: If from past experience we see that a CHN or an LHV takes
about 15 minutes to see one ANC case, and that 20% of the ANC cases
seen by an LHV or a CHN have to be referred to a doctor, and that the
doctor takes about 10 minutes to see a referred cases, then to
see 80 cases in a month we would need;
LHV/CHN’s time:
Doctor’s time.
4 cases/hour at 15 minutes/case
4x8 hours = 32 cases/day
80/32 = 2.5 days
6 cases/hr at 10 minutes/case
20% of 80 = 16 patients
16/6 = 2.7 hours
Determine resource requirements. The average yearly
requirements for drugs, supplies, and other resources can
also be determined using past experience. You should
determine the average requirement per case and then de
termine the current year’s requirements based on your
projection of client load, which was calculated in the previ
ous step. For example, if you determine that the clinic will
receive an average of 200 family planning clients per month
Module 3: Work planning; step 4
IB
111
Look for patterns of fluctuations in client load by days of
the week, months, or seasons. For example, market days,
religious periods, or planting seasons may prevent clients
from seeking service. You should make optimum use of your
resources by making them most available when demand is
highest. Try to plan other non-service activities, such as
training or inventory, during these low demand periods.
Isl
Example: If the catchment area population consists of 9,000 adults and
1,000 children, the total number of visits at the clinic per year would be:
9,000 adults x 1 visit/person/year =
9,000
1,000 children x 3 visits/child/year =
3,000
Total clinic load (#visits/year)
=
12,000
55
who require (based on last year’s demand) 144 condoms per
client per year, your projected yearly requirement would be
about 2,880 (200 clients x 144 condoms/client/year).
Again, keep in mind other factors that which could increase
or decrease your estimated demand.
Determine availability of resources. When determin
ing availability of resources, keep in mind all health services
as they often involve the same resources. For example,
besides seeing patients, a nurse may supervise/support field
workers, make reports, etc. Different clinics often must be
run in the same limited space, making lack of space a
problem. Therefore, different clinical services (ANC, im
munization, curative care, etc.) may have to be provided on
separate days and the availability of resources may have to
be determined by the day of the week.
Compare availability with need and identify an
optimal solution. The optimal solution is one that best
addresses the service need, given the resources available.
You should not expect to meet 100% of the need but should
look for ways to adjust your service delivery to meet as much
of the need as possible without sacrificing the quality of your
programme. These adjustments may be long-term (if funds
are not available), while others may be short-term (if, for
example, trained workers are not available and the training
can be done in a few months).
Example. In the example shown in Exhibit 13, 80 ANC cases per month
are expected, and if staff capacity is as shown, 15% (three days) of the
CHN’s time and 3% (five hours) of the doctor’s time will be needed to see
these cases. Looking at all the other activities of the staff, the CHN is
available for three days and the doctor for five hours in a month to see
ANC cases; therefore, there is no problem. However, if they were not
available, the reasons would have to be identified and the solutions found.
Funds may be available to hire only one LHV rather than two, and the
CHN may have to spend time supervising the CHW; therefore, compromises
would need to be made. Outreach programmes could be decreased, volunteer
manpower could be identified, or curative care clients could be referred to
other centres, etc.
If trained manpower is not available, local manpower could receive
more training, etc.
Module 3: Work planning; step 4
56
WifflllilW ■
ti m di in i» it u> a w
U i*iUB t t■fBfB(BiW)W)i
a a tta lia it
Module 3: Work planning; step 4
Ila lii w lb
Develop tools to plan clinic-based activities. The
final step in the planning process is to develop tools to
record information which can help in the monitoring pro
cess as well as in the making of future decisions. The
information needed for clinic-based services could contain:
• A weekly timetable: (See Step 6). This can be devel
oped based on expected patient load for a particular
service and the availability of personnel.
• Individual medical records: The record gives the
health provider the information he needs for patient care.
It often has two formats. The first is for each encounter
(see Exhibit 20), and the second summarises all of an
individual’s encounters (see Exhibit 21). Blank forms are
provided in Appendix E.
• Daily clinical treatment record: (See Exhibit 22).
This can be designed to show the general profile (age, sex,
diagnosis, etc.) of all clients who visit a clinic each day. It
helps to determine client load in a specified period. The
pattern of diseases or the services that people require will
be demonstrated through this format. A blank form is in
Appendix E.
• Drug dispensing form: (See Exhibit 23). This lists the
drugs available at the centre at the the beginning of the
month (which is the balance left over from the previous
month), the amount received during the month, the
amount dispensed on each day of the month, and the
balance at the end of the month. A tabulation at the end
of the month would help to determine the type of drugs
and quantity needed for the following month (see Appen
dix E for a blank form). A similar format can be used as
a daily record with the amount dispensed against each
patient if needed.
Similarly, records could be developed for other issues that
the PHC team or manager identify as crucial to setting up
and monitoring a programme.
57
■3
Exhibit 20: Individual medical record
3
tWU
J iki dJ A
) ikl
3
3
3
3
-3
■3
INDIVIDUAL MEDICAL RECORD
Name-.
1. History:
2. Physical examination:
3.
(Fill this form for every encounter)
Date of visit:
T:____
Assessment:
Investigation:
■3
■3
3
3
3
3
Module 3: Work planning; step 4
P:____
BP: ___
R:
4. Plan:
Treatment:
58
Exhibit 21: Individual medical record
Household #:
Individual ft-.
Patient Name:
Date of birth;
Past history:
Medical record#: (for unregistered only)
Father/husband name.
Sex (M/F):
Diagnosis
Height:
Hospitalisation
Weight:
Medication
Drug allergies: Y/N (specify):
Family history (check appropriate boxes):
Hypertension_______ Diabetes________ TB________ Others_______
Personal history (check appropriate boxes):
Smoking__________ Alcohol______ Drug use__ ____ Occupation__
VISIT DATES
1 Tuberculosis
2 Polio
3 Diphthena/pertussis/tetanus
4 Measles
5 Mumps
6 Malnutrition
7 Diarrhoea/dysentary
8 Intestinal parasites
9 Hepatitis/jaundice
10 URTI
11 Pneumonia/bronch. (LRT1)
12 Other LRTl/asthma
13 Skin problems
14 UTI
15 Fever > five days
16 Pregnancy-related problem
17 Anaemia
18 FP complications
19 Gynaecological problems
20 Hypertension/ischaemic
21 Diabetes
22 Musculoskeletal disorders
23 Mental illness
24 Dental problems
25 Eye problems
26 Errors of refraction
27 Ear problems
28 Accidents/) njuries
29 Handicaps
30 Other
Module 3: Work planning, step 4
59
Exhibit 22: Daily clinical treatment record
Name of clinic? Mt. Vernon
Household No./Reg. No.
ID if.
Sex? M/F
Age Years > 1
1-5
6-15
16-49
Over 49
Routine ANC
Routine well-baby
1 Tuberculosis
2 Polio
3 Diphtheria/pertussis/tetanus
4 Measles
5 Mumps
Other diseases
6 Malnutrition
7 Diarrhoea/dysentary
8 Intestinal parasites
9 Hepatitis/jaundice
10 URTI
11 Pneumonia/bronch. (LRTI)
12 Other LRTl/asthma
13 Skin problems
14 UTI
15 Fever > 5 days
16 Pregnancy-related problem
17 Anaemia
18 F. R complications
19 Gynaecological problems
20 Hypertension/ischaemic
21 Diabetes
22 Musculoskeletal disorders
23 Mental illness
24 Dental problems
25 Eye problems
26 Errors of refraction
27 Ear problems
28 Accidents/injuries
29 Handicaps
30 Other (Specify)
Date-28 Nov, 1992
1
146
238
F
Registered
2
3
4
128 62
243
216 45
306
M
M
M
X
X
MO/CHN: Pamela
5
416
610
F
6
24
47
F
7
518
618
M
X
X
X
8
661
721
F
9
84
96
F
X
X
X
X
X
Module 3: Work planning; step 4
X
X
X
X
X
X
X
X
X
X
10
Total
M=4
F=5
2
3
3
1
3
3
3
1
X
2
Exhibit 23: Drug supply record (continued, page 61)
Name of centre:
1
Acetyl Salicylic Acid Tab. 300 mg
2
Aluminum and Magnesium Hydroxide Tabs.
3
' 4
Aminophyllin lab. 100 mg
Previous
balance
Rec’vd Total
Issued Balance Cost
Date
Benzyl Benzoate 25% solution
Betamethasone Cream
5
6
7a
Buscopan 10 mg labs.
Chloramphenicol Eye Ointment
7b Chloramphenicol Syrup
7c Chloramphenicol Capsule
7d Chloramphenicol Eye Drops (Btls)
8a Chloroquin Syrup
8b Chloroquin Tab. 250mg
9a Cotrimoxazole (Double strength)
9b Cotrimoxazole Syrup
10 Chlorpheniramine Tabs. 4 mg
Diazepam 5 mg. Tabs (Relaxipam)
11
12a Ferrous Sulphate Tabs. 200 mg
12b Ferrous Sulphate Syrup
13 Folic Acid labs. 5 mg
2
o
c
CD
CO
14
Gradinal Sodium 'labs. (Phenobarb)
15
Gentian Violet 1% Aqueous Solution
Mefanamic Acid Tabs. (Ponstan)
16
m
is,
in
m ® sa ren m /m
IS]
in cp
M ffl
M
(0 ill III
5T
5T
fill iff WWTMlViH ■BaiBllilllil'ililWmWWl l
bJ
ju j*)
uu'
uii uii ui] Lil! lii
Li! ii
Module 3: Work planning; step 4
Previous
balance
17
Metronidazole Syrup
17a
Metronidazole Tab. 200 mg
Neomycin and Bacitracin Oinr. Skin 15 mg
18
19
20
21
Nystatin Vaginal Pessaries
Nystatin Oral Drop (Nilstat)
25
Pyrantel Pamoate susp.
Theophyllin Syr. 150 mg/ 5 ml
Whitefield's Ointment in kg
Lail bi bit bil Li) UJ til tjJ Lil U1 Lil Utl lit
Rec’vd Total
Otosporin Ear Drops
Oxytetracycline lab. 250 mg
22
23a Paracetamol Tab. 500 mg
23b Paracetamol Syrup
24a Phenoxymethyl penicillin labs. 250 mg
24b Phenoxymethyl penicillin Syr. 250 mg
26
27
SIGNATURE OF ADMINSTRATIVE ASSISTANT/CLINICAL ASSISTANT:
Date
Issued Balance Cost
til til di
La
U,
f l Ul O III & I*
lit
&t Vi
d &
Review this step if:
• Your job descriptions are out of date
• They are not on a programme list
The purpose of this step is to translate the plan for PHC
activities (developed in Step 4) into roles and responsibilities
for individual staff. This is done by first developing a "role
and tasks" list from the service plan. This list describes the
tasks for each staff position and the experience and skills
required. Next, the "role and tasks" list is used to develop
job descriptions for each position. After these job descrip
tions are reviewed and approved, they can be "posted" or
advertised as "job announcements." Candidates can then be
recruited, interviewed, screened, and selected according to
your organisation s regular procedures. The purpose of a job
description is to:
• Describe the roles and tasks that staff need to carry out
to help the programme achieve its objectives;
• Identify the experience, skills and knowledge needed to
carry out the tasks; and
• Ensure that management and staff have a mutual under
standing of these expectations.
Sub-steps for developing a job description and recruiting
staff are listed below.
• Develop a "role and tasks" list
Identify programme activities/tasks for each staff position
Identify skills/experience needed for each staff position
• Prepare job descriptions
Assignments, tasks
Personal skills/experience requirements
'\U AH El
Skip this step if:
• Your programme is already set up and you already have work
plans for each staff member
lb
Step 5: Develop job descriptions and
recruit staff
iK3 111
62
Sfi
Module 3: Work planning; step 5
63
• Post job announcement and recruit, screen, and select
candidates
• Agree with selected candidates on role and task expectations
Develop role, tasks and skills list
The first step is to translate the programme plan for clinic
and outreach services into staff assignments. Programmes
are usually subdivided into components (ORT, ANC, planExhibit 24: Role and tasks list
PHC programme goals:
1.
To improve the health status of mothers and children of under five years of age.
2.
To reduce the IMR by 10% in two years.
Service objectives:
1.
To increase the children in the normal category by 20% in two years.
Strategies:
1.
Growth monitoring during monthly home visits.
2.
Vaccination of children and married women.
3.
Provision of health education on family planning, breast feeding, control of
diarrhoeal diseases.
Position
title
Role
CHW
To provide services During home visits and at
and monitor
PHC educate and promote
women and
health by
children in her
> growth monitoring
assigned target area. > health education;
Tasks
* nutrition
’ use of ORS solution
' breast feeding
immunization
’ family planning
’ personal/public cleanliness
’ identifying at-risk patients
and referring to PHC
programme
> recording/compiling info on;
family folder
growth cards
" CHW daily activity register
Module 3: Work planning; step 5
Experience
Abili ty/skills
Not necessary but
know community
dynamics
Communication
skills. Interest
in conducting
health
education
sessions
64
Position
title
Role
Tasks
Experience
Ability/skills
CHN
Training, super
vising and sup
porting the CHW
in providing both
preventive and
curative health care
and assisting them
in providing basic
health services
> Provide services-.
* vaccination
* family planning
* basic curative care
* antenatal care
> Supervise CHWs and TBAs
by doing home visits
> Assist in continuing
surveillance through MIS
> Provide on-the-job training
and continuous education
to the CHWs and mother
Two years
experience in
community work
Conduct health
education.
Know local
languages
CHD
Co-ordinate and
monitor the
performance of the
entire PHC
programme and
formulate action
plans
> Provide integrated maternal
health care
> Identify and analyse the
present health problems of
the community
> Set goals, prepare plan of
action and implementation
strategies
> Liaison and maintain co
ordination with the
community leaders, govt.
and non-govt. agencies for
designing, implementing and
maintaining community
based primary health care
> Monitor progress by using
information collected
through the MIS and
prepare annual progress
report.
> Provide ambulatory care
6 month house job in
‘ medicine
’ paeds
* obs/gyn
Conduct health
education.
Attend
community
meetings
Some experience
working with
community
> Organic continuing
education programmes
ning, etc.), which are subdivided into activities and tasks.
These tasks are the basis for developing job descriptions.
Exhibit 24 illustrates a role and tasks list that management
can use to produce this information. Notice how it includes the
programmes goals, service objectives, and service strategies.
tn
Module 3: Work planning; step 5
65
This is included to ensure that management defines roles
and tasks that are consistent with the programme’s goals,
objectives, and strategies. A blank worksheet is found in
Appendix E
Prepare job descriptions and do feasibility checks
The next step is to develop individual job descriptions for
each position, drawing on the roles, tasks, experiences, and
skills summarised in the role and tasks list.
Most agencies have their own formats for job descriptions,
and the roles, tasks, experience, and skills can be adapted to
fit within any particular format. Exhibit 25 illustrates an
example of a job description for a CHW position (see Appendix
E for a blank form). Before these job descriptions are finalised
and submitted for approval, it is a good idea to conduct a
"feasibility check" to make sure that the tasks are feasible and
the requirements are realistic. Some test questions are shown
below.
• Does the job description adequately reflect programme needs?
• Does the job description include all necessary activi
ties/tasks?
• Is the projected workload reasonable?
• Are suitable candidates available?
• Are they likely to apply, given the terms and conditions
of the job?
• Is the job secure; will there be adequate funding to continue it?
• Are there any other factors that could positively or
negatively affect recruitment of suitable candidates?
If any problems are identified that would make the job
description unfeasible then it should be altered accordingly or
the problems should be dealt with before candidates are recruited.
Post job announcement and recruit, screen, and
select candidates
After the job description has been approved according to
the agency’s procedures, a job announcement can be posted
or advertised. That announcement should be based on (or
be identical to) the job description itself. Recruitment,
Module 3: Work planning; step 5
Formats for
job
descriptions
66
Exhibit 25: Job description and announcement
DATE OF PREPARATION
2. POSITION STATUS
25 Feb. 1992
2.1 Full-time a. Permanent
2.2 Part-time b. Temporary
4 POSITION SUMMARY To provide services and monitor the women and children in
designated areas
6. POSITIONS DIRECTLY SUPERVISED BY INCUMBENT
5. REPORTS TO
Community health nurse
Hone
7. SPECIFY REQUIREMENTS:
1. POSITION TITLE
CHW
7.1 Education/professional qualifications
NA
7.2 Experience and training
Not necessary, but a knowledge of community dynamics would be desirable
73 Knowledge, skills, ability
Communications
Ability to conduct health education sessions
8. DESCRIPTION OF DUTIES/RESPONSIBILITIES:
List duties under two separate headings: REGULAR DUTIES and PERIODIC DUTIES:
During home visits and at PHC, educate and promote health through:
A. REGULAR DUTIES/RESPONSIBILITIES
Growth monitoring
i
Health education on nutrition, use of ORS, breast feeding, immunization, family planning
personal/pub/ic cleanliness, identifying at-risk patients and referring them to PHC
programme
Recording and compiling information on family folders, growth cards, CHW daily activity
register
% TIME SPENT
B. PERIODIC DUTIES/RESPONSIBILITIES:
30% GM
Attend ongoing education classes on health
30% Health education
9. PREPARED BY
10. REVIEWED BY
20% Recording
Jazmi Hosein
IzharSheraz
20% Ongoing education
Module 3: Work planning; step 5
67
screening of candidates, and selection would follow normal
agency procedures.
Agree with selected candidates on role and task
expectations
One step that is very important is for the manager and
immediate supervisor to sit down with the selected candidate
and discuss the job description openly and frankly. The
purpose of this meeting is to clarify expectations on both sides:
what management expects from the staff member, and what
the staff member understands to be the role and tasks of the
job. This will lead to the next portion of the process, described
in Step 6: Develop individual work plans and schedules.
Clarify
expectations
Step 6: Develop individual work plans
and schedules
Skip this step if:
• Your programme already uses a performance-based assess
ment system
Review this step if:
• Your staff work plans are out of date
• They are not based on priority project tasks, or
• You have household registers, but no system for setting
priorities.
The purpose of this step is to translate the individual job
descriptions (developed in Step 5) into specific work plans for
each staff member. Individual work plans should be based on:
1) the programmes clinic and outreach service plans (Step 4)
and: 2) each person’s job description (Step 5). Work plans list
all planned activities, their sequence, the time when they
should begin and end, the resources that will be needed to
carry them out, and the person responsible for each task.
Step 4 showed how valuable information on service
demand and needs could be compiled in registers. It also
showed how targets could be computed for field workers.
That information is used to identify the numbers of people
who will probably need services, and those who are highrisk and deserve special attention. It can also be used to
Module 3: Work planning; step 6
Compiling
registers
68
estimate the numbers of people who will need to be served
each week or month. Individual work plans would take that
information into account in determining how much time
each staff person would spend on each task, at the site, and
with each targeted individuals.
In most cases, each staff member should develop an
annual plan that coincides with the programme’s annual
plan, and a second plan that is used to schedule monthly,
weekly, or even daily activities. These plans may be devel
oped individually, or in a group, depending on how much
one person’s plans affect another’s. Often, the process of
planning is as important as the plan. Work planning helps
everyone to know what everyone else is doing and can be
an effective tool for building team spirit and co-operation.
Advantages of work plans
List tasks in
order of
priority
There are many advantages to work planning, for the
project, the team, and the individual:
• To make sure that planned project activities are carried out
• To make sure that they are carried out in the correct
sequence
• To make sure that priority tasks are carried out first
• To help the staff manage its time efficiently
• To maximise programme impact
• To enable staff to coordinate their work with one another
• To facilitate monitoring of programme and individual
performance.
Step 7 in this module describes how performance assess
ment can help to improve a programme’s effectiveness. Good,
realistic work plans are the key ingredient of successful
performance assessment. That is because the plan is an
obvious and convenient tool for monitoring progress, identi
fying problems, determining needs for change, and replanning.
Work plans usually list tasks in some sort of order of
priority. This allows the supervisor and worker to agree on
high-priority tasks and to focus more attention on monitor
ing those tasks. The key concept here is to always focus
attention on those tasks that are essential to the
programme’s objectives.
Module 3: Work planning; step 6
69
Principles of good work plans
Good individual work plans include the same elements as
good project plans:
• A clearly stated purpose or objective
• A list of all activities or tasks that must be carried out to
achieve the objective
• Specification of the priority tasks and activities
• A specific time frame for starting and completing all tasks
• Clear indicators for measuring progress
• Specification of resources needed to carry out the work.
Work plans should be written out. That increases commitment
to, and understanding of, the work to be carried out It also helps
to summarise the plan in a chart calendar, or graph that reflects
Exhibit 26: Excerpt from a staff work plan
WORK PLAN
Name of person preparing workplan: Josephine Baker
Performance period: November 1,1992 - October 31,1993
Task No. 1 ol_ 2
Statement of task assignment: Conduct routine and special home visits to all eligible households in
areas C and D.
Key Sub-tasks and deadlines:
1. Build awareness of PHC services, advantages, how to get to them
2. Motivate eligible women to accept and use GM, immunization, ANC, Fff ORT
3. Identify and follow-up high-risk mothers and children
4. Refer pregnant women, malnourished children and others as approriate to the health centre
5 Conduct village meetings on PHC
Performance expectations, standards of performance:
1. Awareness will increase to 9096 of households by the end of 1993
2. Acceptance and continued use of PHC services will reach the same level as for the programme
3. All high -risk mothers and children in the area will be identified and referred - no avoidable
deaths will occur
4. All high-risk mothers and children will be visited at least monthly
5. At least one community health meeting will be held each week.
Name of supervisor on this task: Mustafa Bustamante
Workplan approved by supervisor. M. Bustamante
Module 3: Work planning; step 6
Date: 1/11/92
70
the passage of time. That makes it easier to monitor
progress.
Prepare a workplan with your supervisor. Prepare a sepa
rate plan for each task. List the major sub-tasks and perfor
mance expectations for each sub-task. There are no set
number of sub-tasks, but 3-5 is common. Each time you are
given a new task, you should prepare one of these work plans.
Scheduling of work
There are hundreds of variations of work plans, most of
which include the elements described above. The difference
is usually in formatting and emphasis. Some plans empha
sise time, others emphasise tasks. The following examples
illustrate both approaches.
• Gantt charts
The Gantt chart is one of the oldest and most useful tools
for summarising work plans. In PHC it is especially useful
for summarising an annual, semi-annual, or quarterly plan.
All major project activities can be displayed together with a
schedule and persons responsible. These charts are also
useful for special projects, such as research and training
projects. An example is shown below.
Exhibit 27: Gantt chart of research project
Months
Baseline study
<Jan Feb Mar Apr May Jun Jul Aug Sep Oct
activities______________
1. Plan survey
xxxxx
2. Design forms
xxxxx
3. Recruit interviewers
xxxxx
4. Train interviewers
xxxxx
5. Conduct survey
xxxxxxxxx
6. Data entry and analysis
xxxxxx
7. Feedback to team
xxxx
8. Final report
xxxx
Time and task charts
These charts are especially useful for short-term planning
of a week or month. Both charts are self-explanatory. The
first emphasises time. The left column lists the hours in a
day, and the rows show the days in a week or month. The
Module 3: Work planning; step 6
71
3
■3
chart can be modified for any time schedule: 1/4 hour, 1/2
hour, etc. on the vertical axis; Monday-Friday, Sunday-Sat
urday, Day 1-31, etc., on the horizontal.
Exhibit 28: CHN weekly work plan and schedule
-3
Time
Monday
Tuesday
Gen clinic
Community Prenatal
Wednesday Thursday Friday
0700
08:00
3
=3
3
3
3
■3
3
■3
-3
"3
3
3
09.00
Immuniz.
10:00
11:00
Reports
Reports
Reports
12:00
Lunch
Lunch
Lunch
Lunch
Lunch
13:00
PHC meet
Continued
Home visit
Lane meet
Reports
15:00
Home visit
Home visit
Home visit
Home visit
Home visit
16:00
(#617)
End
(#18-29)
(#30-41)
(High-risk)
(#42-50)
End
End
End
End
14:00
17.00
18.00
19;00
Community
20:00
Meeting
The second version shows the tasks on the vertical axis
instead of time. The days are placed on the horizontal axis,
as before.
Exhibit 29: Bi-weekly CHN work plan and schedule
Tasks: July 1-12
Mo
Gen clinic
Days
Tue
We
Th
Fri
8-11
Community ed
Mo
8-12
8-12
Prenatal
11-12
PHC meeting
13-15
11-12 1-12
112
13-15
15-17 15-17 13-17 3-15
112
1-12
1-12
13-17
Lane meeting
Module 3: Work planning; step 6
1-12
13-15
15-17
19-21
8-11
3-15
High-risk visits
3
3
Fri
8-11
3-15
Continuing ed
Th
8-11
8-11
Reports
Com. meetings
We
8-12
8-11
Immunization
biome visits
Tue
8-11
Lane meeting
3
3
Com ed
health ed
19-21
15-17
72
Routine scheduling of CHW household visits is especially
important, and the above tools can also be used for that.
The following example from Pakistan illustrates how a
supervisor and four CHWs might develop a coordinated
schedule.
Example: A CHW in charge of monitoring the health of 200 families who
live in four lanes (L) also conducts lane health education sessions in her
area. These are informal gatherings held outside, often in someone’s front
yard. It is a good way to reach small groups of neighbours.
Exhibit 30: Coordinated schedules of several
workers
Assigning
CHWs
MONTH
CHW A
CHW B
CHW C
CHW D
January
LI
Jan 5
LI
Jan 12
LI
Jan 19
LI
Jan 26
February
L2
Feb 2
L2
Feb 9
L2
Feb 16
L2
Feb 23
March
L3
Mar 3
L3
Mar 9
L3
Mar 16
L3
Mar 23
April
L4
Apr 6
L4
Apr 13
L4
Apr 19
L4
Apr 27
May
LI
May 4
LI
May 11
LI
May 28
LI
May 25
There are four CHWs in the programme who conduct
these sessions. The supervisor is required to be present to
assist in answering questions. Thus, the supervisor and
CHWs need to coordinate their schedules.
The chart shows that CHW A will hold a lane session in
the first week of the month, CHW B in the second week,
and so on until all four CHWs have held a session in a lane.
This process is repeated until all lanes have been covered.
Many projects assign CHWs to cover a certain geographic
area. Typically, they are expected to visit periodically all of
the households in that area. What often happens is that
Module 3: Work planning; step 6
73
3
3
y
3
3
3
*3
'-3
3
they visit homes that are close more frequently than those
that are far away. Some homes are never visited.
The following schedule, which is adapted from the
Swarnivar Project in Bangladesh, illustrates one way to
ensure that all houses are covered on a regular basis.
Assuming that the area has been mapped and each house
given a number, the work plan can specify which houses to
visit each day. The example shows the schedule of one
CHW who visits 15-20 houses each workday. Time is also
allocated staff meetings and other activities.
This type of schedule can also be used to schedule
selective visits to high-risk women and children, as described
in Step 4.
Exhibit 31: Simplified CHW monthly workplan
Workplan for: Lekha
Month: May
Day Schedule
1 Holiday
2 01-017
3 018-36
4 037-56
5 Day off
6 Day off
7 057-76
8 077-95
9 096-114
10 #115-132
11 0133-150
12 Day off
13 Day off
14 0151-169
15 ol70187
Village: Banglapur
No. HH: 413
Day Schedule
16 Supervision session; #188-197
17 0189-212
18 0220-240
19 Day off
20 Day off
21 0241-256
22 0257-275
23 0276-299
24 O300-321
25 0322-345
26 Day off
27 Day off
28 0346-369
29 O370-390
30 #391413
31 Staff meeting
d
3
d
-d
.3
3
Module 3: Work planning; step 6
74
• "To do" lists
These lists are especially useful for daily planning. Once
again, they use the same two popular versions: one
emphasising time, the other tasks.
Exhibit 32A: To do list
Time
07:00
08:00
09:00
10:00
11:00
To Do Today
Monday, July 3
Exhibit 32B: To do list
Tasks
Priorities
1
To Do Today
Monday, July 3
2
Design training plan
Prepare monthly report
Prepare monthly report
Design training plan
3
Meet with CHWs to
plan next week’s HH
visits
12:00
13:00
CHW meeting
4
Review printout of
women needing TT,
ANC visits
14:00
15:00
16:00
17:00
18:00
19:00
20:00
CHN meeting
5
CHN meeting
Review TT/ANC printout
• Duty rosters
These are used to distribute routine work equally among
several staff members. This is particularly useful when
services have to be provided continuously and where the
work is either extremely interesting or boring.
Example: Staff normally work from 8 a.m. to 5 p.m. at the PHC centre.
Due to community demand, an evening clinic is also provided. One of the
six CHNs or LHVs (Lady Health Visitors) must be on duty during the
evening clinics. The duty roster could look as follows, where a letter is
used for each staff person (A - F).
Module 3: Work planning; step 6
75
Exhibit 33: Duty roster
Duty roster: Evening clinic: January
Mon
Tue
Wed
Thurs
Fri
Jan 3-7
A
B
C
D
E
Jan 10-14
F
A
B
C
D
Jan 17-21
E
F
A
B
c
Jan 24-28
D
E
F
A
B
Step 7: Assess job performance
Skip this step if:
• Your program already uses a performance based assessment
system
Review this step if:
• Your staff appraisal system is out of date
• Your system does not compare planned with actual job
performance
The purpose of this step is to help staff to improve their
job performance. By that we mean to help them to improve
their effectiveness in reaching their (and the programme’s)
objectives and to increase their efficiency in carrying out
their work (getting more done with less effort). The vehicle
for doing this is continuous feedback on the staff person’s
work, comparing actual accomplishments with those set out
in the work plans.
This type of continuous assessment is sometimes called
"supportive supervision," coaching, or mentoring. The ob
jective is not to find fault, but to work together with the staff
to help them figure out how to do a better job.
The work plan is the key assessment tool because it links
the worker’s tasks to the programme’s objectives. The better
the worker does in accomplishing those tasks, the better the
programme does in reaching its objectives. For that reason,
assessments should be designed to examine how well the
worker has done in carrying out the tasks agreed upon in
the work plan.
Module 3: Work planning; step 7
76
Principles of performance assessment
Obtain
feedback on
workplan
achievement
Health workers, supervisors, and managers are usually
aware of the performance and problems of their staff long
before a formal review is undertaken. This is one reason
why continuous, supportive performance assessment is
more important than periodic, formal job evaluations.
Good performance assessment is an ongoing process that
depends on open communication between the supervisor
and staff. It begins with feedback on work plan achieve
ments but includes identification of problems, possible so
lutions, staff needs for training and skill development, and
mutual agreement on steps that will be taken by both parties
to improve job performance.
The attitude and communication skills of the supervisor
are very important in this process. If subordinates sense
that they are being criticised rather than helped, they tend
to withdraw, close off communication, and become defen
sive. Some key principles of effective performance assess
ment are shown below:
• Focuses on improving worker performance
• Supportive rather than critical
• Praises accomplishments as well as identifies weaknesses
• Educational rather than judgemental
° Regularly and frequently conducted
• A collaboration between the supervisor and subordinate,
not a top-down, parent-child relationship
• Based on open, frequent communication, and mutual trust
• Designed to find solutions to problems, not to fix blame
for them.
Continuous performance assessment
Every encounter between a supervisor and a staff member
is an opportunity to assess performance and to provide
constructive feedback, guidance, and coaching. Assess
ments can be informal discussions about assigned tasks, built
into weekly work-planning sessions, or a team review of
overall accomplishments.
Module 3: Work planning; step 7
77
As already noted, individual work plans should be the
basic instrument for assessment, and changes agreed upon
can be incorporated immediately into the next work plan.
Although this seems obvious, it is not done as often as
one would expect. Assessments are frequently based on
standardised criteria that may be unrelated to the job:
loyalty, neatness, morality, and civil service test scores. If a
CHWs main job is to visit 413 households every month to
deliver six key health messages and to identify women and
children who are high-risk, then those should be the assess
ment criteria. Did the CHW visit all 413 households? If not,
why not? Is the caseload too much? What can be done to
make it possible for her to visit everyone; should everyone
be visited? Did she deliver the six key messages, and were
they understood? If not, why not? Are some messages
unclear, unnecessary? What can be done to help her deliver
the messages clearly? Did she identify all of the women and
children at risk? If not, why not? Are the criteria too vague?
Does she need additional training?
By using the work plans, household registers, clinic reg
isters, and other planning and recording instruments, the
supervisor and staff can continually examine performance,
identify problems, if there are any, and work together to find
ways to solve those problems.
Formal performance assessment
At least once a year, most organisations require a formal
assessment. If performance has been assessed continually
throughout the year, the formal assessment should be noth
ing more than a summary of those assessments.
The informal, continuous performance assessments are
not usually documented, however, and then a supplemen
tary form may be needed. The following performance review
form is actually the second part of the Work Planning form
shown earlier (Exhibit 26). Together they make up a Work
Planning - Performance Review form (WPPR). A complete
form is provided in Appendix E. This form is convenient
for summarizing both the general work plan and the annual
assessment of performance.
Schedule a review of each task after it is completed or at
the time of your annual review. Complete the self-assessModule 3: Work planning; step 7
Standardised
assessment
criteria
IB
78
ment and submit it to your supervisor. Make sure to discuss
the assessment with your supervisor.
Exhibit 34: Excerpt from a staff performance
review form
PERFORMANCE
REVIEW
Self-assessment:
1 believe that my performance has been very good this year. Awareness,
motivation, and acceptance of PHC services all increased in my area.
Several high-risk cases were referred and successfully treated, which made
mefeelgood and also helped convince the community that our programme
really works. My major problem is a lack of time. Based on the discussions
we have had, I will recruit some mothers to help me visit some of the
households that don't need special attention
Supervisory assessment:
Josephine is one of the hardest working CHWs in the programme. She has
made a special effort to learn how to identify high-risk infants, and that has
resulted in several referrals that might otherwise have had a sad outcome
Josephine agrees that she needs to find someone to help her so that she
will have more time to devote to high-risk cases. Her idea to recruit mothers
is an excellent one and if it works, other CHWs may follow suit.
Supervisory approval: M. Bustamante
Date: 28/10/93
Module 3: Work planning; step 7
83
Appendix B: Risk factors
Characteristics
Some health problems occur more often in certain sub-populations. For
example, malnutrition often afflicts children under the age of five from
poorer households. A healthy individual in a particular sub-population has
a greater chance of contracting or developing health problems that are
prevalent in the group. Examples of risk factors of pregnancy are early or
late reproductive age, poverty, and high parity. A list of characteristics of
risk factors is given below:
• Usually, risk factors reflect some kind of cause-effect relationship with
the health problem, but other risk factors may reflect only the circum
stances (such as geographical location in leprosy) which are associated
with the development of a particular health problem. These risk factors
may only indicate that a risk exists. For example, increasing age is a risk
factor for developing osteoarthritis. This can only indicate that a risk
exists, but is not amenable to change. Therefore, provision has to be
made to cope with problems due to increasing age. Since nothing can
be done to reverse the natural aging process, all one can do is learn the
best ways to cope with the problems that may accompany it.
• Increased risk may be ascribed to characteristics of the individual (e.g.
smoking), household (crowding, inadequate ventilation), or community
(inadequate supply of drinking water).
• We see more diseases occurring and a higher IMR in the shanty towns of
big cities. The people living here have a greater risk of having tuberculosis
and diarrhoeal diseases than those living in other areas. In these shanty
towns we usually see a high prevalence of the common risk factors (e.g.,
maternal illiteracy, unemployment, poor socioeconomic status, poor hous
ing and sanitation). These reflect community risk factors.
• Often, only a combination of risk factors leads to a health problem while
individual risk factors do not. For example, while most people in
Pakistan are exposed to the tuberculosis organism, certain risk-groups
are more likely to develop active tuberculosis. Although people may
continue to be exposed to pathogens, their risk may change due to other
factors. A polluted environment, for example, does not pose the same
risk for adults as it does for children. This is because adults have
developed immunity against a variety of pathogens.
Module 3: Work planning; appendix B
84
• Many risk factors may only have harmful effects after some years, e.g.,
smoking, which makes their identification and control difficult.
• Risk factors may contribute to various outcomes:
• Multiparity — contributes to various complications of maternity, e.g.,
abnormal position of the foetus, postpartum hemorrhage, and premature
birth.
• Similarly multiple risk factors can contribute to a similar outcome, e.g.,
first pregnancy, high parity, poor outcome of previous pregnancy,
malnutrition, age of mother < 20 and > 35 years may all contribute to
maternal complications.
• Risk factors often act as a chain of events. Any stage in a chain of events
could be a risk factor for a subsequent stage.
Infection-------- -> Diarrhoea-------- > Dehydration----- > Death
Poverty -------- > High Parity------- > Low birth weight baby
The distinction between outcome and risk factor is not always clear.
Sometimes the outcome from one risk factor serves as a risk factor for
something else, e.g., low birth weight is an outcome of several risk factors
but acts in itself as a risk factor for diarrhoea and death.
Measures of risk
A risk factor is a characteristic pertaining to individuals or groups that
is associated with an increased chance of an unwanted outcome, such as
illness or death. Risk factors may either indicate or cause an outcome
and form part of the chain leading to illness or death. They may be
amenable to change in which case the incidence of disease will drop. Some
risk factors, such as age when associated with the occurrence of an
unwanted outcome, necessitate the use of methods to compensate for
greater care, since these risk factors cannot be changed.
Risk factors may be measured in terms of magnitude by
• Relative Risk
• Attributable Risk
Relative Risk
The "relative risk" (RR) is a measure used to determine the association
between the characteristic and the disease in an observational study. To
calculate RR it is important to know the number of new cases (incidence)
occuring in the area.
Module 3. Work planning; appendix B
85
3
Relative Risk =
3
Incidence of disease in exposed group
Incidence of disease in nonexposed group
Example:
Cases (# of those
with lung cancer)
Controls (# of those
without lung cancer)
Smokers
Non-smokers
Total
(a)
(c)
(b)
(d)
200
50
250
300
450
750
Using the numerical data above the relative risk would be estimated as
follows:
ppj
Incidence in the exposed
Incidence in the unexposed
a/(a + b)
200/500
“ c/(c + d) ~ 50/500 "
3
This is interpreted as those who smoke are 4.0 times more at risk of
developing lung cancer as those who don’t smoke. A RR of 1.0 therefore
means that there is no risk associated with the suspected factor. A RR < 1.0
confers a protective association with the factor.
Although incidence rates are not determined in a retrospective study
(looking at past data of those who are affected and those not affected with
respect to exposure status); the relative risk can be estimated by (a x d)/(b
x c). This cross-product estimate or "odds ratio" (OR) can be made with
either actual numbers or percentages. It is important for the cases and
controls to be representative of the overall cases and controls respectively.
If you wanted to estimate the relative risk through the odds ratio, you
would first have to go to existing data sources to determine the number of
lung cancer cases in the community (cases). The next step would be to find
controls (those without lung cancer) from records. These controls should be
similar to the cases in mostly aspect except the factor that you suspect of
increasing the risk of disease occurrence.
If the data in the above table were to come out from such a "case-control"
design, you could use the OR to estimate the RR.
dr
oxd
200 x 450
~ c/d ~ bxc ~ 300x50 "
-
The interpretation of the OR show that the estimated RR is 6 times
greater in smokers than non-smokers.
-4
Module 3: Work planning; appendix B
86
Attributable Risk
This measure of association is influenced by the frequency of a charac
teristic in the population. It is the additional incidence of disease following
exposure over and above that experienced in an unexposed group.
The attributable risk (AR) is useful for PHC teams as it helps to estimate
the extent that a specific factor contributes to a particular disease. As such,
AR can be used to predict the impact a of control programme in reducing
the disease incidence by reducing exposure to the factor.
The AR can be calculated using the formula:
Attributable risk (AR) = Incidence in an exposed group —
Incidence in a non-exposed group
AR can also be calculated from a formula which uses relative risk:
AR =
k N ~A~' i x 100
o (r-1) +1
where r = relative risk
b = proportion of the total population with the characteristic
Thus the AR depends on the frequency of a characteristic in a population
and the relative risk for disease given this characteristic.
Example: The proportion of the total population that smokes cigarettes
is 30%, i.e. 0.3, and the RR (as determined in the above example) is 4.0, the
Attributable Risk (AR) is
AR = 0.3 (4.0 - 1) + 1! x 100 = 0.47 or 47.4%
The interpretation is that smoking cigarettes contributes to 47% of lung
cancer, while the remaining 53% is probably due to other risk factors.
Risk factors for selected diseases
The following reference sheet can serve as an information source for risk
factors associated with the more common diseases.
Module 3: Work planning; appendix B
■hi nifliwifl ■ ■ ■ ■ ■ nmimraiwwrawnw w w'
uU
jl)
Ik)
ui) ui! lit) ii) Lti
Lmj
LmJ
Lt LL
uj
til lii
LmU
Li) it) '«J >J ij ii
Module 3: Work planning; Appendix B
Reference sheet for risk factors for selected diseases (continued pages 88-89)
Environmental
Socio-economic
Behavioural
Health care-related
• Age
• Unsanitary conditions
• Poverty
• Feeding boys before girls
• Malabsorption
• Drought
• Illiteracy
• Lack or improper antenatal
care
• Infections
• Desertification
• Large family
• Preference of adults in
food distribution
Biological
Malnutrition
• Distant health care facility
• Pregnancy-related
nutritional disorders
• Working mothers
• Unwillingness to weigh
children due to belief in
evil eye
• Drugs
• Infections and disease
during pregnancy
• Violence/war
• Attributing malnutrition
to supernatural causes
and not food-related
• Lack of drugs and
diagnostic equipment
• Breast feeding boys
longer than girls
• Other diseases which are
untreated
• Diet
• Inadequate use of services
• Decreased gut immunity
due to lack of breast feeding
• Inactivity, smoking, etc.
• Dietary beliefs
Diarrhoea/dehydration
• Distant health care/faciliy
services
• Age
• Unsanitary
• Poverty
• Improper hand washing
• Malabsorption
• Lack of water supply
• Illiteracy
• Bottlefeeding
• Infections/infestations
• Lack of access to clean
water
• Working mothers
• Delayed initiation of
breastfeeding
• Lack of ORS, drugs
• Withholding food during
diarrhoea
• Inadequate health care
delivery system with no
education
• Gut immunity soon after birth
• Malnutrition
• Larger families
• Beliefs in spiritual
healing
• Diet
• Inadequate use of ORS
and other service
• Other untreated diseases
• Prescription for antidiarrhoeal to stop diarrhoea
oo
£
Reference sheet for risk factors for selected diseases (continued page 89)
Environmental
Socio-economic
Behavioural
Health care-related
• Immune system deficiency
• Unsanitary conditions
• Poverty
• Lack of water
• Illiteracy
• Fear of complication of
immunization
• Access to services
• H/o seizures
• Large family
• No need for
• Improper cold chain
Biological
Immunizable Diseases
immunization, as
previous generations
have survived without it
• Belief that the TTfor
adult women is really a
contraceptive
• Belief that immunizable
diseases are not
preventable
• No outreach
• Untrained personnel
• Lack of supplies
• Lack of education of people
regarding immunization
• Lack of diagnostic
treatment of cases
1
Breast feeding
Module 3: Planning; Appendix B
• Beliefs of hot/cold
imbalance bad milk, etc.
• Failure to advise breast
feeding
• Peer pressure or
pressure from in-laws
• Improper or lack of breast
care in pregnancy
• Anxious mother
• Belief that colostrum is
bad
• Failure to aduise family
spacing
• Quick secession of
pregnancy
• Delayed initiation
• Malabsorption
• Belief of insufficient
mother’s milk
• Cerebral palsy in infant
• Bottle fed babies are fat
babies
• Malnourished mother
• Cracked, inverted nipples
• Advertisement of formula
milk
• Poverty
• Illiteracy
• Working mothers
• Breast abscess
• Cleft palate
• Advocating bottle (top
feeds/ formula feeds)
• Convenience of bottle
feeding
W
f,51
01
(B)
561
m
p
p
WtllWt'idl'H'ia VW111 ■ ■ ■
[Bl
m
[p
[5)
in
s$
sv
s\
■w « wwnvrar ■ ■ ■
ui di lb d u U) lb Ui ulliuuliliilILLLblllijLtJaijia >1
Module 3: Work planning; Appendix B
Reference sheet for risk factors for selected diseases
Biological
Environmental
Socio-economic
Behavioural
Health care-related
Maternal mortality
• Irregular menstrual cycle
0 Sanitary
• Illiteracy
• Early age of marriage
• Distant health care facilities
• Suppressed lactation
leading to quick pregnancy
• Drought/famine
• Potential earning merpbers
• Religious taboo
• Expense of contraceptive
• Poverty
• Man’s strength lies in
ability to procreate
• Short maternal structure
• Large families
• Previous H/o caesarian
section
• Mother's strength lies in
ability to bear children
(fertile) especially sons
• Improper diet
• Improper use of services
• Supplies not available
• Improper/lack of training
on use of contraceptives of
workers in FP methods
• Targeting mainly couples
who have completed their
families for FP
• Failure to advise FP to
those in need
• Failure to advise breast
feeding
• Inability to reduce child
mortality
• Untrained TBAs (improper
delivery practices)
ARI
• Decreased immunity
• Unhygienic condition
• Poverty
• Spitting on ground
• Cerebral palsy
• Variation in humidity
• Illiteracy
• Smoking
• Large family/ crowding
• Beliefs of illness
causation and
subsequent training
• Drug resistance
• Improper training of health
workers
• Lack of treatment of
facilities, e.g, drugs
91
Appendix C: Assessment of community
health facilities
The purpose of these instruments is to gather basic information about the
availability, accessibility, and adequacy of health facilities in the programme
catchment area. The first instrument can be used to identify and gather
accessibility information about public and private health facilities (hospitals,
health centers, dispensaries, and so forth). The second instrument can be used
to take a quick inventory of the type of services offered by a facility.
C 1: Identification of community health facilities
•
•
•
•
Community:
Union council:
Name of surveyor:
Name of the village headman/community leader:
• Facility survey
SI no.
Facilities
6.
Government health
facility
D.C. dispensary
Private dispensary
Bovs school
Girls school
7.
8.
9.
10.
In community
Y/N
Accessible to
community
Y/N
Approximate
distance
11.
How far away is the nearest health unit or health worker?
(1) < 5 km/60 min. walk
(2) > 5 km/60 min. walk
.(9) DK/NR
12.
Which of the following health services are available?
12.1 Maternal and child health
(1) Yes
(0) No
(9) DK/NR
12.2 Family planning
(1) Yes
(0) No
(9) DK/NR
Module 3: Work planning; appendix C
92
Immunization
(1) Yes
(0) No
12.4 Medical care services
(1) Yes
(0) No
12.3
(9) DK/NR
_(9) DK/NR
13. Where are the nearest emergency care facilities? (Probe for correct
answer)
(1) Yes (respondent knows correct answer)
(2) No (respondent does not know correct answer)
(9) DK/NR
14. Locally available resources:
Personnel
14.1 Trained TBA
142 Untrained TBA
14.3 Teachers
14.4 Dispenser
14.5 Compounder
Yes/No
Quantity
15.
Is there any social organisation in the village?
(1) Yes(0) No
(9) DK/NR
15.1
If yes, specify:
15.2 How many members does it have?
16.
Is there a bus to town at least twice a day?
(1) Yes
(0) No(9) DK/NR
17.
Does somebody in the village own a car or vehicle?
(1) Yes(0) No(9) DK/NR
18.
Is that vehicle used as an ambulance in emergencies?
(1) Yes
(0) No
(9) DK/NR
19.
How far is it from village to main road from where one can get the
transport?
20.
Is there any electricity in the village?
(1) Yes
21.
(0) No
(9) DK/NR
Any other important information about village?
Module 3: Work planning; appendix C
93
C 2: Community health facility inventory
Fill this inventory out for each health facility in the catchment area.
1. Type of facility:
3. Total population in catchment area:
2. Catchment area:kms 4. Type of service and referrals:
Function
1
Outpatient medical services
1.1 Curative care
1.2 Maternal care
1.3 Dental care
14 TB clinics
15 Injections
16 Dressings
1.7 Dispensary/pharmacy
1.8 Minor surgery
2.
Preventative/promotive services
2.1 EPI
22 Diarrhoeal diseases control
2.3 Growth monitoring
2.4 Family planning
2.5 Health education
3.
Inpatient medical services
3.1 Medical
3.1.1
Male
3.1.2
Female
3.2 Surgical
3.2.1
Male
3.2.2
Female
3.3 Paediatric
3.4 Eye
3.5 Labour room
Diagnostic services
4.1 Laboratory
4.2 X-rays
4.
5.
Provision of Number of
patients
services
*
seen/year
—
Training
5.1 TBA training
5.2 CHW training
5.3 Dispenser training
* Codes. 1. Centre 2. Outreach 3. Both centre and outreach
Module 3: Work planning; appendix C
Number of
patients
referred
onward
—
—
•--------------------------------
—
94
6.
Do you encounter major
problems with
6.1
Drugs
6.2 Vaccines
63 Staff shortage
6.4 Equipment
6.5 Vehicles
(1) Yes
(1) Yes
(1) Yes
(1) Yes
_ (1) Yes
(2) No
(2) No
(2) No
(2) No
________ (2) No
7.
What transport is available at the centre (please check all that apply)
7.1
Ambulance
(2) No
(1) Yes
7.2 Car
________ (2) No
(1) Yes
________ (2) No
7.3 Motorcycle
________ (1) Yes
7.4 Bicycle
________ (2) No
________ (1) Yes
7.5 Others
(1) Yes
.(2) No
8.
Staff positions:
Category
Sanctioned
M
F
Staff positions
Posted
M
F
M
Vacant
F
Module 3: Work planning; appendix C
95
fH H W W n W W B W W H 1 1 1 I K L 1
3
3
3
3
3
3
3
3
3
3
k\ LV Hi LVI
3
3
3
3
3
3
3
3
3
Appendix D: CHW activity register
Instructions for filling out the CHW activity register
Form location:
Data recorder:
Data provider:
Supervisor:
Initial recording:
Updating:
Health centre
Community health worker
Adult female family member taking care of the
children in the family and CHW
Lady Health Visitor (LHV)/Community Health
Nurse (CHN)
1st month of the year
During routine home visits
Purpose
•
•
•
•
To help CHW monitor the health status of her target population
To help CHW evaluate her own performance
To help LHVs/CHNs identify problems and support the CHW
To help in summarising information for preparation of quarterly reports
Procedure
•
Initial recording
To be filled by the CHW at the beginning of each year using the
family folders. Information on new births, newly married women and
migration-ins should be included when they become a part of the registered
population. Children reaching an age greater than three years, women who
come out of the married child bearing age category and migration-outs
should be excluded by crossing out the ID and making a note in the remarks.
Serial No.
Serial number given to each family listed
House No.
Sector (division) number and house (structure)
number separated by a point, e.g., S.123, AF.266.
-where S and AF are the sector numbers and 123
and 266 are house numbers
I.D. No. 3
I.D. of under 3 child, e.g., Cl
Married women
l.D. of married women e.g., M (extreme right)
Module 3: Work planning; appendix D
96
•
Children < 3 years of age
1
Age of child. Three years at the beginning of the quarter in
years and months separated by a point, e.g. 2.6 (i.e., 2 years
and 6 months)
2, 3 and 4
Newly identified live births. Birth date (dd/mm/yr) of all
new borns identified during the visit. (Enter the child’s infor
mation in family folder and make a yellow child growth card
for the mother). The births recorded in this column do not
necessarily have to have occurred during the month/quarter
the visit took place. For example, the birth date of a child born
in a registered household and identified three months after
the birth should also be recorded in this column in the quarter
that the child was identified. However, the age of the child at
the beginning of the quarter should be recorded in the age
column.
Birth weight of child if child was weighed within 48 hours
after birth. Circle if the child was a low birth-weight baby,
that is < 2.5 kg.
Still birth. Date of delivery of the stillborn child. A still
birth is a child born dead during or after the seventh month
of pregnancy.
5
Weight of < 3 child in first month of the quarter.
6-8
Weight change. Appropriate code for change in weight of
the child compared with its weight in the previous month:
Code:
4= gain
0
= stable
= loss
NW = not weighed
9
Nutritional status. Appropriate code for nutritional status
of the child last month of quarter.
Code:
N
= normal
1
= First degree (mild) malnourished
II
= Second degree (moderately) malnourished
III
= Third degree (severely) malnourished
Module 3: Work planning; appendix D
97
10
Immunization. Appropriate code for immunization status,
last month quarter of children < 1 year.
Code
C = Complete with BCG, DPT/polio (1,2 &3) and measles
A = Appropriate # of doses of vaccines for age of the child
according to the following schedule.
At birth: BCG
1 Vi months (6 wks): 1st dose DPT and polio
2 VS months (10 wks): 2nd dose DPT and polio
3 VS months (14 wks): 3rd dose DPT and polio
9 months (40 wks): measles
IC = At least one dose but not appropriately immunized for
age (incomplete)
N = No immunization (none)
• General
11-13
Date of visit. Date of first positive visit, i.e., when mother
is available during the visit, under the appropriate month.
Deaths. ID of all identified deaths that occurred at anytime
during the quarter. Record the approximate date and age at
the time of death in the family folder.
The deaths recorded in this column do not necessarily have to have
occurred during the month/quarter the visit took place. For example, if
the death of an individual who died in October is identified in January, then
record the death in the January-March quarter; but write the month of
death next to the ID.
14
• Married women 15-49 years
15,16
and 18
17
19
20
Pregnant. If the woman is pregnant, record month of preg
nancy
Family planning. Tick for couples practicing family plan
ning last month of quarter.
Immunization status (for all women last month of quarter):
Appropriate code for tetanus toxoid.
Delivered (any time during quarter). Appropriate code for
tetanus toxoid immunization status of woman who delivered
in this quarter.
Module 3: Work planning; appendix D
98
Code:
C = Married women: Completed two doses of TT,
Women who delivered: Complete with two doses
during pregnancy. Or two doses before pregnancy and a
booster dose during pregnancy (at least 15 days before
delivery) till a maximum of five doses of TT
1C = Married women: Only one dose of TT (incomplete) for
women who delivered. No doses before pregnancy and
only one dose during pregnancy or one to four doses
before pregnancy and no dose during pregnancy
N = All women: No dose of TT (none)
•
No. of family members
Total number of family members in the household. Update as
and when this changes.
•
Totals
Total the columns according to the following schedule:
1st month of the quarter: Column # 1, 6 and 11
2nd month of the quarter: Column # 1, 7 and 12
End of quarter: Column # 1, 2, 3, 4, 6, 8, 9, 10, 13 17, 18 19
20, 21 and 22.
Module 3: Work planning; appendix D
■intei ii a man, ■ ■ ■.■ ■iiiiiiiBiiwiWiiiw® ■
jj
k*j
jl!
ju
l*j
'ad k*J
Gti ill Id 11 Li
ill 1*
lmJ
Li ix 111 Lb Id !*J
!*J
Exhibit 15: CHW activities register (continued, page 100)
Children < 3 years
Srs.
Household ID No.
No.
Newly identified birth
(Jan.-Mar.)
Age
Live
(1)
Jan.
Still
DT
BW
DT
(2)
(3)
m
Total
■ WEIGHT CHANGE
+ = Increase in weight
O = Same weight
— = Decrease in weight
" NUTRITION STATUS
N =» Normal
I
= First degree malnourished
II = Second degree malnourished
111
= Third degree malnourished
NW = Not weighed
Wt.
(5)
Feb.
March
• Wt.
• Wt.
• Wt.
Ch
Ch
Ch
(6)
(7)
(8)
••Nut St. ‘"1mm St.
«1)
(9)
(10)
’xl U.
34U.
Exhibit 15: CHW activities register
Date of visits
Srs.
Jan.
(11)
Feb.
(12)
Mar.
(13)
Deaths
Married women
Jan.- Mar. Jan.
Feb.
March
‘"Immunization
status
ID#
PR
PR
FP
PR
All
DLVD
(14)
(15)
(16)
(17)
(18)
(19)
(20)
ID#
(21)
Number
of
family
mambers
(22)
Module
□
2.
5'
U3
£V
73
— IMMUNIZATION STATUS
C
= Complete
IC
= Incomplete for age
A
= Appropriate for age
N
= No immunization
NB
= New born
BW
= Birthweight
LBW = Low birth weight
PR
= Pregnancy month of pregnant woman
DLVD = Women who have delivered during the quarter
FP
= Family planning
DT
= Date
1/1 r(l w Iff
®
(f| ®|
sr (0 in rn m m [p m ip It It II
sv
■zJihi wniHfwh^w'■ 1 ■ ■ ■ ■ ■ '■tafwliitei/miitfitoHi
101
J
3
=3
3
3
3
3
•3
3
3
3
3
3
3
3
3
3
3
3
:3
Appendix E: Blank worksheets
Exhibit 1: Worksheet for defining catchment area
a) Select criteria to define the boundaries of your catchment area.
____ Fixed distance of
kms around health facility
_____Administrative unit (specify level and name)(sub-district).
in(district).
____ PHC service target group, socio-economic or geographically defined,
population
_____A practically defined population (please specify)
b) Define sub-catchment areas for different services:
____ Curative care
MCH
_____Family planning
____ TB
____ Other
Exhibit 2: Worksheet for describing catchment area
102
Exhibit 3: District level map - Map A
Exhibit 4: Health facility level map - Map B
Module 3: Work planning; appendix E
■ui Niuiinui'K ■ ■ ■ ■ ■jimvinHiwiwiwwwtHtBia
til
Ui uL lil ImJ id UtJ lu LiJ Lt
jAJ
U Lb Ud Li UJ Lil iil Lrfi !mJ '4 Li Lb
Module 3: Work planning; appendix E
Exhibit 5: Community/village level map -Map C
p°]
lx]
U
[■I
|=]
f~^|
House
Mill, factory
Health centre
Sub-district HQ
Highway
Road
Case of malaria
106
Exhibit 8: Worksheet for determining indicators
and source of indicators
INDICATORS
SOURCE
1. Health status indicators
2. Demographic indicators
3. Risk factors
4. Health service-related
Module 3: Work planning; appendix E
107
Exhibit 9: Worksheet for setting priorities among health
problems
INSTRUCTIONS:
• List the different health-related problems.
• Select the criteria used to assess the magnitude and importance of the
problem (e.g., prevalence, seriousness, etc.).
• Decide what scale to use for scoring, i.e., 0-4 or 0-10, etc., and the method
to use for totalling (addition or multiplication).
• Assign scores to each problem for the different criteria and calculate the
totals.
WORKSHEET FOR SETTING PRIORITIES AMONG HEALTH PROBLEMS
Health
Criteria
problems
Module 3: Work planning; appendix E
Scoring
method
Exhibit 10: Risk factors
Biological
Environmental
Socio-economic
Behavioural
Health care-related
Module 3: Work planning; appendix E
rr
IT !T ff ff1 IT
P ® fr P P P P P P w p
®
*r
Exhibit 11: Worksheet to develop risk profiles of households
CONDITIONS
SCORE IF
PRESENT
Total risk score
Rating scale:
Low risk
0-3
Moderate risk
4-6
Module 3: Work planning; appendix E
High risk
>7
HOUSEHOLD NO.
Exhibit 12: Worksheet for identifying services, strategies and activities
Service/component
Strategy
Activities
List
Who will do it
How and when
Module 3: Work planning; appendix E
m If m
® m Bl si <gi ® n m ■ ip m m g| m m n
■iH'iHiiwaiHrurarn1
n it
■ ■ ■ ■ ■ ■jBOWWtWiWWWWm
d d ii) bi) id 'id U) in ia d
& & ul ia & Uj
a w JJu
Module 3: Work planning, appendix E
Exhibit 13: Planning PHC activities (continued, page 112)
Services/activities needed
Manpower
A. Community
based
Required
Target group Frequency
Type
B. Outreach
Logistics/supplies
Available
Number
(FTEs)
Available
Required
Type
Amount
Optimal
level of
services
given
resource
constraints
!&
Exhibit 13: Planning PHC activities
Services / activities needed
C. Clinic-based
Target
group
Required
Type
| Optimal level
Logistics / supplies
Manpower
Frequency
Available
Number
(FTEs)
Required
Type
Available
of services
given
resource
constraints
Amount
Module 3: Work planning; appendix E
Total
fp w ffi W W a «i Si '<i ® » a a a a tji ffl m a $ w, a
HOTalHW'IMH ■ ■ ■ ■■ ■ ■ ■
«
113
Exhibit 14: Worksheet to determine staff requirements
Number of households in PHC catchment area = ?
Frequency for visiting each household = ?
Number of days when outreach will be provided =
Staff capacity per month = days/month x HH visits/day per CHW
Staff capacity = ?
Staff requirement = HHs to be covered/staff capacity per month
Staff requirement = ?
Module 3: Work planning; appendix E
Exhibit 15: CHW activities register (continued, page 115)
Children < 3 years
Srs.
Household ID No.
No.
Age
Newly identified birth
(Jan.-Mar.)
Live
Still
DT
(V
BW
DT
(3)
m
Jan.
Wt.
(5)
Feb.
March
* Wt.
• Wt.
• Wt.
Ch
Ch
Ch
(6)
(7)
(8)
••Nut St. *"Imm St.
«1)
(9)
(10)
Module 3: Work planning; appendix E
Total
• WEIGHT CHANGE
+ = Increase in weight
O = Same weight
— = Decrease m weight
•• NUTRITION STATUS
N = Normal
I
= First degree malnourished
II = Second degree malnourished
III = Third degree malnourished
NW = Not weighed
m fi} tgi m m ® ® m m
sr m m o m m m m m
wwMm ■ ri ■ ■ ■■»■' BiiMvuwiwkvii
mlhiuiklui fl ■ ■ ■ ■ ■iBimwWRWWWWipwiKfl
U)
a
U)
La)
Uj
U)
& ll ut & & Ui &
!jU
!Ai
'4J 41 41 4
Module 3: Work planning; appendix E
Exhibit 15: CHW activities register
Deaths
Date of visits
Srs.
Jan.
av
Feb.
(12)
— IMMUNIZATION STATUS
C
= Complete
IC
= Incomplete for age
A
- Appropriate for age
N
= No immunization
NB
= New born
Mar.
(13)
Married women
Jan.- Mar. Jan.
Feb.
••‘Immunization
status
March
ID#
PR
PR
FP
PR
All
DLVD
(14)
(15)
(16)
(17)
(18)
(19)
(20)
BW
= Birth weight
LBW = Low birth weight
PR
= Pregnancy month of pregnant woman
DLVD = Women who have delivered during the quarter
FP
= Family planning
DT
= Date
ID #
(21)
Number
of
family
mambers
(22)
116
Exhibit 16: CHW activity record (continued, page 117)
INSTRUCTIONS: Fill one circle for every case
Module 3: Work planning; appendix E
117
Exhibit 16: CHW activity record
Module 3: Work planning; appendix E
118
Exhibit 17: TBA monthly record (continued, page 119)
Year:Month:Division:TBA name:
r~ ------- .-aersaji
OOOOO
Deliveries assisted
Abortions
OOOOO
OOOOOOOOOOOOOOOOO
ooooooooooooooooo
ooooooooooooooooo ooooooooooooooooo
(O;
OOOOO
Antenatal visits
OOOOO Family planning accepted
ooooooooooooooooo ooooooooooooooooo
ooooooooooooooooo ooooooooooooooooo
OOOOO
Postnatal visits
OOOOO
Low birth weight
ooooooooooooooooo ooooooooooooooooo
ooooooooooooooooo ooooooooooooooooo
OOOOO
Antenatal referral
OOOOO
Full term
ooooooooooooooooo ooooooooooooooooo
ooooooooooooooooo ooooooooooooooooo
INSTRUCTIONS: Fill one circle for every case
Module 3: Work planning; appendix E
119
Exhibit 17: TBA monthly record
Year:Month:Division:TBA name:
ooooooooooooooooo ooooooooooooooooo
ooooooooooooooooo ooooooooooooooooo
OOOOO
Referral in labour
OOOOO
Normal labour
OOOOOOOOOOOOOOOOO ooooooooooooooooo
ooooooooooooooooo ooooooooooooooooo
ooooooooooooooooo ooooooooooooooooo
ooooooooooooooooo ooooooooooooooooo
000
OOOOO
First week deaths
OOOOO
Puerperal fever
OOOOOOOOOOOOOOOOO ooooooooooooooooo
ooooooooooooooooo ooooooooooooooooo
INSTRUCTIONS: Fill one circle lor every case
Module 3: Work planning; appendix E
^07
Exhibit 18: LHV activity register
Name of LHV:
Date Village
Purpose of visit
Support Training Meeting
Visit
visit
session CHWs Community high
risk
Month:
Actions taken
Sessions on
IMM
GMP Health
education
Others
(specify)
No. of
participants
or persons
visited
Module 3: Work planning; appendix E
W
ffl HI ryi ® 01 jSI [ffl
(H m HI m »
■IfarMd
m
«
121
Exhibit 19: Target list of women to be immunized
Reg.»
Name
Age
Preg- TTl
nant
Module 3: Work planning; appendix E
TTl
Date
TT2
TT2
Date
Booster
Booster
Date
122
Exhibit 20: Individual medical record
INDIVIDUAL MEDICAL RECORD
(Fill this form for every encounter)
Date of visit:
Name:
1. History:
2, Physical examination;
3. Assessment:
Investigation
T:____
P:___ _
BP:___
R:___
4 Plan:
Treatment
Module 3; Work planning; appendix E
123
*5
Exhibit 21: Individual medical record
Household #:
Patient Name;
Individual #■
Medical record#Father/husband name.
Date of birth:
Past history.-
Sex (M/F)
Diagnosis
Height:
Hospitalisation
Weight
Medication
Drug allergies: Y/N (specify):
Family history (check appropriate boxes): Smoking
Alcohol
Drug use _ _ Occupation___
Personal history (check appropriate boxes)- Smoking___ Alcohol____ Drug use_____ Occupation_____
VISIT DATES
1 Tuberculosis
"iS
2 Polio
'3
4 Measles
3 Diph./pertus./tetanus
5 Mumps
LS
6 Malnutrition
7 Diarrhoea/dysentary
tS
8 Intestinal parasites
9 Hepatitis/jaundice
4
4
10 URTI
11 Pneumonia/bronch (LTRI)
12 Other LTRI/asthma
13 Skin problems
*4
14 UTI
15 Fever > 5 days
16 Pregnancy-related problem
17 Anaemia
18 FP complications
19 Gynaecological problems
£
20 Hypertension/ischaemic
21 Diabetes
22 Musculoskeletal disorders
23 Mental illness
*4
24 Dental problems
25 Eye problems
26 Errors of refraction
27 Ear problems
4
28 Accidents/injuries
4
30 Other
29 Handicaps
Module 3: Work planning; appendix E
124
Exhibit 22: Daily clinical treatment record
Name of clinic.
Date
1
2
MO/CHN:
4
5
3
6
Registered:
9
8
7
10
Total
Household No./Reg. No.
ID #:
Sere M/F
Age: ( Years)
<1
1-5
6-15
16-49
Over 49
Routine ANC
Routine well-baby
1 Tuberculosis
2 Polio
3 Diph./pertus./tetanus
4 Measles
5 Mumps
6 Malnutrition
7 Diarrhoea/dysentary
8 Intestinal parasites
9 Hepatitis/jaundice
10 URTI
11 Pneumonia/bronch. (LTRI)
12 Other LRTI/asthma
13 Skin problems
14 UTI
15 Fever > 5 days
16 Pregnancy related problem
17 Anaemia
18 FP complications
19 Gynaecological problems
20 Hypertension/ischaemic
21 Diabetes
22 Musculoskeletal disorders
23 Mental illness
24 Dental problems
25 Eye problems
26 Errors of refraction
27 Ear problems
28 Accidents/injuries
29 Handicaps
30 Other (Specify)
REFERRED BY (Code") "F - First visit for a disease 'R = Repeat visit for the same disease
REFERRED TO (Code-") "1. CHW 2 TBA 3. Others (specify) •"1. Azam Basti 2 AKU 3. Other (specify)
Module 3: Work planning; appendix E
IhlhlLflllliil ■ ■ ■ ■ ■ ■ iHIYWllWWWlWW«|WWn
fi) 14)
a
'A U) U' ii Ui 'i ;ai
& & ti Ji i & !i Mi aj
aj
Module 3: Work planning; appendix E
Exhibit 23: Drug supply (continued, page 126)
Name of centre:
1
Acetyl Salicylic Acid Tab. 300 mg
2
Aluminum and Magnesium Hydroxide Tabs.
Aminophyllin Tab. 100 mg
3
4
Benzyl Benzoate 25% solution
5
Betamethasone Cream
6
Buscopan 10 mg Tabs.
7a
7b
Chloramphenicol Eye Ointment
Chloramphenicol Syrup
7c Chloramphenicol Capsule
7d Chloramphenicol Eye Drops (Btls)
8a Chloroquin Syrup
8b Chloroquin Tab. 250mg
9a Cotrimoxazole (Double strength)
9b Cotrimoxazole Syrup
Chlorpheniramine Tabs. 4 mg
10
Diazepam 5 mg. Tabs. (Relaxipam)
11
12a Ferrous Sulphate Tabs. 200 mg.
12b Ferrous Sulphate Syrup
13 Folic Acid Tabs. 5 mg
Gradinal Sodium Tabs. (Phenobarb)
14
Gentian Violet 1% Aqueous Solution
15
16 Mefanamic Acid Tabs. (Ponstan)
17 Metronidazole Syrup
17a Metronidazole Tab. 200 mg
Previous
balance
Rec’vd Total
Dates
Issued Balance Cost
Mi
1
126
18
19
20
21
22
Neomycin and Bacitracin Oint. Skin 15 mg
Nystatin Vaginal Pessaries
Nystatin Oral Drop (Nilstat)
Otosporin Ear Drops
Module 3: Work planning; appendix E
Oxytetracycline Tab. 250 mg
23a Paracetamol Tab. 500 mg
23b Paracetamol Syrup
24a Phenoxymethyl penicillin Tabs. 250 mg
24b Phenoxymethyl penicillin Syr. 250 mg
25 Pyrantel Pamoate susp.
26 Theophyllin Syr. 150 mg/ 5 ml
27
Whitefields Ointment in kg
SIGNATURE OF ADMINSTRATIVE ASSISTANT/CLINICAL ASSISTANT:
m (fi ® fin $ [si $ 09 u w if iki m
m m $ ih $ *r
n s.v ®
iiiMraiuiMittiurniimi ■ kill rtriwUninv
127
Exhibit 24: Role and tasks list
PHC programme goals:
Service objectives:
Strategies:
Position title
Role
Tasks
Module 3: Work planning; appendix E
Experience
Ability/skills
129
Exhibit 28: Weekly work plan and schedule
Time
07:00
08:00
09:00
10:00
11:00
1200
13:00
14:00
15:00
16:00
1700
18:00
Tuesday
Monday
Wednesday
Thursday
Friday
Exhibit 29: Bi-weekly CHN workplan and schedule
Tasks:
Mo
Tue
We
General clinic
Community education
Prenatal
Immunization
Reports
PHC meeting
Lane meeting
Continuing ed
Home visits
High-risk visits
Lane meeting
Community meetings
Module 3: Work planning; appendix E
Th
Days
Fri Mo
Tu
We
Th
Fri
130
Exhibit 30: Coordinated schedules of several workers
MONTH
CHW A
CHW B
CHW C
CHW D
January
February
March
April
May
Exhibit 31: Simplified CHW monthly work plan
Day
1
2
3
4
5
6
7
8
9
10
11
12
13
14
15
Schedule
Day
16
17
18
19
20
21
22
23
24
25
26
27
28
29
30
31
Schedule
Module 3: Work planning; appendix E
131
Exhibit 32A: To-do list
Exhibit 32B: To-do list
Time
Tasks
Priorities
1
To Do Today
07:00
08:00
09:00
10:00
11:00
1200
13:00
14:00
15:00
16:00
1700
18:00
19:00
20:00
To Do Today
2
3
4
5
6
Exhibit 33: Duty roster
Month
Mon
Tue
Module 3: Work planning; appendix E
Wed
Thurs
Fri
132
Exhibit 34: Work plan performance review instructions
Purpose: The purpose of the WPPR system is to make sure that you and
your supervisor have a common understanding of your assignments,
performance expectations, and actual performance. This system was de
signed to help you as much as your supervisor. It is your responsibility to
keep your WPPR up to date and to schedule work planning and perfor
mance reviews with your supervisor.
Work plan: Prepare a work plan with your supervisor. Prepare a separate
plan for each task. List the major subtasks and performance expectations for
each sub-task. There are no set number of sub-tasks, but 3-5 is common. Each
time you are given a new task you should prepare one of these work plans.
Performance review: Schedule a review of each task after it is completed,
or at the time of your annual review. Complete the self-assessment and
submit it to your supervisor. Make sure to discuss the assessment with your
supervisor.
________________________________ WORK PLAN
Name of person preparing work plan.
Performance period:
Task No.of
Statement of task assignment:
Key sub-tasks and deadlines:
1
2.
3.
4.
5.
Performance expectations, standards of performance:
1
2.
3.
4.
5.
Name of supervisor on this task:
Work plan approved by supervisor:
Date
Module 3: Work planning; appendix E
133
References and bibliography
Bryant, J. Lecture notes, course book term VI; Planning for primary health
care systems, class of 1994. The Aga Khan University, 1991.
Haq, I. Background paper prepared for the management training workshop
for medical officers of Thatta. The Aga Khan University, undated.
World Health Organization. On being in charge: a guide for middle level
management in primary health care. Geneva, 1980.
Wolff, J. A., et. al. (eds). The family planning manger’s handbook: Basic skills
for managing family planning programs. Kumarian Press, Hartford, 1991.
Module 3: Work planning; references and bibliography
134
Acronyms and abbreviations
AIDS
AA
AKF
AKU
ANC
CBR
CDR
CHD
CHN
CHW
CO
EPI
FTE
FP
GM
HH
IEC
IMM
IMR
KAP
LHV
LRTI
MCH
MIS
MOH
NGO
OR
ORS
ORT
PHC
PHC MAP
RR
SP
TB
TBA
TFR
TT
URTI
UTI
WPPR
Acquired Immune Deficiency Syndrome
Administrative, assistant
Aga Khan Foundation
Aga Khan University
Antenatal care
Crude birth rate
Crude death rate
Community health doctor
Community health nurse
Community health worker
Community organiser
Expanded Programme for Immunization
Full time equivalent
Family planning
Growth monitoring
Household
Information, education, communication
Immunization
Infant mortality rate
Knowledge, attitudes, practices (behaviour)
Lady health visitor
Lower respiratory tract infection
Maternal and child health
Management information system
Ministry of health
Non-governmental organisation
Odds ratio
Oral rehydration salts
Oral rehydration therapy
Primary health care
Primary Health Care Management Advancement Programme
Relative risk
Security person
Tuberculosis
Traditional birth attendant
Total fertility rate
Tetanus toxoid
Upper respiratory tract infection
Urinary tract infection
Work-planning performance assessment
Module 3: Work planning; acronyms and abbreviations
135
Glossary
S3
S3
'QC
J
&
Catchment (area): The geographic area surrounding one or more health
facilities or service provision sites. It refers to the population residing in
that area, which includes all or a portion of the programmes target
population.
Community: A group of people having common organisation or interests
or living in the same place under the same laws.
Community health worker (CHW): A person indigenous to the com
munity who provides basic health promotion disease prevention and
selected curative health services to members of the community. Includes
village health workers, health guides, LHVs and other terms.
Coverage: The percent of a target group that has received a service or is
protected from a disease or health problem.
Effectiveness: The degree to which desired outcomes are achieved.
Efficiency: The degree to which desired outcomes are achieved without
wasting resources.
Goals: The impact your programme hopes to have on health. Goal
statements specify improvements desired, target groups, amount of change
expected and date for achievement.
Incidence: The number of new cases of a disease in a defined population
during a specific period of time.
Indicator: An indirect measure of an event or condition. For example, a
baby’s weight-for-age is an indicator of the baby’s nutritional status.
Inputs: Resources (personnel, materials, equipment, information and
money).
Institution: An established organisation, group, agency or other formal
entity.
Management: The art and science of getting things done through people.
Objectives: The output and/or effect that a programme hopes to achieve.
Outcomes: Results of programme, including outputs, effects and impacts.
Outputs: Products and services provided by a PHC programme
Effects: Changes in knowledge, skills, attitudes and behaviour, (includ
ing coverage) as a result of a PHC programme.
Impacts: Changes in health status, (mortality, morbidity, disability,
fertility) as a result of a PHC programme.
Percentage: A proportion multiplied by 100. For example 3,500 children
immunized out of 5,000 x 100. (3,250/5,000) * 100 = 65%.
4
■c
Module 3: Work planning; glossary
136
Performance: The actual output and quality of work performed.
Prevalence: The total number of cases of a disease in a defined population
at a specified point in time. Also used with "coverage," as with the
"contraceptive prevalence rate," meaning the proportion of the target
population that is currently practising family planning.
Primary health care: Essential health care, accessible at affordable cost
to the community and the country, based on practical, scientifically sound
and socially acceptable methods. It includes at least eight components:
health education, proper nutrition, clean water and basic sanitation, mater
nal and child health care, immunization, control of common diseases and
injuries, prevention of local endemic diseases, and supply of essential drugs.
Processes: Activities or tasks carried out in programme.
Proportion: A special type of ratio expressing a relationship between a
part and the whole. For example, 3,250 children immunized out of 5,000
(3,2500/5,000 = .65).
Rate: A measure of the frequency of occurrence of an event, such as cases
per month.
Ratio: Two numbers related to each other in a fraction or decimal, such as
the number of cases of measles per 1,000 children. Any fraction, quotient,
proportion, or percentage is a ratio.
Register: A written or printed record containing regular entries of events
or other items, such as name, address, births, deaths, symptoms, treatments
given, and so forth. Typical registers are for households, families, individual
visits to health facilities, and daily visits of health workers to households.
Risk factor: A characteristic of an individual or group that is associated
with an increased chance of contracting a disease, having a health problem,
or dying.
System: A set of discrete, but interdependent, components designed to
achieve one or more objectives.
Target group: Specific groups of people designated to receive a PHC
service, such as children under age two designated to receive immunizations.
Module 3: Work planning; glossary
PHC MAP MANAGEMENT COMMITTEE
Dr. Ronald Wilson • Aga Khan Foundation, Switzerland (Co-Chair)
Dr. Jack Bryant • Aga Khan University, Pakistan (Co-Chair)
Dr. William Steeler • Secretariat of His Highness the Aga Khan, France (Co-Chair)
Dr. Jack Reynolds • Center for Human Services, USA (PHC MAP Director)
Dr. David Nicholas • Center for Human Services, USA
Dr. Duane Smith • Aga Khan Foundation, Switzerland
Dr. Pierre Claquin • Aga Khan Foundation, Switzerland
Mr. Aziz Currimbhoy • Aga Khan Health Service, Pakistan
Mr. Kabir Mitha • Aga Khan Health Service, India
Dr. Nizar Verjee • Aga Khan Health Service, Kenya
Ms. Khatidja Husein • Aga Khan University, Pakistan
Dr. Sadia Chowdhury • Aga Khan Community Health Programme, Bangladesh
Dr. Mizan Siddiqi • Aga Khan Community Health Programme, Bangladesh
Dr. Krasae Chanawongse • ASEAN Institute for Health Development, Thailand
Dr. Yawarat Porapakkham • ASEAN Institute for Health Development, Thailand
Dr. Jumroon Mikhanorn • Somboon Vacharotai Foundation, Thailand
Dr. Nirmala Murthy • Foundation for Research in Health Systems, India
PHC MAP TECHNICAL ADVISORY COMMITTEE
Dr. Nirmala Murthy • Foundation for Research in Health Systems, India (Chair)
Dr. Krasae Chanawongse • ASEAN Institute for Health Development, Thailand
Dr. Al Henn • African Medical and Research Foundation (AMREF), formerly of
the Harvard Institute for International Development
Dr. Siraj-ul Haque Mahmud • Ministry of Planning, Pakistan
Dr. Peter lugwell • Faculty of Medicine, University of Ottawa, Canada
Dr. Dan Kaseje • Christian Medical Commission, Switzerland, formerly of the
University of Nairobi, Kenya
KEY PHC MAP STAFF AT THE CENTER FOR HUMAN SERVICES
Dr. Jack Reynolds (PHC MAP Director)
Dr. Paul Richardson
Dr. David Nicholas
Dr. Wayne Stinson
Ms. Maria Francisco
Dr. Neeraj Kak
Ms. Lori DiPrete Brown
Ms. Pam Homan
Dr. Lynne Miller Franco
Ms. Mary Millar
Position: 5314 (1 views)