11546.pdf
Media
- extracted text
-
Socioeconomic, Demographic and
Reproductive Health Profiles
of Adolescents in SAARC Countries
(1995= 100)
Percentage
220
210
200
190
180
170
160
150
140
n
0
OH
130
1
1 jT ill iT jt' jt“i
Bangladesh
Bhutan
India
Maldives
Nepal
Pakistan
■ 1960
□ 1970
■ 1980
□ 1990
□ 1995
■2000
□2010
□ 2020
Sn Lanka
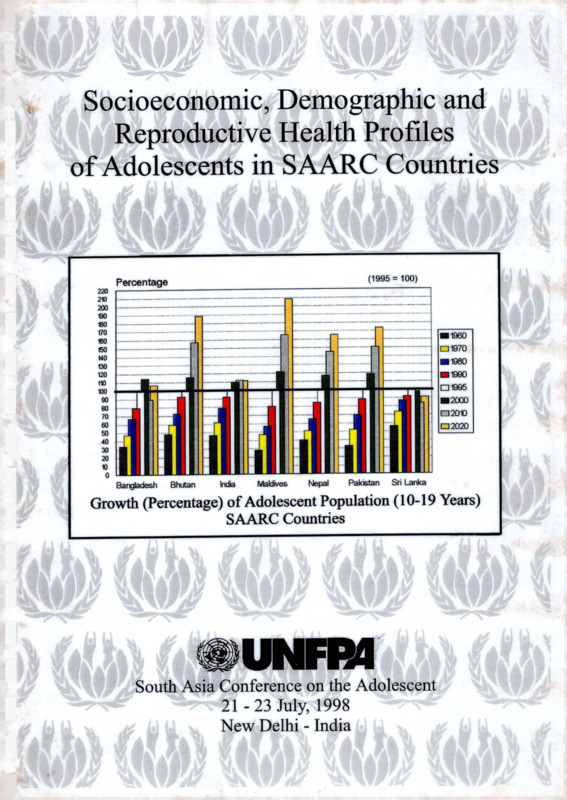
Growth (Percentage) of Adolescent Population (10-19 Years)
SAARC Countries
eUNHM
B
South Asia Conference on the Adolescent
21 -23 July, 1998
New Delhi - India
4
<‘
CPHE
R-
iLIBRARY
1 PR A RY
ADD
INTO 3 M/.T I ON
\\
• ■
<
CENT PE
Socioeconomic, Demographic and
Reproductive Health Profiles
of Adolescents in SAARC Countries*
J
UNFR4
South Asia Conference on the Adolescent
21 -23 July, 1998
New Delhi - India
f
*♦4.
* The paper is prepared by Rafiqul Huda Chaudhury, Adviser on Population Policies and Development
Strategies, in collaboration with his colleagues at CST/CASA, in particular Ms. Malicca Ratne, Ms. Vineeta
Rai, Ms. Daphne M. de Rebello, and Ms. Bina Pradhan. Ms. Neera Shrestha, Management Officer, ably
assisted the author in compilation of data from various sources. For this she deserves deep appreciation.
Thanks are also due to Ms. Toko, Research Assistant, for her occassional help in compilation of the data, Mr.
Kumar Shrestha for his painstaking typing of various drafts of the report and Mr. Sujit K. Shrestha for layout.
The views expressed in this paper are those of the author alone.
PREFACE
This report has been prepared as a resource material for the South Asia Conference on
the Adolescent. The main purpose of this effort is to document and provide a
comparative perspective of the socioeconomic, demographic and reproductive health
profiles of adolescents in the seven SAARC countries based on the available sources of
information. The socioeconomic characteristics and aspects of adolescent health
presented in the paper reveal some significant emerging trends and myths about their
sexual and reproductive behaviour.
The data presented reveals the gravity, diversity and magnitude of the changes that
are taking place in the lives of adolescents. They range from the share of
adolescents in the total population to their sexual and reproductive behaviour,
social values about sex, marriage and marriage practices, and increasing exposure
to grave health risks such as STDs, HIV/AIDS, drug abuse and various forms of
sexual exploitations associated with rising industrialisation and urbanisation. These
changes are important pointers to the changing gender relations, adolescents’
perspectives and expectations as well as the magnitude of the need for quality
education, training and career opportunities required for the future.
j
This document is an important contribution to our knowledge about adolescents in
South Asia. It points out not only the diversity and magnitude of the changes in the
lives of adolescents in the region, but also brings out the implications of these
changes on their lives. It throws lights on evolving gender relations among
adolescents, their perspectives and expectations. It also reveals enormous
information gaps and the lack of understanding of the socio-cultural context within
which adolescents operate and interact in the fast evolving world of today. The
entire gamut of changes that are taking place in the lives of adolescents and the
magnitude of their needs pose challenges to parents, the nations and all those who
are concerned in the advancement of the quality of life of people in general.
We hope that this document will provide a basis for a better understanding and
comparative study of adolescents in the region as well as identifying important areas of
research that will create a more comprehensive and holistic data-base for informed
programme planning and implementation.
July 1998
Kathmandu
Saad Raheem Sheikh
Director
United Nations Population Fund
Country Support Team
TABLE OF CONTENTS
Page
SUMMARY
vii
INTRODUCTION
ix
A.
DEMOGRAPHIC AND SOCIOECONOMIC CHARACTERISTICS
OF ADOLESCENTS
A. 1 Population Size and Growth
B.
1
SOCIOECONOMIC CONDITIONS
B.l Education
B.1.1 Literacy......................................................
B.l .2 Primary Education.....................................
B.l.3 Gross Enrolment Ratio at Secondary Level
B.l.4 Gender Disparity in Education..................
B.l.5 Future Scenario
............
..5
..7
..9
11
11
B.2 Labour Force Participation/Economic Activity
B.2.1 Labour Force Participation Rate
B.2.2 Unemployment Rate.................
C.
11
14
ADOLESCENT REPRODUCTIVE HEALTH BEHAVIOUR
C. 1 Nuptiality Pattern..................
C.2 Median Age at Marriage........
C.3 Pre-marital Sexual Behaviour
15
18
18
C.4 Fertility
C.4.1 Age at First Birth.............
C.4.2 Mean Age at Childbearing
C.4.3 Age-specific Fertility.......
C.4.4 Birth Intervals..................
C.4.5 Ideal Number of Children.
C. 5 Family Planning
21
23
24
27
29
29
D.
HEALTH RISKS OF EARLY MARRIAGE AND CHILDBEARING
D.l Nutrition
.
D.2 Infant Mortality Among Adolescent Girls
D.3 Maternal Mortality
.
D.4 Miscarriage/Still Birth
D.5 STDs/HTV/AIDS......................................
D.6 Abortion
E.
REPRODUCTIVE HEALTH CARE
E.l Antenatal Care
E.2 Vaccination Against Tetanus
E.3 Attendance at Birth
F.
41
42
43
KNOWLEDGE ABOUT SEXUAL, CONTRACEPTIVE AND
REPRODUCTIVE HEALTH
F.l Knowledge of Contraceptive Method
F.2 Knowledge of Reproductive Biology.
F.3 Knowledge of HTV/AIDS
REFERENCES
ii
35
37
38
39
39
40
45
46
46
49
*
LIST OF TABLES
Table 1: Percentage of Adolescents (10-19 Years) ion the Estimated
Total Population by Countries in the SAARC Region, 1995
1
Table 2: Growth and Decline of Adolescent Population:
SAARC Countries (1960-2020).......................
3
Table 3: Literacy Rate of the Early (10-14 Years) and Late Adolescent (15-19 Years)
5
Population by Sex, SAARC Countries.....................................
Table 4: Gross and Net Enrolment Ratio of the Adolescent Population
at Primary Level by Sex and Proportion First Graders Reaching
Final Grade of Primary School SAARC Countries....
Table 5:
7
Gross Enrolment Rate of the Adolescent Population at Secondary Level
10
by Sex, SAARC Countries............................................
Table 6: Labour Force Participation Rate of the Early and Late Adolescent
12
Population by Sex, SAARC Countries...........................................
Table 7: Unemployment Rate Among the Late Adolescent Population (15-19 Years)
14
by Sex, SAARC Countries......................................
Table 8: Percentage of the Late Adolescents (15-19 Years) Ever Married
15
by Sex, SAARC Countries.........................................
Table 9: Percentage of Women 20-24 who were First Married by Exact
Age 12, 15, 18, 20; and Median Age at First Marriage Among Women
20-49 Age, SAARC Countries...............................................................
17
Table 10: Legal Age of Marriage, SAARC Countries
18
Table 11: Experience of Premarital Sexual Intercourse, by Marital Status, Age,
19
and Rural or Urban Residence...........................................
Table 12: Profile of Premarital Sexual Activity of Males during Adolescence:
Summary of Results from Various Studies.......................................
20
Table 13: Percentage Distribution of Women 15-49 by Age at First Birth,
according to Current Age, SAARC Countries..........
22
Table 14: Percentage of Women 15-19 who are Mothers or Pregnant with their First Child
According to Current Age, SAARC Countries
.
23
Table 15: Age-specific Fertility Rates, SAARC Countries
25
Table 16: Trend in Share (Percentage) of All Births Occurring to Adolescent Girls
Aged 15-19, SAARC Countries...........................................
26
Table 17: Percentage of Adolescent Births that are Unplanned, SAARC Countries
27
iii
Table 18: Percentage Distribution of Births in the Five Years Preceding the Survey
by Number of Months Since Previous Birth, According to Age of Mother,
SAARC Countries
28
Table 19: Mean Ideal Number of Children for Ever Married Adolescents Girls,
SAARC Countries
29
Table 20: Percentage of Currently Married Women (10-24) who are Currently Practising
Contraception by Age
30
Table 21: Percentage of Currently Married Adolescent Girls with Unmet Need for
Family Planning, and the Total Demand for Family Planning Services,
SAARC Countries
........................................
31
Table 22: Percent Distribution of Currently Non-users by Whether They Were Visited
by a Family Planning Worker or Spoke with a Health Facility Staff Member
About Family Planning Methods During the 12 Months Prior to Interview,
According to Respondent’s Age, SAARC Countries
..........
32
Table 23: Attitudes of Couples Towards Family Planning (FP), SAARC Countries
33
Table 24: Among Mother (15-19 Years) of Children Under Five Years, Mean Height
and Percentage of Women Shorter than 145 Centimetres, Mean Body Mass
Index (BMI) and the Percentage of Women whose BMI is Less than
18.5 (kg/m2), by Age of Mother: Nepal and Bangladesh
35
Table 25: Energy and Protein Intake by Males and Females of Different Age Groups:
India and Pakistan
36
Table 26: Neonatal, Infant and Child Mortality Rates for the Ten-year Period
Preceding the Survey, by Age of Mother at Birth, SAARC Countries
37
Table 27: Maternal Mortality Rate (MMR) by Age of Mother, Bangladesh and Sri Lanka
38
Table 28: Percent Distribution of Live Births in the Five Years Preceding the Survey
by Source of Antenatal Care during Pregnancy according to Mother’s
Age at Birth: Selected SAARC Countries
41
Table 29: Percent Distribution of Births in the Five Years Preceding the Survey
by Number of Tetanus Toxoid Injections during Pregnancy according to
Mother’s Age at Birth: Selected SAARC Countries
43
Table 30: Percent Distribution of Live Births in the Five Years Preceding the Survey
by Place of Delivery and Type of Assistance during Delivery according to
Mother’s Age at Birth: Selected SAARC Countries
44
Table 31: Percentage Distribution of Currently Married Women with Knowledge
(spontaneous + probing) of Family Planning Methods, SAARC Countries
Table 32: Contraceptive Knowledge Among Adolescents (15-19 years) in
Selected SAARC Countries
iv
45
46
Table 33: Percentage Distribution of Ever-married Women who have Ever Heard
of AIDS, Percentage who Received Information About AIDS from Specific
Sources and Mean Number of Sources of Information about AIDS by Age,
SAARC Countries..........................................................................
47
Table 34: Percentage of Ever Married Women who have Heard of AIDS and who
know Specific Ways to Avoid HTV/AIDS and Percentage with Misinformation,
Nepal 1996...........................................................................................................
48
v
LIST OF FIGURES
Figure 1:
Percentage of Adolescents (10-19 Years) in the Total Population
by Countries in the SAARC Region, 1995...................................
1
Growth (Percentage) of Adolescent Population,
SAARC Countries, (10-19 Years).....................
2
Literacy Rate of the Early (10-14 Years) Adolescent
Population by Sex, SAARC Countries.....................
5
Literacy Rate of the Late (15-19 Years) Adolescent Population
by Sex, SAARC Countries........................................................
6
Figure 5:
Gross Enrolment Rate at Primary Level by Sex, SAARC Countries
8
Figure 6:
Net Enrolment Rate at Primary Level by Sex, SAARC Countries
9
Figure 7:
Gross Enrolment Rate of the Adolescent Population at
Secondary Level by Sex, SAARC Countries................
10
Labour Force Participation Rate of the Late (15-19 Years)
Adolescent Population by Sex, SAARC Countries...........
12
Labour Force Participation Rate of the Early (10-14 Years)
Adolescent Population by Sex, SAARC Countries.............
13
Percentage of the Late Adolescents (15 -19 Years)
Ever Married by Sex, SAARC Countries.............
16
Percentage of Women Aged 20-24 who are First Married
by Exact Age 12, 15, 18 and 20, SAARC Countries........
17
Percentage Distribution of Women 15-49 by
Median Age at Birth, SAARC Countries.....
21
Percentage of Women aged 20-24 who have begun
Child Bearing by Current Age, SAARC Countries.
24
Trend in Share (Percentage) of All Births Occurring to
Adolescent Girls Aged 15-19, SAARC Countries.......
25
Percentage Distribution of Median Months Since
Previous Birth, SAARC Countries......................
27
Percentage of Currently Married Women (15-19) who are
Currently Practising Contraception by Age, SAARC Countries
30
Infant Mortality Rate for the Ten-year Period Preceding
the Survey by Age of Mother at Birth, SAARC Countries.....
38
Figure 18:
Under-five Mortality Rate for the Ten-year Period Preceding
the Survey by Age of Mother at Birth, SAARC Countries.....
39
Figure 19:
Proportion of Mothers who do not Seek Antenatal Care
in Selected SAARC Countries..........................
.42
Figure 2:
Figure 3:
Figure 4:
Figure 8:
Figure 9:
Figure 10:
Figure 11:
Figure 12:
Figure 13:
Figure 14:
Figure 15:
Figure 16:
Figure 17:
vi
SUMMARY
The Cairo International Conference on Population and Development held in 1994 reached a consensus
to address issues of great importance - among them the health and well being of young people. The
Conference recognised that young people ‘are the most important resource for the future’ and the ICPD
Programme of Action urged all countries to firstly, address adolescent sexual and reproductive health
issues, including unwanted pregnancy, unsafe abortion, STD/HTV/AIDS, through the promotion of
responsible and healthy reproductive and sexual behaviour, including voluntary abstinence and the
provision of appropriate services and counselling specifically suitable for that age group and secondly
to substantially reduce all adolescent pregnancies.
Four years after ICPD it is important to review the situation of young people and to assess the gains
already made to improve their health and well being and what other issues remain unresolved. This
profile aims to bring together information on the demographic, socioeconomic and reproductive health
issues of adolescents between the ages 10 -19 in the SAARC countries. It was produced as a background
paper for the Regional Conference on Adolescents in the SAARC Countries, held in New Delhi, from
21-23 July 1998.
Using information from a number of sources, this profile provides a composite picture of adolescents
in the SAARC countries on three major areas: demographic and socieconomic characteristics, marriage
and childbirth, sexual and reproductive health status. It also highlights areas where a lack of data had
made it difficult to assess a number of critical issues that are potentially important to the health and
development of adolescents.
Young people between the ages 10-19 constitute over one-fifth of the total population in the SAARC
countries. In a region with a total population of over 1.2 billion, there are over 260 million adolescents.
In addition to their sheer size, adolescents will continue to grow rapidly, especially in countries that have
not reduced fertility rates appreciably.
A majority of the region’s adolescents are literate indicating improvements in educational opportunities.
However a sizeable number do not complete primary school and the majority do not go on to secondary
school. More boys than girls attend primary and secondary schools.
Although the mean age at marriage is rising. South Asian girls still marry early and many become
mothers before they are 18 years old. By the time a girl reaches 20 years old, she has had 2 children on
average. A progressively larger share of all births is occurring to adolescent girls aged 15-19. Since many
South Asian adolescents are malnourished and short statured, the health risks to adolescent mothers and
their babies can be serious. The risk of dying at child birth is higher than older mothers and children bom
to adolescent mothers have higher risk of mortality and morbidity.
vii
Moreover antenatal care among adolescents is unsatisfactory. Those seeking antenatal care is lowest in
Pakistan (26 percent) and highest in Nepal (44 percent). However majority of pregnant adolescent girls
do receive tetanus toxoid shots.
Only a small proportion of births are delivered by trained birth attendants, ranging from 3 to 11 percent
of births in Bangladesh, Nepal and Pakistan, to 24 percent in India.
A large proportion of adolescent pregnancies are unplanned and with shorter spacing between them
compared to older women. The use of contraception is very low among currently married adolescent girls
15-19 years old. Less than 11 percent are currently using contraceptives, except in Bangladesh and Sri
Lanka, although the unmet demand for contraceptives is at least 25 percent. The majority of adolescents
and their husbands approve of family planning (with the exception of Pakistan), but health workers in
Nepal and Bangladesh do not promote family planning among married adolescent girls. Knowledge on
family planning methods is almost universal, except condom.
Over four in ten adolescent girls are estimated to have RTIs and one in five unmarried adolescent boys
are reported to have STDs in Bangladesh. In Nepal, 16 percent of HIV/AIDS cases are adolescent girls.
Although sex outside marriage is considered taboo yet studies in Bangladesh and India reveal a high
prevalence of pre-marital sex among adolescents. Over 60% of unmarried urban adolescents in
Bangladesh under the age of 16 have engaged in pre-marital sex and in India the figure is one in four.
In India and Nepal, a large proportion of adolescent pregnancies are aborted. Unmarried adolescents are
more likely to seek abortions during the second trimester when the consequences can be particularly
critical.
viii
INTRODUCTION
Adolescents constitute a sizeable proportion of the population accounting for over one-fifth of the total
population of countries in the S AARC region. They will continue to grow in most countries of the region
for the next 30 years due to population momentum. It is estimated that the adolescent population will
increase by 18 percent, from 263 million in 1995 to 311 million in 2020. However, many adolescents
?
in the region are deprived of adequate and quality education and opportunities of acquiring marketable
skills; they face unemployment and underemployment, violence and exploitation and are vulnerable to
the rising incidence of STDs and HIV/AIDS, abortion and malnutrition, etc. All these will have adverse
1
implications for their physical, psychological and economic well being in adulthood.
Adolescent years are critical to prepare for adult roles in almost all aspects of life, including marriage,
motherhood and earners. However, the existing national policies and programmes, outside of the public
education system, do not adequately address the needs and concerns of adolescents and assist them in
making this transition. In a region where adolescents account for one fifth of the population in each of
its constituent countries, the economic, social and health cost of this neglect will be enormous. This
underscores the point that adolescents deserve special attention.
ICPD has recognised the special needs of adolescents and recommended for formulating policies and
programmes addressing their specific needs. Following the ICPD recommendations, various
governments have also acknowledged the need to address adolescents in their policies and programmes.
The initiatives taken so far by the governments to address adolescent issues are limited, covering mostly
reproductive health aspects. However, adolescent issues are much broader than reproductive health in
which education, employment, empowerment, family formation, etc. all play critical roles. Recognising
this broader perspective of reproductive health issues and to assist governments of SAARC countries in
formulating and implementing comprehensive development interventions for adolescents, the present
profile was prepared. It aims to provide a comprehensive regional profile of adolescents covering
interalia various socioeconomic, demographic, and reproductive health aspects of adolescents such as
education, employment, reproductive health, sexuality and family planning.
ix
Demographic and Socioeconomic Characters of Adolescents
A.
DEMOGRAPHIC AND SOCIOECONOMIC CHARACTERISTICS
OF ADOLESCENTS
A.l
Population Size and Growth
)
I
Adolescents (10-19 years) constitute a sizeable proportion of the
total population of countries in the SAARC region. They account
for over one-fifth of the total population of the region. However,
the share of the adolescent population varies, although modestly,
within the region by country. It ranges from highest, 26 percent in
Bangladesh to lowest, 21 percent in Sri Lanka and India. For the
remaining countries, this proportion ranges between 22 and 24
percent (see Table 1 and Figure 1).
Adolescent! constitute over one-
fifth of the total population in
the SAARC region.
______
Table 1: Percentage of Adolescents (10-19 Years) in the Estimated Total Population by Countries
in the SAARC Region, 1995
Country
Total Population
Bangladesh
Bhutan
India
Maldives
Nepal
Pakistan
Sri Lanka
118,200
1,770
929,000
250
21,500
136,300
17,900
_______________________ (in ‘000)
Share (%) of the Adolescent
Population in the Total
Adolescent
Population
30,644
388
193,221
60
4,841
29,786
3,794
25.9
21.9
20.8
24.0
22.5
21.9
21.2
262,734
21.4
Total
1,224,920
Source: UN Population Division, World Population Prospects: 1996 Revision (October 1996).
1
Figure 1
Percentage of Adolescents (10-19 Years) in the
Total Population by Countries in the SAARC Region, 1995
Percentage
0
5
10
15
20
25
30
0
5
10
15
20
25
30
Bangladesh
Bhutan
India
Maldives
Nepal
Pakistan
Sri Lanka
ca Share (%)
1
Socioeconomic, Demographic and Reproductive Health Profiles of Adolescents in SAARC Countries
It is pertinent to mention that adolescents
not only constitute a sizeable proportion
Adolescents not only constitute a sizeable proportion of the total
of the total population, but they will also
continue to grow. However, the growth
population in the JAARC region, but they will also continue to grow
of the adolescent population will vary
rapidly, particularly for the countries which have failed to reduce
between countries in the region,
depending on the magnitude of changes
fertility rates appreciably during recent decades. Conversely, the
in fertility. For example, between 1995
and 2020, the number of adolescents is
growth will be slower or even decline for the countries which have
projected to increase by 108 percent in
experienced substantial fertility decline during recent decades.
Maldives, 88 percent in Bhutan, 73
percent in Pakistan, 65 percent in Nepal,
__________________________________________
11 percent in India and 6 percent in
Bangladesh, but to decline by 9 percent in Sri Lanka (see Table 2 and Figure 2). The large
differences between Maldives, Bhutan, Pakistan and Nepal on the one hand and Sri Lanka,
Bangladesh and India on the other, reflects failure on the part of the former countries to reduce
fertility rates appreciably over recent decades, contrasted with dramatic fertility decline in Sri
Lanka, Bangladesh and India, particularly the former. The decline of the adolescent population
in Sri Lanka is attributed to the sharp fall in fertility during recent decades.
Figure 2
Growth (Percentage) of Adolescent Population,
SAARC Countries, (10-19 Years)
Percentage
220
210
200
190
180
170
160
150
140
130
120
110
100
90
80
70
60
50
40
30
20
10
0
(1995 = 100)
I
Bangladesh
Bhutan
India
Maldives
Nepal
Pakistan
H1960 01970 ®1980 ®1990 ®1995 H2000 M2010 D2020
2
Sri Lanka
t
1
Table!: Growth and Decline of Adolescent Population: SAARC Countries (1960 - 2020)
2015
2020
1995=100
1960
1970
1980
1990
1995
2000
2005
10-14
30.7
37.7
46.8
63.2
73.3
100.0
81.4
90.3
93.5
72.2
88.3
100.0
98.0
136.9
73.0
47.8
134.5
46.8
47.2
69.3
66.9
82.6
79.5
100.0
100.0
113.6
114.3
156.1
98.7
112.0
114.8
99.4
124.4
38.3
33.6
100.3
153.7
89.3
15-19
20-24
Sub-total (10-19)
Sub-total (10-24)
Bhutan
India
34.9
47.1
67.6
80.4
100.0
114.1
113.9
106.4
103.4
112.3
47.4
57.9
71.8
92,3
100.0
116.3
135.4
157.9
169.4
181.8
15-19
20-24
Sub-total (10-19)
49.2
60.3
100.0
115.1
114.4
134.1
132.0
155.9
154.2
182.7
60.8
92.7
93.5
100.0
50.3
48.2
73.2
74.5
196.1
211.1
59.0
72.4
92.5
100.0
115.7
134.8
Sub-total (10-24)
48.8
59.5
73.0
92.8
100.0
115.3
134.0
157.0
156.2
10-14
46.3
46.7
62.6
77.8
88.4
100.0
105.9
60.5
79.0
95.6
100.0
113.2
104,5
120.1
45.0
46.5
53.6
61.6
59.1
44.1
73.1
78.4
76.7
92.1
91.8
100.0
104.8
100.0
100.0
109.3
107.9
118.8
111.8
100.0
100.0
114.7
130.8
132.4
150.0
20-24
Sub-total (10-19)
Sub-total (10-24)
Maldives
10-14
15-19
20-24
Sub-total (10-19)
Nepal
Sub-total (10-24)
10-14
15-19
20-24
Pakistan
Note:
Source:
46.0
26.5
30.8
52.9
61.5
33.3
28.3
50.0
42.9
46.7
29.6
45.7
59.3
37.9
50.1
63.4
42.8
51.5
51.1
67.3
68.4
66.7
56.7
91.9
76.5
180.4
175.5
188.4
176.9
194.8
105.7
105.7
102.8
118.6
120.1
120.2
126.2
124.7
126.4
111.7
116.2
112.4
116.2
110.9
115.7
158.8
176.5
207.7
191.2
230.8
157.1
140.0
173.1
185.7
209.5
257.1
165.0
208.3
144.4
170.4
190.0
195.1
113.9
84.6
85.7
100.0
123.8
80.0
81.5
100.0
100.0
121.7
122.2
83.6
85.9
100.0
114.4
128.3
137.4
146.5
100.0
100.0
119.9
137.4
154.5
165.6
116.8
161.3
145,1
181.7
155.2
165.1
86.0
221.0
155.4
176.9
195.2
Sub-total (10-19)
46.8
40.1
84.6
85.0
116.9
41.9
65.2
66.1
100.0
Sub-total (10-24)
50.7
50.8
140.5
132.4
100.0
116.9
134.6
149.6
162.5
173.4
10-14
32.9
52.2
69.7
87.6
100.0
121.3
134.7
145.5
155.7
166.5
15-19
32,6
51.7
69.4
89.6
100.0
115.5
140.7
156.5
169.1
181.1
20-24
33.5
32.7
41.5
66.4
94.1
69.6
88.5
112.9
118.6
131.1
137.5
159.9
52.0
100.0
100.0
150.6
178.0
161.9
192.4
173.2
Sub-total (10-19)
Sub-total (10-24)
Sri Lanka
128.5
106.4
10-14
15-19
CP
2010
Country
Bangladesh
33.0
49.0
68.7
90.1
100.0
117.0
135.7
153.3
166.5
178.7
10-14
58.7
79.1
84.7
91.7
100.0
86.6
79.6
80.2
84.9
89.1
15-19
53.7
67.2
89.0
91.1
100.0
109.5
95.2
87.6
88.4
93.7
20-24
51.3
65.7
110.5
122.0
99.4
Sub-total (10-19)
Sub-total (10-24)
97.5
87.0
86.6
91.2
54.8
71.1
89.0
94.0
100.0
100.0
106.4
83.7
98.4
73.4
100.3
91.4
100.0
56.3
94.2
86.7
101.4
97.4
90.4
90.1
93.7
Projected numbers are taken from the medium projection.
United Nations, 1997, The Sex and Age Distribution of the World Populations: The 1996 Revision, New York.
Socioeconomic Conditions
B.
SOCIOECONOMIC CONDITIONS
B.l
Education
B.1.1 Literacy
Data in Table 3 and Figures 3 and 4 indicate
that in most South Asian countries the
majority of both the early (10-14 years) and
late (15-19 years) adolescents are literate. The
literacy rates of both the early and late
adolescents are higher than that of the
average literacy rate of the total population,
indicating improvement in educational
opportunities in recent decades.
Table 3:
Although there has been a significant improvement in
educational opportunities in recent decades, a sizeable
proportion of the adolescent population, particularly females,
are yet to receive formal education.
Literacy Rate of the Early (10-14 Years) and Late Adolescent (15-19 Years) Population by Sex,
SAARC Countries
Overall Literacy Rate for
the Population 6 Years
and Above
Literacy Rate by Age/Sex
Country
Bangladesh
Bhutan
India
Maldives
Nepal
Pakistan
Sri Lanka
1995
NA
92/93
1990
1991
91/92
1994
15-19
10-14
Year
Male
Female
Total
F/M
Ratio
Male
Female
Total
48.5a/
NA
82.1
93.3
76.0
69.2
94.8
48.6a/
NA
64.1
95.2
49.3
47.3
95.7
48.5a/
NA
73.4
94.2
63.2
58.4
95.3
100
NA
78
102
65
68
101
61.1a/
NA
80.5
97.6
71.5
69.8
94.4
59.1a/
NA
56.2
98.0
38.6
44.1
95.1
60.2a/
NA
68.1
97.8
54.7
57.5
94.8
NA = Not Available.
Sources: 1.a/ Bangladesh: Bangladesh Bureau of
Statistics. Survey on Household and
Population
Characteristics 1995.
b/ Bangladesh Bureau of Statistics.
Population and Housing Census
1991.
India: National Family Health Survey,
2.
1992-93.
Maldives: Population and Housing
3.
Census 1990.
4.
Nepal: Population and Housing
Census 1991.
Pakistan: Women and Men in
5.
Pakistan, 1995.
Sri Lanka: Demographic Survey
6.
1994.
F/M
Ratio
97
NA
70
100
54
63
100
Male
Female
Total
38.9b/
NA
68.8
90.0
54.5
52.8
92.5
25.5b/
NA
43.3
91.0
25.0
26.3
87.9
32.4b/
NA
56.3
90.5
39.6
39.9
90.1
Figure 3
Literacy Rate of the Early (10-14 Years) Adolescent
Population by Sex, SAARC Countries
Literacy Rate
zq
100
I
!
90
80
70
I
I
I
1
60
50
40
2'
30
20
10
0
Bangladesh
India
I
&
1
Maldives
Nepal
Pakistan
i
•I
Sri Lanka
aMale
^Female
5
Socioeconomic, Demographic and Reproductive Health Profiles of Adolescents in SAARC Countries
Figure 4
Literacy Rate of the Late (15-19 Years) Adolescent
Population by Sex, SAARC Countries
Literacy Rate
-ff51
100
!
i
90
J
80
70 /
'' <8
I I
II I
Si 1- I
/it
I___
50
_
20
-J
10
-8: i
■
■
-
_q
I
Ke
iI
-
11
z ' ’
30
I
q&
-J
60 z
40
8
$
■ j
l_ I
i ' q1I
I
I
b
I
I
Si
■
I
0
Bangladesh
India
Maldives
Nepal
V
'1
15$
—J
Pakistan
Sri Lanka
^Male
a Female
Even though a majority of the younger cohorts have had a greater opportunity to education than
the older cohorts, this opportunity was not seized equally by males and females and by all
countries in the region. A sizeable proportion of the adolescent population, particularly females
are yet to receive formal education in all countries of the region, except for Sri Lanka and
Maldives. The illiteracy rate, for the early adolescents (10-14 years), ranges from highest, 52
percent in Bangladesh, to 42 percent in Pakistan, 37 percent in Nepal, 27 percent in India, 6
percent in Maldives and 5 percent in Sri Lanka. The corresponding proportions for the late
adolescent (15-19 years) population are 45 percent in Nepal, 43 percent in Pakistan, 40 percent
in Bangladesh, 32 percent in India, 5 percent in Sri Lanka and 2 percent in Maldives.
The illiteracy rate is higher for females than males. This overall finding also holds for all
countries in the region, except Sri Lanka and Maldives. The illiteracy rate for the early adolescent
girls exceeds that of boys by 113 percent in Nepal, 100 percent in India, 71 percent in Pakistan.
Conversely, in case of Maldives and Sri Lanka, the illiteracy rate for the early adolescent boys
exceeds that of girls by 40 and 21 percent respectively. In Bangladesh, the illiteracy rate is almost
the same for the early adolescent boys and girls. The illiteracy rate for the early adolescent girls
ranges from 53 percent in Pakistan to 51 percent each in Bangladesh and Nepal, 36 percent in
India, 5 percent in Maldives and 4 percent in Sri Lanka. A similar pattern of sex differentials in
illiteracy rate by country also emerges for the late adolescent group, although at a slightly
attenuated rate. The illiteracy rates for the early and late adolescents, both boys and girls, are
6
Socioeconomic Conditions
lowest in Sri Lanka and Maldives, accounting for 2 to 7 percent of the adolescent population. The
literacy rate for boys is highest in Bangladesh, while for girls it is highest in Pakistan accounting
for 39-52 percent of adolescent boys and 50-56 percent of adolescent girls, respectively.
B.1.2 Primary Education
Data in Table 4 and Figure 5 show that in most South
Asian countries, almost all children, particularly male
children attend primary school. However, the picture
is misleading as the analysis is based on gross
Most countries• in• South Asia are still far from
enrolment ratio which also includes students who are
under aged, over aged and repeaters. Considering the
achieving universal primary education.
net enrolment ratio, which allows for over aged and
under aged children, it will appear that almost all
countries in the region, except Sri Lanka, are still far
from enrolling all primary school age children in
school. To attain one hundred percent enrolment at
primary level, Bangladesh has to increase enrolment
for an additional 20 percent of primary school age children, both boys and girls, into school. The
corresponding figures for boys and girls range between 20-25 percent and 40 percent respectively
for rest of the SAARC countries (see Table 4 and Figure 6).
Gross and Net Enrolment Ratio of the Adolescent Population at Primary Level by
Sex and Proportion First Graders Reaching Final Grade of Primary School,
SAARC Countries
Table 4:
Gross/Net Enrolment Rate at Primary Level by Sex
Year
Country
Bangladesh a/
Bhutan b/
India a/
Maldives b/
Nepal a/
Pakistan a/
Sri Lanka b/
1993
90-95
1993
90-95
1993
1993
90-95
Net Enrolment
(1993-97) b/
Gross Enrolment
Male
Female
F/M
Ratio
128
31
113
136
129
80
105
105
19
91
133
87
49
105
82
61
81
98
67
61
100
Male
Female
F/M
Ratio
82
82
100
75
61
81
80
71
100
60
62
100
75
87
100
% of Grade 1
Enrolment
Reaching
Final Grade of
Primary
School
47
82
62
93
52
48
98
Source: aZ Jones, Gavin. ‘Population Dynamics and Their Impact on Adolescents in the ESCAP Region’, AsiaPacific Population Journal, Vol. 12, No. 3, 1997.
bZ
UNICEF. The State of World’s Children. 1998.
7
Socioeconomic, Demographic and Reproductive Health Profiles of Adolescents in SAARC Countries
In most countries of South Asia, almost all children,
particularly males attend primary school. However, a large
proportion of them fail to reach grade 5. For example, in
Bangladesh where the gross enrolment rates for both boys
and girls are over 100 percent, less than 50 percent of
children reach grade 5. In India and Nepal where the rates
are nearly 100 percent, only 62 percent and 52 percent of
school attending children reach grade 5 respectively. Only
in the case of Maldives and Sri Lanka, where the gross
enrolment rates for both boys and girls are well over 100,
nearly one hundred percent of school going children reach
grade 5.
A large proportion of the primary
school children fail to complete
primary level education.
*
’
?W.I
Figure 5
Gross Enrolment Rate at Primary Level
by Sex, SAARC Countries
Gross Enrolment Rate
150
Bi. •-
140
130
ISmF
/
M
h
_
“i
120
110
100
90
80
70
60
50
40
30
20
10
0
%
isl
IJ
—I
g
..
“II
Jg
I I
id i
I
I
i
II
i
J r- I
I
I
1
I I di I
//ll II —i II I IIiI B 1i 1 il I
I
L
II
Ii II
I
rl
II 1
M L&7
.' '•!
■
_I%
I
I
-
-
_
-
-
Baaar
—
l
I
da'
‘
_
------------------------Bangladesh Bhutan
a
■a
-
India
I
Maldives
□ Male
a Female
8
r
-1
■i
&
Nepal
Pakistan Sri Lanka
Socioeconomic Conditions
Figure 6
Net Enrolment Rate at Primary Level
by Sex, SAARC Countries
Net Enrolment Rate
120
110
100
90
80
I
I
70
60
50
■
40
...
30
20
10
o
Bangladesh
India
Nepal
Pakistan
Sri Lanka
ClMale
®Female
B. 1.3 Gross Enrolment Ratio at Secondary Level
The school enrolment rate declines drastically from primary to
secondary level, indicating relatively fewer adolescents tend to
attend school beyond primary level. Data in Table 5 and Figure
7 show that over 70 percent of adolescent boys in Bangladesh
In mostcountrittofMAiia an
and Pakistan and 90 percent in Bhutan are not attending
secondary school. The corresponding proportions are over 50
absolute majority of the secondary
percent in Maldives and Nepal. Only in Sri Lanka and India, 6
to 7 out of 10 secondary school children are attending secondary school age children are outside the
schools. In most countries of the region, female enrolment at the
edui
jjeation system. The situation is
secondary level is abysmally low, except for Sri Lanka. About MB
80 percent of the adolescent girls are enrolled in secondary
worse for female than male <
school in Sri Lanka, as contrasted with 49 percent in Maldives,
37 percent in India, 23 percent in Nepal, 13 percent in Pakistan,
children.
12 percent in Bangladesh and only 2 percent in Bhutan. The
gross enrolment rate at the secondary level is highest in Sri
Lanka, with 71 percent for boys and 78 percent for girls, and
lowest in Bhutan, with 7 percent for boys and 2 percent for girls.
■
■
■J
■
’•r
9
Socioeconomic, Demographic and Reproductive Health Profiles of Adolescents in SAARC Countries
Table 5:
Gross Enrolment Rate of the Adolescent Population at Secondary Level by Sex, SAARC
Countries
Gross Enrolment Rate
Year
Country
Bangladesh
Bhutan
India
Maldives
Nepal
Pakistan
Sri Lanka
Source:
a/
b/
1993 a/
1990-95 b/
1993 a/
1990-95 b/
1993 a/
1993 a/
1990-95 b/
Male
Female
Female/Male
Ratio
26
7
60
49
46
29
71
12
2
37
49
23
13
78
46
29
62
100
50
45
110
Same as in ‘a’ of Table 4.
Same as in ‘b’ of Table 4.
Figure 7
Gross Birolment Rate of the Adolescent Population
at Secondary Level by Sex, SAARC Countries
Gross Enrolment Rate
80
70
«•
*
60
I
-
50
I
40
d
d
I
30
‘■■’■■I
J
■■
20
■
n;
--
s
10
I
I
1
o --------Bangladesh Bhutan
India
Maldives
□ Male
HHFemale
10
Nepal
Pakistan Sri Lanka
Socioeconomic Conditions
B.1.4 Gender Disparity in Education
There exists a wide gender gap in enrolment at both the primary
and secondary levels, particularly the latter. The gender disparity
in enrolment at the primary level is highest in Bhutan followed by
Pakistan and Nepal. Female gross enrolment rate constitutes
about 60-67 percent of male enrolment rate at the primary level
in Bhutan, Nepal and Pakistan (see Table 4 and Figure 5). The
female to male enrolment ratio at the primary level is 80 percent
in India and about 100 percent in Sri Lanka, Maldives and
Bangladesh, indicating achievement of gender parity in enrolment
at the primary level in these three countries. While female
enrolment rate accounts for about 45 to 60 percent of male
enrolment rate at the secondary level in almost all countries of the
region, except Bhutan and Sri Lanka, the two extreme outliers
(see Table 5 and Figure 6). The female to male enrolment ratio at
the secondary level is only 29 percent in Bhutan and 110 percent
in Sri Lanka, indicating the highest gender disparity in enrolment
at the secondary level in favour of male and female respectively.
A wide gender gap exists in
enrolment at both the primary
and secondary levels, particularly
the latter.
B. 1.5 Future Scenario
From the preceding findings, it appears that few adolescents tend
to attend school beyond primary level. To achieve universal
primary education and increase enrolment at the secondary level,
massive investment will be required. Even with massive
investment, countries with high fertility and higher projected
growth of the adolescent population will find it difficult to retain
the same level of enrolment rate, not to speak of increasing
enrolment rate. Conversely, countries which have experienced a
considerable decline in fertility and a slower projected growth of
the adolescent population such as Sri Lanka, Bangladesh and
India, particularly the former will find it relatively easier not only
to keep the enrolment rate at the current level, but also to increase
it.
B.2
Countries with high fertility and
higher projected growth of the
adolescent population will find it
difficult to retain the same level of
Khool enrolment, least of all
raising school enrolment.
Labour Force Participation/Economic Activity
B.2.1 Labour Force Participation Rate
A large proportion of the late adolescent population
are engaged in productive activities in most countries
of the S AARC region, particularly those which have
lower enrolment ratio at the secondary level such as
Bangladesh, Pakistan, Nepal and India. Conversely,
the participation rate is lower in countries which have
higher enrolment ratio at the secondary level such as
Sri Lanka and Maldives. The labour force
participation rate for the late adolescent population
The labour force participation, in general, is
higher in countries which have lower enrolment
rate at the secondary level. The higher the school
enrolment rate, the lower the labour force
participation rate. The labour force participation
rate is relatively lower for females than males.
11
Socioeconomic, Demographic and Reproductive Health Profiles of Adolescents in SAARC Countries
(15-19) is highest in Bangladesh followed by Nepal, India and Pakistan, accounting for 67, 49,
36 and 33 percent of the total population aged 15-19 respectively, while it is lowest in Sri Lanka
followed by Maldives, accounting for 18 and 30 percent of the late adolescent population
respectively (See Table 6 and Figure 8).
Table 6:
Labour Force Participation Rate of the Early and Late Adolescent Population by
Sex, SAARC Countries
Labour Force Participation Rate by Age
10-14
Year
Country
15-19
Male
Female
Total
Male
Female
Total
Bangladesh a/
Bhutan
India b/
1990/91
32.3 d/
6.6 d/
20.3 d/
72.8
59.5
66.8
1991
43.8
26.2
35.6
1990
1991
1993/94
1995
5.07
(5-19)
1.6
28.5
5.38
(5-19)
Maldives a/
Nepal c/
Pakistan a/
Sri Lanka a/
5.66
(5-19)
3.8
18.4
46.8
50.0
52.3
28.5
13.6
49.3
33.4
23.5
30.1
49.4
33.4
18.2
Source: a/
b/
c/
d/
23.3
Jones, Gavin 1997. ‘Population Dynamics and Their Impact on Adolescents in the
ESCAP Region’, Asia-pacific Population Journal, Vol. 12, No. 3, 1997.
Computed by Professor Ashish Bose from Table B.1 Economic Table. Population
Census of India 1991.
Central Bureau of Statistics. Population and Housing Census of Nepal, 1991.
Bangladesh Bureau of Statistics. Population and Housing Census, 1991.
Figure 8
Labour Force Participation Rate of the
Late (15-19 Years) Adolescent Population by Sex,
SAARC Countries
Labour Force Participation Rate
100
90
80
70
60
50
40
30
20
10
1
/I
I
/I
kJI r
g
- I
II
a
-III - I-d1
. I L
r
/ i fl
I r*I I I
ri I H IijL; i
r
J
“I
-
— >1
I
r -“
-!
R
I
Fl
I Iwl
0
Bangladesh
India
Maldives
°Male
Female
12
Nepal
Pakistan
Sri Lanka
V
Socioeconomic Conditions
The labour force participation rate is higher for males than females in every SAARC country.
However, the gender disparity in labour force participation rate is more glaring in Pakistan and
Maldives than any other country in the region. Female participation rate accounts for 99 percent,
82 percent, 82 percent, 64 percent, 60 percent and 29 percent of male participation rate in Nepal,
Bangladesh, Sri Lanka, Pakistan, India and Maldives respectively. The participation rate for male
adolescent is highest in Bangladesh at 73 percent followed by 52 percent in Pakistan, 50 percent
in Nepal, 47 percent in Maldives, 44 percent in India, and 29 percent in Sri Lanka.
A large proportion of the early adolescent population are also
engaged in economic activities as may be observed from data in
Table 6 and Figure 9. As many as 20 percent of the early adolescents
are engaged in productive activities in Bangladesh and Nepal.
Among the early adolescents, the participation rate is also higher for
males than females in every country for which data are available,
except Nepal, where the pattern is reversed in favour of females.
A large proportion of the early
adolescents are also
-
economicallyactive.
Figure 9
Labour Force Participation Rate of the
Early (10-14 Years) Adolescent Population by Sex,
SAARC Countries
Labour Force Participation Rate
40
35
30
25
20
15
10
5
I
i ti"
0
Bangladesh
India
Maldives
Nepal
□ Male
®Female
13
Socioeconomic, Demographic and Reproductive Health Profiles of Adolescents in SAARC Countries
B.2.2 Unemployment Rate
Unemployment rate among the late adolescents is also
reported to be high in some countries of the region,
particularly Sri Lanka, Nepal, Pakistan and India, while this
The incidence of unemployment among
is relatively lower in Maldives and Bangladesh (see Table 7).
The rate is higher for females than males in Pakistan, Sri
the late adolescent population is also
Lanka and Maldives. However, in case of India and Nepal,
the unemployment rate is higher for males than females. The
reported to be very high in some
unemployment rates for both the adolescent boys and girls are
almost the same in Bangladesh. The unemployment rate for
countries of the region. The rate is
male adolescents ranges from highest 41 percent in Sri Lanka
usually higher for females than males.
to 21.2 percent in Nepal, 13.9 percent in India, 8.4 percent in
Pakistan, 3.3 percent in Bangladesh and 1.9 percent in
Maldives. The conesponding rates for females are 58.3
percent in Sri Lanka, 11.9 percent in Pakistan, 10.0 percent in
Nepal, 5.6 percent in India, 3.6 percent in Maldives and 3.2
percent in Bangladesh. The unemployment rates for both the adolescent boys and girls are highest
in Sri Lanka followed by Nepal, while it is lowest for boys and girls in Maldives and Bangladesh
respectively.
Table 7:
Unemployment Rate Among the Late Adolescent Population (15-19 Years) by Sex,
SAARC Countries
Unemployment Rates
Country
Bangladesh (1989)
Bhutan
India (1981)
Maldives (1990)
Nepal
Pakistan (1994)
Sri Lanka (1995)
Female
Male
3.2
3.3 *
5.6
3.6
13.9
1.9*
21.2
8.4
41.0
10.0
11.9
58.3
Note:
* The age group is 10-19 (under 20 years).
Source:
India, Pakistan and Sri Lanka: Jones, Gavin. 1997. “Population Dynamics and their
Impact on Adolescents in ESCAP Region.” Asia-Pacific Population Journal, Vol. 12, No.
3, 1997.
Bangladesh: UN, 1995. Women of Bangladesh, A Country Profile.
Maldives: Ministry of Planning, Human Resources and Environment, Analytical Report
on the 1985 & 1990 Population and Housing, 1996.
Nepal: Central Department of Population Studies, Employment Survey 1995, Tribhuvan
University, Nepal.
14
J
Adolescent Reproductive Health Behaviour
ADOLESCENT REPRODUCTIVE HEALTH BEHAVIOUR
c.i
Nuptiality Pattern
Early marriage continues to be the norm, particularly for
women in most countries of the region, despite laws
prohibiting marriage before age 18 for girls and 21-24
years for boys (see Table 10). At least two in five of the
late adolescent girls aged 15-19 were already married in all
countries of the region, except Sri Lanka and Pakistan.
The proportion of girls married by the age 15-19 years
were lowest in Sri Lanka followed by Pakistan, accounting
for 7 and 17 percent of all girls aged 15-19, while this
proportion is highest in Bangladesh, followed by Nepal,
India and Maldives, accounting for 51 percent, 48 percent,
39 percent and 37 percent of all girls aged 15-19
respectively (see Table 8 and Figure 10).
Table 8:
Early marriage has been and continues
to be the practice, particularly for
women in most countries of South Asia.
Percentage of the Late Adolescents (15-19 Years) Ever Married by Sex,
SAARC Countries
Percentage of Ever Married
Country
Bangladesh
Bhutan
India
Maldives
Nepal
Pakistan
Sri Lanka
Source:
Reference Year
1991
NA
1992/93
1990
1991
1996/97
1994
Male
Female
5.0
NA
6.7
6.1
20.6
3.8
51.3
NA
39.1
36.5
47.8
17.1
7.1
Bangladesh: Bangladesh Bureau of Statistics Population and Housing Census 1991.
India: National Family Health Survey, India 1992-93.
Maldives: Ministry of Planning and Environment. Population and Housing Census of Maldives
1990.
Nepal: Central Bureau of Statistics. Population and Housing Census 1991.
Pakistan: Pakistan Fertility and Family Planning Survey 1996/97.
l
Sri Lanka: Department of Census and Statistics. Demographic Survey 1994.
15
Socioeconomic, Demographic and Reproductive Health Profiles of Adolescents in SAARC Countries
Figure 10
Percentage of the Late Adolescents (15-19 Years)
Ever Married by Sex, SAARC Countries
Percentage
60
55
50
45
r
zzz
I
40
35
•
I
■
30
25
■
20
15
10
I
fj
5
0
Bangladesh
India
Maldives
Nepal
Pakistan
Sri Lanka
^Female
®Male
In most countries of the region, except Sri Lanka, almost 3 in
five women aged 20-24 were married by age 18; and at least
one-quarter of those were married by the time they were 15
(see Table 9 and Figure 11). The proportions of females aged
20-24 married by the time they were 18 and 15 were lowest for
Sri Lanka, accounting for only 12 percent and 1 percent of the
total female population of the corresponding age group, while
these were highest for Bangladesh, followed by Pakistan,
Nepal and India. At least 70 percent of women aged 20-24 in
Bangladesh and Pakistan were married by the time they were
18. The corresponding proportions for Nepal and India were 60
percent and 55 percent respectively. About one-third of women
aged 20-24 in Bangladesh, one-quarter in India and one-fifth
in Nepal were married by the time they were only 15.
In most countries of the region
almost three in five women and one
-
. in four women were married by the
time they were Landis
respectively.
. -
16
-•
I
Adolescent Reproductive Health Behaviour
Table 9:
Percentage of Women 20-24 who were First Married by Exact Age 12,15,18, 20;
and Median Age at First Marriage Among Women 20-49 Age, SAARC Countries
Percentage of Women who
were First Married by Exact
Age
Country
Bangladesh (1993-94)
Bhutan
India (1992-93)
Maldives (1990)
Nepal (1996)
Pakistan (1994-95)
Sri Lanka (1993)
Source:
12
15
18
20
7
NA
47.2
11.8
26.1
82.1
55.4
71.4
NA
NA
2.2
NA
NA
73.3
NA
54.2
NA
60.3
71.9
12
86.3
24
NA
19.1
33.4
1
NA
75.7
Median Age at First
Marriage
20-24
20-49
25-49
15.3
14.4
NA
16.4
NA
14.1
NA
16.1
NA
17.1
16.4
16.9
NA
NA
NA
16.2
17.3
22.4
NA
17.4
NA
Bangladesh: Bangladesh Demographic and Health Survey, 1993-1994, 1994.
Bhutan: Report on National Health Survey, June 1994, Health Division, Thimphu, Bhutan,
January 1996.
India: National Family Health Survey, 1992-93, August 1995.
Nepal: Nepal Family Health Survey, 1996, March 1997.
Pakistan: Pakistan Contraceptive Prevalence Survey 1994-95, Final Report, 1998.
Sri Lanka: Singh S. et.al. 1996. ‘Early Marriage Among Women in Developing Countries’.
International Family Planning Perspective, 22, 148-157.
Figure 11
Percentage of Women Aged 20-24 who are
First Married by Exact Age 12,15,18 and 20,
SAARC Countries
Percentage
100
95
90
85
80
75
70
65
60
55
50
45
40
35
30
25
20
15
10
5
0
Bangladesh
Bhutan
India
Nepal
Pakistan
Sri Lanka
Age
□ 12 ®15 ®18 020
17
Socioeconomic, Demographic and Reproductive Health Profiles of Adolescents in SAARC Countries
C.2
Median Age at Marriage
In most countries of the region, the median age at first marriage for the youngest cohort (20-24
years) is higher than that of the older cohort (25-49 years), indicating increasing age at marriage
in recent decades (see Table 9). However, the median age at first marriage even for the youngest
cohort remains much below the official legal age at marriage for most countries of the region,
except for Sri Lanka (see Table 10). In Sri Lanka, the median age at marriage is much higher
than the legal age at marriage.
Legal Age of Marriage, SAARC Countries
Table 10:
Country
Bangladesh
Bhutan
India
Maldives
Nepal
Pakistan
Sri Lanka
Source:
Female
Male
18
18
18
24
18
21
18
18
21
Bangladesh:
Family Law Ordinance of 1961, Quoted in Bangladesh Bureau of
I
Statistics, Bangladesh, Bangladesh Population Census, 1991, Vol. 1, Analytical
Report, Sept. 1994.
India: Child Marriage Restraint Act of 1978, Quoted in International Institute for
Population Studies, National Family Health Survey 1992-93, Bombay, August 1995.
Nepal: Central Bureau of Statistics, Population Monograph of Nepal, 1995 (Note: The
minimum legal age marriage in Nepal is 18 years for males and 16 years for females
with consent of parents).
C.3
Pre-marital Sexual Behaviour
Sex outside marriage is considered unethical and widely
frowned upon in the socio-cultural setting of the region.
Studio in Bangladesh and India reveal a
In the light of this consideration, very little information on
pre-marital sexual behaviour is collected systematically high degree of prevalence of pre-marital sex
and scientifically. However, few studies which were
among adolescents. Over 6 in 10 and i in 10
conducted in Bangladesh and India, despite their
limitations in study design and methodologies, reveal a
unmarried urban boys and girls at ages
high degree of prevalence of pre-marital sex among
below 16 and 16 reported to have had sexual
adolescent population. The Bangladesh study, based on a
experiences in Bangladesh, respectively. One
rural-urban sample of over 1200 adolescents, reveals that
the prevalence of sex among adolescents in general,
in four to one in five has engaged in sexual
increases with age and this is higher in urban than in rural
relations in India. The prevalence of preareas and among boys than among girls. The data in
Table 11 shows that the majority of unmarried urban
marital sex is higher in urban than in rural
adolescent boys reported to have engaged in sexual
areas, and among boys than among girls.
relations by their early teens, while a good proportion of
urban unmarried adolescent girls have had sexual
relations by their late teens. Over 6 in 10 unmarried urban
adolescent boys reported to have had sexual experiences at ages less than 16. The figure rises
to 8 in 10 at age 16. More than one in 10 urban unmarried adolescent girls reported to have had
’
18
■
-
■
Adolescent Reproductive Health Behaviour
sexual experiences at ages below 16 and 16. This figure rises to one in 5 and one in 3 at ages 17
and 18 respectively. The prevalence of pre-marital sex among adolescents is lowest among rural
girls. However, the incidence of pre-marital sex among rural adolescent boys is not uncommon.
About one in four to two in five unmarried rural adolescent boys reported to have had sexual
experiences at ages 16, 17 and 18, respectively.
4
Examination of findings of various studies conducted in India on unmarried adolescents and
college-aged men reveal that about one in four to one in five has engaged in sexual relations
(see Table 12).
Table 11: Experience of Premarital Sexual Intercourse, by Marital Status, Age, and
Rural or Urban Residence
Marital Status and
Rural/Urban Residence
Age (unmarried) or Age at Marriage
<16
16
17
18
19
Unmarried Females:
Urban
Rural
Total
14%
3%
6%
13%
7%
9%
20%
7%
10%
35%
6%
18%
47%
5%
24%
N
116
90
40
56
37
Married Females:
Urban
Rural
Total
10%
6%
8%
28%
7%
13%
24%
40%
9%
25%
5%
12%
N
389
136
54
34
7
Unmarried Males:
Urban
Rural
Total
64%
4%
31%
80%
26%
40%
67%
25%
36%
88%
38%
54%
88%
44%
61%
N
48
58
55
72
66
Source:
29%
Haider, S.J. et.al., 1997. “Study of Adolescents: Dynamics of Perception, Attitude,
Knowledge and Use of Reproductive Health Care”, Research Evaluation
Associates for Development (READ), 1997.
19
Socioeconomic, Demographic and Reproductive Health Profiles of Adolescents in SAARC Countries
Table 12: Profile of Premarital Sexual Activity of Males during Adolescence:
Summary of Results from Various Studies
Site
Sample
Method
Language
Percentage
Reporting
Sexual
Activity in
Adolescence
Age at
Sexual
Initiation
Proportion of
Sexually Active
Men Reporting:
Relations
with
CSW
Condom
Use
Author
1
Adolescents and
young adults
16 cities
Self-reported
questionnaires
English
28
na
19
na
Watsa,
1993
2
College students
aged 19-23, male
Hyderabad
Self-reported
questionnaires
and FGDs
English
25
17-18
25
rare
Goparaju,
1993
3
Unmarried males*
college students
(mean age 18)
migrants
(mean age 20)
white collar workers
(mean age 24)
blue collar workers
(mean age 23)
Nasik/
Thane
Face-to-face
interviews if
illiterate; self
administered if
literate
English
Marathi
19
17
2**
67
25
17
8**
□extre
m-ely
lowD
Savara
and
Sridhar,
1994
26
19
15**
30
18
5**
4
Adolescent male
truck cleaners
Indore
Face-to-face
interviews
Hindi
25
na
high
6
Bansal,
1992
5
Adolescent boys
aged 16-19
Rural
Gujarat
Face-to-face
interviews
Gujarati
16
17-18
78
20
Sharma
and
Sharma,
1995
6
College going
adolescent males
aged 16-19
Urban
Gujarat
Face-to-face
interviews
Gujarati
9
na
na
na
Sharma
and
Sharma,
1995
7
School boys
Delhi
Survey
English
25
na
na
na
Sehgal
etal. 1992
8
Male readers*
all-lndia
Magazine
survey
English
41
17-19
37
na
Savara
and
Sridhar,
1991
**
na
53
47
reporting on adolescent sexual activity retrospectively where necessary
sexual initiation only
not ascertained
Source: Jejeebhoy, S. 1996 “Adolescent Sexual and Reproductive Behaviour: A Review of the Evidence from
India”, International centre for Research on Women, 1996.
20
...I
Adolescent Reproductive Health Behaviour
C.4
Fertility
C.4.1
Age at First Birth
Childbearing among adolescent women, despite a greater risk to the health of both the mother
and child, is very common in most countries of South Asia.
Table 13 and Figure 12 present the percentage distribution of women
by age at first birth, according to current age for selected SAARC
countries. Data shows that childbearing begins early in most countries
of the region. A large majority of women become mothers on or before
they reach the age of 20. About one in five women give birth before
age 20. The incidence of early childbearing is highest in Bangladesh
and lowest in Pakistan, while India and Nepal occupy the intermediary
positions. Childbearing commences at least one year earlier among
Bangladeshi women compared to Indian and Nepali women and at
least 4 years earlier than Pakistani women. The median age at first
birth is between 21 and 23 in Pakistan, 19 and 20 in Nepal and India,
and 17 and 18 in Bangladesh. The data in Table 13 also shows that the
age at which women have their first child has shown little or no
increase in India, Nepal and Pakistan, while this has marginally
increased in Bangladesh, from around 17 for older women to around
18 for women in their early 20s. These findings may signal a plateau
in the trend towards later age atfirst birth, particularly for countries
which have achieved a median age at first birth 19 or above.
A large majority of women
become mothers on or before
the age ofzo. Data also signal a
plateau in the trend towards
later age at first birth.
Figure 12
Percentage Distribution of Women 15-49 by
Median Age at Birth, SAARC Countries
Percentage
30
25
20
15
10
5
o
Bangladesh
India
Nepal
Pakistan
Median Age at Birth
□ 20-24 H 25-29 ® 30-34 ® 35-39 040-44 O 45.49
21
J
Socioeconomic, Demographic and Reproductive Health Profiles of Adolescents in SAARC Countries
Table 13:
Country/
Current Age
Bangladesh
15-19
20-24
25-29
30-34
35-39
40-44
45-49
India
15-19
20-24
25-29
30-34
35-39
40-44
45-49
Nepal
15-19
20-24
25-29
30-34
35-39
40-44
45-49
Percentage Distribution of Women 15-49 by Age at First Birth, according to
Current Age, SAARC Countries
Age at First Birth
Women
with
no Birth
<15
15-17
13-19
20-21
22-24
25+
Total
69.0
27.6
8.0
2.4
1.9
1.9
1.3
9.2
14.7
16.0
15.9
19.3
20.9
18.7
18.9
31.8
41.0
45.7
39.9
48.5
45.6
3.0
NA
6.5
NA
2.6
6.3
6.5
7.3
5.2
4.3
NA
NA
2.0
3.9
4.8
2.8
3.0
100.0
100.0
100.0
100.0
100.0
100.0
100.0
2592
2087
2057
1460
1200
878
656
81.4
2.9
5.1
5.8
5.7
11.4
23.2
27.3
27.4
28.2
27.9
27.6
4.3
20.3
22.2
23.5
NA
NA
4.5
NA
NA
23.6
22.2
13.4
16.8
17.5
16.5
17.9
16.8
12.8
13.9
4.6
7.6
8.5
7.8
8.9
100.0
100.0
100.0
100.0
100.0
100.0
100.0
23150
22057
18296
14915
12577
9859
8088
19.5
19.4
19.3
19.3
19.4
12.4
24.3
27.5
25.8
22.4
25.9
25.5
5.3
25.4
26.7
24.8
24.0
23.8
21.5
16.3
18.3
20.3
20.3
21.2
19.0
NA
5.3
13.0
14.0
17.3
13.5
13.7
NA
NA
2.8
7.8
10.8
9.1
12.9
100.0
100.0
100.0
100.0
100.0
100.0
100.0
2229
1909
1671
1387
1136
933
836
19.9
19.4
19.7
20.1
19.8
20.0
6.7
13.9
18.7
20.0
16.4
15.6
12.4
4.1
13.3
18.1
17.3
18.4
15.6
15.7
NA
NA
10.6
15.7
16.1
16.5
15.5
12.9
4.8
14.0
19.7
20.6
19.8
22.2
NA
NA
5.3
13.3
19.3
21.8
26.5
100.0
100.0
100.0
100.0
100.0
100.0
100.0
1720
1747
1745
1241
1005
865
630
33.5
10.7
5.1
4.2
3.9
3.7
81.3
26.9
8.8
5.0
3.2
3.0
4.3
6.3
6.1
7.0
0.9
1.9
3.0
2.3
2.0
3.4
3.0
16.8
17.8
17.1
18.3
14.7
18.4
22.8
8.9
8.5
8.4
6.0
8.6
NA
12.8
13.2
13.5
No. of
Women
Median
Age
at Birth
a
18.4
17.4
17.2
17.3
16.6
16.9
a
a
a
Pakistan
15-19
20-24
25-29
30-34
35-39
40-44
45-49
87.8
54.3
23.0
9.2
5.4
5.5
5.5
1.5
3.3
5.3
4.4
3.4
6.3
4.8
a
a
21.0
20.9
21.4
21.7
22.6
Note: NA = Not Available
a
= Less than 50 percent of women in the age group x to x+4 have had a birth by age x.
Source: Same as in Table 11.
22
Adolescent Reproductive Health Behaviour
C.4.2 Mean Age at Childbearing
At least one in two adolescent girls has begun child
bearing by age 19 in all countries of the region for which
data are available, except for Pakistan. In Pakistan,
about one-third of adolescent girls begin childbearing by
age 19. About one in three to one in four adolescent girls
of Bangladesh, India and Nepal and one in 10 of
Pakistan has begun childbearing as early as age 17 (see
Table 14 and Figure 13).
Table 14:
Early childbearing is the cultural practice in
the region. About one-third of adolescent girls
begin child bearing as early as 17.
Percentage of Women 15-19 who are Mothers or Pregnant with their First Child
According to Current Age, SAARC Countries
Percentage Who Are:
Country/
Current Age
Percentage Who
Have Begun
Child Bearing
Number of
Women
Mothers
Pregnant with
First Child
6.8
17.1
32.1
38.5
54.4
27.4
3.8
6.2
6.5
6.5
4.7
5.6
10.6
23.4
38.7
45.1
59.2
33.0
615
566
463
539
382
2566
13-16
17-19
Total
24.5
52.4
46.0
11.7
11.7
11.7
36.1
64.1
57.7
2170
7277
9447
15
16
17
18
19
Total
1.1
6.4
15.0
31.2
44.1
18.7
2.1
5.4
7.8
4.8
6.6
5.3
3.2
11.8
22.8
36.0
50.7
23.9
485
469
428
449
399
2229
Pakistan
15
16
17
18
19
Total
3.0
3.7
7.6
15.1
27.4
12.2
2.5
2.5
5.4
3.8
3.3
3.5
5.5
6.1
13.0
18.9
30.6
15.7
173
381
260
630
276
1720
Bangladesh
15
16
17
18
19
Total
India*
Nepal
* refers to ever married women age 13-19.
h.
Source: Same as in Table 11.
23
Socioeconomic, Demographic and Reproductive Health Profiles of Adolescents in SAARC Countries
Figure 13
Percentage of Women Aged 20-24 who have begun
Child Bearing, SAARC Countries
Percentage
70
65
60
55
50
45
40
35
30
25
20
15
10
5
0
Bangladesh
India__________
Nepal
Pakistan
Current Age
□ 15 ®16 □!? "18 ®19
C.4.3 Fertility
Consistent with the practice of early motherhood, it
is also observed that a significant proportion of all
births in a given year is occurring to adolescent girls
aged 15-19 (see Table 15 and Figure 14). The share
of all births occurring to adolescent girls ranges
from highest, 20 percent in Bangladesh, to 17
percent in India, 14 percent in Nepal, 11 percent in
Bhutan, 8 percent each in Maldives, Pakistan and
Sri Lanka respectively (see Table 15). By the time
a girl reaches the age of 20, she has had 2 children
on average in almost all countries of the region,
except for Sri Lanka., where a girl produces about
one child by age 20.
Adolescent girls contribute a significant
proportion of total births in a given year and a
progressively larger share of all births is
occurring to adolescent girls aged 15-19. A large
proportion of adolescent births are unplanned.
7
24
ft
Adolescent Reproductive Health Behaviour
Age-specific Fertility Rates, SAARC Countries
Table 15:
Age-specific Fertility Rates
Age
Bangladesh
(1996/97)
Bhutan
(1994)
India
(1992/93)
Maldives
(1990)
Nepal
(1996)
Pakistan
(1996/97)
Sri Lanka
(1993)
15-19
20-24
25-29
30-34
35-39
40-44
45-49
0.147
0.192
0.150
0.096
0.044
0.018
0.006
0.120
0.267
0.242
0.195
0.174
0.095
0.024
0.116
0.231
0.170
0.097
0.044
0.015
0.005
0.106
0.286
0.303
0.270
0.199
0.096
0.023
0.132
0.266
0.237
0.154
0.087
0.031
0.012
0.082
0.245
0.275
0.212
0.145
0.071
0.023
0.035
0.109
0.134
0.104
0.054
0.014
0.002
Total
15-49
0.653
1.117
0.678
1.283
0.919
1.053
0.452
TFR
3.27
5.58
3.39
6.42
4.60
5.26
2.26
Source:
Bangladesh: Demographic and Health Survey 1996/97.
Bhutan: Report on National Health Survey, 1992-93, August 1995.
India: National Family Health Survey 1992/93.
Maldives: Ministry of Planning and Environment. Population and Housing Census of
Maldives, 1990.
Nepal: Family Health Survey 1996.
Pakistan: Pakistan Fertility and Family Planning Survey 1996/97.
Sri Lanka: Demographic and Health Survey 1993.
Figure 14
Trend in Share (Percentage) of All Births Occurring
to Adolescent Girls Aged 15-19 SAARC Countries
Percentage
25
20
15
10
5
0
1971-75
1984-88
Bangladesh
1989-91
1991-93
1994-96
India —^Nepal ^Pakistan S5Sri Lanka
25
Socioeconomic, Demographic and Reproductive Health Profiles of Adolescents in SAARC Countries
It is also very disturbing to note that a progressively larger share of all births is occurring to
adolescent girls aged 15-19 and this overall trend holds, in general, for all countries of the region
(see Table 16 and Figure 14). For example, share of all births occurring to adolescent girls has
increased from 9 percent in 1971-75 to 18 percent in 1984-88, 21 percent in 1989-91, 21 percent
in 1991-93 and 22 percent in 1994-96 in Bangladesh. A similar trend, although not in the same
magnitude, is also observed in all other countries. A large proportion of these births could have
been avoided, if timely and adequate services were available, since many of these births were
unplanned. Table 17 shows that about one in ten to three in ten births among adolescents is
unplanned.
Increasingly high fertility among adolescent girls in most countries of the region is a matter of
great concern. The early childbearing will expose adolescent girls and their infants to high risk
of mortality and morbidity. This deprive them from continuing their education and becoming
economically productive.
Table 16:
Trend in Share (Percentage) of All Births Occurring to Adolescent Girls Aged
15-19, SAARC Countries
Percentage of All Births Occurring to Adolescent Girls
Year
Bangladesh
India
Nepal
Pakistan
Sri Lanka
1971-75
8.65
1971 =11
1976 = 11.45
1975 = 10.39
1976 = 4.63
1984-88
17.84
1981 =13
1981 =8.91
1979/80 = 15.91
1982-87 = 6.74
1989-91
20.81
1993/94 = 17
1986 = 6.04
1984/85 = 5.33
1988-93 = 7.74
1991-93
20.58
1991 =9.62
1990-91 =7.77
1994-96
22.27
1996 = 14.34
1994-95 = 3.90
1994-96 = 7.80
Source:
26
Various Demographic and Health Surveys (same as in Table 15).
Adolescent Reproductive Health Behaviour
Percentage of Adolescent Births that are Unplanned, SAARC Countries
Table 17:
Country
Bangladesh
India
Pakistan
Sri Lanka
Reference Year
% of Unplanned Births 1/
1993/94
1992/93
1990/91
1987*
21
16
11
30
Same as in Table 15.
Source:
* Allan Guttmacher Institute, 1998. Into a New World, Young Women's Sexual and Reproductive
Lives.
1/
Those who wanted no more births and/or wanted to have at a later date.
C.4.4 Birth Intervals
Not only a high proportion of adolescent girls give birth to children, they
also have shorter spacing between births. Closely spaced births increase
the risks of maternal and infant mortality.
Data in Table 18 and Figure 15 show that in all countries of the region
adolescent women have shorter birth intervals than older women. The
median birth interval for adolescent girls aged 15-19 ranges between 24 to
26 months, compared to 38-41 months for women over age 40.
Adolescent
; : girls
...... have
shorter birth
intervals.
Figure 15
Percentage Distribution of Median Months since Previous Birth, SAARC Countries
Percentage
50
45
40
35
30
25
20
15
10
5
0
Bangladesh
India____________ Nepal
Age of Mother
015-19 ®20-29 M30-39 ®40+
Pakistan
27
Socioeconomic, Demographic and Reproductive Health Profiles of Adolescents in SAARC Countries
Table 18: Percentage Distribution of Births in the Five Years Preceding the Survey by Number
of Months Since Previous Birth, According to Age of Mother, SAARC Countries
Number of Months Since Previous Birth
7-17
18-23
24-35
36-47
48+
Total
Median Months
Since Previous
Birth
Bangladesh
15-19
20-29
30-39
40+
8.3
17.6
8.9
6.2
7.3
12.0
21.7
12.1
11.5
8.9
33.5
36.1
35.5
30.1
28.7
22.2
18.6
22.1
22.9
21.2
24.0
6.0
21.5
29.3
33.9
100.0
100.0
100.0
100.0
100.0
34.7
26.0
33.9
36.6
37.5
5409
175
3311
1616
307
India
11.8
22.0
15.3
11.2
8.9
9.0
4.5
15.1
23.2
18.5
15.7
11.9
10.7
6.2
4.9
33.8
40.3
38.8
33.7
30.7
26.8
26.6
23.8
20.8
11.7
19.2
21.8
21.9
21.7
21.4
21.9
18.6
2.9
8.2
17.5
26.6
31.8
38.8
45.0
100.0
100.0
100.0
100.0
100.0
100.0
100.0
100.0
31.6
24.8
27.8
31.8
35.4
37.3
40.0
43.6
44900
1263
12445
16093
9331
4060
1338
369
9.4
21.0
10.5
8.0
5.8
14.7
20.3
17.0
12.0
9.5
36.4
47.2
40.4
32.5
23.7
22.6
9.8
21.0
24.9
25.3
17.0
I. 7
II. 2
22.5
35.7
100.0
100.0
100.0
100.0
100.0
32.0
25.7
30.0
34.7
40.9
5595
88
3062
2019
426
16.7
32.4
19.8
14.3
10.3
16.7
21.0
18.7
15.9
10.9
35.6
39.6
37.0
35.7
27.8
13.6
6.7
12.6
14.4
15.7
17.5
0.3
11.9
19.8
35.4
100.0
100.0
100.0
100.0
100.0
29.1
23.7
26.8
30.8
37.9
5310
68
2452
2242
547
Country/
Age of Mother
15-19
20-24
25-29
30-34
35-39
40-44
45-49
Nepal
15-19
20-29
30-39
40+
Pakistan
15-19
20-29
30-39
40+
7.0
Source: Same as in Table 11.
28
No. of
Births
Adolescent Reproductive Health Behaviour
C.4.5 Ideal Number of Children
Data in Table 19 shows that the mean ideal number of
children for ever married adolescent girls exceeds that of
the replacement level fertility of around 2.2 children in
almost all countries of the region for which comparable
data are available, except for Bangladesh.
Ideal number of children of adolescent girls exceeds
that ofthe replacement level fertility.
Table 19: Mean Ideal Number of Children for Ever Married Adolescents Girls, SAARC
Countries
Mean Ideal Number of Children
Age/Sex
10-14
15-19
Bangladesh
Bhutan
India
Maldives
Nepal
Pakistan**
Sri Lanka
2.1
2.3
NA
NA
2.8*
2.7
NA
NA
NA
2.7
NA
3.4
NA
NA
Mean ideal number of children for ever-married women aged 10-49. (*) refers to age group
13-14.
Source: Same as in Table 15.
Note:
C.5
Family Planning
The use of contraception is very limited among the
currently married late adolescent girls aged 15-19. No
The use of contraception is very limited among
more than 11 percent of the currently married late
currently married adolescent girls. However,
adolescent girls were using contraception in any
there exists a substantial unmet demand for
SAARC country other than that of Bangladesh and Sri
Lanka. One third of the currently married late
adolescent girls of Bangladesh and Sri Lanka practice
contraception (see Table 20 and Figure 16). However,
there exists a large unmet demand for contraception among the currently married late adolescent
girls (see Table 21). At least one quarter of them would like to limit or postpone their births for
some time, but are not practising contraception. The unmet demand for family planning varies
within the region by country. It is highest in Nepal followed by India with only 14 percent and
19 percent of demand for family planning satisfied respectively. The unmet demand for
contraception is lowest in Bangladesh followed by Pakistan, with 64 percent and 22 percent of
demand for family planning satisfied respectively. The unmet demand for contraception is largely
concentrated among the spacers than among the limiters, indicating that promotion of and wider
availability of spacing methods could lead to greater use of contraception among adolescents.
Apart from large unmet demand for family planning, a majority of those currently married late
adolescent girls who are not currently using contraception have not been contacted for the
purpose of family planning, as data from Bangladesh and Nepal shows (see Table 22).
The majority of the currently married late adolescent girls (15-19 years) and their husbands
approve of family planning in almost all countries of the region, except for Pakistan (see Table
23). In Pakistan, only one-third of the currently married late adolescent girls and their husbands
approve of family planning.
29
Socioeconomic, Demographic and Reproductive Health Profiles of Adolescents in SAARC Countries
Table 20:
Percentage of Currently Married Women (10-24) who are Currently Practising
Contraception by Age
Age
Country
Bangladesh
Bhutan
India
Maldives
Nepal
Pakistan
Sri Lanka
10-14
15-19
20-24
Total (15-49)
15.6
32.9
I. 4
7.1
II. 4
6.5
6.2
43.1
9.1
21.0
18.9
15.8
9.9
49.2
18.8
40.7
14.9
28.5
23.9
66.1
4.7
30.3
Source: Same as in Table 15.
Figure 16
Percentage of Currently Married Women (15-19)
who are Currently Practising Contraception by Age,
SAARC Countries
Percentage
40
35
30
25
20
15
10
5
0
Bangladesh Bhutan
India
Maldives
Age
ffl15-19
30
Nepal
Pakistan Sri Lanka
I
Adolescent Reproductive Health Behaviour
Table 21: Percentage of Currently Married Adolescent Girls with Unmet Need for Family
Planning, and the Total Demand for Family Planning Services, SAARC Countries
Country/
Age
Unmet Need for Family
Planning 1/
Met Need for
Family Planning
For
Spacing
For
Limiting
Total
21.3
17.8
0.8
0.9
29.6
28.2
38.9
Total
Total
Demand for
Family
Planning
Percentage
of Demand
Satisfied
22.1
18.7
15.6
32.9
37.7
51.6
41.4
63.8
3.6
2.3
33.2
30.4
4.7
7.1
37.9
37.5
12.4
18.9
1.6
40.5
6.5
47.0
13.8
21.7*
6.2
27.9*
22.2*
Bangladesh
10-14
15-19
India
10-14
15-19
Nepal
10-14
15-19
Pakistan
10-14
15-19
Note: 1/
*
Unmet need for spacing includes women who are not using any method of family
planning but say they want to wait two or more years for their next birth. While unmet
need for limiting refers to women who are neither pregnant nor amenorrheic, and who
are not using any method of family planning but want no more children.
Pakistan Contraceptive Prevalence Survey 1994-95.
Source:
Same as in Table 15.
CPHE
K
USrary X '<
<! D
,Np0PMAr|0N
)
■X ■'*
31
Socioeconomic, Demographic and Reproductive Health Profiles of Adolescents in SAARC Countries
Percent Distribution of Currently Non-users by Whether They Were Visited by a
Table 22:
Family Planning Worker or Spoke with a Health Facility Staff Member About
Family Planning Methods During the 12 Months Prior to Interview, According
to Respondent’s Age, SAARC Countries
Contact of Non-users with Family Planning Providers
Not Visited by FP Worker
Visited by FP Worker
Country/
Age Group
Visited Health Facility
Discussed
FP
Did not
Discuss
FP
Bangladesh*
10-14
15-19
20-24
25-29
14.8
29.7
42.3
46.9
1.9
4.3
4.5
4.8
Nepal
15-19
20-24
25-29
0.6
1.2
1.9
0.9
2.7
2.0
Note:
Discussed
FP
Did not
Discuss
FP
2.3
2.3
4.3
1.6
3.9
5.4
27.2
35.8
30.5
Did not
Visit
Health
Facility
67.4
54.2
55.6
No FP
Services or
Information
Provided
Number
of
Women
94.6
89.9
86.1
902
1350
1081
(*) For Bangladesh, the percentage refers to currently married women visited by a FP field
worker in the six months prior to the survey.
Source:
32
Visited Health Facility
Did not
Visit
Health
Facility
Bangladesh: BDHS 1993-94.
Nepal: NFHS 1996.
Adolescent Reproductive Health Behaviour
Attitudes of Couples Towards Family Planning (FP), SAARC Countries
Table 23:
Percent Distribution of Non-sterilised Currently Married Women who know of a
Contraceptive Method by Wife’s Attitude Toward Family Planning and Wife’s
Perception of her Husband’s Attitude Toward Family Planning, According to
Respondent’s Age Group, SAARC Countries
Attitudes Towards Family Planning
Respondent Approves
Country/
Age Group
Respondent Disapproves
Respo
ndent
Unsure
Total
Numb
er of
Respo
ndents
Both
Approve
Husband
Dis
approves
Husband’s
Attitude
Unknown
Husband
Approves
Husban
d’s
Attitude
Unknown
Both
Disappro
ves
India
10-14*
15-19
58.4
42.0
56.5
7.0
3.7
5.6
11.6
24.2
16.9
1.3
2.2
1.2
9.3
16.9
10.0
11.5
8.8
8.9
1.0
2.2
0.8
100.0
100.0
100.0
55036
273
7927
Nepal
10-14
15-19
68.8
10.2
11.1
0.7
1.6
4.6
3.0
100.0
6462
63.2
6.5
21.7
0.4
1.3
3.8
3.0
100.0
930
34.1
12.5
2.1
13.4
22.4
0.5
100.0
4729
33.3
10.5
15.0
17.4
13.9
2.6
19.6
15.3
1.2
100.0
277
Pakistan
10-14
15-19
Note: (*) refers to 13-14 age group.
Source:
Same as in Table 15
33
Health Risks of Early Marriage and Childbearing
D.
HEALTH RISKS OF EARLY MARRIAGE AND CHILDBEARING
D.l
Nutrition
Data from Bangladesh and Nepal reveal that a
considerable proportion of the currently married late
A large proportion of adolescenn are malnourished
adolescent girls aged 15-19 are acutely malnourished
(measured in terms of mean Body Mass Index
and also short statured which increase the risk of
(BMI)) and short statured (i.e., shorter than cut off
difficult child birth.
point of 145 CM). Data in Table 24 shows that about
half and one-third of the currently married late
adolescent girls in Bangladesh and Nepal are acutely malnourished respectively (i.e., Mean Body
Mass Index (BMI) is less than 18.5 (lg/m2). While about one-fifth and one-tenth of the currently
married late adolescent girls in Bangladesh and Nepal respectively are so short statured as to
increase the risk of difficult child birth.
Among Mothers (15-19 Years) of Children Under Five Years, Mean Height and
Percentage of Women Shorter than 145 Centimetres, Mean Body Mass Index
(BMI) and the Percentage of Women whose BMI is Less than 18.5 (kg/m2), by
Age of Mother: Nepal and Bangladesh
Table 24:
BMI
Height
Country
Age
Mean
Percentage
<145 cm
Number
of
Women
Mean
Nepal
(1996)
15-19
20-24
150.1
150.9
13.3
13.3
1,192
19.7
19.8
Bangladesh
(1996-97)
15-19
20-24
149.9
150.2
18.7
18.3
762
1,314
18.6
18.7
393
Percentage
<18.5
(kg/m2)
Number
of
Women
30.6
336
29.8
981
50.1
654
1,155
53.6
Note: (*) refers to women who had a birth in the three years preceding the survey.
Source:
Nepal: Nepal Family Health Survey 1996.
Bangladesh: Demographic Health Survey 1996-97.
r
35
Socioeconomic, Demographic and Reproductive Health Profiles of Adolescents in SAARC Countries
Adolescent boys and girls also fail to meet calorie and protein requirements. Data from India and
Pakistan shows that adolescent boys and girls of both the countries fail to meet calorie
requirement (see Table 25). About 25 percent of adolescent boys and 20 percent of adolescent
girls in India fail to meet the calorie requirement. The corresponding proportion of boys and girls
failing to meet calorie requirement in Pakistan are about 14 percent. With regard to protein
intake, Pakistani boys and girls meet their requirement while their Indian counterparts fail to meet
their protein requirement. Over 30 percent of Indian adolescent boys and girls fail to meet their
protein requirement. Protein intake of Pakistani boys and girls exceeds that of their requirement,
but they are still short in meeting their calorie requirement. In this situation of relatively higher
intake of protein on the one hand and lower intake of calorie on the other, Pakistani boys and
girls may still remain trapped under the vicious cycle of protein calorie malnutrition.
The malnourished adolescent boys and girls will find it extremely difficult to realise their full
potential and to lead a productive life. Also malnourished and short statured adolescent girls
burdened with early pregnancy and childbearing will expose themselves and their babies to
higher risk of death.
Table 25: Energy and Protein Intake by Males and Females of Different Age Groups: India
and Pakistan
Protein, g/d
Energy, kcal/d
Country
India
(1975-80)
Pakistan
(1985-87)
Note:
% of RDA
Fulfilled
RDA
% of RDA
Fulfilled
RDA
Female
Male
Female
Male
Female
Male
Female
Male
Adolescents
10-12
13-15
16-18
Adults
1950
2050
2050
1800
2150
2400
2600
2350
76.1
79.0
84.0
99.4
72.1
73.9
74.5
92.3
62
65.4
66
50
59
76
81
60
66.1
65.6
72.7
64.6
72.3
100.3
6-15
Adult
Pregnant
Lactating
2100
2100
2500
3100
2200
2900
86.4
106.5
86.6
74.1
86.8
87.0
45
61
70
82
45
72
72.3
100.8
117.8
104.9
88.6
84.1
122.2
101.4
RDA = Recommended Daily Allowance.
Source:
36
Age Group
India: UNICEF, 1990, Children and Women in India - A Situation Analysis. Intake
based on NNMB Survey in 10 states, 1975-80.
Pakistan: Federal Bureau of Statistics, 1995. Women and Men in Pakistan.
J
Health Risks of Early Marriage and Childbearing
D.2
Infant Mortality Among Adolescent Girls
Babies bom to adolescent mothers have the lowest
chance of survival for various physiological and
sociological reasons. This has also been supported by
Children born to adolescent mothers have
data from Bangladesh, India, Nepal and Pakistan. Data
higher risk of death.
in Table 26 and Figure 17 show that neo-natal, infant
and under-five mortality rates are highest among those
born to adolescent mothers, while these rates are
lowest for those bom to mothers aged 20-29. This overall pattern of relationship, observed
between age of mother on the one hand and neo-natal, infant and under-five mortality on the
other, also holds for every country of the region for which comparable data are available.
The infant mortality rate among the live births of adolescent women is about 30 to 50 percent
higher, compared to those of older women aged 20-29. While the neo-natal mortality rate among
the live births of adolescent mothers is about 38 to 74 percent higher, compared to those of
women aged 20-29 (see Figure 17).
Table 26:
Neonatal, Infant and Child Mortality Rates for the Ten-year Period Preceding
the Survey, bv Age of Mother at Birth, SAARC Countries
Age of Mother
at Birth 1/
Neonatal
Mortality
(NN)
Infant Mortality
(1q0)
Under-five
Mortality
(5q0)
Bangladesh*
<20
20-29
30-39
70.2
46.6
47.3
106.1
79.3
87.2
145.0
117.2
124.7
India
<20
20-29
30-39
70.8
44.8
53.7
107.3
75.8
91.1
140.9
107.8
122.3
Nepal
<20
20-29
30-39
83.4
48.0
62.3
120.1
79.5
103.9
158.9
127.7
152.8
Pakistan
<20
20-29
30-39
70.1
50.9
48.5
121.3
90.8
839
144.8
116.7
113.0
Country
Note:
1/
Rates for age group 40-49 are not shown for other countries because they are based
on fewer than 250 exposed persons. (*) For Bangladesh, age of mother at birth 30-39
refers to age group 30-49.
Source:
Bangladesh: Demographic and Health Survey 1996-97.
India: National Family Health Survey 1992-93.
Nepal: Nepal Family Health Survey 1996.
Pakistan: DHS, Pakistan Demographic and Health Survey 1990-91.
Source:
Same as in Table 15.
37
Socioeconomic, Demographic and Reproductive Health Profiles of Adolescents in SAARC Countries
Figure 17
Infant Mortality Rate for the Ten-year Period Preceding the Survey
by Age of Mother at Birth, SAARC Countries
Infant Mortality Rate
150
125
100
75
50
25
0
20-29
Age of Mother at Birth
<20
"^Bangladesh
D.3
30-39
India "Nepal —Pakistan
Maternal Mortality
The probability of maternal death is higher among the
youngest (i.e., adolescent) and oldest women,
Risk of -maternal mortality is higher among
compared to women of other age-groups in the
adolescent girls.
reproductive span. This is also supported by data from
Bangladesh and Sri Lanka (see Table 27 and Figure
18). In rural and urban Bangladesh, the maternal mortality rate of currently married adolescent
girls is about 3 times higher than that of the rate of slightly older women aged 20-24. A similar
pattern of age differential in maternal mortality, albeit less marked, is also observed in Sri Lanka.
Table 27:
Maternal Mortality Rate (MMR) by Age of Mother, Bangladesh and Sri Lanka
Age of Mother
15-19
20-24
25-29
30-34
35-39
40-44
Maternal Mortality
Rate*
Bangladesh (1987)*
Sri Lanka (1988)*
Urban
Rural
9.90
2.62
4.61
5.83
6.13
11.57
4.58
3.98
4.58
7.75
11.11
7.75
10.10
5.51
6.13
4
3.50
3.33
2.81
3.50
Note: (*) Expressed per 1,000 live births.
Source:
UNICEF 1997. Statistics of South Asian Children and Women.
UNFPA 1993. Population Profile of SAARC Countries: With Special Reference to
Women, Kathmandu.
United Nations, Sri Lanka: Women in Sri Lanka A Country Profile, UN, 1997.
38
i
Health Risks of Early Marriage and Childbearing
Figure 18
Under-five Mortality Rate for the Ten-year Period
Preceding the Survey by Age of Mother at Birth, SAARC Countries
Under-five Mortality Rate
200
175
150
125
100
75
50
25
0
<20
20-29
30-39
Age of Mother at Birth
Bangladesh —India ”Nepal ^Pakistan
From the preceding findings, it is clearly evident that the risks of maternal, neo-natal, infant as
well as childhood mortality are closely related to age of mother, with the risk being higher for
the youngest and oldest women. It should also be noted that high maternal infant and child
mortality are also related to high fertility and frequent births. Therefore, prevention of early and
late pregnancies and frequent childbirth would also contribute significantly to the reduction of
fertility and mortality, particularly among infants, children and women in the reproductive ages.
D.4
Miscarriage/Still Birth
Adolescents have higher propensity to experience
adverse pregnancy outcomes than older women. This
Adolescent girls are likely to experience higher
has been also supported by data from India, Nepal and
foetal wastage than older women.
Bangladesh. About 10 percent, 7 percent and 12
percent of all pregnancies of adolescent girls are
terminated by miscarriages and/or still births i.e., foetal wastage in India, Nepal and Bangladesh
respectively. The corresponding figures for slightly older women aged 20-24 were 8 and 6 in
India and Nepal respectively.
D.5
STDs/HIV/AIDS
Information on the prevalence of Sexually Transmitted
Diseases (STDs), including HIV/AIDS for the
Exposure to sexually transmitted diseases is
population in general and adolescents in particular are
higher among adolescent girls than boys. ■
extremely limited for all SAARC countries. However,
the limited information that are available on the
incidence of sexually transmitted diseases reveal a gloomy picture. A recent study conducted in
Bangladesh revealed a high level of prevalence of Reproductive Tract Infections (RTIs) among
both unmarried and married adolescents and STDs among unmarried adolescents. Over 4 in 10
unmarried and married adolescent girls and 1 in 5 unmarried adolescent boys reported to have
39
Socioeconomic, Demographic and Reproductive Health Profiles of Adolescents in SAARC Countries
had symptoms of RTIs and STDs respectively. The incidence of STDs among married and
unmarried adolescent girls in Bangladesh were reported to be 5 percent and 3 percent respectively
(Haider, et.al, 1997). In Sri Lanka, about 7 percent of adolescents reported to have had STDs (Sri
Lanka Country Paper). In Nepal, adolescents constituted about 16 percent of the HTV/AIDS
diagnosed cases, and 72 percent of these cases were adolescent girls (National Centre for AIDS
and STD Control, 1998).
D.6
Abortion
Reliable information on abortion seekers in general
and for unmarried adolescents in particular are not
Available evidence, although limited, portrays a
available for any country in the SAARC region.
Demographic and Health Surveys (DHS) conducted
disturbing picture of adolescent abortion
in India and Nepal reveal a low abortion rate of 1.3
seekers.
and 0.4 percent of pregnancies in India and Nepal
respectively. The rate of induced abortion is reported
to be slightly higher among married adolescent women aged 15-19 than among all married
women. These rates are 1.7 vs. 1.3 percent of pregnancies in India and 0.5 vs. 0.4 percent of
pregnancies in Nepal. However, small scale studies, particularly the hospital based studies
conducted in urban and rural areas reveal a higher rate of abortion, particularly among
adolescents, compared to those reported by Demographic and Health Surveys. For example, 6
percent of induced abortion reported to have occurred to adolescent women under age 20 in
Nepal. A similar pattern is also observed in India. In Bangladesh, about 4 percent of currently
married adolescent women reported to have terminated their pregnancies through menstrual
regulation (Haider, et.al., 1997). No information on the incidence of abortion among unmarried
adolescent girls are available at national level. However, hospital based studies conducted in
Nepal and India confirm that a large proportion of unmarried adolescents girls also seek abortion.
A review of hospital based studies in both rural and urban areas conducted in India and Nepal
reveal the following pattern of abortion1: (IDS, 1985, 1986 and 1993, Jejeebhoy, 1996)
40
(i)
adolescents account for a disproportionately large proportion of abortion seekers
(ii)
adolescent abortion seekers comprise of both married and unmarried girls
(iii)
adolescents, particularly the unmarried adolescents, are most likely to seek abortion
during the second trimester of pregnancy than older women
(iv)
health consequences of abortion are particularly acute for the unmarried adolescent
girls who seek abortion during the second trimester.
(v)
adolescent abortion seekers tend to repeat abortions.
i
These findings should be treated with caution as they are limited in scope.
Reproductive Health Care
E.
REPRODUCTIVE HEALTH CARE
E.l
Antenatal Care
Data in Table 28 and Figure 19 show that although
Antenatal care among adolescent
currently married adolescent women in general tend to
receive more antenatal care, compared to older women,
women is not satisfactory.
the majority of them still do not seek antenatal care in
Pakistan and Bangladesh. The proportion of currently
married women seeking antenatal care is lowest in Pakistan (26 percent) followed by Bangladesh
(29 percent), and highest in Nepal (44 percent) followed by India (35 percent).
Table 28: Percent Distribution of Live Births in the Five Years Preceding the Survey by Source
of Antenatal Care during Pregnancy according to Mother’s Age at Birth: Selected
SAARC Countries
Country
Bangladesh
(1996-97)
India
(1992-93)
Antenatal care provider*
Don't
Trained Traditional
Other
No one
know/
birth
nurse/
missing
Midwife** attendant
Mother's age
at birth
Doctor
< 20
20-34
35+
20.4
19.8
12.4
6.8
6.7
7.4
0.2
0.3
0.0
1.9
2.1
2.2
70.7
71.1
78.0
< 20
20-34
35+
40.8
40.8
22.5
9.8
9.4
5.9
0.4
0.3
0.3
13.3
12.6
13.1
34.6
36.0
57.2
< 20
20-34
35+
16.5
12.6
6.1
33.2
26.3
15.9
0.7
0.8
0.8
2.5
1.7
1.5
< 20
20-34
35+
20.3
24.4
13.6
3.8
4.2
4
2.7
2.6
1.3
0.1
Total
Number of
Births
100
100
100
1997
3890
343
1.1
0.9
1.1
100
100
100
11,514
35,258
2,597
44.3
56.1
74.2
2.7
2.4
1.5
100
100
100
817
3,136
422
72.6
67.2
80.8
0.5
1.5
0.3
100
100
100
746
4843
818
Nepal (1996)
Pakistan
(1990-91)
Note:
* If the respondent mentioned more than one provider, only the most qualified provider is
considered.
** For Pakistan it includes lady health worker and trained birth attendant; for Nepal, it
includes VHW, MCH worker and other health professionals (health assistant and health
post staff)
Source: Same as in Table 15.
41
Socioeconomic, Demographic and Reproductive Health Profiles of Adolescents in SAARC Countries
Figure 19
Proportion of Mothers who do not Seek
Antenatal Care in Selected SAARC Countries
Proportion
100-----------90
80
70
60
50
40
30
20
10
0
<20
o Bangladesh
E.2
20-34
Age
35+
India^NepalMPakistan
Vaccination Against Tetanus
Data in Table 29 shows that the majority of pregnant
adolescent women were immunised against tetanus in
Coverage of immunisation of adolescent
most countries of the region, for which comparable
pregnant women against tetanus needs further
data are available, except for Pakistan. In Pakistan
only 29 percent of pregnant adolescent women were
improvement.
immunised against tetanus. The proportion of pregnant
adolescent women immunised against tetanus was
highest in Bangladesh (80%) followed by India (63%). Nepal occupies the intermediate position
with 56% of pregnant women immunised against tetanus (see Table 29). Data in Table 29 also
shows that a higher proportion of adolescent pregnant women were vaccinated against tetanus,
compared to older women, indicating improvement in coverage of immunisation against tetanus
over time.
42
Reproductive Health Care
Percent Distribution of Births in the Five Years Preceding the Survey by Number
of Tetanus Toxoid Injections during Pregnancy according to Mother’s Age at
Birth: Selected SAARC Countries
Table 29:
Number of Tetanus Toxoid injections
Country
Mother's age
at birth
Don't know/
missing
Total
Number of
Births
None
One dose
Two doses
or more
< 20
20.7
12.7
66.4
0.2
100.0
1,997
20-34
25.4
16.9
57.4
0.3
100.0
3,890
35+
45.9
12.3
41.6
0.2
100.0
343
< 20
37.0
7.7
55.1
0.1
100.0
11,514
20-34
37.8
6.9
55.1
0.2
100.0
35,258
35+
62.8
6.8
30.3
0.1
100.0
2,597
< 20
44.0
15.0
40.7
0.4
100.0
817
20-34
53.5
13.6
32.6
0.3
100.0
3,136
35+
73.6
9.7
16.7
0.0
100.0
422
< 20
71.3
7.2
21.5
100.0
746
20-34
68.7
6.5
24.6
0.2
100.0
4,843
35+
76.5
5.7
17.3
0.5
100.0
818
Bangladesh (1996-97)
India (1992-93)*
Nepal (1996)**
Pakistan (1990-91)
Note:
Source:
E.3
(*) For India, refers to live births during the four years preceding the survey.
(**) For Nepal, refers to live births during the three years preceding the survey.
Same as in Table 15.
Attendance at Birth
Only a small proportion of births of currently married
adolescent women are delivered at health facilities,
A large proportion of adolescent births are
accounting for 3 to 11 percent of births in Bangladesh,
unattended by trained health workers.
Nepal and Pakistan, and 24 percent of births in India
(see Table 30). Consistent with this finding, it is also
observed that over 70 percent of births by women of all age groups still remain unattended by
trained health workers in all countries of the region. The proportion of births of currently married
adolescent women attended by health workers is lowest in Nepal and Bangladesh (both 14
percent), while this is highest in India (34 percent) followed by Pakistan (31 percent). The
attendance of births by health workers is reported to be nearly universal in Sri Lanka.
■.
In terms of proportion of babies delivered at health facilities and attended by health workers,
the younger (20-39 years) and older (35 years and above) women occupy the first and last
position, while adolescent women occupy the intermediate position.
43
Percent Distribution of Live Births in the Five Years Preceding the Survey by Place of Delivery and Type of Assistance during Delivery
according to Mother’s Age at Birth: Selected SAARC Countries
Table 30:
Assistance during delivery
Place of delivery
Country/ Mother's age at
birth
Trained nurse/ Trained Traditional birth
attendant
TBA
Midwife**
Friends/
Relatives/ Other
No one
Don't know/
missing
Total
Number of
Births
Health
facility
At home
Doctor
< 20
3.4
95.4
4.8
2.6
7.0
56.7
28.0
0.6
0.2
100
1997
20-34
4.5
94.6
5.6
2.9
7.9
57.2
24.8
1.5
0.2
100
3890
35+
3.3
96.6
3.8
3.1
5.8
60.1
23.3
3.9
0.0
100
343
< 20
24.0
74.8
20.8
13.5
35.1
29.7
0.4
0.5
100
11,514
20-34
27.0
72.1
22.6
12.6
34.8
28.8
0.6
0.5
100
35,258
35+
12.5
86.1
10.3
8.8
41.3
37.6
1.0
1.0
100
2,597
< 20
8.8
90.7
6.9
6.8
29.2
52.4
4.6
0.1
100
817
20-34
7.6
91.6
5.7
3.9
21.4
57.6
11.3
0.0
100
3,136
35+
4.9
93.9
4.0
2.6
17.8
55.5
19.4
0.8
100
422
< 20
11.0
88.5
10.3
6.8
13.7
55.4
11.1
1.9
0.9
100
746
20-34
14.6
83.7
13.4
6.6
16.8
50.8
9.3
1.4
1.7
100
4843
35+
8.1
91.4
8.0
4.8
18.5
57.7
8.1
2.3
0.6
100
818
Bangladesh (1996-97)
India (1992-93)1
Nepal (1996)2
Pakistan (1990-91)
Note:
Source:
1: refers to live births during four years preceding the survey; 2: refers to live births during three years preceding the survey.
If the respondent mentioned more than one provider, only the most qualified provider is considered.
** For Pakistan it includes lady health worker.
for Nepal, it includes VHW, MCH worker and other health professionals (health assistant and health post staff).
Same as in Table 15.
Knowledge about Sexual, Contraceptive and Reproductive Health
F.
KNOWLEDGE ABOUT SEXUAL, CONTRACEPTIVE AND
REPRODUCTIVE HEALTH
F.l
Knowledge of Contraceptive Method
The knowledge of any method, traditional or modem,
of contraception among currently married adolescent
Knowledge of method of contraception among
women is almost universal in all countries, except
adolescent women is satisfactory, except for
Bhutan and Pakistan. In Pakistan, 75 percent of
condom.
currently married adolescent women are aware of at
________________________________
least one contraceptive method, modem or traditional.
In Bhutan, only 51 percent of currently married adolescent women are aware of any modem
method of contraception (see Table 31).
Percentage distribution of currently married women with knowledge
(spontaneous + probing) of family planning methods, SAARC countries
Table 31:
Knowledge of method, spontaneous
Bangladesh
Any
Met
hod
Any
Mode
rn
Meth
od
Any
Traditio
nal
method
Total
99.8
99.8
76.1
10-14
99.2
99.2
15-19
99.5
99.5
20-24
99.7
99.7
Age
Any
Met
hod
Any
modern
method
74.7
51.2
Any
Tradi
tional
Met
hod
Any
Met
hod
Any
Any
Any
Any
Any
Any
Traditio
Traditio
Met
modern
Met modern
nal
nal
hod
hod method
method
method
method
Any
Any
Traditio
modern
nal
method
method
98.4
98.3
99.2
Any
Any
Any
Traditio
Met
modern
nal
hod
method
method
39.3
Sri Lanka
Pakistan
Nepal
India
Bhutan
95.8
95.5
77.8*
76.9*
90.4
90.2
96.9
95.1
94.8
98.7
90.7
90.5
38.2
96.6
75.5
75.4
17.3
98.7
87.5
87.0
32.3
44.4
99.3
72.3
(*) refers to the age group 13-14
Note:
Source:
Bangladesh: DHS1993-94, Bhutan: NHS 1994, India: NFHS 1992-93, Nepal: NFHS 1996,
Pakistan: POPS 1994-95, Sri Lanka: DHS 1993.
With regard to knowledge of specific method of family planning, particularly pill, injectable, IUD
or implant, the following pattern emerges. The proportion of currently married adolescent
women (15-19) knowing any of the above methods is lowest in Pakistan (59%) followed by India
(63%), while it is highest in Bangladesh (99%) followed by Sri Lanka (85%) (see Table 32).
However, knowledge of condom, compared to other modem methods, is very poor. The majority
of currently married adolescent women in almost all countries of the region, for which
comparable data are available, except Bangladesh, are not aware of condom. The proportion of
currently married adolescent women who know of condom varies from lowest 18 percent in
Pakistan to highest 85 percent in Bangladesh followed by 48 and 47 percent in Sri Lanka and
India respectively (see Table 32).
With regard to knowledge of sources of obtaining a method, the following pattern emerges: The
proportion of currently married adolescent women who know where to obtain a modem method
is lowest in Pakistan (32 percent), while this is highest in Sri Lanka (90 percent) followed by
India (80 percent) and Bangladesh (70 percent) (see Table 32).
45
Socioeconomic, Demographic and Reproductive Health Profiles of Adolescents in SAARC Countries
Table 32:
Contraceptive Knowledge Among Adolescents (15-19 years) in Selected SAARC
Countries
Contraceptive Use
Country and
Survey Year
% Women 15-19 Who Know
Fertile Days in
the Menstrual
Cycle
Bangladesh (1993-94)
India (1992-93)
Pakistan (1990-91)
Sri Lanka (1987)
Source:
F.2
About the Pill,
Injectable, IUD
or Implant
99
63
3
25
59
85
About the
Condom
Where to obtain a
Modern Method
85
47
18
48
70
80
32
90
The Allan Gattmacher Institute. Into a New World: Young Women’s Sexual and
Reproductive Lives, 1997.
Knowledge of Reproductive Biology
Data from selected SAARC countries on some aspects
of reproductive biology reveal very poor knowledge on Knowledge of reproductive biology is inadequate
the subject among adolescent girls. For example, only
among adolescents. =
I
3 percent and 25 percent of adolescent girls, aged 1519, in Pakistan and Sri Lanka respectively could
correctly mention the number of fertile days in the menstrual cycle (see Table 32). In Sri Lanka,
only 37 percent of adolescent girls, aged 16-19, have adequate knowledge of hymen (Basnayake,
1998). In Bangladesh, 39 percent and 36 percent of unmarried and married adolescent girls (1519) reported to have had no prior knowledge of menstruation before they experienced it (Haider,
1997).
-
F.3
■
■
:
-
-
Knowledge of HIV/AIDS
Evidence from selected SAARC countries suggests poor
knowledge of HIV/AIDS among ever married
Knowledge of HIV/AIDS n poor among
adolescent girls. For example, about one in five to one
adolescents.
in four ever married adolescent girls in Bangladesh and
Nepal respectively have ever heard of HIV/AIDS (see Table 33). The data from Nepal also
suggests that the majority of those who have heard of HTV/AIDS, could also identify specific
ways to prevent it. However, there still remains a large proportion (about one fifth) of those who
had heard of HTV/AIDS, but could not suggest any specific way of preventing it (see Table 34).
46
Knowledge about Sexual, Contraceptive and Reproductive Health
Table 33: Percentage distribution of ever-married women who have ever heard of AIDS,
percentage who received information about AIDS from specific sources and mean
number of sources of information about AIDS by age, SAARC countries
Age/sex
Percentage
Number
who have
of
heard of
women
AIDS
Source of knowledge among those who have heard of AIDS
Radio
TV
News
Paper
Pamphl
ets
Health
worker
Friends/
Other
Relativ
Sources
es
No. of
women
who know
of AIDS
Mean No.
of
sources
Bangladesh
18.7
9127
8.0
13.0
4.3
1.1
0.6
7.2
2.3
1707
2.0
15-19
17.2
1446
7.6
11.7
2.6
0.6
0.4
6.8
1.7
249
1.8
20-24
19.7
1727
8.8
14.4
3.8
1.6
0.6
7.6
2.7
340
2.0
25-29
20.2
1905
9.2
14.5
5.7
1.2
0.6
6.6
2.5
385
2.0
30-39
19.1
2530
7.3
13.0
4.8
0.7
0.9
7.9
2.1
483
1.9
40-49
16.5
1518
7.1
10.8
3.7
1.4
0.2
6.8
2.7
250
2.0
26.8
8429
78.7
30.4
17.7
10.8
9.0
45.3
14.6
2263
2.0
15-19
24.3
982
79.0
22.9
16.9
9.2
7.9
42.7
19.2
238
1.9
20-24
32.9
1626
80.8
26.8
25.9
12.3
8.6
44.1
11.9
535
2.0
25-29
29.0
1594
78.2
35.1
16.9
12.2
8.9
44.4
17.7
463
2.0
30-39
27.2
2480
79.4
32.3
14.7
10.1
10.0
47.9
12.5
674
2.0
40-49
20.2
1747
74.7
31.3
7.9
8.9
8.6
45.0
15.7
353
1.8
Nepal
Source:
Nepal: Nepal Family Health Survey 1996,
Bangladesh: Bangladesh Demographic and Health Survey 1996-97.
47
oo
Table 34: Percentage or ever married women who have heard of AIDS and who know specific ways to avoid HIV/AIDS and percentage with
misinformation, Nepal 1996
Percentage of women with knowledge of ways to avoid HIV/A1DS
Age
No way to
avoid AIDS
Abstain
Use
from
condom
sex
Avoid
Have
sex
Avoid
only one
Avoid
with
transfusion injection
sex
prosti
partner
tutes
Other Don't know
any way
ways
Percentage
Number of
with any
women
misinformation
«
15-19
6.7
11.1
34.7
58.1
37.3
16.3
8.0
9.1
17.7
0.6
238
20-24
9.3
13.1
33.5
52.9
33.1
13.2
11.9
9.4
22.0
1.3
535
25-29
8.2
15.7
33.0
53.9
36.9
16.7
12.2
10.7
19.3
1.7
463
30-39
7.0
14.6
30.9
53.0
36.6
11.1
13.1
11.7
20.6
1.6
674
40-49
9.8
10.2
21.5
46.2
34.1
11.6
8.9
9.0
29.7
1.8
353
Total
8.2
13.4
30.9
52.6
35.5
13.4
11.5
10.3
21.8
1.5
2263
Note:
Source:
(*) Includes avoiding kissing, mosquito bites, and seeking protection from traditional healer.
NFHS 1996.
>■
REFERENCES
X
1.
Integrated Development Systems (IDS), 1985, Hospital Based Study on Abortion in Nepal,
Project Report, Kathmandu, Nepal: IDS.
2.
Integrated Development Systems (IDS), 1986, A Study on Rural-based Abortion in Nepal,
Project Report, Kathmandu, Nepal, IDS.
3.
Institute for Integrated Development Studies (IJDS), 1993, Determinants of Abortion and
Subsequent Reproductive Behaviour among Women in Three Urban Districts of Nepal (199294), Project Report 1, Kathmandu, Nepal, IIDS.
4.
Shireen J. Jejeebhoy. “Adolescent Sexual and Reproductive Behaviour: A Review of the
Evidence from India”, International Centre for Research on Women (ICRW), 1996.
5.
Haider, J.S. et. Al. 1997. “Study of Adolescents: Dynamics of Perception, Attitude,
Knowledge and use of Reproductive Health Care”, Research Evaluation Associates for
Development (READ), June 1997.
6.
Basnayake, Sriani, “Knowledge and Attitudes about Reproductive Health among Youth in Sri
Lanka”, Family Planning Association of Sri Lanka, 1986.
$
49
Position: 5314 (1 views)