RF_COM_H_2.2_SUDHA (1).pdf
Media
- extracted text
-
x;/ -
--
4,.;-..,,
.....
RF_COM_H_2.2_SUDHA
'
*RF_COM_H_2.2_SUDHA
i~s ■ T-'SE?
RF_COM_H_2.2_SUDHA
a..
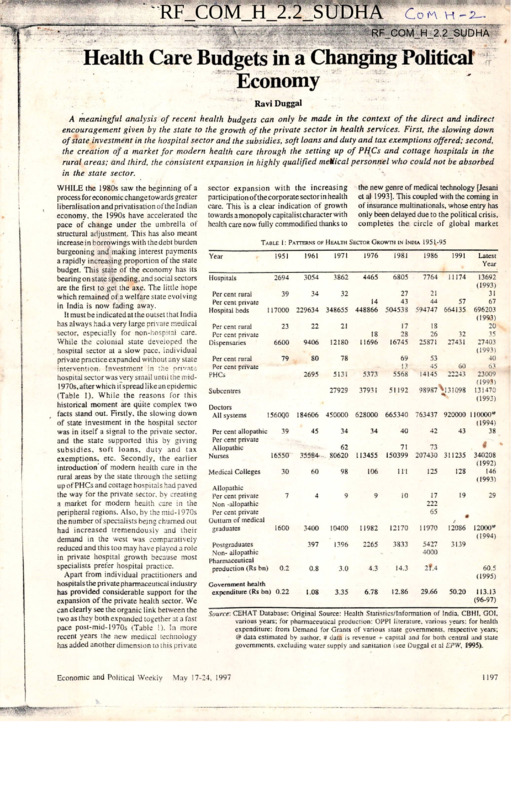
Health Care Budgets in a Changing Politicar
Economy
■rr
Ravi Duggal
A meaningful analysis of recent health budgets can only be made in the context of the direct and indirect
encouragement given by the state to the growth of the private sector in health services. First, the slowing down
of state investment in the hospital sector and the subsidies, soft loans and duty and tax exemptions offered; second,
the creation of a market for modern health care through the setting up of PHCs and cottage hospitals in the
rural areas; and third, the consistent expansion in highly qualified medical personnel who could not be absorbed
in the state sector.
*
I
WHILE the 1980s saw the beginning of a
process for economic change towards greater
liberalisation and privatisation of the Indian
economy, the 1990s have accelerated the
pace of change under the umbrella of
structural adjustment. This has also meant
increase in borrowings with the debt burden
burgeoning and making interest payments
a rapidly increasing proponion of the state
budget. Tliis state of the economy has its
bearing on state spending, and social sectors
are the first to get the axe. The little hope
which remained of a welfare state evolving
in India is now fading away.
It must be indicated at the outset that I ndia
has always had-a very large private medical
sector, especially for non-hospital care.
While the colonial state developed the
hospital sector at a slow pace, individual
private practice expanded without any state
intervention. Investment in the private
hospital sector was very small until the mid1970s, after whicn it spread likean epidemic
(Table I). While the reasons for this
historical moment are quite complex two
facts stand out. Firstly, the slowing down
of state investment in the hospital sector
was in itself a signal to the private sector,
and the state supported this by giving
subsidies, soft loans, duty and tax
exemptions, etc. Secondly, the earlier
introduction’of modern health care in the
rural areas by the state through the setting
up of PHCs and cottage hospitals had paved
the way for the private sector, by creating
a market for modern health care in the
peripheral regions. Also, by rhe mid-1970s
the number of specialists being churned out
had increased tremendously and their
demand in the west was comparatively
reduced and this too may have played a role
in private hospital growth because most
specialists prefer hospital practice.
Apart from individual practitioners and
hospitals the pri vale pharmaceutical i ndustry
has provided considerable support for the
expansion of the private health sector. We
can clearly see the organic link between the
two as they both expanded together at a fast
pace post-mid-1970s (Table I). In more
recent years the new medical technology
has added another dimension to this private
Economic and Political Weekly
sector expansion with the increasing
participation of thecorporate sectorin health
care. This is a clear indication of growth
towards amonopolycapitalistcharacterwith
health care now fully commodified thanks to
Table 1: Patterns
of Health
the new genre of medical technology [Jesani
et al 1993]. This coupled with the coming in
of insurance multinationals, whose entry has
only been delayed due to the political crisis,
completes the circle of global market
Sector
Growth
in India
1951-95
Year
1951
1961
1971
1976
1981
1986
1991
Latest
Year
Hospitals
2694
3054
3862
4465
6805
7764
11174
39
34
32
14
117000 229634 348655 448866
27
43
504538
21
44
57
594747 664135
23
22
21
6600
9406
12180
18
11696
17
28
16745
18
26
25871
32
27431
79
80
78
2695
5131
5373
69
13
5568
53
45
14145
60
22243
27929
37931
51192
98987^131098
13692
(1993)
31
67
696203
(1993)
20
35
27403
(1993)
40
63
23009
(1993)
131470
(1993)
Per cent rural
Per cent private
Hospital beds
Per cent rural
Per cent private
Dispensaries
Per cent rural
Per cent private
PHCs
Subcentres
Doctors
All systems
I560Q0
39
Per cent allopathic
Per cent private
Allopathic
16550
Nurses
184606 450000 628000 665340 763437 920000 HOOOO4*
(1994)
34
34
40
42
43
38
45
71
73
150399 207430 311235
355-84
62
80620
113455
30
60
98
106
ill
125
128
7
4
9
9
10
17
222
65
19
29
1600
3400
10400
11982
12170
11970
12086
397
1396
2265
3833
5427
4000
3139
12000''’’
(1994)
0.2
0.8
3.0
4.3
14.3
2f.4
Government health
expenditure (Rs bn) 0.22
1.08
3.35
6.78
12.86
29.66
Medical Colleges
Allopathic
Per cent private
Non -allopathic
Per cent private
Outturn of medical
graduates
Postgraduates
Non- allopathic
Pharmaceutical
production (Rs bn)
340208
(1992)
146
(1993)
60.5
(1995)
50.20
113.13
(96-97)
Source: CEHAT Database: Original Source: Health Statistics/lnformation of India. CBHI. GOI.
various years: for pharmaceutical production: OPPI literature, various years: for health
expenditure: from Demand for Grants of various state governments, respective years:
@ data estimated by author. # data is revenue + capital and for both central and state
governments, excluding water supply and sanitation (see Duggal et al EPW, 1995).
May 17-24. 1997
1197
consolidation of the health sector in India.
This is like Alisha Chinai’s ‘Made in India’
which had busted all popularity charts and
supposedly given Indians apndc in the ‘Made
in India’ label but most are not aware that
this album was produced and recorded in
London, UK! This is what globalisation of
India is in reality - the label will become
Indian but the surplus will be appropriated
by the new genre of imperialists.
Apart from private sector expansion and
corporatisation, another strong and
undesirable character of the health sector
in India is its neglect of rural areas where
still over 70 per cent of the population
resides. Today there are over 11 lakh
registered medical practitioners of vanous
systems in the country of which 60 per cent
are located in cities. In case of modern
system (allopathy) practitioners as much
as 75 per cent are located in cities and
especially metropolitan areas. For instance,
of all allopathic medical practitioners
registered with the state medical council in
Maharashtra55 percent are in Mumbai city
alone which has only 12 per cent of the
state’s population. The main reason, thus,
for the underdevelopment of health care in
rural areas is this vast rural-urban gap in
the provision of and location of health care
resources. With rural areas being
underserved two things have happened - a
large number of unqualified people have set
up medical practice and the rural population
exerts pressure on facilities in the cities and
towns thus affecting the efficiency and
capacity of the latter. In spite of planned
development over the last 45 years the state
has failed in narrowing the rural-urban gap,
and in fact at the behest of imperialist
influence it has promoted strategies for rural
health care which cause more harm than
good for the health of the people. Under
the umbrella of community health the state
has given rural areas third rate health care
through its PHCs and that too only
preventive (immunisations) and promotive
(family planning) care; curative care which
is the main demand of the people has been
ignored in terms of investment and
allocations and hence people in rural areas
are left to the mercy of the exploitative
private health sector which more often than
not in rural areas comprises unqualified
providers. It is important to see the health
budgets in the above context for making a
meaningful analysis.
While there is a lot of talk about the latest
budget (1997-98) being remarkable, it has
not really diverted from the path it has been
traversing now for a number of years. While
the salaried class and the bourgeoisie may
have a lot to cheer in terms of saving taxes
and having larger disposable incomes, there
is nothing in the budget to bring cheer to
the toiling masses. Social sector in
terventions like health care, education,
housing, etc, which are regarded as important
Table 2: An Overview
of Central
and
State
Health
|
1989-97
(hi rupees billion)
Budgets
1988-89 1989-90 1990-91 1991-92 1992-93 1993-94 1994-95 1995-96 1996-97
RE
RE
Category
1 Total central
health budget. 10.12 10.28
2 GOI’s own
expenditure
3.78 4.47
3 Disbursement
to states and
6.34 5.81
UTs JI-2)
4 Health expendi
ture of states # 34.77 39.60
5 Per cent central
component in
state budget #
14.7
18.2
(3/5 x 100)
12.73
13.82
17.22
21.48
22.95
26.08
28.72
4.92
5.56
6.33
7.43
9.47
12.77
14.71
7.81
8.26
10.89
14.05
13.48
13.31
14.01
45.86
50.83
56.62
66.69
74.28
85.38
94.42
17.0
16.2
19.2
21.1
18.1
15.6
14.8
Notes: # The state government expenditures are only from 25 states (excluding UTs) and exclude
capital expenditures, hence the actual percentage of central component should be less by
about 0.5 to 2 .
Source: 1 Expenditure Budget 1996-91, Vol 1. GOI, July 1996. 2 and 4 Report on Currency and
Finance, RBI, various years.
Table . 3: Selected
Public Health
Expenditure
Ratios . All India , 1981-95
1980-81 1985-86 1991-92 1992-93 1993-94 1994-95 1995-96 1996-97
RE
BE
Year
Health expenditure as
per cent to total govern
3.29
ment expenditure
Expenditure on medical
care as per cent to total
43.30
health expenditure
Expenditure on disease
programme as per cent
12.96
to total health
Capital expenditure as
per cent to total health
7.54
expenditure
Total health expenditure
11.89
(Rs bn) - Revenue
Including capital
expenditure
12.86
3.29
3.11
2.71
2.71
2.63
3.29
3.29
37.82
26.78
27.66
27.46
25.75
NA
NA
11.69
10.59
10.84
10.41
9.51
NA
NA
8.45
7.78
4.03
4.47
4.27
3.66
4.00
27.15
52.01
62.04
71.83
78.67
97.93
108.60
29.66
56.39
64.64
75.18
82.17
101.65 113.13
Source: CEHAT Database; Original Source: up to 1985-86, Combined Finance and Revenue
Accounts, Comptroller and Auditor General of India, respective years, other years.
Demand for Grants, respective states, various years. The percentage for capital expenditure
is based on revenue + capital total whereas for others it is as a per cent of revenue
expenditure. NA = not available, RE = revised estimate.
.. .
1198
advocating and supporting programmes it
considers to have national importance, and
with control over a major chunk of tax
revenues it can twist arms of the states to
accept its policies and programmes.)
When the central government presents its
budget there is a lot of euphona and expectation
- reliefs in taxes, excise and customs duties,
defence spending, interest burden, subsidies.
The middle classes and business look
forward to the budget eagerly but the same
enthusiasm is not shown in the case of state
and local-government budgets/expenditure
which affect their lives more closely. In fact
there is a complete lack of concern for the
social sector allocations. Even the media
ignores this and highlights only special
schemes or concessions which the finance
minister announces in his budget speech like
the ‘cheap’ hospitalisation policy for the low
income groups announced in the 1996-97
social levellers and help blunt inequities in
society continuc to be neglected. This despite
the promise of the current government of
assuring basic minimum services by 2000
AD. which include 100 per cent coverage
for safe drinking water in rural and urban
areas, 100 per cent coverage of primary
health care services in rural and urban areas,
universalisation of primary education, etc,
among other basic needs [GO1 1997). It
must be noted here that al I the basic minimum
needs being talked about are state subjects
and the allocation of the centre is a very
small proportion. Hence even real increases
in allocations by the centre (often linked to
new schemes) may have a negligible impact,
unless the state governments take some
radical measures on their own. (This is not
to say that the centre has no influence; in
fact with a small proportion of funding the
centre dictates policies in terms of
.
Economic and Political Weekly
...
May 17-24, 1997
...... .r-.'
■
■
a >
......
J
'
*■
'•r'"
'
■
■
•
5
:
2
t
2
a
1
3
3
✓
7
)
3
d
budget or the opening up of health insurance
to the private sector in this year’s budget.
It is important to note that the central
health budget in itself has a very limited
scope. It includes expenditures on central
government-owned hospitals, dispensaries,
the CGHS (health insurance for central
government employees and their families),
medical research (support for ICMR and
allied institutions) and medical education
(central government colleges). Apart from
this the budget also includes the centre’s
contributions and grants to various health
programmes of national importance like
control and eradication of communicable
diseases like malaria, tuberculosis, leprosy,
AIDS, as well as support for the family
planning programme (almost entirely
centrally funded) immunisation, blindness
control, etc. The larger part of health care
budgets come from state and union territory
governments’ own resources or from their
share of revenues disbursed by the centre.
On an average during the last decade the
centre’s contribution (grants and plan fund
shares of special programmes) has been
about 17 per cent to the overall state health
budgets. Table 2 gives an overview of
budgets for the last one decade.
It is evident from Tables 2-6 that state
governments are clearly the dominant
spenders on various health care programmes.
However, given the lamentable state of
affairs of public health services/institutions
and their inability to meet demands of
citizens, it is also clear that allocations to
the health sector are both inadequate and
inefficient. Further, it is also evident that
there is a declining trend in public health
expenditures and when this is viewed in the
context of the introductory remarks above
it becomes apparent why the private health
sector has such a strong hold of the health
care market.
Declining
7
3
)
3
ie
re
je
?7
Health
Expenditures
The state’s commitment to provide health
care tor its citizens is reflected not only in
the inadequacy of the health infrastructure
and low levels of financing but also in declini ng
support to various health care demands of the
people, and especially since 1980s from when
began the processof liberalisation and opening
up of the Indian economy to the world
markets. Medical care and control of
communicable diseases arc crucial areas of
concern both in terms of what people demand
as priority areas of health care as well as
what existing socio-economic conditions
demand. As with overall public health
spending allocations to both these subsectors
also show declining trends in the 1980s and
1990s. This increasing disinterest of the
state in allocating resources for the health
sector is also reflected in investment
expenditure with very large decline in capital
expenditures during the 1990s.
Further, when we look at expenditures
Economic and Political Weekly
■
.
■
A45
'Mm '.
'
on Health
by States
, .
Table 4: Revenue Expenditure
1985-96
(per Cent of Total Government Revenue Expenditure)
’
"
1985-86 .
1991-92
1992-93
Union government
Afo/or States
Andhra Pradesh
Assam
Bihar
Gujarat
Haryana
Jammu and Kashmir
Karnataka
Kerala
Madhya Pradesh
Maharashtra
Orissa
Punjab
Rajasthan
Tamil Nadu
Uttar Pradesh
West Bengal
Other States
Arunachal Pradesh
Goa, Daman and Diu
Mizoram
Pondicherry
Himachal Pradesh
Manipur
Meghalaya
Nagaland
Sikkim
Tripura
All India
0.52
0.45
0.42
045
0.42
6.61
6.75
5.68
7.51
7.00
7.61
6.60
7.85
6.69
5.97
7.38
7.24
8.11
7.70
9.75
8.92
5.82
5.23
5.66
5.42
4.19
6.37
5.96
6.92
5.78
5.25
5.94
4.32
6.85
6.72
6.00
7.31
5.87
5.57
5.87
4.79
4.56
6.87
6.44
6.29
5.48
5.33
5.63
5.78
6.64
5.73
5.81
7.55
5.75
5.14
6.24
5.09
3.60
7.71
6.56
7.13
5.65
5.34
6.00
5.32
6.34
6.64
5.48
7.15
5.63
6.00
6.89
5.21
2.90
6.20
6.39
7.44
5.55
4.67
5.00
5.33
6.97
6.59
5.38
6.58
5.85
8.22
6.80
9.11
7.89
6.15
9.20
6.96
4.03
6.53
3.29
6.28
8.33
5.21
8.91
7.24
5.74
6.73
4.17
6.01
5.54
3.11
6.37
8.10
5.10
7.93
7.73
6.01
7.19
5.64
7.87
4.97
8.07
8.08
5.24
7.51
5.39
6.10
5.16
2.71
6.39
7.52
4.99
8.03
8.19
4.54
7.33
4.78
6.78
5.10
2.63
Year
6.81
4.90
2.71
1993-94(RE) 1994.95 (b 'e )
Notes: * - Not available. RE = Revised Estimate; BE = Budget Estimate
Source: CEHAT Database; Original Source; Same as Table 3.
on National
by States
Table 5: Expenditure
Disease Programmes
(As Percentage of Total Health Expenditure)
Year
1985-86
1991-92
1992-93
Union government
Major States
Andhra Pradesh
Assam
Bihar
Gujarat
Haryana
Jammu and Kashmir
Karnataka
Kerala
Madhya Pradesh
Maharashtra
Orissa
Punjab
Rajasthan
Tamil Nadu
Uttar Pradesh
West Bengal
Other States
Arunachal Pradesh
Goa, Daman and Diu
Mizoram
Pondicherry
Himachal Pradesh
Manipur
Meghalaya
Nagaland
Sikkim
Tripura
All India
4.47
5.41
6.56
4.93
$
17.00
18.77
10.90
14.09
20.75
3.10
10.02
12.33
11.25
16.03
15.84
13.55
11.91
2.89
13.52
8.14
17.29
9.90
16.85
11.91
15.17
11.55
12.24
14.58
18.09
9.41
11.75
13.04
15.95
18.79
7.26
10.34
13.76
15.33
5.37
3.78
10.63
11.95
12.84
8.53
9.10
12.13
18.60
9.93
5.28
4.57
9.90
11.81
12.46
10.18
8.89
11.61
18.83
9.37
5.96
5.29
9.34
11.26
11.33
6.48
8.66
11.65
16.51
9.20
5.58
5.98
8.84
11.87
10.98
6.90
8.18
6.20
17.35
9.18
23.82
6.92
13.67
9.90
12.86
16.88
13.06
13.88
10.38
16.20
11.69
9.98
4.85
11.00
8.96
10.92
18.38
14.32
16.16
8.68
6.23
10.59
13.21
5.67
11.19
8.84
13.04
17.66
5.60
12.81
8.70
11.40
11.73
5.13
11.83
8.97
11.24
4.50
3.10
12.66
7.64
8.86
10.41
4.04
16.62
8.66
9.42
9.51
9.32
9.49
10.84
1993-94(RE) 1994-95 (BE)
Notes: * = Not available, RE = Revised Estimates; BE = Budget Estimates; $ = 1994-95 (BE) union
government breakup not available.
Source: CEHAT Database; Original Source: Same as Table 3.
May 17-24, 1997
1199
I
across states not one state shows a
significantly different trend in spite of the
fact that health care is a state subject under
the Constitution! This only goes to show
how strongly the central government
influences the state’s financing decisions
and that too with average grants of less than
10 per cent of the state’s health budgets,
very similar to how international agencies
with even smaller grants exert large
ideological influences.This lackof initiative
on part of state governments to meet
demands of the people is in part due to the
tight grip that the centre has over Plan
resources, which are also largely investment
expenditures. Thus the mechanism of‘planned’
development is used by the centre to make
states tow their line even when the states may
have opposition governments in power.
Under structural adjustment since 1991
there has been further compression in
government spending in its efforts to bring
down the fiscal deficit to the level as desired
by the World Bank. The impact of new
economics unleashed on people comes via
income and prices and affects people through
final consumption and/or employment, and
for the poorest sections the development
expenditures like IRDP. JRY, health care,
education, housing and other welfare are
crucial in the context of the existing overall
life chances available to such sections. There
is clear evidence that expenditures on such
social programmes are declining in real terms
and its benefits are accruing to fewer people.
For instance the GO1 budget expenditures
have declined from 19.8 per cent of the GDP
in 1990-91 to 16.58 per cent in 1993-94 and
the central health sector has been even more
severely affected [Tulasidhar 1993]. The
states’ share in health expenditure has
increased and that of the centre declined
drastically, and especially so for the centrallysponsored disease control and other national
programmes which are mostly of a preventive
nature. If the states do not pick up the added
burden of allocating additional resources for
these programmes then tuberculosis, malaria.
AIDS, leprosy, etc, would be plaguing the
Indian people more severely.
The situation regarding medical care
expenditures, which are the responsibility
of state governments, is even worse. The
decline in these expenditures have been
much more severe and this has affected
particularly the poorer sections of the urban
population. The cutbacks within this account
are on commodity purchases such as drugs,
instruments and other consumables. Patients
in public hospitals are now increasingly
being given prescriptions to purchase drugs
from outside at their own cost and this too
against the background of drug prices having
increased two to three times during the last
two to fouryears. In many states small amounts
of user charges have been introduced.
on Medical
Table 6: Expenditure
Care by States
(As Percentage of Total Health Expenditure)
Year
Union government
Major States
Andhra Pradesh
Assam
Bihar
Gujarat
Haryana
Jammu and Kashmir
Karnataka
Kerala
Madhya Pradesh
Maharashtra
Orissa
Punjab
Rajasthan
Tamil Nadu
Uttar Pradesh
West Bengal
Other Stales
Arunachal Pradesh
Goa, Daman and Diu
Mizoram
Pondicherry
Himachal Pradesh
Manipur
Meghalaya
Nagaland
Sikkim
Tripura
All India
1985-86
1991-92
1992-93
1993-94(RE)
18.49
13.76
14.61
42.23
45.22
48.17
32.85
21.59
52.65
43.65
51.28
37.69
24.99
42.46
50.86
40.78
57.46
25.80
44.65
31.73
28.39
26.86
20.24
32.03
24.53
15.07
29.34
19.88
34.72
15.75
13.14
26.62
19.18
31.31
9.24
12.79
26.46
17.98
24.32
39.11
28.51
25.25
25.34
23.21
28.09
36.44
28.69
37.86
20.93
42.17
28.58
26.61
24.60
35.36
27.59
35.87
30.09
38.93
24.34
44.61
24.34
28.07
21.85
30.72
27.37
43.42
32.33
36.25
22.91
42.14
25.16
26.15
24.17
30.56
25.09
43.52
32.33
37.18
i
62.67
68.22
63.73
71.58
40.52
50.72
50.88
60.15
46.73
66.45
37.82
71.63
49.54
21.72
66.22
25.87
20.88
34.79
42.93
53.03
43.76
26.78
74.00
53.23
19.64
57.85
24.89
68.85
53.35
19.54
55.07
10.14
60.41
54.62
23.17
53.30
26.04
36.62
34.63
38.30
51.48
36.39
27.46
33.86
37.01
46.26
36.28
25.75
49.45
41.92
27.66
Notes: * = Not available, RE = Revised Estimates; BE = Budget Estimates.
Source: CEHAT Database; Original Source: Same as Table 3.
<
1200 |
1994-95 (BE)
I 1.90
.
r
.
.■
*
.
Anecdotal accounts from various states, as
well as data from the performance budget of
the ministry of health in Maharashtra reveal
that the net impact of introduction of user
charges and issuing of presenptions to
purchase drugs, injections, syringes,
bandages, etc, from outside have reduced
public hospital utilisation in most districts
- and these would of necessity mean the
poorest. All this ultimately pushes the poor
to increasingly use private health providers,
often at a cost of personal indebtedness, and
makes public health institutions restneted to
those who can exert influence to grab the
restricted but quality services.
Most of these changes have been at the
behest of World Bank whose World
Development Report (1993) focused on
‘Investing in Health’. This report is directed
at third world governments to reorient public
health spending for selective health
programmes for targeted populations wnere
it clearly implies that curative care, the bulk
of health care, should be left to the private
sector. In keeping with this, the Andhra
Pradesh government set up an autonomous
body called the Andhra Pradesh Vaidya
Vidhan Parishad to make the functioning
of taluka level hospitals independent of the
government and flexible to accommodate
interaction with the private sector and is
making further ‘reforms’ with assistance
from World Bank. Punjab, West Bengal
and Karnataka governments have followed
suit to reform the public health sector under
the guidance of World Bank [World Bank
1996]. in fact Punjab has gone one step
further and set up a corporation for managing
public hospitals with private sector
participation, in many states the first steps
towards privatisation have been taken
through contracting out certain services in
the hospital to private bodies. In Maharashtra
two municipal hospitals in Mumbai are being
considered for handing over to private
medical colleges on a lease contract. In a
number of states PHCs and selected
programmes in selected districts are being
handed over to NGOs to run them more
‘efficiently’. All in all, the state is gradually
abdicating responsibility in the health sector
and that too under the garb of a progressive
slogan, ‘peoples’ health in peoples’ hands’.
I
c
c
f
e
P
it
e
b
st
E
fr
P
g
tc
o
tc
at
is
E
ri
cc
fc
ot
in
fi
h«
ec
hi
ft
ca
of
cc
th
sh
fo
Ti
ur
re
as
References
Duggal, Ravi, S Nandraj and A Vadair (1995):
‘Health Expenditure Across States’ (Special
Statistics). EPW, April 15 and 22.
GOI (1997): Economic Survey 1996-97, Ministry
of Finance, Government of India, New Delhi.
Jesani Amar, and S Ananthram (1993): ‘Private
Sector and Privatisation in the Health Care
Services’, FRCH, Bombay.
Tulasidhar V (1993): ‘Structural Adjustment
Programme - Its Impacton the Heal th Sector’,
N1PFP, Delhi.
World Bank (1996): ‘India - A Comparative
Review of Health Sector Reform in Four
States: An Operational Perspective’, Report
No 15753-IN (Draft Version), Washington.
.
Economic and Political Weekly
. Ec
May 17-24, 1997
■
—
Financing Strategies for Universal Access to Healthcare
Ravi Duggal
Introduction
Access to healthcare is critically dependent on how healthcare provision is financed. Countries
that have universal or near universal access to healthcare have health financing mechanisms
which are single-payer systems .11 which either a single autonomous public agency 01 a lew
coordinated agencies pool resources to finance healthcare. All OECD countries, excluding the
USA. have such a financing mechanism. In these countnes. excluding USA, 85% of financing
comes from public resources like taxes, social insurance or national insurance which insure
healthcare to over 90% of the population - even in the USA public finance (Medicare and
Medicaid) constitutes 44% of total health expenditure butone-th*rd of the population in the US is
either uninsured or under insured In fact the USA and Canada stand out in sharp contrast even
though they are neighbours and strong capitalist economies. Canada gives healthcare access to
100% of its population tree of direct payments at 40% ot the cost that USA spends and has health
outcomes better than the USA.
Outside the OECD group a number of developing countries in Latin America, Asia and Africa
like Costa Paca. Cuba, Argentma. Brazil, South Africa, Kenya. South Korea, Iraq, Iran, Thailand,
Sri Lanka etc. too have evolved some form of single-payer mechanisms to facilitate near
universal access to healthcare. It is only in countnes like India and a number of developing
countnes, which still rely mostly on out-of-pocket payments, where universal access to healthcare
is elusive. In such countries those who have the capacity to buy healthcare from the market most
often get healthcare without having to pay for it directly, and those who suffer a hand-to-moudi
existence are forced to make direct payments, often wrth a heavy burden of debt, to access
healthcare from the market.
India is the most privatised health economy in the world and this despite die fact diat direefourths of the country’s population is eidier below die poverty line or at die subsistence level.
Given the political economy of India one would have expected the State to be die dominant
player in both financing and providing healthcare for considerations of establishing equity in
access to healthcare. But this has not happened.
Historically, the Indian State has always been an insignificant player in provision and/or
financing of ambulatory healthcare. Private providers, both modem and traditional, as well as
informal providers, have been dominant players in the healthcare market. While pre-colomal
healthcare was still largely within the i(ijnicuii realm of transactions, the establishment of modem
medicine dunng the colonial penod gradually moved in the direction of commodification. Today
the healthcare system is completely characterised by modem medicine, and healthcare being a
commodity. Even the traditional and non-formal providers, often practitioners of quackery, use
modem medicine in their practice and operate within die market context.
In case of hospital care the transition has been very different. Right from pre-colonial times,
dtroush the colonial period and the post-independence penod upto mid-seventies, die State and
its agencies were the main providers of hospital care There were also significant non-slate
players who set up large chantable hospitals. By 1970's medical education made a major
transition; post-graduation, specialisation and super-specialisation became sought after and the
character of medical practice changed. Specialists on one hand began setting up private nursing
wmes and the corporate sector on the other hand began to show interests in entering tine hospital
sector. Also major
ranges in medical technology, which hastened the process of
commodification of healthcare, made for-profit hospitals a lllcraC ‘Y ^wasachrmn call forthe
had not only become dominant but also within the state sector pnva isa
well as through contractmg out or leasing had become the order o e ay.
It is apparent from the above discussion that the largest source of■financing he3'*car^J;^
out-of.-pocket or self-financ.no. Out-of-pocket spending on healthcare a a
both regressive and iniquitous. Latest estimates from National Accounts Stat stms indie.... u
pnvateTxpenditures on healthcare in India are over Rs. 1300 b.llion ^%ot
;;
pocket. Public expenditures on healthcare are about s. -.
i ion
adds uo to nearly 6% of GDP with out-of-pocket expenses accounting for 72 /o o
>
total health expenditures or 4.3% of GDP. This is a substantia! burden, especially for the poc.
households, th. bottom thme quintiles, which ar. either below poverty toe or at the thresao, o
subsistence, and when rllness stnkes such households ;ust collapse In act to
/
auintiles the ratio of their income financing health expenditures is ~
i Men orv
: e“ e m.nt Sed above Forttor. whrl.th., burden ,s togeiy seif-financed by househe to«,
large proportion ofthrs does not come from current incomes A ver, targe propomon. espec.ally
for hospitalisations comes from debt and sale of assets.
Data from the 5204 Round NSS of 1995-96 (Table 1) reveals that over 40% households borrow csell assets to finance hospitalisation expenditures, and there are very clear class gradients to .
nearlvhSX bottom X quintiles get into debt and/o. sell assets m contrast to one-tfiird1 ofTne
top quintile; mfact m the top quintde tins difference .s supported
and msurance. When we combine th.s data w.th the ratio ot "not seekmg care wh n H inca sect
acute ailments bv the bottom three quintiles in contrast to the top quintile - a difference or ...
times, and the reason for not seekmg such care being inostiy tire cost factor it
evident that self-financing has drastic limits and mitstlf !s the prime cause of most .ll .le-.m
especially amongst the large majonty for whom out-of-pocket mode of financing strains ...r
basic survival.
or some such combmation administered by an autonomous health autiionty which is mandate
law and provided through a public-private mix organised under a regulated system. Canao
Sweden, United Kingdom, Germany, Costa Rica, South Korea, Australia, Japan are
.e .
examples.
Experience from these countnes shows that the key factor m establishing equity m access and
healthcare outcomes is the proportion of public finance in total health expenditures^ Mos^of die.
countries have public expend.tures averaging over 80% of total health expenditures. The greater
healthcare and health outcomes in comparison to China, Malaysia, Soutli Korea, Sri Lan a v. ilk
public finance accounts for between 30% and 60% of total health expenditures.
In India public health expenditures had peaked around mid mneteen-eighties and diereaftcr there
was a declining trend, especially post-structural adjustment period. Tre decade °f®'Sht'esJ
critical period in India’s health development because during tins period not only did tlie puoi c
health infrastructure, espec.ally rural, expand substant.ally but also ma or improvements in hea th
outcomes were recorded After that public investment in health declined sharply and public
expenditures showed a declining trend both as a proportion to GDP as well as in total government
spending. This has also impacted health outcomes, which are showing a slower improvement if
not stagnation. At the same time private health sector expansion got accelerated and utilisation
data from the two NSS Rounds 42nd and 52nd Round, a decade apart, provides ample evidence of
this change. (Table 2 and 3)
Thus, if India has tu improve healthcare outcomes and equity in access then increasing public
health expenditures will be critical. Apart from this the healthcare system will need to be
organised and regulated in the framework of universal access, similar to countries like Canada or
Costa Rica. Ofcourse, India has its own peculiarities and the system that will be designed will
have to keep this in mind. We cannot transplant say the Canadian or Costa Rican system into
India as it is, but we can definitely learn from their expenence and adapt useful elements.
Prescription
Currently India’s health financing mechanism as mentioned earlier is largely out-of-pocket and
one sees a declining trend in public finance. Table 4 provides a profile of the current financing
mechanism in India and Table 5 trends in health expenditures. It is quite evident from the data
that public finance of healthcare is weakening and private expenditures becoming even larger.
First, within the existing public finance of healthcare macro policy changes in the way funds are
allocated can bring about substantial equity in reducing geographical inequities between rural and
urban areas. Presently, the central and state governments together spend Rs. 250 per capita at the
national level, but this is inequitably allocated between urban and rural areas. The rural healthcare
system gets only Rs. 80 per capita and urban areas get Rs. 540 per capita, a difference of over six
times. If allocations are made using the mechanism of global budgeting, as done in Canada, that
is on a per capita basis then rural and urban areas will both get Rs. 250 per capita. This will be a
major gain, over three times, for rural healthcare and tins can help fill gaps in both human and
material resources in the rural healthcare system. The urban areas in addition have municipal
resources, and ofcourse will have to generate more resources to maintain their healthcare systems
which atleast in tenns of numbers (like hospital bed:population ratios and doctor : population
ratios) are adequately provided for. Global budgeting also means autonomy in how resources are
ustd at the local level. The highly centralised planning and programming in the public health
sector will have to be done away with and greater faith will have to be placed in local capacities
Second, the public exchequer even today contributes substantially to medical education to tiie
extent that 70% of medical graduates are from public medical schools. This is a major resource
. that is not fully utilised. Since medical education is virtually free in public medical schools the
state must demand compulsory public service for atlcast three years from those who graduate
from public medical schools as a return for the social investment. Today only about 15% ot such
medical graduates are absorbed in the public system. Infact, public service should be made
55% of
MBBS
mandatory also for those who want to do post-graduate studies ( as many as 5^
------doctors opt for post-graduate studies).
Third, the governments can raise additional resources through charging health cesses and levies
on health degrading products (if they cannot ban them) like cigarettes, beedis, alcohol, paan
masalas and guthka, personal vehicles etc.. For instance tobacco, which kills 670,000 people in
India each year, is a Rs. 35,000 crore industry and a 2% health cess would generate Rs. 700
crores annually for the public health budget. Similarly alcohol, which is much larger and
presentlv generates Rs.25,000 crores in revenues can also bring in substantial resources if a 2%
health cess is levied. The same logic can be applied to personal transportation vehicles both at
point of purchase as well as each year through a health cess on road ax and insurance paid by
owners. Land revenues and propertv taxes can also attract a health cess which is earmarked for
public health (municipal taxes already have an education cess component).
Fourth, social insurance can be strengthened by making contributions similar to ESIS compulsory
across the entire organised sector and integrating ESIS, CGHS etc., with the general public health
system. Also social insurance must be gradually extended to the other employment sectors using
models from a number of experiments in collective financing like sugar-cane farmers in south
Maharashtra paid Re 1 per tonne of cane as a health cess and their entire family was assured
healthcare through the sugar cooperative. There are many NGO experiments in using micro-credit
as a tool to factor in health financmg for the members and their family. Large collectives, whether
self-help groups facilitated by NGOs, or self-employed groups like headload workers in Kerala,
can buv insurance cover as a collective and provide health protection to its members. Atleasi 60%
of the workforce in India has the potential to contribute to a social insurance program.
Fifth, other options to raise additional resources could be various forms ot innovative direct taxes
like a health tax similarto profession tax (which funds employment guarantee) deducted at source
of income for employed and in trading transactions for self-employed. Using the Tobin tax route
is a highly progressive form of taxation which in an increasingly service sector based economy
can generate huge resources without being taxing on the individual as it is a very small amount of
deduction at the point of transaction. What this basically means is that for every financial
transaction, whether cheque, credit card, cash, stock market, forex etc. a very small propomon is
deducted as tax and transferred to a fund earmarked for social sector. For example if 0.025% is
the transaction tax then for every Rs. 100,000 the transaction tax would be a mere Rs. 25 or one
paise per Rs. 40 transacted. This would not hurt anyone if it were made clear that it would be
used for social sectors like health, education, public housing, social welfare etc..
The above are just few examples of what can be done within the existing system with small
innovations. But this does not mean that radical or structural changes should not be done.
Ultimately if we have to assure universal access with equity then we have to think in terms of
restructuring and reorganising the healthcare system using the rights-based approach. Tins
requires a multi-pronged strategy of building awareness and consensus in civil society,
advocating right to healthcare at the political level, demanding legislative and constitutional
changes, and legulating and reorganising die entire healthcare system, especially the private
health sector.
To conclude, we have to stem the growing out-of-pocket financing of the healthcare system and
replace it with a combination of public finance and various collective financing options like social
insurance, collectives/common interest groups organising collective funds or insurance. At
another level the healthcare system needs to be organised into a regulated system that is ethical
and accountable and is governed by a statutory mandate, which pools together the various
collective resources and manages autonomously the working of the system towards the goal of
providing comprehensive healthcare to all with equity.
Projection Of Resource Requirements
The projections we are making are for die fiscal year 2000-2001. The population base is one
billion. There are over 1.3 million doctors (of which allopathic are 550,000, including over
180,000 specialists), 600,000 nurses, 950,000 hospital beds, 400,000' health workers and 25,000
PHCs with government and municipal health care spending at about Rs.250 billion (excluding
water supply).
1. An Estimate of Providers and Facilities
What will be the requirements as per the suggested framework for a universal health care system 9
> Family medical practitioners = 500,000 (one per 2000 population)
> Epidemiological stations = 35,000 (one per 30,000)
> Health workers = 500,000 (one per 2000)
> Health supervisors = 125,000
> Public health nurses = 35,000
> Basic hospitals = 20,000 (of 50 beds each per 50,000 population)
> Basic hospital beds = 1 million
> Basic hospital staff:
> general duty doctor = 120,000
> specialists = 100,000
> dentists = 20.000
> nurses = 360,000
'r- Other technical and non-technical support staff as per requirements (Please note that the basic
hospital would address to about 75% of the inpatient and specialist care needs, the remaming
will be catered to at the secondary/district level and tcaching/tertiary hospitals)
One can see from the above that except for the hospitals and hospital beds the other requirements
are not very difficult to achieve. Training of nurses, dentists, public health nurses would need
additional investments We have more than an adequate number of doctors, even after assuming
that 80% of the registered doctors are active (as per census estimates). What will be needed are
crash CME programs to facilitate integration of systems and reorganisation of medical education
to produce a single cadre of basic doctors. The PHC health workers will have to be reoriented to
fit into the epidemiological framework. And construction of hospitals m underserved areas either
by the government or by the private sector (but only under die universal system) will have to be
undertaken on a rapid scale to meet the requirements of such an organised system.
2. An Estimate of the Cost
The costing worked out hereunder is based on known costs of public sector and NGO facilities.
The FMP costs are projected on the basis of employed professional incomes. The actual figures
are on the higher side to make the acceptance of the universal system attractive. Please note that
the costs and payments are averages, the actuals will vary a lot depending on numerous factors.
(Table A)
3. Distribution of Costs
The above costs from the point of view of the public exchequer might seem excessive to commit
to the health sector given current level of public health spending. But this is less than 3% of GDP
at Rs.600 per capita annually, including capital costs. The public exchequer's share, that is from
tax and related revenues, would be about Rs.400 billion or two-thirds of the cost This is well
within the current resources of the governments and local governments put together. The
remaining would come from other sources discussed earlier, mostly from employers and
employees in the organised sector, and other innovative mechanisms of financing. As tilings
progress the share of the state should stabilise at 50% and the balance half coming from other
sources. Raising ft rther resources will not be too difficult. Part of the organized sector today
contributes to the ESJS 6.75% of the salary/wage bill. If the entire organized sector contributes
even 5% of the employee compensation (2% by employee and 3% by employer) then that itself
will raise close to Rs.250 billion. Infact, the employer share could be higher at 5%. Further
resources through other mechanisms suggested above will add substantially to this, which infact
may actually reduce the burden on the state exchequer and increase contributory 7nare from those
who can afford to pay. Table B gives the break down of how costs would be shared.
Table A: Projected Universal Health Care Costs (2000-2001 Rs. ai millions}
Type of Costs
> Cap itation/salanes to FMPs
(@ Rs.300 per family per year
x 200 mi femilies) 50% of FMP services
> Overheads of FMP services
> Fees for specific services by FMPs
> Pharmaceutical Services
> Total FMP Costs
> Epidemiological Stations
(@ Rs.3 mi per ES x 35,000)
> Basic Hospitals (@ Rs. 10 mi per
hospital x 20,000, including drugs,
i.e.Rs.200,000 per bed per year)
> Total Primary Care Cost
x Per canita = Rs. 440; 2.09% of GDP
x Secondary and Teaching Hospitals,
including medical education and
training of doctors/nurses/paramedics
(@ Rs.2.5 lakh per bed x 3 lakh beds)
> Total health services costs
60,000
20,000
20,000
35,000
135,009
105,000
200.000
440,000
75,000
515,000
10300
> Medical Research (2%)
10300
x Audit/Info.Mgt/Social Res. (2%)
10,300
x Administrative costs (2%)
545,900
x TOTAL RECURRING COST
54.590
X Add capital Costs (10% of recurring)
600,490
> ALL HEALTH CARE COSTS
> Per Capita = Rs. 600.49; 2.86% of GDP
(Calculations done on population base of 1 billion and GDP of Rs. 21.000 billion)
Table B: Projected Sharing of Health Care Costs (2000-2001 Rs. in millions)
Type of Source
State/ Organised Other
Central
Sources
■Muncp. Sector
Govt.
3,000
7,000
25,000
70,000
1. Epidemiological services
5,000
75,000 45,000
10,000
2. FMP Services
15,000
85,000
100,000
3. Basic Hospitals
5,000
20,000
30,000
20,000
4. Secondary/Teaching Hospitals
300
1,000
1,000
8,000
5. Medical Research
300
5.000
5.000
6. Audit/ Info. Mgt.Z Soc.Research
300
7,000
3,000
7 Administrative Costs
590
25,000
4,000
25,000
8. Capital Costs
162,600
28,890
268.000
141,000
ALL COSTS
Rs.600,490 million
5
27
45
23
Perce ages
Table 1: Key Data pertaining to out-of-pocket expenditures, source of finance and for not
mnc
. .
i _____ Nice
OA,
1995-96
seeking
groups, NSS 52* Round,
care across expenditure quintiles iand -social
ii
m
Tv| V flSC/ST Other a TF
I
Richest
Poorest
OPP_________
Rural________
128
138
I 92
i 174
130
94
124
Rs. per episode 77
Urban
160
166
122
| 225
164
141
139
Rs. per episode 95
IPD_________
Rural________
3133 3102
2789
1931 ' 4595
1197
1495
1020
Rs. per Hosp.
Urban________
4303 3921
7470 I 2046
2765
J964
1499
835
Rs. per Hosp.
43
32
42
42
45
Debt and sale 47
of assets (%)
17
18
18
21
Did not seek 24
I
care (°o)______
'"24
22
21
23
I 15
Cost as factor 33
in not seeking
care (O/o)___________________ ______
Source: Compiled from NSS 52nd Round data files
to
Table 2: Per 1000 distribution of hospitalised treatments by type of facility during
1986-87 and 1995-96, India - NSSO__
Urban
Type of
Rural
1986-87
1995-96
1986-87
1995-96
Hospital
(42nd Rd.)
(52nd Rd.)
(42nd Rd.)
(52nd Rd.)
_________
595
418
554
399
Public hospital
8
9
43
48
PHC/CHC
4
5
Public Dispensary
603
431
597
438
All govt, sources
296
410
320
419
Private hospital
70
111
49
80
Nursing home
19
42
17
40
Charitable institution
12
6
17
8
Others
397
569
403
562
All non-govt. sources
1000
1000
1000
1000
all hospitals
Source: NS SO (1998); Report No 441 on Morbidity and Treatment of Ailments
i
-
Table 3: Percentage distribution of non-hospitalised treatments by source of
treatment during 1986-87 and 1995-96, India — NSSO
Urban
Rural
Source of
1986-87
1995-96
1986-87
Treatment
1995-96
42nd. Rd.
52nd Rd.
42nd. Rd.
52nd Rd.
23
15
18
11
Public hospital
1
5
6
P.H.C. /C.H.C.
2
3
2
Public dispen.
2
1
0
0
ESI doctor, etc.
28
20
____ 2£
19
All govt, sources
16
16
15
12
Private hospital
1
2
•
1
3
Nursing home
1
1
0
0
Charitable inst.
52
55
53
55
Private doctor
7
5
10
Others
72
80
_____ 74
81
All non-govt. sources
100
100
100
•100____
Total_____________
Source: NSSO (1998): Report No 441 on Morbidity and Treatment of Ailments
Table 4: Financing Healthcare in India c2003
Estimated users in millions
250@________
Public Jtector^
_____
55_________
Of which Social Insurance
780@________
Private Sector___________
30
Of which social insurance
11_________
Private insurances________
739_________
Out of Pocket
1030
Expenditure (Rs. Billions)
252 (17)*________
________ 30 (2)__________
1250 (83)**
24 H.6)
______ 11.5 (0.8) _______
1214.5 (80)
1552 (100)
Total
(d), Estimates based on National Sample Survey 52nd Round, and Labour Year Book
* Finance Accounts of Central and State Governments, and Labour Year Book, includes
estimated Municipal health expenditures
** Private Final Consumption Expenditure from National Accounts Statistics
S 85% ofprivate insurance is through public sector insurance companies
Figures in parentheses are percentages
Table 5: Health Expenditure Trends in India
Total Public
Private Health
Health
Expenditure
Expenditure
(Rs.billions)
%
GDP
of
(Rs.bdlions)
Year
24.66
0.90
6.78
1975-76
52.84
0.99
12.86
1980-81
90.54
1.19
29.66
1985-86
160.65
0.96
56.40
1991- 92
175.57
0.74
64.64
1992- 93
% of GDP
3.26
4.06
3.61
2.73
2.61
% Private to Total
Health Expenditure
78.43
80.43
75.32
74.01
73.09
1993- 94
76.81
0.98
195.43
2.50
71.78
1994- 95
85.65
0.93
278.59
3.04
76.48
1995-96
96.01
0.89
329.23
3.07
77.42
1996- 97
109.35
0.88
373.41
3.00
77.35
1997- 98
127.21
0.92
458.99
3.30
78.30
1998- 99
151.13
0.94
653.40
4.04
81.21
1999-00
172.16
0.96
835.17
4.76
82.91
2000-01
186.13
0.98
981.68
5.18
84.06
84.90
5.32
1100.00
0.94
194.54
2001- 02
86.36
5.60
1250.00
0.88
197.32
2002- 03
85.62
5.83
1400.00*
0.98
235.06
2003-04 RE
86.52
6.15
1600.00*
0.96
249.28
2004- 05 BE
* testimates by author for private expenditures; RE=revised estimate, BE-budget
estimates
Source: Public: Finance Accounts of Central and State Governments and RBI’s Finances
of State Governments, various years; Private: CSO - GOI - Private Final Consumption
Expenditures, National Accounts Statistics, 200 j
M - X •
*
1
HEALTH AND ECONOMIC GROWTH
Evolution in Thinking on Development.
1950s:
the real purpose of development was to increase national
income, and all it required was an increase in saving and investment.
1970s
GNP growth was not the end, but merely a means to development.
1990s-Today - Purpose of development is not just to enlarge incomes, but to
enlarge people’s choices: these choices extend to quality education,
good health, political freedom, cultural identity, personal security,
environmental protection, community participation and many other
areas of human well-being.
Development must deal with the entire society, not just with the
economy, and people must be at the center of the stage. As such, the
quality and distribution of GNP growth become as important as the
quantum of growth.
Experience in many countries has shown that economic growth
does not automatically translate itself into human development, though
economic growth is essential condition for human development, a link
between growth and human lives must be created through conscious
national policies.
Source: Human Development in South Asia 1997, Mahbub ul Haq
hr
r
l
Health
Economic Growth
Good Health is a crucial part of well-being, but spending on health can also be
justified on purely economic grounds.
Improved health contributes to economic growth:
It reduces production losses caused by worker illness
It permits the use of natural resources that had been totally or nearly
inaccessible because of disease
It increases the enrollment of children in school and improves their
learning ability
It frees resources, that would otherwise have to be spent on treating
illness, for alternative uses.
Health => Poverty Alleviation
The economic gains are relatively greater for poor people, who are
typically most handicapped by ill health and who stand to gain the most from
the development of underutilized natural resources.
Thus, an enabling environment that improves health of the poor also
contributes to poverty alleviation.
Source: WDR 1993
Gains in Worker Productivity
The most obvious sources of gain are fewer work days lost to illness,
increased productivity, greater opportunities to obtain better-paying jobs, and
longer working lives.
EXAMPLES:
Urban Tamil Nadu, India: - Elimination of deformity due to leprosy would
more than triple the expected annual earnings of those with jobs.
The prevention of deformity in India’s 645,000 lepers would have added
an estimated $130 million to the country’s 1985 GNP. This amount is the
equivalent of almost 10 per cent of total official development assistance
received by India in 1985. Leprosy accounted for only a small proportion of
the country’s disease burden, less than 1 percent in 1990.
> Bangladesh: Healthier workers earn more because they are more
productive and can get better-paying jobs.
> Cote d’Ivoire: Daily wage rates are estimated to be 19 percent lower,
on an average, among men who are likely to lose a day of work per
month because of illness than among healthier men.
> Paraguay: Farmers in malarious areas choose to grow crops that are
of lower value, but that can be worked outside the malaria season.
Improved Utilization of Natural Resources
Some health investments raise the productivity of land.
EXAMPLES:
Sri Lanka:- The near-eradication of malaria during 1947-77 is
estimated to have raised national income by 9 per cent in 1977. The
cumulative cost was $52 million, compared with a cumulative gain
in national income over the 31 years of $7.6 billion, implying a
spectacular benefit-cost ratio of more than 140.
Areas previously blighted by mosquitoes became attractive for
settlement; migrants moved in, and output increased.
> Uganda:- Massive migration to fertile, but underexploited, land
followed the partial control of river blindness (onchocerciasis) in the
1950s.
> Onchocerciasis Control Programme:- The estimated cost of the
OOP during the whole of its existence, from 1974 to 2000,
conducted in 11 countries of the Sahel, is about $570 million. Its
estimated internal rate of return is in the range of 16 to 28 per cent.
Benefits through Education
Schooling pays off in higher incomes. Four years of primary education
boosts farmers' annual productivity by 9 per cent on average, and
workers who do better at school earn more.
EXAMPLES
Ghana, Kenya, Pakistan, and Tanzania: Workers who scored 10 per
cent above the sample mean on various cognitive tests have a wage
advantage ranging from 13 to 22 per cent.
> Nepal: Farmers with better mathematical skills are more likely to adopt
profitable new crops.
Poor health and nutrition reduce the gains of schooling in:
enrollment
ability to learn, and
participation by girls.
Children who enjoy better health and nutrition during early childhood are more
ready for school and more likely to enroll.
Health and nutrition problems affect a child’s ability to learn. Nutritional
deficiencies in early childhood can lead to lasting problems: iron deficiency
X
anemia reduces cognitive function: iodine deficiency causes irreversible
mental retardation:
vitamin A deficiency is the primary cause of blindness
among children. Older children are subject to other kinds of disease.
Girls are particularly liable to suffer from iodine or iron deficiency reasons why fewer of them complete primary school. Other health-related
reasons include dropping out as a result of pregnancy and parental concern
about sexual violence. In societies where girls’ education is given lower
priority than boys’, girls miss school because they have to stay home to look
after sick relatives.
EXAMPLES
Nepal:- The probability of attending school is only 5 per cent for
nutritionally stunted children, compared with 27 per cent for those at the norm.
Jamaica:- Children with moderate whipwork infection scored 15 per
cent lower before treatment than uninfected children in the same school.
When retested after treatment, those same children did almost as well as the
uninfected children.
Northeast Brazil: - Inadequately nourished children lagged 20 per
cent behind the average gain in achievement score over a two year period.
Children with bad eyesight lagged 27 per cent behind the average gain over
the two years. Both groups had below-average promotion rates and above-
average drop-out rates.
a
w
China:- A child at the twentieth per centile in height-for-age (a sign of
poor health) averages about one-third of a year behind the grade normally
reached by children of that age.
Thailand:- Children whose height-for-age is 10 per cent below
average are 14 per cent lower in grade attainment.
1
Reduced Costs of Medical Care
Expenditure/investment that reduces the incidence of disease can
produce big savings in treatment costs.
For some diseases the expenditure pays for itself even when the
indirect benefits, such as higher labour productivity and reduced pain and
suffering, are ignored.
EXAMPLES:
Polio:- Calculations for the Americas made prior to the eradication of
polio in the region showed that investing $220 million over 15 years to
eliminate the disease would prevent 220,000 cases and save between $320
million and $1.3 billion (depending on the number of people treated) in annual
treatment costs. The programme’s net return, after discounting at even as
much as 12 per cent a year, was calculated to be between $18 million and
$480 million.
AIDS:- Although it remains much less common in the developing world
than diseases such as malaria, its economic impact per case is greater for
two reasons. It mainly affects adults in their most productive years, and the
infections such as pneumonia, diarrhea, and tuberculosis resulting from it lead
to heavy demand for expensive health care.
*
1
Research in nine developing and seven high-income countries
suggests that preventing a case of AIDS saves, on average, about twice GNP
per capita in discounted lifetime costs of medical care; in some urban areas
the saving may be as much as five times GNP per capita.
Calculations for India showed that, given prevailing transmission
pattern, each HIV-positive person in 1991 would infect one previously
uninfected person every four years. At this rate, there will be six HIV-positive
persons in 2000 for every one in 1991.
If the transmission rate could be slowed to one every five years, that
number could be reduced to only four infected persons in 2000 for every one
in 1991. The corresponding reduction in medical costs, after discounting at 3
per cent a year, amounts to $750 by 2000 for each currently HIV-positive
person in India, or a total saving of $750 million.
Similar calculations for Thailand suggest savings of $1,250 per
currently HIV-positive person, or a potential total saving of $560 million.
vvr
Health mustn’t hinge on wealth
*
mi
>
i.
ume; and two, during the first two
"WT y HEN the “buy one,
There S a great deal Ol
or three days, when patients are
> Jw / fake one free” sales
%/%/ pitch hits the marconceptual Clutter 111 OUr tensive diagnostics and invasive
7 f
ket for healthcare,
x ill
procedures, 'the incentives imi it is time to sit up. “Buy a heart by, pass and take a week’s holiday in
| C„’’
| Goa” or “Get the second bypass
to reduce the length of stay or
at 50% discount” is no longer a
IK. Sujatha Rao
make the prices so unaffordable
! joke. It is on offer today. The
that the patient opts to leave. This
question is that while most of us
it
being
underfunded,understaffexplains why a large number of
would be lured into buying that between the US and Canada are
ed
and
overstretched.
Is
this
gradthe “rich” continue to frequent
account
of
largely
on
the
values
extra pair of shoes we do not
need, how many of us are willing enshrined in their respective con ual veering towards the US model the public hospitals and why US
subsidises the care of all its senior
to have our teeth extracted or stitutions. For the Canadian psy a reflection of our Hinduism wh
citizens, who largely suffer from
ich
is
intensely
atomistic
and
wh
che,
it
is
social
solidarity,
order,
heart cut up only because there is a
chronic diseases, under its
ere
each
lives
and
suffers
in
accor
discount? Is it not reasonable to peace and good governance,
medicare programme.
dance
karma?
with
his
own
assume that those in dire need of while for the US it is personal
rFhe hijacking of the health sec
it
Is
really
true
that
concepts
of
of
happiness
freedom,
pursuit
such services would not only re
tor
by the market fundamentalists
and
equality
social
solidarity
are
spond, but the need for suivival and liberty. And while in both
arguing for more subsidies for the
indeed
foreign
and
borrowed
and
countries
provisioning
of
health
being so great, would do so at any
therefore not relevant to India as private sector, starving public hosfuture cost to themselves or their care services is by private
providers. Canada insures all its seems to have been pointed out by pitals of resources, has been possifamily?
ble because of the absence of a na
This then brings in the ques- citizens — rich and poor — inpa- the then prime minister to a group
i tion of individual vulnerability * tient care and physician services, of agitated women activists in re tional consensus on the values that
' which an Ambani and the rick- while in the US, public finance is sponse to his stand on the famous we need to adopt for ourselves. To
I shaw puller have in common, giv- only for specific target groups. Shah Bano case? Qearly, there is start with, as pointed out by for
i
| ing rise to the most fundamental namely the poor and the elderly. an immense amount of concep mer US president, Biil Clinton, in
principle — is profiteering on the Given the widespread poverty, tual clutter and lack of direction in Hyderabad to a gathering of top
industrialists, do we believe that
sickness of other humans ethical?
there is a higher purpose in life to - w
Can companies be lauded and inmerely making profits? If yes, can
Can
be
and,
there
true
happiness
: dividuals be rewarded the best en
we then agree that those who can
trepreneurial award for increasing
more importantly, social stability
not afford healthcare should be
, profits on the ill health and vulnerdenied it and allowed to suffer and
in a society where a large number
' ability of people who are struck
die? Do we believe that all hu
with the misfortune of falling sick?
mans are not equal?
of
its
members
suffer
want
I These are important issues, ones
As all philosophical principles
that were hotly debated in UK
and disease?
remind us, can there be true hap
l during the 40’s, in Canada and
piness and, more importantly, so
I most of Europe in the 60’s and
cial stability in a society where a
our
intellectual
traditions
and
our
discourse
on
health.
In
jump
70’s, as also in Singapore, Aus
large number of its members suf
tralia during the 80’s, resulting in constitutional pronouncements of ing to ideological positions of pub
fer want and disease? Is it then
lic
is
private
is
good
govbad,
and
it
is
inexplicable
as
to
equality,
all these countries opting for a
uuhv discourse on health
emments are bad and markets are not necessary for turning the dewhy
public
strong interventionist role by the systems'has not followed UK or good, our intellectuals have trivi- bate around and placing the prinstate. And this is the issue that
debate.The
ThedevasCanada and why we are creating a alised
alisedserious
serious debate.
devas- ciples of social solidarity and pubtroubles the conscience of most
Americans, too. as evidenced by system resembling the US.
tation
tation markets
markets have
have caused,
caused, in
in lie accountability in health getting
As
US,
we
too
do
not
of
human
suffering
and
precedence over privatisation an«
in
the
terms
terms
! their constant yearning for the
a further commercialisation of
seem to be troubled by accepting a publ ic spending in the US, have
I Canadian model of health care.
health? A national consensus on
not
even
been
studied.
Instead,
in
Compared to the US, Canada two-tier system, where the rich can
I
some of these issues is important
tellectuals
have
allowed
them’
’
’
access
world
class
health
care
as
] provides universal health care of
- y
for clarity in public policy and for
i the same level of quality at one per their ability to pay while the selves to fall prey to facile argufor
privatisation
values of compassion
ments
such
as,
for
instilling
third the cost. Besides, despite be- poor must rest content with the i-----------r, .
,
. . ..
— example,
example, that
thatininproviding
providingchoice.
choice.andand
concern
in our
society
ing the world’s highest spender on public health system. This is worconcern
in our
society
a* at large
health, with 40 per cent from the lying, because unlike Singapore, of private hospitals, the rich will and among our health professiongovernment, US has nearly a third which also has a two tier system opt out of the public hospitals pro- als in particular,
of its people denied access to ba- with the public hospitals providing viding space for the poor!
The author is with the Indian
sic care and a longevity of life the benchmark in quality of care,
It is not widely understood
Administrative Service. The views
public
health
care
in
India
is
conthat
profits
by
private
hospitals
among its black populations at
expressed here are her own
about 58! The sharp differences sidered substandard as a result of are made in two ways — one, vol-
discourse on health care £s
Ci Calais >
”1^
lJ / I
? i-yr' -7
Clo-r'l
2
.
_
BUDGET FOR A REALTRY ^ATDOM
Tte girftteh fpres^irto tth® ©MinrMft se@owo© m whtt Bydlgjett
wtaftDw
os temg]
gmu^
(UJmfM Bmgmssow ADDohod ©® G©wmm@[iD^ tas ftte [p©0oftora[] woDO ft©
mate g) ta©]g](Bft m ftte d)(B(iws@ ©ft [p@©[pO@9s tenOfth
The exercise which the Indian Finance Minister and his colleagues are engaged in currently is no mean
task. Making a budget which will impact more than one-sixth of the world’s population is a job profile
which very few people in the world possess. What makes the task even more difficult is the huge
disparities existing in the land.
More than one-third people in India live on less than 1 dollar a day, while the share of the poorest 20
percent of the population in national income or consumption is a paltry 8.1%. About one-fourth of the
population in the country is under-nourished. The situation of children is much worse with 47 percent of
children below 5 years being under-weight. Even those children can be considered Sucky, considering that
for every thousand live births, the Under-5 mortality rate is 93 compared to 7 in developed countries. The
Infant Mortality Rate (IMR) has improved from 127 in 1970. But it is still high at 67 per thousand live births
in 2001, compared to an IMR of 5 in high-income countries. The plight of mothers in India is also bad with
the Maternal Mortality Rate being 440 per hundred-thousand live births. Another shocking fact is that, in
spite of all the technological advances and increase in private healthcare, only 43% of births in this
country are attended by skilled health personnel.
In spite of such alarming health indicators, the per-capita Government expenditure on health has
remained at US $4, at average exchange rates for the years 1997-2001, while that of China rose from US
>
$13 to 18, during the same period. In fact the general government expenditure on health, as percentage
of the total health expenditure has decreased from 18.4 percent in 1998 to 17.9 percent in 2001. The
remaining 82.1 percent is borhe by the people as out-of-pocket expenditure. In UK, it is just the reverse
with Government expenditure on health being more than 82 percent, and private expenditure being less
than 18 percent.
$
The higher public expenditure on health is not just a phenomenon of developed countries. About 37
percent of health expenditure costs in China is borne by the Government, while in Pakistan it is about
24%, compared to the below 18 percent expenditure by Indian Government.
The Congress Manifesto and the Common Minimum Programme (CMP) of the United Progressive
Alliance (UPA) Government recognised this problem and promised to raise the public spending on health
to at least 2-3 percent of the Gross Domestic Product (GDP) over the next five years. At present, the
public spending on health is at an abysmally low 0.9 percent of GDP.
Implementing the CMP’s promise of bringing the public spending to 3 percent of the GDP has the
potential of reducing the private expenditure on health considerably. Expenditure on healthcare has been
o
recognized as one of the main causes of falling into the debt-trap in rural and urban-poor families.
Studies, including a Special Report by the National Council of Applied Economic Research (NCAER) has
shown that public health subsidies are disproportionately distributed in favour of the richer groups and are
not well-targeted towards the poor, especially those in rural areas. Hence, the increase in health budget
should be specifically earmarked for improving and extending the Primary Healthcare in the country.
The current allocation for Primary Healthcare is grossly inadequate. To compound the problem, the
absence-rate among health personnel in primary health centres which caters to the poor in rural areas is
reportedly as high as 43%, according to the World Development Report 2004. In the Prime Minister’s
address to the nation on 24th June 2004, Dr. Manmohan Singh reiterated his Government’s commitment
to the protection of the interests of the scheduled castes, scheduled tribes, backward classes and all
weaker sections. And rightly so, since the health indicators of this section of the people are comparable to
the health indicators of some Least Developed Countries. For instance, about 56% of scheduled tribe
children in India are malnourished and under-weight, compared to the 47% for the whole of India
(National Health Policy 2001). With an under-funded and poorly functioning public health system, it would
not be possible to reach out to the poor and marginalized who already suffer from limited access to health
systems.
The first step in setting right the above anomaly is given in Congress Manifesto 2004 and the Common
Minimum Programme of the UPA itself.
Rgiog® ftOu® ipoj]bOk g^oDdJoPDgi ©ira Dwg® ft© gift hgisft 3% ©ft ftftw GOIP m ftb® ©©momi^ BscmcOgjofte
UlftSDos® ftftw mcmgwdl boDdlgoft ft© sftmimgjfth®^ ftbe Promg)^ HogiDftDwgiim sysft®m m ftDw ©©raftir^.,
3) EmisdDm fthgift ftOw ^MbOS© s@©ft©[r OwsiOftOD eysftom omiprows oftt ©gifpgidfty gumdl ftmumcftbtmotnigjo Tbos ob
Sod tagpSoDg) woftb ftb® IM)g)ftD©in)giD H^giOfth P©Do©y ^©@1 gioDdl fth® [w©©mm@[n)(d]giftS©[iDB ©ft ftb®
©©mm§sso©[n) ©od [^)g]©[r©@©©OD©m0©s gumdl teg® (CM]), odd w Dd S©Gd D[ro IMlgi[]Dm©[hg)OD Sodd ^Dd wgis
otmwDwdlc
4) SftmoDgjfthsoD ftbe [piuibDS© s@©ft©[r DwgiOftlh sygftgm bgi^odl ©od jpOTdotes ©ft ©qjmft^ gumd) §©©ogiD
jtiosftSc^o TDdos bgis tern Sdl@[iDftBftB®d] gis g) [pTOirBft^ by ftb® W©(rOd] teg® ©D°g]g)OD8sgifto©oD (W©oW
InJ^giDftllD te[p©[rft ^M3J)o Th® tefp©^ @Dgib©[rgift®s fthgift mlbrscBimg
pnoc/pta ©^ piwwy
An increase in public spending on health would imply increasing the expenditure on health by the
Government, which is currently at about 3.1% of the total Government expenditure. The question is
whether the UPA government has the political will to take a stand in the favour of defence of people’s
health. The next few days will tell whether the pre-election promises of the UPA were just hollow promises
or an inspired action-plan for the future.
- Naveen L Thomas ®
a Naveen is a Policy Fellow at Community Health Cell, Bangalore. He can be contacted at navthom@yahoo.co.uk
“
2
GoKH
I'
HEALTH POLICY AND PLANNING; 16(1): 113-121
©O
G-
x
Pressf 2001o
University
r
How to do (or not to do) . . .
Cost and cost-effectiveness guidelines: which ones to use?
DAMIAN WALKER
Health Policy Unit, London School of Hygiene and Tropical Medicine, London, UK
11
I
Given t
increased
h
awareness
e
of the importance of cost-effectiveness in health care, there has been a
growth in the number of published economic evaluations in r
eyears. Partly
c
in r e e t nc os
o
t p
about d
e in the methodology
f
i
c of published
i
e
studies,
n there has
c been ia growth
e
of interest
s
in guide
lines for economic e
vT
a objectives
t ofr ie o
n
p a hreviews
a l the
iu various
sp
e
canalyses,
oa . t
nhn
s
u the existing
m
g
ofmrguidelines
o
foracost
u and rcost-effectiveness
p i
z s
e
analyses. F
s
it compares
i
n
a
guidelines,
with particular e
on
and discusses the appropriate uses and limitations of t
h
e
m t
hdevelp o
oped for applications in developing countries.
introduction
■
!
fr
I
cost and cost-effectiveness analyses. The final sections
compare and discuss their appropriate uses and limitations,
with particular emphasis5 on those developed for applications
in developing countries.
Given the increased awareness of the importance of costeffectiveness, or value for money, in health care, there has
been a growth in the number of published economic evalu
ations in recent years (Warner and Hutton 1980; Elixhauser
et al. 1993; Elixhauser et al. 1998). This reflects, in part, the
increased recognition received by economic evaluation in the
policy/ arena. For example, two jurisdictions, Australia and
the Province of Ontario in Canada, have made the provision
of an economic evaluation a mandatory requirement for
reimbursement (public subsidy) of health care products —
both jurisdictions operate ^‘positive list’ of drugs (Common
wealth Department of Health, Housing and Community Ser
vices 1992; Canadian Co-ordinating Office for Health
t Technology Assessment 1994), In addition, the World Health
\ Organization (WHO) established the Global Programme on
Evidence for Health Policy (GPE) in 1998. Its creation recog
nized that a core function of WHO must be to provide an
objective assessment of the various types of evidence which
should influence health policy. An integral component of
GPE’s activities is to provide evidence on the cost-effective
ness of health interventions.
Although cost analyses are not economic evaluations per se,1
they are clearly a key component of them. Cost analysis is a
tool that can provide useful insight on the functioning of pro
jects. If the initiative to conduct the costing exercise comes
from the project itself, managers may want information for
one, or a combination, of (he following objectives
(Kumaranayake et al. 2000).
Partly in response to concerns about deficiencies in the
methodology of published studies (Gerard 1992; Udvarhelyi
et al. 1992; Zarnke et al. 1997; Walker and Fox-Rushby 2000a.
b), there has been a growth of interest in guidelines for econ
omic evaluation. I he development of guidelines reflects the
desire to improve and standardize the conduct of economic
evaluations in order to facilitate comparisons between
studies.
(1) Improve budgeting by monitoring costs:
(2) Improve the efficiency of (he intervention by identifying
potential cost savings:
/
(3) Estimate the resources required to sustain the inter
vention by seeking an accurate estimate of (he budget
necessary to maintain it:
(4) Estimate the resources required to expand the intervenlion.
Phis paper reviews the various objectives of economic analy
ses, and then summarizes the existing groups of guidelines for
in these instances, the financial costs ol the project arc of
interest.
Objectives of cost and cost-effectiveness
analyses
Analysis of costs may be undertaken for a number of reasons.
Before making preparations for a costing study, the purpose
of the planned work should be clear, as this will help to estab
lish the boundaries for the costing exercise (Kumaranayake
et al. 2000).
Cost analyses
n
o
oed
h s
114
H
to do ( o n o t
If the impetus for the costing exercise comes from outside
the project, objectives are more likely to concern the cost of
replicating the project and the extrapolation of results to
other settings. In such cases, both running and start-up costs
should be collected. Economic3 costs will also need to be
estimated, as in other settings, donated goods and services
may not be available and hence may need to be purchased.
Cost-effectiveness'
Cosl-effectivcncss analysis provides a systematic and trans
parent framewoi k by which to assess the relative costs and
consequences ol different interventions that can assist in pri
or ity-setting exercises. While this approach can answer ques
tions regarding technical efficiency, which aims to maximize
the achievement of a given objective within a specific budget
(e.g. should a new drug be used to treat a particular
disease?), it fails to address allocative efficiency. This
broader objective of economic evaluation seeks the optimal
allocation of resources across a mix of programmes that
cannot all be fully funded, to produce the greatest gain to
society. However, cost-utility analysis4 can be used to assess
allocative efficiency within the health sector (e.g. malaria
control versus immunization), but cannot make comparisons
across sectors (e.g. provision of health care versus edu
cation), it is limited to quasi-allocative assessments.
Now that the different types of objectives of economic analy
ses have been reviewed, let us turn our attention to the
guidelines. Recently, a number of guidelines for cost and
cost-effectiveness analyses have been published. These have
been promulgated by three distinct groups: governments
and pharmaceutical agencies; peer-review journals; and
developing country specialists. The next section summarizes
them.
Guidelines for cost and cost-effectiveness
analyses
The guidelines have been summarized, and subsequently
compared, by using a modified version of Drummond et al.’s
(1997) checklist to identify how the guidelines suggest ana
lysts should perform an economic evaluation.
Government and pharmaceutical guidelines
Flic first to promulgate guidelines were government agencies
and pharmaceutical companies. For example, the Australian
and Canadian governments- have introduced legislation, to
varying degrees, which requires formal economic studies
prior to reimbursement for pharmaceuticals (Commonwealth
Department of Health. Housing and Community Services
1992; Canadian Co-ordinating Office for Health Technology
Assessment 1994). Il is hoped that this will ensure a more
efficient provision of drugs, and curb the prescription of drugs
of low cost-effectiveness, which is both inefficient and un
ethical as it can deprive a larger number of patients of care
from which they would benefit.
1 able I summarizes the main points of the two governments'
guidelines. In particular, the guidelines recommend a
do)
w
oo. . r.
t
societal perspective, the use of final outcome measures,
incremental analysis of costs and outcomes, and probabilis
tic sensitivity analysis. However, the guidelines’ aims vary
slightly, and this becomes apparent when the two are com
pared.
I lie Australian guidelines ‘provide a means to identifying and
formatting the necessary basic information’, and as such
provide firm guidance. Yet it is the Canadian guidelines which
suggest a ‘reporting format to ensure that studies arc reported
adequately and in a consistent manner that will facilitate their
review and comparison’. They represent the most prescrip
tive and sophisticated set of guidelines among the pair. Their
scope is also the broadest, evidenced by the recommendation
to use final outcome measures such as quality-adjusted life
years (QALYs), enabling questions of quasi-allocative effi
ciency to be answered.
Peer review journal guidelines
The suitability of government and pharmaceutical guidelines
to peer-review journals has been questioned because of their
emphasis on new health care technologies (Jefferson and
Demicheli 1995). The publication of guidelines for submis
sion of economic evaluations to peer-review journals fol
lowed closely behind (Kassirer and Angell 1994; Mason and
Drummond 1995; Drummond and Jefferson 1996; Russell et
al. 1996; Siegel et al. 1996; Weinstein ct al 1996). Table 2 shows
the key recommendations of the British Medical Journal
(BMJ) and the Journal of (he American Medical Association
(JAMA) guidelines, arguably the most prominent among the
group.
The emphasis of the BMJ guidelines s on improving the
clarity of economic evaluations, with a view to improving the
quality of submitted and published economic evaluations by
‘agreeing acceptable methods and their systematic appli
cation before, during, and after peer review’. However, the
guidelines chose not to slate any firm recommendations and
consequently they represent little more than a review of
accepted methods for economic evaluations. The main rec
ommendation throughout the guidelines is that choices
should be explicitly stated and justified. At best, these guide
lines will improve technical efficiency as decision-makers
should have more confidence in the results presented, but
they do not promote allocative efficiency because no stan
dard method from which comparisons could be made is sug
gested (Drummond and Jefferson 1996).
I he JAMA guidelines, the result of a scries ol meetings with
the Panel on Cost-Effectiveness in Health and Medicine
(convened by the US Public Health Service), have produced
recommendations to improve the comparability and qualitx
ol studies (Russell el al. 1996; Siegel cl al. 1996; \\einstein cl
al. 1996; the full report is presented in Gold el al. 1996). I hc
aim of increasing comparability across studies requires much
firmer guidelines, which if systematically employed would
facilitate comparisons. Therefore, a major feature of (he I'S
panel s work was to specify guidelines for undertaking such
studies, including a ‘reference case- that should be reporic'tl
in every published study either to complement the base case
4
I
Table Z_
Peer-review journal guidelines
Methodological aspects
. BMJ (Drummond and Jefferson 1996)
JAMA (Russell et al. 199
Perspeclive/viewpoint
Alternalive/comparator
Identification of costs and
outcomes
• choice should be justified
• choice should be justified
• resource use associated with an intervention
• the inclusion of indirect benefits (productivity from improved
health) is left to the discretion of the analyst
• outcomes identified are mortality and quality of life
Measurement of costs and
outconaes
• if evaluation is taking place alongside a clinical trial data on
resource use can be collected as part of the trial, otherwise
it should be based on data on real patients collected from
medical records; the use of ‘expert panels’ to estimate
resource use is not recommended
• outcome data can be collected from various sources including
RCTs, observational trials, meta-analyses, and modelling
• health outcomes are measured in terms of natural units in
CEA. healthy years gained in CUA, and monetaiv units for
CBA
• costs should be adjusted for inflation and currency conversions
• healthy years in CUA. can be valued using standard gambles,
time trade-offs, or rating scales
• health outcomes in CBA can be valued in money terms by
using either the human capital approach or the willingness to
pay approach
• government recommended rate for both costs and outcomes is
preferred
• incremental analysis when two or more alternatives are compared
• choice of technique should be justified
• societal
• reference case, which h
• resource use associated
services; patient time e
or unpaid); other costs
expenses; economic cos
associated with non-he
• fixed costs should not b
• the inclusion of health
longer due to an interv
• outcomes identified are
• costs should be measur
distortions
• health outcomes should
• health outcome data ca
RCTs, observational tr
Valuation of costs and
outcomses
Discoumting
PrcsmBation ol results
Sunsilivitv analvsis
• time costs for individua
wage rate
• QALYs can be valued
rating scales
• 3% discount rate for bo
for comparison with pa
• incremental cost-effecti
• one-way and multivaria
CEA - cost-effectiveness analysis; CUA = cost-utility analysis; CBA - cost-benefit analysis; RCT = randomized controlled trial; QAL
—"Kwcx.' —
Table 1.
Government guidelines
Methodological aspects
Australian (CDHHCS 1992)
Canadian (CCOHTA 199
Perspective/viewpoint
Alternative/comparator
Identification of costs and
outcomes
• societal
• practice most likely to be replaced
• cost items that should be included are all direct health
care costs, social services costs, home health aides,
and/or physical therapy for patients with chronic disability
• cost items that should be excluded are indirect costs and
benefits unless a special case can be made tor their
inclusion, and health costs resulting from the fact that a
patient lives longer due to an intervention
• outcomes identified are mortality and quality of life
• resources should be described in natural units
• intermediate and final outcomes are preferred far measuring
health outcomes
• good medical evidence should be obtained from RCTs and
meta-analyses
• costs should reflect full opportunity cost
• future costs should be valued at today’s prices
• societal
• existing and minimum p
• cost items that should b
social services costs, spi
fall or. the patient and f
• cost items that should b
treatment being evaluat
and transfer payments s
insurance and welfare p
• outcomes identified are
• resources should be des
• QALYs are preferred fo
• effectiveness rather than
appropriate modelling t
Measurement of costs and
outcomes
Valuation of costs and outcomes
Discounting
Presentation of results
Sensitivity analysis
e 5% for both costs and outcomes
• incremental analysis of costs and outcomes
• the upper and lower confidence limits of the parameters
should be substituted
RCT - randomized coni rolled trial; QALYs - quaiity-adjusied life years.
• costs should reflect full
buildings, and equipme
• willingness to pay is pre
for valuing health outco
• 5% for both costs and o
• incremental and total an
• the use of Monte Carlo s
H
to do (oro not to d w . . .
or indeed to be the base case. The construction of the refer
ence case is achieved through a standard set of methods and
assumptions.
Developing country guidelines
Experts in the field of economic evaluation in develop
ing countries have chosen to concentrate on formulating
guidelines for specific programmes; immunization (WHO
1979); diarrhoeal diseases control (WHO 1988); vector
control (Phillips et al. 1993); primary health care (Creese and
Parker 1994); family planning (Janowitz and Bratt 1994);
blood transfusion services (WHO 1998); tuberculosis (WHO
1999); and HIV/AIDS (Kumaranayake et al. 2000). However,
recently Murray et al. (2000) published a paper in Health
Economics discussing the development of WHO guidelines
on ‘generalized cost-effectiveness analysis’. Because details
of their recommendations have not been released yet, it was
not possible to review them. But it should be noted that the
main aim of these new guidelines is to help produce general
izable results.
Table 3 summarizes the key areas of five of the guidelines.5
Whereas in the government and peer-review guidelines the
target audience is, respectively, economists and, more gener
ally, those wishing to publish their research, the developing
country guidelines are aimed at programme managers who
may have little or no economic training. This is reflected by
the way in which the guidelines go ‘step-by-step’ through the
procedures for undertaking cost-effectiveness analyses. The
guidelines tend to restrict analyses to assessments of techni
cal efficiency by recommending the use of process and inter
mediate outcome measures as end-points. This reflects, in
part, the prohibitive cost of many randomized controlled
trials (RCTs) in developing countries.
Discussion
The summary of guidelines Tas illustrated some differences,
particularly between, on the one hand, the government/
pharmaceutical and peer review journal guidelines, and on the
other, those developed for use in developing nations. The first
major difference is the applied nature of the developing
:ountry guidelines, focusing mainly on specific disease areas,
using examples to illustrate techniques and applications (e.g.
researchers planning a cost or cost-effectiveness analysis of an
HIV/AIDS prevention strategy are recommended to use the
guidelines prepared by Kumaranayake et al. 2000). However,
they are not mutually exclusive. Indeed, the contents of the
disease-specific guidelines are very similar, and therefore
could be used inter-changeably. Secondly, their primary
emphasis is on costing methodologies, with some providing
cost-data collection forms, e.g. Kumaranayake et al. (2000)
and WHO (1998) - the latter in electronic form. All of them
recommend the ‘ingredients’ approach to costing, in which the
total quantities of goods and services actually employed in
delivering the activities are estimated, and multiplied by their
rcspectivejjnit prices. They also review techniques to estimate
both financiaTanTeconomic costs, but emphasize certain
aspects of analysis. In particular, a major difference between
developed and developing country guidelines is that the
o
)
117
developing country guidelines specifically point evaluators to
questioning affordability.
Yet a common observation is that none of the guidelines
recommend a cost-benefit analysis (CBA)6 framework, with
the exception of the Canadian guidelines (CCOHTA 1994) see below. This perhaps reflects the increasing dominance of
cost-effectivencss analysis/cost-utility analysis in health care
related literature (Warner and Hutton 1980; Walker and FoxRushby 2000b), which is largely due to the difficulties with
applying a monetary value to human life.7 Therefore, quasiaUocative efficiency goals are the maximum achievable
objective through the application of the guidelines.
However, a notable feature of the developing country guide
lines is that the use of shadow prices for foreign exchange
and labour is emphasized, drawing on development econ
omics’ tradition of cost-benefit analysis (United Nations
Industrial Development Organization 1972; Little and Mirrlees, 1974). This is because in many developing countries
some resources have market prices that do not reflect their
true ‘value’, or opportunity cost, because the economy is dis
torted.8 For example, the exchange rate is often overvalued,
which results in raising the price of exports and lowering the
price of imports in terms of the local currency. Clearly, in
these instances the official price of foreign exchange does not.
reflect the true economic costs and benefits of importing and
exporting, and a shadow foreign exchange rate is required. In
addition, shadow prices may be required to value wages and
capital if their prices do not reflect their true scarcity. Often,
due to factor-price distortions, the price of labour is artifi
cially higher, and that of capital lower, than their ‘true’
shadow values, which results in capital-intensive methods of
production. The result of shadow pricing of foreign exchange
rates and wage rates is to correct for these distortions which,
in the cases <above, increase the cost of foreign exchange
while reducing the cost of labour. This means that projects
requiring large amounts of foreign exchange will tend to be
penalized in favour of more labour-intensive interventions
(Todaro 1994). Indeed, in developing countries, markets
often function so poorly that market prices for many goods
cannot be used to reflect social opportunity cost. Therefore,
analysts involved in economic evaluations in developing
countries should be aware of the need to apply shadow prices
in certain circumstances, and that the developing country
guidelines are the only set to address this issue.
In addition, the government and pharmaceutical, and peer
review journal guidelines are not necessarily useful for econ
omic evaluations in developing nations, due to constraints of
time, money and capacity. The developing country guidelines
have been written with these constraints in mind. RCTs arc
expensive and time-consuming, which is whv most ofTRe
developing country guidelines recommend the use of process
and intermediate outcome measures, and provide guidance
bn how to collect this information. This also helps explain the
increased use of modelling to predict the impact of health
care interventions in developing countries (Foster ct al. 1997;
Goodman et al. 1999; Marseille et al. 1999). However, given
the relatively recent application of modelling the impact of
health care programmes in developing countries, coupled
with the high cost of RCTs, it is perhaps not surprising that
i
Table 3.
Developing country guidelines
Methodological aspects
Diarrhoeal diseases (WHO 19S8)
Immunization (WHO/EPI 1979)'
Perspective/viewpoint
Alternatives/comparator
• service providers
• should be comparable - only
differ with respect to costs or
the specified effectiveness
• resource use associated with an
intervention - distinction
between capital and recurrent
costs
• outcomes ranging from the
provision of goods and services
up to achieving an impact on
health
• societal
’ service providers.
• current practice, i.e. do nothing ‘ • best possible alternative
or an on-going programme
Identification of costs
and outcomes
Measurement of costs
and outcomes
• quantify inputs in physical units
• methods for allocating joint costs
include: time used; distance
travelled: space used; or proxies
• intermediate measures are
easiest but large differences in
outcome measures
Valuation of costs and
outcomes
• convert cost data into constant
(or real) prices
• market value of subsidies and
donations should be estimated
• use the exchange rate employed
by the Economic Planning
Ministry to convert items
purchased from overseas
• rate used by the economic
planning office or Ministry of
Finance
• or estimate the rate
• or use 10%
• average C/E ratios
• substitute the upper and lower
values of uncertain variables
• affordability must be assessed
Discotmling
Presentation of results
Sensitivity analysis
Alfordabihty/suslainability
C E - cost.effectiveness; DALY = disability-adjusted life year.
• resource use associated with an
intervention - distinction
between capital and recurrent
costs,
• impact of immunization
programme
Primary health care & HIV
(Creese and Parker 1994;
Kumaranayake et al. 2000)
• resource use associated
intervention - distinction
between capital and recu
costs
• impact of HIV preventio
strategy
• joint costs for staff should be
• sources of cost data are:
allocated by either number of
government contracts: su
working days or percentage of
records from donors; loc
total time, for vehicles by mileage
estimates
• intermediate and final outcome
• methods for allocating jo
include: time used; distan
measures, e.g. number of children
• service outputs are prefe
prevented
outcome measures
• convert cost data into constant
• shadow prices for foreign
exchange and labour sho
(or real) prices
• use the official exchange rate to
used
convert items purchased from
overseas
• rate used by the economi
• rate used by the economic
planning office (or its equivalent)
planning office or Minist
. Finance
• or estimate the rate
• dr use World Bank rate
• average and marginal C/E ratios • average C/E ratios
• substitute the upper and
values of uncertain varia
• affordability must be ass
120
How to do (or not to do) . . .
lifc-ycais (DALYs). In practice, there has been a blurring of (he dis
tinctions between cost-effectiveness analysis and cost-utility analysis
and the latter can be seen as an extension of the former (Musgrove
Kassircr JP, Angell M. 1994. The Journal’s policy on cost-effective
ness analysis. New England Journal of Medicine 331: 669-70.
Kumaranayake L, Pcppcrall J. Goodman H, Mills A, Walker D.
2000. Costing guidelines for HIV/AlDS prevention strategies. A
I have excluded the family planning (Bratt and Janowilz 1994)
companion volume to 'Cost analysis in primary health care: A
blood transfusion services (WHO 1998) and tuberculosis control
training manual for programme managers’. London: Health
(WHO 1999) guidelines due to space. However, the main features of
Economics and Financing Programme. London School of
these guidelines arc similar to those summarized in Table 3.
I lygicnc and Tropical Medicine.
ft Cost-benefit analyses express outcomes (c.g. the number of
Little I, Mirrlees J. 1974. Project appraisal and planning for develop
lives saved) in terms of monetary units, therefore enabling inter
ing countries. New York: Basic Books.
sectoral comparisons, and hence, assessments of allocative effi
Marseille E, Kahn JG, Mmiro F et al. 1999. Cost effectiveness of
ciency.
single-dose nevirapine regimen for mothers and babies to
For further guidance on cost-benefit analysis sec Currv and
decrease vertical HIV-1 transmission in sub-Saharan Africa.
Weiss (1993), Dinwiddy and Teal (1996) and Perkins (1994).
Lancet 354: 803-9.
The icasons why market prices and shadow prices may not
Mason J, Drummond M. 1995. Reporting guidelines for economic
coincide include the existence of price and quantity controls, exter
studies. Health Economics 4: 85-94.
nalities and public goods.
Morrow RH, Bryant JH. 1995. Health Policy approaches to measur
ing and valuing human life: conceptual and ethical issues
References
>
American Journal of Public Health 85: 1356—60.
v Mumford et al. 1998. Reproductive health costs literature review,
Anand S, Hanson K. 1997. Disability-adjusted life vears: a critical
z The Policy Project, Working Paper Series No 3.
review. Journal of Health Economics 16: 685-702.
VMurray CJL, Evans DB, Acharya A, Baltusscn RMPM. 2CKX).
Baladi J, Menon D, Otten N. 1998. Use of economic evaluation
Development of WHO guidelines on generalised cost-effec
guidelines: 2 years’ experience in Canada. Health Economics 7
tiveness analysis. Health Economics 9: 235-51.
221-7.
Musgrove P. 2000. A critical review of ‘A Critical Review.’ Health
Barker C, Green A. 1996. Opening the debate on DALYs. Health
Policy and Planning 15: 110-5.
Policy and Planning 11:179-83.
Perkins F. 1994. Practical cost benefit analysis: basic concepts an '
Canadian Coordinating Office for Health Technology Assessment
applications. Melbourne: Macmillan.
(CCOHTA). 1994. Guidelines for Economic Evaluation of
I hillips M, Mills A, Dye C. 1993. Guidelines for cost-effectiveness
Pharmaceuticals: Canada. Ottawa: CCOHTA.
analysis of vector control. PEEM Secretariat. WHO/CWS/93.4.
Commonwealth Department of Health, Housing and Community
Geneva: WHO.
Services (CDHHCS). 1992. Guidelines for the Pharmaceutical
Russell LB, Gold MR, Siegel, Daniels N, Weinstein MC, for the
Industry on Preparation of Submissions to the Pharmaceutical
Panel on Cost-Effectiveness in Health and Medicine. 1996. The
Benefits Advisory Committee. Canberra: Australian Govern
role of cost-effectiveness analysis in health and medicine.
ment Publishing Service.
Journal of the American Medical Association 276: 1172-7.
Creese A, Parker D. 1994. Cost analysis in primary health care: A
Siegel JE, Weinstein MC, Russel; LB, Gold MR, for the Panel on
training manual for programme managers. Geneva: World
Cost-Effectiveness in Health and Medicine. 1996. Recommen
Health Organization.
dations for reporting cost-effectiveness analyses. Journal of the
Curry S, Weiss J. 1993. Project analysis in developing countries.
American Medical Association 276: 1339-41.
London: Macmillan.
Todaro MP. 1994. Economic Development. New York: Longman
Dmwiddy C, leal F. 1996. Principles of cost-benefit analysis for
Publishing.
developing dountries. Cambridge: Cambridge University Press
Udvarheiyi IS, Colditz GA, Rai A, Epstein AM. 1992.Cost-effec
Drummond MF, Jefferson TO, on behalf of the BMJ Economic
tiveness and cost-benefit analyses in the medical literature: are
Evaluation Working Party. 1996. Guideline for authors and
116 n238^44S being USed COrrCCtly? Annals of Internal Medicine
peer reviewers of economic submissions to the BMJ British
Medical Journal 313: 275-83.
United Nations Industrial Development Organization (UNIDO).
\Z Drummond M, O’Brien B, Stoddart G, Torrance G. 1997. Methods
1972. Guidelines for project evaluation. New York: United
for the economic evaluation of health care programmes. (2nd
Nations.
/
edn) Oxford: Oxford University Press.
Walker
D,
Fox-Rushby
J.
2000a.
Economic
evaluation
of com
Ehxhauser A, Luce BR, Taylor WR, Reblando J. 1993. Health care
municable disease interventions in developing countries: a criti
CBA/CEA: an update on the growth and composition of the
cal review of the literature. Health Economics (in press).
literature. Medical Care 31 (Suppl 7): JSl-11, JS18-149.
Walker D, Fox-Rushby J. 2000b. Economic evaluation of parasitic dis^^ZEhxhauser A, Halpern M, Schmier J, Luce BR. 1998. Health care
eases: a critique of the internal and external validity of published
CBA and CEA from 1991 to 1996: an updated bibliography.
studies. International Health and Tropical Medicine 5' 237-49
Medical Care 36 (Suppl 5): MS1-9, MS18-147.
Warner KE, Hutton RC. 1980. Cost-benefit and cost-effectiveness
Foster S, Godfrey-Faussett P, Porter J. 1997. Modelling the economic
analysis in health care: Growth and composition of the litera
benefits of tuberculosis preventive therapy for people with HI V
ture. Medical Care 18: 1069-84.
the example of Zambia. AIDS 11: 919-25.
Weinstein MC, Siegel JE, Gold MR. Kamlet MS. Russell LB. for the
Gerard K. 1992. Cost-utility in practice: a policy maker’s guide to the
Panel on Cost-Effectiveness in Health and Medicine. 1996
slate of the art. Health Policy 21: 249-79.
Recommendations of the Panel on Cost-Effectiveness in Health
Gold MR. Siegel JE, Russell LB, Weinstein MC (eds). 1996. Cost
and Medicine. Journal of the American Medical Association 276
effectiveness in health and medicine. New York: Oxford Uni1253-8.
z
versity Press.
WHO/Expandcd Programme on Immunization. 1979. Expanded Pro\- Goodman C Coleman P. Mills A. 1999. Cost-effectiveness of malaria
gramme on Immunization: Costing guidelines. EPI/GEN/79/5
m sub-Saharan Africa. Lancet 354- 378-85
Geneva: WHO.
Janowilz. B Bratt JI I. 1994. Methods for os,inn fan,,lv
.
WHO
1988. Estimating costs fot cost-effectiveness analysis: Guidevices. New York: UNFPA and FHI
mes for managers oj diarrhoeal diseases control programmes.
Jefferson T. Demicheli V. 1995. Are guidelines for peer-reviewinv
WHO/CDD/SER/88.3. Geneva: WHO.
economic evaluations necessary? A survey of current editorial
WHO. 1998. Safe blood and blood products: costing blood traiopractice. Health Economics 4: 383-8.
I us ion services. Geneva: WHO
1
H
t
doo( o noto to do)
w . . r.
the existing developing country guidelines fail to provide
much guidance beyond the estimation of process and inter
mediate outcome indicators. Nevertheless, the recent
HIV/AIDS guidelines by Kumaranayake et al. (2000) have
been written alongside the development of user-friendly
>■ models, for use by service organizations and policy-makers.
These models can be used to estimate the impact of various
HIV prevention strategies in terms of HIV infections averted.
It remains to be seen whether the forthcoming WHO econ
omic evaluation guidelines will provide additional guidance
in this area.
Unfortunately, existing capacity to perform economic evalu
ations within developing countries is low, hence the appli
cation of sophisticated sensitivity analysis techniques such as
probabilistic analysis, as recommended by the Canadian
guidelines, currently remains unrealistic in most settings.
Again, (his is reflected by the recommendation by most of the
developing country guidelines to perform univariate sensi
tivity analysis. However, as capacity in developing countries
increases, it is likely that guidelines will reflect this and be
modified accordingly.
I
(
I
119 •
■ •
; were instrumental in ensuring a minimum set of
guidelines
standards’. However, Walker and Fox-Rushby (2000a) found
that there was no difference between the quality of papers
that cited guidelines and those that did not, suggesting that
the use of guidelines per se does not result in better quality
papers.
*
Conclusions
This review has illustrated that the available guidelines for
cost and cost-effectiveness analyses differ in terms of the
target audience, objectives and. to a lesser extent, methods
recommended. For those interested in performing cost or
cost-effectiveness analyses in developing countries, the
choice of guidelines should be based on the objective of the
study, and as such the. disease-specific guidelines provide
most options and detailed guidance. They also explicitly
address the issues of shadow pricing and affordability, both
of which are particularly important in developing countries.
However, analysts should be aware of the limitations of
these, in particular with respect to the outcome measures
and sensitivity analysis techniques recommended.
Unfortunately, the collection of cost information is exp
Nevertheless, it is important to recognize that the needs of
sive, in terms of both physical and financial resources, anu
policy-makers differ. It may be that a full study with a
_t
,
it in a manner ^pt will be useful beyond a local
complex___
methodology
is required to answer
a question. collecting
On
the other hand, there is also a role for less complex studies if
setting is challenging. Therefore, perhaps a global standard
resources, the time available, or the information required are
costing methodology remains the ideal? However, using a
global standard is not necessarily feasible (Mumford et al.
in short supply. Indeed, preliminary studies could be per
1998). First, costing studies are driven by local information
formed at the early stages in the development of a health
needs and circumstances, and thus may not be designed to
technology in order to inform whether, for example, more
measure the same information. Secondly, sufficient
research is required. Therefore, it is important that economic
resources may not be available to meet international stan
studies are timely in relation to the decisions they seek to
dards, especially if a less comprehensive analysis or a differ
inform. Clearly though, the immediate task at hand is to
ent method satisfies the locally defined information needs.
assess and improve the efficiency of the health sector. Hence
Third, there is no universally accepted outcome measure for
the focus on cost-effectiveness and cost-utility analysis
comparing cost-effectiveness across health interventions,
evident in the guidelines reviewed here. However, it would
even though comparisons between interventions are desired
be useful if such studies could be constructed in such a way
to improve quasi-allocative efficiency. Researchers continue
that the evidence they produce can be used subsequently in
to debate the merits of disability-adjusted life years (Barker
inter-sectoral analyses. While the Canadian guidelines
and Green 1996; Anand and Hanson 1997), and other
(CCOHTA 1994) state that ‘Consistent with the desire to
measures and valuations of health outcomes, such as QALYs
permit broad comparisons, the expression of results in cost
and willingness-to-pay, all of which have their own practical
utility or cost-benefit terms is preferred’ (although recog
limitations and questions of validity (Morrow and Br’ »
nizing the difficult measurement issues particularly related to
1995). Nevertheless, WHO will shortly be releasing t. .
the latter analytic technique), the developing country guide
recommendations
for ‘generalized cost-effectiveness analy
lines provide no guidance on this matter. Again, we must
sis’. It remains to be seen what impact their approach will
wail to see whether the forthcoming WHO guidelines will
have on the quality and comparability of future coSt-effecaddress the link between intra and inter-sectoral analyses.
tiveness analyses.
All these guidelines reflect the desire to improve and stan
dardize the conduct of economic evaluations in order to
Endnotes
facilitate comparisons between studies. However, as to
whether guidelines improve the quality of economic evalu
1 An economic evaluation compares the ratio of costs and
ations, the available evidence is inconclusive. For example,
effects of at least two alternatives
2 Financial costs represent actual expenditure on goods and ser
that guidelines can help is evidenced by the findings of Baladi
vices purchased.
el al. (1998) who reviewed 12 completed studies that had
3 Economic costs include the additional estimated value of
been undertaken using (he Canadian guidelines (Canadian
goods or services for which there are no financial transactions or
Coordinating Office for Health Technology Assessment
when the price of the good docs not reflect the cost of using it pro
1994). The authors concluded that, •although studies have
ductively elsewhere.
4 Cost-utility analyses express outcomes in terms of utilities
been of variable quality, the majority of them were well pre
such as quality-adjusted lifc-ycars (QALYs) or disability-adjusted
sented. complete and transparent . . it appears that the
How to do (or not to do) . . .
WHO. 1999. Generic protocols for cost and cost-effectiveness analy
sis of TB diagnosis and treatment services. Geneva: WHO.
Zarnkc KB, Levine MA O’Brien BJ. 1997. Cost-bcnelit analyses in
the health-care literature: don’t judge a study by its label.
Journal of Clinical Epidemiology 50: 813-22.
Acknowledgements
I would like to acknowledge the help of Lcsong Contch, Lilani
Kumaranayakc, Anne Mills and Warren Stevens of the London
School of Hygiene and Tropical Medicine, and an anonymous
reviewer, for their helpful comments on an earlier draft of this
paper. Damian Walker is a member of the Health Economics and
121
Financing Programme, which is supported by funds from the UK
Department for International Development (DFID).
Biography
D Walker, MSc, is a Research Fellow in Health Economics in the
Health Economics and Financing Progtanime of the London School
ol Hygiene and Tropical Medicine, London, UK.
Correspondence-. Damian Walker, Health Economics and Financing
Programme, Health Policy Unit, London School of Hygiene and
Tropical Medicine, Keppel Street, London WC1E 7HT, UK. Email:
damian:walker@lshtm.ac.uk
i
I
I
I
1
/
F.P. C
COST-EFFICIENCY OF THE FAMILY WELFARE
PROGRAMME: CLINICS vs CAMPS
because they minimise time away
compared to a'longer hospital sta
makers may like to-know the cost
of health care through mass camp
DR. P. HANUMANTHA RAYAPPA’, MR. S. M. JOHNSON ”
and
MR. D. B. MANJESHWAR M
Introduction
Since independence efforts have been underway to fake primary health care
to the masses in rural areas in the country. The Alma Ata Declaration in 1978
propounded “... primary health care as essential health care to be made univer
sally accessible to individuals and families in the community through their full
participation and at a cost that the community and the country can afford to
maintain at every stage of development in the spirit of self reliance and self
determination ”.1 Several problems have been identified in the process of tak
ing health services to the rural areas and many suggestions have been put for
ward to improve these services and make them accessible to all the sections of
the community. And, it has been suggested that the existing infrastructure be
revamped to suit future needs.2 Since financial resources are limited it is im
portant to provide health care in a manner that maximises the benefits and
minimises the cost. In other words, the best health care delivery system is the
one which yields the maximum benefit at a certain cost or the one which gives
• a predetermined benefit at the least cost.
Because of advances in drug therapy and in technology many patients can
now receive health care without being hospitalised on a long-term basis. Stan
dards of medical practice are changing as well. Mahy types of surgery can now
be managed outside hospitals, in mass camps, specially set-up for the purpose.
Mass camps seem to have certain advantages over hospitals. Under-served areas
can be more effectively covered. That segment of the population which has lit
tle access to existing health care institutions because of poverty and ignorance
can also be reached. Moreover, mass camps can be used to relieve the pressure
on existing hospital facilities. The consumer (patient) may also prefer mass camps
’’ Professor, Population Research Centre, Institute for Social and economic Change,
Bangalore 560 072, India.
* Research Analysts, Population Research Centre, Institute for Social and Economic
Change, Bangalore 560 072, India.
56
1
For the purpose of illustratio
ing camps since such camps have
years. The camps are held at dist
health centres (PHCs) and health
the primary health centres, other g
organisations such as youth clubs
are of different sizes—large, med
rare, are of very large size such as
early seventies. However, most o
scale levels. In these camps, usu
conducted —vasectomy, tubectom
ried out in some of these camps.
The main objective of this stu
ing family planning services throu
ly, the kinds of clientele served in
ed into The quality of health care
are also considered. Since this is
to study the cost-efficiency of takin
tion, the results that have been pr
those provided merely for the pu
The limitation encountered in wo
1
Concepts in Cost Analysis:
Techniques such as cost-ben
cost-efficiency analysis can be use
maker in selecting the appropria
the following paragraphs we have
ed techniques.
(a) Cost-Benefit Analysis: is
aa service with the gain accruin
cost-benefit is mainly used to jus
action. It attempts to value all s
This method implies that the ben
sex labour productivity, etc., o
proved health increases happine
is rather difficult to translate su
58
F.P. CLI
THE JOURNAL OF FAMILY WELFARE
are incurred in the immediate future while benefits will accrue over a long period
of time. Also, it would be difficult to work out a satisfactory discount rate3.
Therefore, the difficulties associated with expressing benefits in money terms
seriously limit the significance of cost-benefit analysis for our purpose.
(b) Cost-Effectiveness Analysis: To get around the problems of a suitable
monetary measure of benefits, cost-effectiveness analysis is sometimes used.
While cost-benefit analysis and cost-effectiveness analysis measure inputs in the
same way i.e., in monetary terms they differ in their measurement of outcome
benefits. This method relates cost to the desired outcome or benefits in physical
terms such as increase in the acceptance rate of family planning services. In
this method either cost or effectiveness has to be kept constant while the dif
ferent options are considered and comparative evaluation is made to show which
one of the equally costly alternative policy actions is likely to be more effective
or least costly. Therefore, this technique cannot be applied until programme
objectives are spelt out in quantative terms for alternative strategies. 4*5
(c) Cost-Efficiency Analysis: is a method of comparing two or more enter
prises (say hospitals, health centres or camps) providing similar services or in
a single enterprise on different scales (large, medium or small) at different time
periods (short run or long run). In this method, physical outputs (number of
patients treated, number of operations performed, etc.) can be related to the
inputs measured in monetary units. Here, there is need to develop suitable work
measurement units and norms for measuring the physical quantum of work or
services rendered. The work measurement unit can be arrived at by relating the
volume of work input to the staff time measured in terms of man hours, man
days, etc. The method implies that the activities are performed with equal effi
ciency and economy. The efficiency can be expressed in terms of unit cost by
relating an unit of physical output of an activity to the cost of all the inputs
used in its production. 6 It can also be expressed as partial productivity of a
single input. For example, a unit of single input expended in the production
process can be related to the output it has generated.
Data Requirements:
In order to come up with cost estimates, the data requirements are many
and varied. Expenditures are incurred both by the providers of health services
and by the consumers. Overall health costs should also include opportunity costs
from both providers and consumers as also capital costs. The various com
ponents of costs are listed below:
A. Provider’s costs:
1. Fees for doctors, para-medical and other supportive staff, etc.
2. Rent, hire charges for building, equipment, etc.
3. Cost of materials like drugs
4. Incentive money for accepto
5. Transport, publicity and oth
B. Consumer's costs
1. Expenditures on transport fo
attendants, etc.
2. Expenditures on drugs, food
3. Other incidentals
C. Opportunity costs
1. Fees forgone by doctors and
otherwise treated patients w
2. Facilities which would have b
equipment, etc.)
3. Earnings/wages forgone by t
patient during the patient’s
Limitations of Data
For the purpose of illustration, d
tres of Karnataka State in 1985 hav
expenditures incurred for performin
non-laparoscopic, referred to hereaf
last one year. Besides, relevant infor
ceptors of these sterilisations were a
tubectomy and 298 laparoscopic ste
and 76 tubectomy and 121 laparosc
health centres. A few comments on
be in order here.
In the first place, the main diffi
spent which are not readily available
other departments of the governme
mobilisation of acceptors and the o
already vasectomy, tubectomy and
the same institution or camp, with th
costs. Under such circumstances it
different types of sterilisations. Ma
illiterate and incorrect reporting or
are other serious problems with the
60
F.P. CLINIC
THE JOURNAL OF FAMILY WELFARE
Secondly, it is rather difficult to impute values or norms for rent for the
buildings or site, salary for the doctors and other staff, and interest and deprecia
tion charges for capital equipment used. Some of the attributes of these inputs
are their indivisibility, alternative uses and retainable ownership.
Mass camps, to become viable, require more clients. Hence publicity and
promotional efforts are intensified and men with vehicles go to the countryside
scouring for potential acceptors. The result is that paid-out cost is borne by
several individuals and organisations. There is no denying the fact that the whole
government machinery is geared to mobilising clients for the camp and such
efforts are not always quantifiable in monetary terms. The officials we talked
to were emphatic that they campaigned for family planning in addition to and
along with their normal duties. Thus, we feel our estimates of paid-out costs
for mass camps can still be under-estimates while those of institutions can be
very close to the actual costs.
Next, the efficiency of mass camps and institutional care in terms of input
output relationships does not always lead to meaningful conclusions. Taking
the case of inputs, inter-personnel differences in skills always exist. Similarly,
the acceptors of services also differ in their characteristics.
Finally, we face some definitional difficulties. Usually, primary health cen
tres provide family planning services to eligible couples on demand. By and large,
sterilisation operations are performed at an interval of 8-10 days in the institu
tional premises and the number of cases operated upon on a single day averages
about 10. On the other hand, for camps, two or three PHCs combine together
and pool their resources of men and materials. Other government departments
also collaborate in this effort by lending their vehicles and staff and in collec
ting contributions and providing publicity. Therefore, at times the distinction
between institutional care and care at mass camps may not be very clear.
Cost-efficiency Estimates
At the outset, it should be stressed that these results are intended to be
illustrative and should be viewed as such. This being an exploratory study we
could not ascertain the money value for every input. Though we can theoretically
impute the money costs for these inputs, we have refrained from doing so since
we do not, at the moment, have precise norms for imputing values to these in
puts, like rent for buildings and camp sites, salary for the doctors and paraedical workers, interest and depreciation charges for equipment, etc.
For many of the divisible inputs we were able to collect data on cost. These
divisible input costs are directly paid-out by the health providers. On the basis
of information provided by them we have worked out paid-out unit cost. For
indivisible inputs like capital equipment and doctor’s services, whose money
value is difficult to apportion, partial productivity indices have been worked
i
out. Paid-dtu unit costs and partial pro
us some idea about the relative efficien
delivering health care.
It can be seen from Table-1 that ca
sive than institution-based sterilisation.
in a mass camp the health provider spen
tion and Rs.277/- if it is a laparoscopic
is done in the institution itself, the provi
it is tubectomy or laparoscopy. Mass c
parison to institutions if one is to go b
feature of mass camps is payment of h
or kind to the acceptors. Besides, the
on promotional efforts like publicity an
to acceptors and their companions. Mo
is not reached leading to a certain amo
result in an increase in per unit cost in
Yet mass camps fipd favour with
on retained costs as opposed to paid-out
tivity per unit of operation team effort o
times higher in mass camps. The avera
institutions by absolute standards and
institution, a team of doctors and para
7 tubectomy or 11 laparoscopic sterilisa
ed team performs 49 tubectomy or 75 l
operation day, one set of operation equ
sterilisations in institutions as against 25
tion, one set of equipment is used to p
against 38 in camps. The major reason
institutions seems to be lack of demand
tors’ services and capital equipment are
ly large mass camp will have optimum
will lead to economies of scale since th
a large volume of outputs namely the n
down the overall unit cost.
It is pertinent to note that camps
ceptors. Is it because of pooling of all
at one place and at one point of time
compensation offered to acceptors in
of services or the festive atmosphere, w
Or could it be that institutions and cam
with different elasticity of demand fo
no real conflict between the two mod
I
' 62
THE JOURNAL OF FAMILY WELFARE
F.P. CLINIC vs. CAM
TABLE 1
TABLE 2
Paid-out cost per sterilisation
Items of Expenditure
1. Cash incentives paid to acceptors
inclusive of travel and dietary
allowances
2. Cash incentives to motivators
3. Remuneration to surgeons and
anaesthetists
4. Remuneration ot operation
theatre assistants and attendants
5. Karnataka State Lottery tickets
to acceptors
6. Cost for drugs and dressing
material
7. Contingency towards soap, can
dle, oil, electric bulbs, O.T.,
chappals, etc.
8. Gift of utensils to acceptors
9. Cost of food articles bought for
feeding the acceptors and their
companions
10. Cost of petrol, oil and lubricant
for the Govt, vehicles pressed in
to service
Selected characteristics of
Institution
Mass camps
Tubectomy Laparoscopy
Tubectomy Laparoscopy
Institution
155.00
15.00
155.00
15.00
155.00
15.00
155.00
15.00
7.00
7.00
7.00
7.00
2.00
2.00
2.00
2.00
5.00
5.00
5.00
5.00
25.00
25.00
25.00
25.00
5.00
5.00
5.50
55.88
7.85
37.65
Characteristics
of acceptors
Tubecttomy
La
1 (L3)
70 (92.1)
5 (6.6)
0 (0.0)
76 (100.0)
2
94
25 (
0(
121 (1
68 (89.5)
8 (10.5)
0 (0.0)
0 (0.0)
76 (100.0)
54 (
33
13 (
13 (
121 (1
40 (52.6)
20 (26.3)
16 (21.1)
0 (0.0)
76 (100.0)
74 (
19 (
17 (
H
121 (1
17 (22.4)
20 (26.3)
39 (51.3)
76 (100.0)
19 (
64 (
38 (
121 (1
Wife’s Age :
Less than 20
20 - 29
30 & above
Not stated
Total
Age of last child :
< 29 days
1 month—12 months
Over 12 months
Not stated
Total
Husband’s education :
34.56
8.88
6.19
13.33
Total paid^Dut unit cost
214.00
214.00
311.13
276.71
Number of cases operated upon
76
121
97
298
vider’s main objective is to reach as many clients as possible at a minimal cost.
Answers to these questions will help him decide, the total number of clients
he can reach, how many clients he must reach from different
clienteles and at what cost, so as to minimise the overall unit cost. Paucity of
data prevents us from taking care of all these related issues. We have, however,
tried to answer some of these questions with whatever data we have at our
disposal.
Table 2 classifies the clientele of mass camps and institutions, by the age
of the acceptor, by age of the last child, husband’s education and place of
residence. The first panel in the table shows the age distribution of sterilised
women. The acceptors in institutions are younger than those in camps; 93 per
. liberate
Upto VII Std.
Above Vll Std.
Not stated
Total
Geographical
accessibility
Head quarters
Roadside villages
Interior villages
Total
Note : Figures in the parentheses refer to corresponding
cent of the acceptors of tubectomy and 79
laparoscopy in institutions were less than 30
constituted only 87 and 60 per cent respectiv
The third panel in Table 2 sets out the dist
cording to their husband’s educational attainm
education as a proxy for the socio-economic s
64
THE JOURNAL Of- FAMILY We LFAk E
perhaps offer s< *ces of a better q
mass camps are L^re efficient by en
capital equipment. While mass cam
families with little access to existing
by voluntary and early acceptors an
easily accessible places. The clientele
that of institutions. It is likely that
for family planning services. All the
planning services and they may as w
can be dispensed with, on an out-p
mised women and 14
stitutions, about 21 per cent of the husbands of tutn
per cent of those of laparoscopied women had studied beyond VII standard.
In the camps, the respective proportions were only 14 per cent and 12 per cent.
The last panel of Table 2 indicates the geographical accessibility of the ac
ceptor’s residence to the place where the services were delivered. It shows that
49 per cent of the tubectomy acceptors in institutions, came from the same place
where the institution is located or from a place connected by road. In the case
of laparoscopy, 69 per cent of the institutional acceptors came from such places.
In contrast, in mass camps, only 42 per cent of the acceptors of tubectomy and
41 per cent of those of laparoscopy came from such places. Most of the accep- *■
tors in mass camps came from interior villages.
There appears to be some consistency in these patterns which sets apart
institution seekers from mass camp acceptors. While mass camps cater to’reluctant acceptors, from economically weaker sections, with little access to existing
health centres, institutions are preferred by voluntary and early acceptors from
relatively better-off families, living closer to the delivery points. However, it
should be noted that institutions may have some advantages of their own. The
second panel of Table 2 shows the age distribution of the youngest living child
of the acceptor. In the institutions, 90 per cent of the acceptors of tubectomy
and 45 per cent of the acceptors of laparoscopy had their youngest living child
aged less than one month. In the mass camps, the corresponding percentages
were only 61 and 15. This indicates that in institution-based health delivery,
tnothers need not wait long if they desire to have sterilisation immediatelyafter
child birth. It would be difficult to deliver such services in mass camps as and
when they are desired by the acceptor. The point is that institutions and mass
camps cater to dissimilar clienteles.
Another related issue is the quality of services provided by institutions and
mass camps. A change in favour of mass camps may lead to a gain in output
and possibly a decrease in overall unit cost through economies of scale. This
gain in output, may however, involve some loss in quality. Thus, there may
be a conflict between the two objectives of quality and quantity. The possible
indicators of quality of service can be: adhering to the guidelines of decent health
care, pre-operation and post-operation care, efficacy of treatment (inclusive of
post-operative complications or death). These aspects can be better understood
by undertaking a follow-up study of acceptors. The choice then between the
two objectives depends on the weights assigned to them on the one hand and
the trade-off between the two on the other.
Concluding Observations:
To recapitulate, our main findings are that institutions with fixed location
and daily functioning are efficient in economising divisible inputs and can
i
It is common knowledge that
in rural areas. Hospitals and clinics
cities, are beyond the reach of the ru
hospitals in rural areas since many o
population to keep the hospital g
threshold population is reached wi
hospitals would be advantageous.
mode of health care delivery would
need not be a conflict between the tw
other.
The data available to us being
ploratory. No firm conclusion could
be obtained by combining the two
about the ideal size of a mass cam
tified data requirements and limita
critical examination. Also, there is
ing to travel to avail himself of a g
minimum population necessary to s
precise norms for pricing several
equipments, buildings, or standard
so forth. Only a well-designed, suff
required data for making an in-de
R
I
?
1.
Bose, A. and Desai, P. B. : Studies in
Publishing Corporation (India), Delhi.
Government of India : Report of the Wor
and Family Welfare, New Delhi (1981).
Hauser, M. M. : The Economics of Med
Reynolds, J. and Gaspari, K. C. : Cost(1985), Primary Health Care Operations
Bogue J. C.: Cost-Effectiveness Analysis o
Study Centre, University of Chicago, C
Feldstein, M. S. : Economic Analysis for
6.
National Health Service (1967), North H
3.
4.
F
HEALTH ECONOMICS/HEALTH FINANCING
(INDIA)
1 .
1990.
DAVE, Priti Comp..
F _____
i n a n c i n.. g the
A Report o n Fh e__N_a_.t yon a 1 W o rk s h o 2_on Hea 11 h_ 1
Volunt a r y S e ctor. _a_y_hiFdf 1 p we.-C_ HajXu S h i m Fa Nay "1 - -1’;. 19^c i
New Delhi, Voluntary Health Associat ion o f India an d
The Ford Foundation. (Acc No. 1790)
9
DUGGAL, Ravi and AMIN, Suchetha.
1989.
2t .
Cost of Hsalth_Care-A Household Survey in an Indian Di S “
Bo m b a y , "F ounda t ion for Research Tn Communi t y He a 11 h . ( A c c To-2030 )
1993.
DUGGAL, Ravi.
E mp1o y e e Medic_aX_ B_e n e_f_i.t s m the. Corporate Sector,
B o mETa y , Foundation for Research in Community Health.
f
1992.
DUGGAL, Ravi et al.
.11 a t e S e c t o r Hea 1 th E xpenditures .
B o mbay , Founda t Ud n fdjr R e s e a r ch i n Community Health.
5 .
GILL, S o n v a. Ed. 1987.
_
A SupplementaryH e al. th_Sta t u_s pF t h e Ijid i a n Ppo_p_le.
Document s_._t oZHeaTt h Forfll— A~n A11 e r n a 11 v e S t rates y
CAcc No . 1T16TBombay, FRCH and ICMR.
6 .
KHAN, M.E. AND PRASAD, C.V.S. 1 98 5 .
Hf a 1 jyh _F i na n r i ng_. in Indi aj .A c.a s e st u d y of Guiarat
an d Naha ras ht_ra .
( A c c No . 3668 )
Baroda, Operations Research Group.
7 ,
PHADKE, Anant.
1994.
The P r i v a t e M e d i c a 1 Sp <? t or in In dya
' o m b a v , The FouncTation for Research
P .
9 e
in
C ommunit
’HE FORD FOUNDATION . 1990
. h e_ C o s t_s _and—Linane ing of ...Health Care .
: JT h e_ \ o fun t a r y Health Services,
Sasg
No. 1971)
(Acc
N e w Delhi.
\
THE' FORD FOUNDATION
1990
T h e c_p sts a n d Finan c i ng of
t py^-rZSWAZ-R JraTZ
New Delhi.
( A c c N oT
F7 8 4 E
Heal
(Ace
.•o .
5 105)
. o .
227 3 )
r 350
Madras ■
Health Care
Jhagadia
10 .
THE FORD FOUNDATION..1990
Th.e_co_«Lts and Financing of Health Care
Ca_se__Studjy 3: Parivar
P a r i v a r Seva S a n s t h a , New De 1. hi ‘
T No
No.. 1' 9 73T’
N ew Delhi. -(Acc
1 1 .
T^E FORD FOUNDATION. 1990
T h e costs an d___ F i na n c in g of Health Care
Fasel Study^a.: J s h i_s h G.r a,m R a c h n a Trus. Ll Pa c hod
(Acc No. 1 9 d d )
New Delhi.
12 .
VENKATESWARA RAO.
1990.
LUU3 Dring of Health c a re - The Experience of Vo .1 u n t a r ” FTea I th S_e_rv ices".
Cork shop on Heafth Care Financing organised b y V o 1 u n ~ar"
H • • a 1th Association of India Ford F o und a t i on at Simla Bet e t n
No . 4559)
1st and 4th May 1990.
(Acc No.
■
r
(Ltrfrl-'Ya
Aime
Chapter 11
LcLty
Gic'U
)
(l
hit) ■ l't1
C C H HHEALTH SECTOR FINANCE AND EXPENDITURE
1.
Health Sector Financing Problems
The urgency of the need for information about health sector financing
and expenditure in developing countries arises out of the current
problems of the health sector, Despite the optimism of the late 1970s
and the Alma Ata declaration on Primary Health Care, the 1imited
improvements in health status that had been achieved have now been
undermined by the world economic crisis of the late 1970s and 1980s. The
health needs of many within developing countries and, particularly, the
rural and urban poor populations, remain unmet. Infant mortality rates
remain high in most developing countries and 80% of the world's
population has no access to any permanent form of health care.
The inadequacy of funds in any country is a mix of absolute deficiencies
(resource shortages) and relative deficiencies (inefficient use of
resources). Resource use inefficiencies may take the form of inefficient
manpower
use
(because
functions
are
not
clearly
defined)
or
inappropriate use of technologies (such as capital-intensive methods of
health facility construction). The maldistribution of available
resources
is
also
an aspect
of
inefficiency.
Health systems
in
developing countries are generally dominated by urban (hospital) care,
leaving only limited funding for rural facilities and primary health
care.
In many systems,
especially those with social security schemes,
resource distribution favours the more wealthy (employed and insured);
and in most systems it is likely that the poorest have worst access to,
and lower utilization of, health care. Finally, problems are caused by
the lack of co-ordination between the sources of health finance and
health care (such as government, private, foreign), and between the
various providers of care (public, private, different levels of the
system). The result may be inadequate service provision or wasteful
duplication. Management weaknesses underlie these problems.
98
» iitiiTriiiiinn i
4
Resource shortages have been iexacerbated by rising costs within the
health sector due to increased utilization rates (in some countries),
rising expectations - especially for the adoption of new and expensive
and an increasing proportion of elderly within the
technology,
population (particularly in the more developed countries of Latin
America and the Caribbean). Often incentives for cost-containment do not
exist to temper the impact of these changes on resource use.
The lack of information about health sector financing and expenditure in
many countries has undermined appropriate decision-making. The problems
of studying financing and expenditure patterns in the health sector
include:
a tendency to regard the health sector cz
as synonymous with health
services and to ignore expenditures outside
main1 government health
-- ---agencies (i.e. a conceptual/definitional problem)
bureaucratic reluctance to encroach on the organizational
territory of co-providers of finance and services (unless formally
instructed to)
the independence of decision making enjoyed by many providers,
which takes priority over the need to coordinate and integrate
health policy.
The problems, however, are now sufficiently great to encourage more
appropriate information collection, and a common methodology for
obtaining the information is emerging.
2.
Why Study Health Finance and Expenditure?
Studies of health sector finance and expenditure generally have two main
purposes,
related to the health sector’s problems: to investigate the
efficiency of the health sector and to provide information for financial
planning.
In practical terms, the information can be valuable for:
identifying who benefits from services and so clarifying the
impact of present policies on equity
identifying who gets what (i.e. the geographical, age, gender,
ethnic and socio-economic distribution) and determining whether
this is in line with policies
99
current patterns of f’
financing and expenditure and
encouraging discussi
so
-on of alternative sources
-J
of finance
identifying
resource deficiencies through
clarification
’ ■ nrJl^t
services produced
employed in their
and the resources
—- production
facilitating the
co ordination of various
funding agencies and
spending bodies
analysing resource deployment and
identifying the
for re-deployment
possibilities
financing and
3.
Steps in a Health Sector
expenditure patterns
finance and Expenditure Survey
There are four basic
steps in assessing health
sector finance and
expenditure:
define the health sector
describe the scope and objectives
of the survey
collect and tabulate the data
present the results.
3.1
Definition of the health sector
The precise definition of what
services and activities
: comprise the
necessary to guide data collection and, ,
especially, to
make comparisons of health
systems across countries
°r at different
times.
health sector is
The following pairs
of items show the difficulty of
drawing a line
between aspects of the health
s ector/non-hea1th sector,
Which should be
included within the definition
of the health sector?
hospitals; social welfare institutions
education and training;
•g. water, sanitation,
safety etc.)
pure medical research
medical social work; social work
formally trained medical
practitioners.
practitioners;
100
traditional
medical
I
In practice, the limit of the health sector varies considerably between
countries and different definitions have been developed for different
purposes.
In developing countries, the definition tends to be broader
than in developed countries because,
for
example,
of
greater
deficiencies in certain areas (e.g. environmental health) and extensive
use of the traditional health sector. A useful rule of thumb is to
include all finance/expenditure whose primary intention (regardless of
effect) is to improve health.
Surveys
often
specifically seek to
identify primary health
care
expenditures, and so require a definition of ’primary health care’
(PHC). This encounters the same problems as those of defining the health
sector (i.e. where to draw the line between health and non-health
activities). In addition, it may be inappropriate to include all of the
commonly accepted health expenditures as being PHC: To what extent is
hospital care primary health care? To what extent do support services
such as laboratories undertake PHC? Of course, each level of the health
system supports the others but there are distinctions between types and
levels of care. The common practice is to identify a ’PHC factor’ which
can be applied to the total within each category of expenditure. Thus,
0.2 might be the factor for secondary services which provide clear
support to the primary level, but 0 might be the factor for tertiary
facilities. To apply such factors it is important to identify the range
of services provided within facilities or at different levels of the
health system. The factors, clearly, represent only an approximation of
PHC expenditure; it is difficult to capture the expenditure implication
of facets of PHC such as decentralization and community participation.
As it is unlikely that uniform definitions of the health sector or of
primary health care will ever emerge,
it is necessary to describe
clearly what has been included and excluded,
definition adopted.
3.2
and to justify the
Scope and objectives of survey
The scope and objectives of the survey clearly have to be set within the
context in which it is undertaken - reflecting the needs and priorities
of the specific country,
and the feasibility of data collection.
The
common questions tackled by such Purveys include: What is the total
101
K
expenditure on the health sector? What are its sources? How much does
each source provide? On what/who is it spent?
It is important first to clarify whether the emphasis is on financing or
expenditure or both, and whether it is to be a full or partial review of
sources of finance/items of expenditure.
The range of sources that might be investigated includes: ministry of
health,
other ministries,
missions,
industry,
local
other state bodies,
government,
local voluntary bodies, direct household payments,
insurance, self-help, foreign aid (official and private).
Expenditure categories might include: national hospitals, general
hospitals, specialized hospitals, health centres, community-based care,
private practitioners,
research.
3.3
drug sellers,
sanitation,
nutrition,
training,
Data collection and tabulation
A variety of data collection methods will be necessary - both because of
the different sources of information and to allow for some cross
checking
of
results.
questionnaires,
and
They
include
routine
accounts/budget
interviews with health care providers.
data,
It can be
especially difficult to obtain information about expenditure on private
health care,
including traditional care, and information should be
sought from many sources including providers, users and tax records.
The data should be tabulated as they are collected; particular care
should be taken to guard against double-counting and to record income
and expenditure against the appropriate source. For example, government
subventions to mission facilities could be recorded against government
expenditure or against mission expenditure - but the original source is
government and the subvention should be recorded on its account when the
survey’s purpose is to identify the sources of finance. At the same time
it is useful to know who controls how much money, and so in some cases
it may be appropriate to record the subvention on the mission account.
formally, sources of finance are defined as above to be government
ministries, missions, insurance agencies etc.
In some surveys it might
102
be possible,
or relevant to identify the original sources of finance
e.g. for government expenditure, the amount originating from taxes (on
households, businesses etc.), from borrowing (foreign governments) etc.
This is particularly important when there is concern over the equity of
financing and expenditure patterns (i.e. who pays, who gets care).
3.4
Presentation of data
The data should be presented clearly,
in a form that reflects the
survey’s objectives and permits relevant decisions to be made. A number
of different breakdowns are possible:
recurrent, capital and total expenditure
expenditure by line item
expenditure by source of finance
primary health care expenditure by source and by line item.
Information about population groups served can be disaggregated by: age,
geographical distribution (i.e. urban/rural), insured/uninsured ,
socioeconomic (income) levels. Similarly, information about the types of
health service provided can be disaggregated by: preventive/curative,
ambulatory /hospital, primary/secondary/tertiary.
The data can also be used as the basis of other calculations which might
add to the survey’s usefulness e.g. unit costs (per inpatient day, per
outpatient visit), proportion of budget actually spent. Expenditure on
programmes or disease categories prevented/treated can be calculated in
order to compare expenditure patterns with health objectives and plans,
and to monitor the achievement of plans.
4.
Results of Health Sector Financing and Expenditure Surveys
The results of surveys that have been undertaken make it more possible
to compare health services at different times and across international
boundaries. They have provided an impetus to further studies and to
refinement of the methods,
have contributed towards developing an
overall system of national health accounts and have shown that surveys
can be undertaken relatively quickly and cheaply.
Studies show that sector finance is contributed by more sources than
previously imagined and
comprises a higher percentage of national
103
>
’’
income than hitherto 1believed
(e.g. 9.8% of GDP in Swaziland). The role
of government financing withini the sector as
a whole, however, remains
significant. In Sri Lanka 86.0% of sector recurrent expenditure was
sector recurrent
provided from government revenues,
in Togo 52.4% and in Swaziland 30.22>
Household expenditure on health
care
cxaueu activities may
---- and
-- health-related
be a high proportion of total recurrent expenditure within the health
recurrent expenditure within the
sector: in Swaziland it represented
of the
32.4% of
the total,
represented 32.4%
total, in Malawi 31.5%
and in Togo 27.8%. In Sri Lanka the wide availability of government
health care and limited use of private care resulted in household health
expenditures representing only about 3% of sector recurrent expenditure.
Foreign aid may also be important: in Swaziland it financed 20.8% of the
sector’s total recurrent expenaiture and in Togo 13.2 %.
Other information obtained through such surveys includes:
the importance
care in Swaziland (and the lack of
government financial backing for its stated policy of PHC), the unequal
of foreign aid to primary health
rural/urban allocation of resources in Malawi and
racial allocation of resources in Zimbabwe,
Sri Lanka, the unequal
•
the dominance of curative
and hospital care within health expenditure
> and the significance of
private care within the sector (e.
g. traditional healers in Swaziland).
104
‘ CLg r \ v A
TRAINING PROGRAMME FOR
STAFF OF DEVELOPMENTAL INSTITUTIONS
1995-96
(Supported by Directorate of Woman & Child Development Govt, of Karnataka )
"J
CzkVd' I
C5V7
UB
GV
j
S
7^^
W^Tko^uArk^^^
_
62^/^
/4
PLa Io Ac
c J-^j
C ^-'i.C-4'O J
Aie-xC- <r I
O
c
/liL.
J
DC
J,
•— c?k^ SrK^-^o>7
e-'f
<’
Pc
’3
/V
- S'Cr^<
?
J•
l)
i
*
c^x
cry k<£ /-Y c-
(5^is c -<p
7^
_
c-j fk,
v^L’vlG
/b
—4<tc >
fy
A
o o tfc^L
vi a^-^i
— Cc^t>v T^'^C-C i€ 'C
- Sc>o4o
— _L. -^
.— N'd
e
K<^>
— C. kt c vk^-\j
c{
g
Organised by : National Institute of Mental Health
Neuro Sciences.
/
Post Bag No ; 2900, Bangalore-560 029c Sr
<Z.<L
l rCJ^O
, ,
a
)
TRAINING PROGRAMME FOR
STAFF OF DEVELOPMENTAL INSTITUTIONS
1995-96
(Supported by Directorate of Woman & Child Development Govt, of Karnataka )
I f -Z^7 e|(
y
C^s-'J
—
- - - P)
C-1 C' 1^)
l< <z2-
CTJOV^^^7^
rg>rise?
A
—
y^J/Lc-ry^ ^-J^>
<-^k-A.e I - tvj
tSc
a( ^e^v-zselj
““
O-^> <?‘^ I/'
Zr
r>e3lzVv <c '-'^ •
rxsrb^
-3^'J
<
x cl--T er Jo i L < j
—■
<SpV^VC42
b-j
4
b -]
-^>>
sJC
4/
Cxy^y^Uj
-y^ < ce
^rx^Gx/lcLe-M^
h crvK M <i<7
oy^st^vl-
ll^
G^pp^
Jz-
<^_
//
ttTY
irxQcj^i^u
p
“^C .U^t<
rry c^-
Organised by : National Institute of Mental Health & Neuro Sciences.
Post Bag No : 2900, Bangalore-560 029.
TRAIN8NG PROGRAMME FOR
STAFF OF DEVELOPMENTAL INSTITUTIONS
1995-96
(Supported by Directorate of Woman & Child Development Govt, of Karnataka )
C
!4ec)>L
(=^<-
Pfe
?2aocrL--<ce x i
£3nkp«-<lo~
rsf^etLzjjfobj e?cK
,'^’cL*-^^
'CS->
I
4
p-»^e: I
c<
c co
ve. c P
>e-(
Organised by : National Institute of Mental Health & Neuro Sciences.
Post Bag No : 2900, Bangalore-560 029.
p<- VLs-a-, V
TRAINING PROGRAMME FOR
STAFF OF DEVELOPMENTAL INSTITUTIONS
1995-96
(Supported by Directorate of Woman & Child Development Govt, of Karnataka )
I
»t Lr L'O
I
yt >-/
-y /+e ' (£-
v>
Ff
A
Cf
F?s Ul^-oC^
X' cr
t
b
(
i-C,<3^Ve5lc--3
<^>C5
Um ?
Uj
Cn i
'j
.
L>1^
32- k?>^\
Organised by : National Institute of Mental Health & Neuro Sciences.
Post Bag No : 2900, Bangalore-560 029.
)
TRAINING PROGRAMME FOR
STAFF OF DEVELOPMENTAL INSTITUTIONS
1995-96
(Supported by Directorate of Woman & Child Development Govt, of Karnataka )
?^1ctx 7 p-^LcuJt'ij
(XI <^- > eV C^p
C
Z^ve^
PC>Y^
c±vz^Lt_xeKL/X-*
ta
* 5’ bopkL<vn^
• cx^o-tep^r
r^o/fck ^1"
e PlcT^nppP^^
^TLX^l /
C^VC <c
I'e^- nnaz-^Y^y P'^'L o
4BX>L
}
n
eU
keSC^r^L
21
6rznx
f)pp) ^C^Y'
(^cA'Lc^^e
Oc-^k^ 4
I il*C|
H
Kc’>rt^>
n^k pv^-
k11(^>
VneAr^l^
pZe-zk?i
P>r txy^>^
pr*ayvo(tfV>
M H- 6^<nv
j
ryxc^.
/^-ec£—
I
C_^icA
>j t**-JO K
cn' V J
V
C^73
C.^c^
n
Cc^>
v
^^2-^
r XC^v'-V t V^flxua----- »
Organised by : National Institute Of Men/al Health & Neuro Sciences^^
Post Bag No : 2900, Bangalore-560 029.
z'—xsCk^o/^^
«
*
•
TRAINING PROGRAMME FOR
STAFF OF DEVELOPMENTAL INSTITUTIONS
1995-96
(Supported by Directorate of Woman & Child Development Govt, of Karnataka )
cc^T-><^'r>—Cc^
v
ics>r>
C-X
<3 D L
)■
LU toQO L-
3
JI
LxZlkVGj
ty.
la
L-^
et
Qol
C^s ^l[^
_'C_ Ess, erXzO^^K<ro
df
1- _Z^
i^Lt^v^S-zT^y. Cvn cl
zyv^/^C^Col^^y
^CJKX<-^ -lo
.V
chi/
oJt C'ZO ~~
OI
At
Axeicx-
<^rts Co
L <^L
/L CT*x~->
cj'')
—,
>J ex, C ‘J~’ LO
— C^ZJ-^.___ Xr.-.^
1
I
. k&
*{lpt '
or>C<> [ C-’S^VG)^(/Ce-Cx't Ge_-a V<5 tc*-^
a _Sg^1 hvjk|
a^tcty^U) pex,p^-^cx
Organised by : Nationallnstitute of Mental Health & Neuro Sciences.
— P/d. yVG pA<so-^x?
^C-Uxaf
C^ 'O
felLj
^Cs- p
^°s’
ell
X Ce^T^—7
L->e^^
/o-^x?
TRAINING PROGRAMME FOR
STAFF OF DEVELOPMENTAL INSTITUTIONS
1995-96
(Supported by Directorate of Woman & Child Development Govt, of Karnataka )
cr<?
—)
I .
^0rCz> I
Kq A?z ^-7
F\lo< ff-y J ^XJ\, //
frxyyz. ['‘-‘^
/U
I rZ
k^ov-j
T
3
UU~>^-A
X ^~) l/^^i^ck>,
Co 5
&V t
m ©->-&-
SpUv^
* »• ’
f~r\{C^ c^C^p j
t
t
Ch^c
Organised by : National Institute of Mental Health & Neuro Sciences.
Post Bag No : 2900, Bangalore-560 029.
TRAINING PROGRAMME FOR
STAFF OF DEVELOPMENTAL INSTITUTIONS
1995-96
(Supported by Directorate of Woman & Child Development Govt, of Karnataka )
t*
p Lc
Organised by : National institute of Mental Health & Neuro Sciences.
Post Bag No : 2900, Bangalore-560 029.
TRAINING PROGRAMME FOR
STAFF OF DEVELOPMENTAL INSTITUTIONS
1995-96
< Supported by Directorate o W
f & Child o
Development
m Govt, of Karnataka
a
)n
cd
Poke
Chart
__ -
7
■^fc^-eHpL2- >zx1
5
Organised by : National Institute of Mental Health & Neuro Science®.
P
Bag Noo : 2900, sBangalore-560
t
029.
S|l-W I O>
TRAINING PROGRAMME FOR
STAFF OF DEVELOPMENTAL INSTITUTIONS
1995-96
& Child o
Development
m Govt, of Karnataka
a
)n
(Supported by Directorate of W
lc]tl
[
♦ P^blCcjP// n<xX co
/ . P il JTCzs X Vlf
Ul 4*-O
—
J
yjrvu-^-xe-—cFFrje-^
ya
C^f
. y7>-
^HkZo*)
I
j
f
f~>^c
'
v
S-ezu_cr>^9
^^crr^--
/VtuS-otc-V <-— -
e.^.1^ fc*
e,f
@
.—
Organised b
.<^1'4
C^-CCs^T^
y
Institute of Mental Health & N
: National
P
Bag Noo : 2900, sBangalore-560
t
029.
La J/1 I f 'ZcJ^c
S
e
c
u
i
er
o n
c
TRAINING PROGRAMME FOR
STAFF OF DEVELOPMENTAL INSTITUTIONS
1995-96
(Supported by Directorate of Woman & Child Development Govt, of Karnataka )
t^'7 O c
<s^l-cQ
cTVo^C
7-
5o
c
n
u
D
^v'crwoccso
P<Y e
7Z k?)e(
?/^U
I
7
z
<-1
.
I- PLjol-c,
7)
u
<^.C5LX_y
-b
[s
p pr k'
Organised by : National Institute of Mental Health & Neuro Sciences.
Post Bag No : 2900, Bangalore-560 029.
a-
\
TRAINING PROGRAMME FOR
STAFF OF DEVELOPMENTAL INSTITUTIONS
1995-96
(Supported by Directorate of Woman & Child Development Govt, of Karnataka )
<^1
-J
P^
‘A.
2
v
(Lxlesr^etc»~l CL;
7
Hts
-h^
5^
e-j^CxX^I' jZf^CclP- ■
x^aiLccL^L
Pyv
7
?Y-<
3
p2 [/ccno
C^cVe^
C<2^
Athlo^
i
Organised by : National Institute of Mental Health & Neuro Sciences.
Post Bag No : 2900, Bangalore-560 029.
^-f>
/^et
t>->y^.ur-tC^
<S |'-L ( «r>
TRAINING PROGRAMME FOR
STAFF OF DEVELOPMENTAL INSTITUTIONS
1995-96
(Supported by Directorate of Woman <fc Child Development Govt, of Karnataka )
£
3
r^oAxc-er
A-» .e-—
ricslc: I 4^ <L
cf sz
U
4r
<J
u. -t
>V -•
+3-
&24xrz>lc^
■(
\q
■
‘zpy-r&
^7
^-€—-5
Pk
Organised by : National Institute of Mental Health & Neuro Sciences.
Post Bag No : 2900, Bangalore-560 029.
r
''
Go nA H ' r2—
Purpose
People’s health and economic
development: policies f global
o
healthrand
struggles for economic justice and the right
to health
• To explore the links between global
health inequalities and the unfair
and unstable regime o global f
economic governance
• To highlight some implications for
strategy f global
o
healthractivists
and directions for policy
David Legge
La Trobe University, Melbourne and
People’s Health Movement (Australia)
Events, Reports, Struggles (1944-88)
Method
• Review some key reports, episodes and
struggles in global health and economic
regulation since WW2
• Trace some of the interplay between
health issues and the w
debatesi andd
struggles regarding economic regulation
• Pull some themes from this review which
might inform the practice o health activists
f
A brief digression some economic history
• 1945-1975 - the‘long boom’
• 1975 + looming threat of
over-production (post Fordist
crisis)
•
•
•
•
e
•
•
•
•
•
•
•
•
•
1944: Bretton Woods (IMF, WB, GATT)
1950s: Health development policy: DDT, doctors and hospitals,
population control
1955: Bandung Conference and birth of the Non-Aligned
Movement (more confident TW voice)
1964: UNCTAD 1 (and G77) leads to call for New International
Economic Order in May 1974
1973: First OPEC price rise
1978: Alma-Ata Declaration (PHC, reference to NIEO)
1975-80: Onset of stagflation, end of the long boom, emergence of
r
monetarism
1981: escalating interest rates, debt trap sprung
1981: ‘Selective PHC (the response to Alma-Ata)
mid 1980s onwards: IMF develops and imposes SAPs
mid to late 1980s: rise of AIDS/HIV
1987: ‘Adjustment with a Human Face'
1989: Break up of the Soviet Union
The long boom (1945-1975)
• The post-WW2 environment
- need for reconstruction (huge demand)
- increasing productivity (motor vehicles and cheap oil)
• The boom
- new technology, capital and labour brought together
to make things and services that people need and are
able to pay for
- increasing productivity frees up labour to make new
things and to recycle wages as consumption
- some 'trickle down' to the poor and to the Third World
1
The threat of ‘over-production’ (and
‘post-Fordist crisis)
The ‘crisis of over-production’
(Post-Fordist crisis)
• Where expanding productivity (with
stagnating employment growth) exceeds
‘demand’ (because of stagnant
purchasing capacity)
• Threat of overproduction limits the
possibilities for growth and development
• Expanding (capital intensive) productive
capacity faces stagnant demand
- saturated markets and/or
- markets with real needs but limited purchasing
capacity
• Understood in the corporate world in terms of
reduced profitability
• Understood in the policy world as falling
growth rates
• Eliciting a range of corporate strategies and
policy responses
• Many of which exacerbate the risk of crisis
• ‘Compensatory’ mechanisms which
exacerbate the damage from ‘over
production’
• Strategies for managing the threat of
‘over-production’?
Reduced profitability:
compensatory corporate strategies
Slowing growth: compensatory
policy responses
• Search for new markets, new products and better
marketing (including commodification of family and
community functions)
• Externalise costs (including to labour and to the
environment)
• Increase market share (horizontal M&As),
• Increase market power (eg vertical integration)
• Reduce wages
• Replace well paid labour with technology
» Many of • -.sc strategic will furttur reduce demand
• Cut taxes (in particular, reduce corporate and executive tax
burden) to compete for new investment
• Outsource and privatise public sector service provision
(new market opportunities)
• Labour market deregulation (union busting) to reduce
labour costs
• Deregulate environmental controls (converting natural
capital into recurrent revenue)
• Force repayment of debt from TW countries
• Force TW countries to open their markets and economies
(under the slogan of free trade and open markets)
« Many Of these strategies tv?
Responses which tend to
exacerbate the crisis
- Destroy the environment
- Increase unemployment and inequality
- Weaken family and community
- Decay social infrastructure
- Transfer value from South to North
- Grow the power of the financial sector
• Exacerbate the over-hang of productive
capacity over effective demand
Strategies to counter the threat of
‘over-production’
• National Keynesianism (counter
cyclical taxation and public spending)
• Profit recycled as consumption
through debt
• Globalised free trade
• Self-sufficiency and regional trade
2
Free trade - the key to growth
and development?
Profit recycled as consumption
through debt (private and
corporate) f
,
• Slow growth outlook so profit from trade
and production flows into financial sector
• Private consumption supported through
increasing private debt (recycling profit as
consumption)
• Corporate rationalisation (including M&As,
closures and bankruptcies) financed
through corporate debt
• Increase size and power o financialf sector
. 'Free trade’ - a catch-all slogan obscuring countries’
and corporations’ manoevering for advantage
. Regulatory framework defining ’free trade’ discriminates
in favour of the rich West
_ IP rules compared with barriers to people movement
- non- agric. market access compared with agric. protection
- declining terms of trade (commodities vs manufactures)
- minimal commitment to special and differential treatment'
• Globalised free trade risks exacerbating the crisis of
overproduction
• Protectionism, can have important benefits as well as
drawbacks
• Amin: self-sufficiency and polycentric regional (South
South) trade
Events, Reports, Struggles (1944-88)
.
•
1944: Bretton Woods (IMF, WB, GATT)
1950s: Health development policy: DDT, doctors and hospitals,
population control
• 1955: Bandung Conference and birth of the Non-Aligned
Movement (more confident TW voice)
• 1964: UNCTAD 1 (and G77) leads to call for New International
Economic Order in May 1974
. 1973: First OPEC price rise
. 1978' Alma-Ata Declaration (PHC, reference to NIEO)
. 1975-80: Onset of stagflation, end of the long boom, emergence of
monetarism
• 1981: escalating interest rates, debt trap sprung
• 1981: 'Selective PHC (the response to Alma-Ata)
• mid 1980s onwards: IMF develops and imposes SAPs
• mid to late 1980s: rise of AIDS/HIV
• 1987: 'Adjustment with a Human Face'
• 1989: Break up of the Soviet Union
End of digression
back to main story
Events, Reports, Struggles (2001-04)
Events, Reports, Struggles (1992-99)
■
1991: USTR attacks Thai administration over pharmaceuticals
•
Jan 2000' USTR withdraws threats to Tha.land over compulsory licensing
of DDI after 12 years of pressure
Dec 2000: People's Health Assembly and People s Heal h Charter
April 2001: Defeat of big pha—a in South Afnca (ncte role o
olobal social movements)
April 2001: Norway Conference (WHO accepts d.fferendal pnang)
ilth and stability
•ntionism
increased aid (and GFATM) and PRSPs)
•
•
.
1992 WHO 'Health Dimensions of Economic Reform'
■ s
1995: WTO established
•
.
__
°f USF
and other NGOs and internet)
• 1999; PRSPs implemented (new and improved SAPS)
• 1999: WTO in Seattle: outrageous process; dramatic protests
.
•
-
Sept 2001:9/11
,
„ D,,_ Nov 2001: Doha and the Statement on Public Health (especially Para
and compulsory licensing: note rearguard action by US)
Oct 2002. Bnstol Myers Squ:b defeat in Thai DDI case
Mar 2003: Invasion of Iraq (US unilateralism; widespread opposition, note
•
limits to US power)
Oct 2003: Negotiations for US Thai FTA commence (at nsk. comp
licensing, data access, extended IPRs)
.
Nov 2003: Miami FTAA-lite (US knocked back by Latin Amenca)
•
Jan 2004: IMF report critical of US twin deficits
3
Emerging Themes and Conclusions
• Links between health crisis and global
governance regime
• Continued drive for vertical interventionism,
rather than comprehensive PHC and capacity
building
• Despair, violence and instability as a
consequence of health crisis and poverty
• Global economic crisis critical to health
outcomes; must be part of the health activist
agenda
• US hegemony and US unilateralism key factors
but there are limits to US power
• Success of TW, NGO and social movement
struggles
Vertical interventionism
• Continued drive for vertical interventionism rather than
comprehensive PHC and health system capacity building
• Both WB’93 and CMH’01 gesture towards integrated
health system development and capacity building and
PHC but rely largely on vertical programs and the new
interventionism
• Global governance regime faces legitimation crisis
- debt, SA and damage to health
- AIDS crisis and lack of resources, lack of action
- poverty and health crisis linked to refugees, violence and
instability
• Vertical interventionism a reflection of twin drivers
- defence of global governance regime
- legitimation through 'addressing' the health crisis
Links between health crisis and
global governance regime
• Affirmation of links between health crisis and
global governance regime in AA78
• Denial (or obscuring) of these links in WB’93 and
CMH’01)
• WB’93
- virtuous cycle story
- health development through (improved) structural
adjustment
• CMH’01
- virtuous cycle story
- health development through foreign aid (GFATM)
negotiated through PRSPs (SAPs)
Poverty & health crisis -> despair,
violence & instability
• Despair, violence and instability as
consequences of health crisis and poverty
- note CMH warnings of June 01 followed by
9/11
• Reflection
- strategies which aim to delegitimise will elicit
responses that aim to legitimate
- delegitimation does provide political leverage
but
- need to go beyond delegitimising to positive
policy directions for change
Global economic crisis and
health
There are limits to US power
• Global economic crisis major determinant of
health crisis
• Responses to economic crisis (and the reform of
global economic governance) critical to health
outcomes
• Bridging issues
- TRIPS, AIDS & access to drugs a bridging issue
- fair trade in particular commodities such as cotton,
tea and coffee
- agriculture (defence from dumping; market access;
and farmers’ livelihood and local self-sufficiency)
• Global economic policy reform must be part of
the health activist agenda
• US hegemony and US unilateralism key factors
defending global status quo
• But there are limits to US power
- US dollar status and US / global vulnerability
- public sensitivity to US deaths but lack of auxilliaries
willing to die for Uncle Sam
- growing credibility gap beyond the US
- limits to US public acceptance of corporate corruption
associated with money politics
- oppositional social movements, NGOs and
information resources (internet)
• Importance of engaging with progressive NGOs
and networks in the US and across rich world
1
J
Successful campaigns in health
related struggles
• NGO and social movement alliances around
particular issues; supporting TW governments
and officials
• Resources and strategies
- mass protest (Seattle)
- technical leadership (MAI Non!, CPT, MSF, TWN)
- high profile cases / issues (pharmaceuticals in South
Africa and Thailand, tea and coffee and fair trade)
- internet - communication medium and information
source
- grass roots NGOs and social movements
- leadership documents (such as the People's Health
Charter)
Strategies and directions
•
•
Build on successful strategies
South South and South North solidarity (people, issues,
organisations)
• Bring economic reform into health policy reform discourse
- TRIPS and access to drugs
- health and fair trade
- farmers' livelihoods, local self-sufficiency and rural health
development
- environmental issues such as global warming, biodiversity
- health activists join economic debates
• Delegitimise policy reports which deny the need for alternative
economic policies to create the conditions for better health
- build a strong alternative health policy (linked to global economic
reform)
• Global economic reform must be part of the health agenda
- fair trade with special and differential treatment
- trade policy which is pro-equity and pro-development
• sensible self-sufficiency and polycentric South South trade
1
Successful campaigns in health
related struggles
• NGO and social movement alliances around
particular issues; supporting TW governments
and officials
• Resources and strategies
- mass protest (Seattle)
- technical leadership (MAI Non!, CPT, MSF, TWN)
- high profile cases / issues (pharmaceuticals in South
Africa and Thailand, tea and coffee and fair trade)
- internet - communication medium and information
source
- grass roots NGOs and social movements
- leadership documents (such as the People’s Health
Charter) -
Strategies and directions
• Build on successful strategies
• South South and South North solidarity (people, issues,
organisations)
• Bring economic reform into health policy reform discourse
- TRIPS and access to drugs
- health and fair trade
- farmers' livelihoods, local self-sufficiency and rural health
development
- environmental issues such as global warming, biodiversity
- health activists join economic debates
• Delegitimise policy reports which deny the need for alternative
economic policies to create the conditions for better health
- build a strong alternative health policy (linked to global economic
reform)
• Global economic reform must be part of the health agenda
- fair trade with special and differential treatment
- trade policy which is pro-equity and pro-development
■ sensible self-sufficiency and polycentric South South trade
1
Events, Reports, Struggles (2001-04)
Events, Reports, Struggles (1992-99)
|
► Jan 2000: USTC withdraws threats to Thailand over compulsory licensing
■ . iMirUSTRattacksWiata
‘ .
► 1992^WHO: 'Health Dimensions of Economic Reform’
► 1995-9^OET^drivefor MAI (note role of NGOs and bternet;
but continuin^push in WTO under Singapore issues'}
.
►
•
• ► i999tpRSPsTmpl2nented(new and Improved SAPs)
• M?r ZOOS: InvSo^of5^^(UrunJtJaTsJFwidespreadopposition; note
•
► 1999: WTO in Seattle; outrageous process; dramabc protests
’
■
'Singapore issues'; US moves to bilateral and regional FTAs
> Nov 2003: Miami FTAA-lite (US knocked back by Latin America)
> Jan 2004: IMF report cribcal of US Min deficits
•
Emerging Themes and Conclusions
k Links between health crisis and global
governance regime
► Continued drive for vertical jnterventionism,
rather than comprehensive PHC and capacity
building
► Despair, violence and instability as a
consequence of health crisis and poverty
► Global economic crisis critical to health
outcomes; must be part of the health activist
agenda
► US hegemony and US unilateralism key factors
but there are limits to US power
► Success of TW, NGO and social movement
struggles
Vertical interventionism
_______ _
Links between health crisis and
global governance regime
► Affirmation of links between health crisis and
global governance regime in AA78
> Denial (or obscuring) of these links in WB'93 and
CMH'01)
> WB'93
• virtuous cycle story
- health development through (improved) structural
adjustment
► CMH'01
- virtuous cycle story
« health development through foreign aid (GFATM)
negotiated through PRSPs (SAPs)
Poverty & health crisis -> despair,
violence & instability
► Despair, violence and instability as
consequences of health crisis and poverty
PHC but rely largely on vertical programs and the new
interventionism
► Global governance regime faces legitimation crisis
■ debt, SA and damage to health
• AIDS crisis and lack of resources, lack of action
. poverty and health crisis linked to refugees, violence and
instability
► Vertical interventionism a reflection of twin drivers
. defence of global governance regime
• legitimation through 'addressing' the health crisis
■ note CMH warnings of June 01 followed by
9/11
> Reflection
■ strategies which aim to delegitimise will elicit
respgnses that aim to legitimate
- delegitimation does provide political leverage
but
* need to go beyond delegitimising to positive
policy directions for change
4
community
cell
health
47/1,(First Floor)St. MarksRoad
BANGAl OJE - 5
FINANCING
HEALTH
PROJECT WITH
001
PEOPLEPARTICIPATION
EXPERIENCE OF R A H A .
I shall first try to describe what the Raigarh - Ambikapur
Health Association has been trying to develop ever the last fourteen years.
RAI1A is a registerd Society since 1987. It co-ordinaters three base hospitals
and 62 rural health centres in 2 districts. From 1974 onwards it’s focuss
is integrated community health through people’s participation, in decision
making. Hanning implimenting and financing.
The area of operation :
Geographically it is the Eastern spur of the great plateau of
central India. Ihinly populated (70 to 100 p./sq.k.m.) Raigarh and Surgnja
districts have a population ef about 2.5 millionf^r 35,437 sq. km. Surguja
has 7,40,000 and Raigarh 700,000 tribals. They form respectively 56 and
49 percentage of the total population. There is ni industry worth mentioning,
except the Western coal-fields in Surguja. 70% of the tribals are cultivators
and 24% agricultural labourers.
Women hold an honourable place and go freely about in the country
side. In the fields an in the Jungle they work in happy companionship with
the men. Their economy is net really focussed on ” increasing production”
but rather on fulfilling the needs of immediate consumption. Apart from
preserving seeds for the next sowing seasen, they freely spend all they
have. Their willingness to share on the other hand is remarkabble. Motives
of profits and empetion are remote. Another mental attitude of the tribals
need to be mentioned: the need to move together. However, it can also be
built up into a real sense J . ef solidarity when an immediate benefit fer
the individual is sacrificed for the future greater benefit of the group.
The Development Activities of RA.HA in shrore :
Hie Christian missionaries who came to Chotanagpur had the human
development, the Shaping of a more just and liberated Society in mind.
Education is a primary tod. (l) Raigarh has how about 35,000 children
in 92 Primary, 4l middle and 15 high schools . (2) Through the well Im own
Griliini schools more than 13,000 young tribal village firls have been formed
to be better women, wives and mothers. Most of them return to their villages
to lead and speak out for their totally uneducated brothers and sisters.
Others go out in search of employment in order to support their family
economically (3) Since 10 years 75,000 tribal children between 3 to 6 get
everyday basic stimulating environment jahey need to develop their full human
potential through the Bal wadi programme which operates in 3S0 villages. Local
educated girls are trained as Bal Sevikas • (4) The Jagruk Ki san programme
took shape in Raigarh district in 1979 with initial assistance of ISI-MOTT.
At present 14,000 farmers are helped ..by 800 animators in 30 centres she, study
ways and means to improve their situation.
6
0
In this paper however, I shall mainly deal only with our community
health programme indetail,which grew from the discovery that :
- the traditional system of health care did not solve the acute needs of
the economically weak tribal population,
« that even well-run hospitals with high bed-occupancy did not mean
that the root-causes were tackled, and that improvements in the health
situation of the whole community were brought about,
« that hearly 60^ of all diseases are preventable.
A wide dissemination of basic knowledge, a change in habits and
attitudes and a massive mobilisation of locally available skills could be a
better strategy for community health improvement than the cetrailsed
spec!all, sed and expensive services of a few big institutions, however meaningful
they a til 1 are as the top of a pyramid of services.
STEPS
1, Training Village Health Workers (VHW) in 1976.
Volunteers from 5 different religious institutions formed a mobile
team. Some of them were nurses and some social worker^. The village leaders
were approached. Villages were relatively small (25 to 100 households) and
each health centre caters to 50 - 100 villages. With the backing of the village
leaders and the religions leaders, the need for effective and preventive
health care was explained. The people began to realize that they would no
longer be forced to sell their cattle or fields to save the life of a sick
relative. The people were then invited to select from among themselves a man
and a woman who were settled in the village. , who were accepted, as leaders
and who through their proven devetednesd and ability give reasonable hope
that they would effectively and generously help the community. Although men
are the traditional healers in tribal society , the women were also invited
since they do most of the nursing. They were given, at first, two weeks1 camp
and then were w sent back to their villages. After six months they were called
for a second camp lasting two weeks. After this each one was given a first
aid kit. After six months of practice as effective village health workers,
they were called to the centre for a third camp. These trained VHW’s were £
followed up every month.
Follow Up Meeting :
The monthly meeting is of crucieJ- importance. All the CHW’s then
exchange their experiences, their records are checked, the medicine Ictts aro
restocked, new initiatives are discussed and further improvements are planned.
It is a great encouragement to do things together, to feel, you are working in
a team that understands and appreciates your efforts. These regular meetings are
the ordinary and ste adyfc ornmuni c ati on channel toward^jpwards and dowards.
The VHWs do not get any remuneration from PAHA., except a meal on
the monthly meeting day since many have to walk a great distance ,2-6 hours.
From the beginning RAHA. has been careful not develop an employee men tali ty
among them. Their work is considered as a challenge to their generosity.
However, we favour the giving of an annual remuneration by the village^ to
the VHWs in accordance with tribal custom.
The School Health Programmes
Started on 1980, after a workshop by VHAI, Volunteer school health
guides were chosen from among the staff, physical check up were organised and
a dentist from one of hospitals visited the main centres, he gave dental cere
to the school children and teachers in subsidised fees. At the same time
patients from the village also profited from this special care-In 1983
Dr. Meera Shiva & Co. were called for another training for the school health
guides. How 273 teachers are working as part time voluntary school health
guides in primary - middle end high schools. Twice a year a refresher course
is organised for them. Periodic school check up for school children w&s jsek
organised by the help of our doctors and government primary health centres.
At this occasion preventive measures are undertaken against blindeness,
skin diseases. Along with this immunization is also administered.
The TB Castrol Programme
In 19&4 we got in touch with the tuberculosis control programme of
the districts of Ambikapur and Raigarh. National Tuberculosis Institue ,
Bangalore, was approched by RAHA staff and got a trainning organised for our
doctors, community health nurses and lab technicians, in NTI, Bangalore.
In collaboration with D.T.C. two of our hospitals were recognised as diagnostic
and treatment centres • D.T.C. para medical staff gave training to RAHA sta.ff
to collect sputum and prepare slides for testing. Since 1985 September , we
are supported by D.T.C., Raigarh and Ambikapur-how. We are in a position to
treat all the T.B. patients free of cost. NTI has agreed to retrain our staff
from the second week of May , 1990. With the help of some outside support, we
undertook training of health workers, paramedicals, and centre nurses, specially
on prevnetion and early detention, of T.B.
See Appendix !•
i
4
THE MEDICAL INSURANCE SCHEME:
People must be taught to prevent disease, but they snould also be
protected against the economically crippling effects when unavoidable
sickness or accident strikes. In these cases, medical care and hospit
alisation are beyone the paying capacity of uost of nur people ahd
certainly of the poorer#
Therefore in order ;
- to facilitate essential medical care to the rural areas on a cooperative basis so that the crushing burden on an few > could be
carried lightly by many;
- to act an incentive to increase participation by the people in
the total health programme#
- to enable our base hospitals to fulfill theit priority -objective
more effectively, namely medical services fcr all including the
poorest,
RAHA has gratualybuilt up an original system of INSURANCE#
It rests on four pillars:
1# Maximum participation of people.
2. There must be a great stress on prevention. LLvery group that takes
part , be actively engaged in preventive and protective measures
under the guidance of tho nurses and the dedicated service of a
village health worker,
spirit of solidarity is the main motive. It is as essential as
3# The
the two previous one. If every body tries to get back his money’s
worth, irrespective of his medical needs, the whole scheme is
bound to fall. The motto should rather bes" I pay for my brother,
and my brother pays for me.
4. Low-cost care: most of the VHPs are traditional medical practicioneres. They need to be encouraged.In order to gioe assurance to
their skill , we give them refresher training on use of herbal
medicines, it’s proper use collection and protection of herbal
plants along with alopathic system.
More than 5 years
>f training vill^gs health workers pruceUed .he
start of our M.I.S. (Medical Insurance scheme). Even then we made
the mistake of focussing on insurance for hospitalisation in the .begin
ning. There wss very little or no response, because nobody wanteo to
be hospitalised. As proposed for "Local treatment1’ - insurance got
a better response.rtt first people, had not have the slightest idea
what insurance ment and hoe they could benefit. After four years
of operation, they experienced the enormous advantages.
5.
How does the M.I.S# function?
ce work in a two-tier system. In the very begining the yearely
membership to MIS was Rs. 1. per person per year. Gradually it
increased to Rs. 2*50 then to Rs. 4. Now it xd is fixed to equivalent
of 2 Kg of rice(Rs« fi-TJ^This can be given in cash or in kinejr two
months in advance. This local insurance fund at health centre is
called as the " SAMARITAN FUND" nnd is locally managed by a health
centre committee. This S.F is used to pay for the re-stocking VHWS
medicine boxes and curetive services at the health centre level.
The CENTRAL FUND
(second tier) takes care of the hospital referals
and is centrally managed, although it is fed by yearely contributions
from the different A 5amaritan Funds.
THE PURPOSE OF SAMARITAN FUND*
- to give free tru tment to the members (according to it, s c ^iiity) •
- to fin.nee all other preventive and protective msauures,
,u s needed*
- to fostar early ire .tment, indapundunt of economic conditions, ’which
is the secret to keep cost of treatment low. A parson who does not
have, to pay at the time of treataent, will be Inclined to come early,
to health center or tn hospital*
1LI SIDILITY: tho e ’who belong to tho economically '..’esker sectiob,
irrespective of c ste and creed, but who can jo trusted
to join in a spirit of solidarity and ure ready to take part in the
p r e vent ive am asuras* The fscrvicas of an active VHW is therefore essen
Lol«
Collection of ths fund: is chiefly through memcarship fees, which have
- to be paid, once n yu.r und two months in
advance*
Repeote’dly changing the fee was disturbing thrire fore now all have
□greed to pay yearly ’’the value cf two kilos of rice per personn*
The collection con be done in cash or kind.
kind* This linking to a common
avoids the need for frapueht
ni rket coimnodity □voids
frafiucht changes, allows far .ainor
local variations, ff'ostr::.s
o s t rj s early collection (during harvest times dec/
jcn)f and will snow □ yearly increase in real value to mutch the
increasing cost of treatment (N*B* the whole foiiiily should join* Unborn
children arc insured insured with the mother, and concessions can be
given to nuclear families with more than six persons.
Management of the fund: the mcney collected is kept at the local health
----------- -—. centre, □no -he membears are regularly informed
through the VHWS of expenses incurred/income received.
i-------------------------------------------------------------------------------’
i
d&ih temporary
6.
assistance from done agencies, RAJA, has so far been able to double every rupee colle
cted by fees. This was necessary since fees were very low, and the number of members
st-m insufficient to be fully self relient. Those centres who has got high member
ship stand
on their own and do not need anjr outside help.
The Samari tan Fund is insufficient to last a whole year, where there are less memb
ers. In auch cases , restrictions are agreed upon (excluding tonics, vitamins, part
or full payment of injections. ).
The SAMARITAN FUND is not just an insurance sheme. It acts as a catalyser for com
munity participation. It is the change over from the old system of health care
where every one pays for himself and which was consequently limited to those who
could pay, to a self relient community care system which include the poor because
each one pays for the other, and the other pay for him. Through the Samaritan Fund
(sp. through prevention and early detention /treatment)we see the sick deminish
considerably in number and the poor can equely benefit because all share the burden.
It is an implicit invitation towards concern for one another and gives our health
instJ.tutm.ons the opportunity to serve those for whom they are originally started.
THE GENTRkL FU1TD MID THE HOSPEUL REFEPAL SCHEME.
fn
.............. ............................................ ............
,
—■ ■■
44
Part of the money collected for the Samaritan Fund, Rs. 2/- per person , is paid
to this Central Fund, from whish the hospital bills of members are been paid.
Patients contribute only a nominal Rs. 100/- per case or Rs.200/- depending on the
distance they have to travel to the referal hospital.
Conditions for ref era!
1. There must be an active trained VHW in the village who regularl > attends the
monthly follow up meetings. She/he keeps the records of her /his activities in
the village.
2. Only those who have paid their membership fee ^wo
months earlier,
3. k sufficiently qualified nurse in the health centre, who effectively takes care
of both preventive and curetive needs of the people.
METHOD OF REFEBAL
Normal 1 y a sick person first reports to the
VHW who gives the first aid or initial
treatment. Wien the need arises, informs the nurse or sends the patient to the health
centre. Depending on the cases the nurse has then to decide , whether the patient
needs to be tranfered to the hospital .The patient monies to the OPD of the hospital
with RAHA referal card giving essential data. The patient comes with Rs. 100/- in
hand . (in case the patient is poor to finf Rs. 100/- the nurse advances part of it).
If treated in the OPD only , the patient pays up to Rs. 100/- only. If admitted by the
7.
doctor, the patient pay the full Rs. 100/- as his share of the bill. RAHA pays the rest
up -tc Rs. 1000/-. No individual acquires the right to be admitted . Only the doctor
decides when and how long the patient has to be admitted. The patient has to arrange
for his own food. He has to be accompanied by a companion who sees to his all other
needs.
Limitations
- no case older than one month , should be given a RAHA referal card.
— no case resulting from a criminal action or indused abortion etc. ■will be cosidered.
- old cases like T.B. patients are convered by anotherprogramme.
TREATMENT AT HEALTH CENTRE LEVEL
Can the Medical Insurance Scheme become self supporting?
The real cost of treatment can be kept low if people take an active part in prevents
ion If they report early , or are detected early^If after correct diagnosis treatment
is started with out delay. If nurses and people are gradually educated towards a
low-cost and rational drug-therapy. If all preventive and promotive measures
(immunisations etc.) are used. If herbal home remedies are practiced judiciously.
ACHIEVEMEHTS p AT HEALTH CENTRE LEVEL.
hili
umn
-
,i -
'
■■
~
'
11
1
■—
1
1111
—»
Among 62 of our health centres, 35Q/^ started to functioifelready self supporting
and 65
are still in need of out side income. The reason for the different degree
of success is due to
Less number of membership to MIS.
- Freequent transfer of centre nurse
- Lack of raport of centre in-charge.
- Lack of motivation of people to MIS .
OTHER SOURCE OF INCOME FOR HEALTH CENTRE.
1. Dedicated free service of the centre incharge> and other support of her community
; . members.
2. Minimum income from the registration fee from the members (Rs. .5-1/- )
3. Some income from non-members.
4. Income generation like kitchen garden , poultry etc.
5. Use of herbal medicine- incurre less expense.
con/p.S
»
8.
AGHTEVEMENTl AT HOSPITAL LEVEL
For the first three years we saw a big increase in the number if patients refered: 300-500-700. In the fourth year it leveled off at 600 even droped further to
500 as health education for prevention -Immunisation was practiced more widely.
The average cost of or patient was less than Rs 400/- • We needed almost Rs. 2,00000
for hospital treatment alone which we had not yet succeeded to collect, from
the people. There fore we depended still on some out side financial support.
Now we have got a high increase of membership : 750322 This means our Central
Fund came to Rs. 1,5000/-+ patient’s contribution Rs.58650 /- i.e. a total of
Rs. 2,08714/- Our total expense of or patients refered acame to Rs. 1,85346.
Pb?om this we loam the good news that in 1989 for the first time we are able to
pay all the hospital bills of RAHA patients from their own collection. This could
be possible because 1800 VHWs are working enthusiastically in the villages along
with centre nurses towards SELF RSLIENGE.
From 1975 health camps were held all over RAHA region . More than 500 men and
women have gone through one or more of these camps. About 1800 VHWs from all over
1200 remote tribal villages are now actively engaged in health promotion and
primaiy health care. The momentum of enthusiasm , co-operation and team spirit
generated in these initial staged , would eventually die out if ther was no
coiled-up SPRING ready to give new energy.This is the new role of the nurses in
RAHA, which is understood as motivating and guiding these village health workers.
The nurses now multiply their services to the people by the number of villages
that take part in the MEDICAL INSURANCE SCHEME.
From the veiy beginning we have been careful not to develope an employee mentality
among these VHWs. They get no remuneration , execpt a meal at the monthly meeting.
They see their part- time work as a challange to their generous!ty. The appriciation
they receive from their community is the added stimulus. Self-sacrifice and
generous!ty are not the monopoly of Christians • They can be found in any community,
although they are nowhere easy.
SISTER PRASHAS 1 ’■
Executive Director
of RAHA
1
C _0 N T R 0 I.
.B
PROGRAMS F,
A M B 1 K A P V R.
CID IP
OPD
Posunel
ip
IP
Pet. Pnt. spot. Spent.
Cases
Month New
Total Extra Pul.
pul
_
S^utora
Jan.
28
28
28
2
28
1
68?
79
8724
1. S?1.
Feb.
28
5
23
39
3
25
6
716
113
11722
2. Eth 200 r cr.
Mar.
9
4
9
5
-109
35
IO864 637
8994 2039
139
33
1 IG3 7
3
9
17
9
8
126
32
38
73
50
46
738
766
813
June
23
47
45
29
4
Mey
32
51
56
C63
171
17436
6. EJi 'GO
July
40
10
30
42
9
35
SOI
155
14654
7. irn ?oo
Aug.
35
8
27
42
6
31
937
19?
17384
Sept.
29
Q
20
52
2
28
6/)
172
158
I6014
Oct.
14
14
10
14
6
699
15
1714
Not .
Def.
24
24
53
66
14
14
3
7lit 26
2282
514
28
33
40
37
61
36
33
39
43
39
41
<C5
154
8242
8384
Apr.
Jan.
Feb.
Mar.
Apr.
May.
June
July
Aug.
Sept
Oct.
Nov.
Dec.
3<^
6
12
8
11
10
8
8
5
4
5
12
7
1
1
3
1
1
1
1
31 c
5
11
8
8
10
7
7
5
3
5
11
done
Total f Vc
X rcy Coop. Old
Cere
51
4
50
1
31
3
6
12
1
6
8
n
11
10
8
8
1
2
7
7
3
6
3
2
K
5
5
4
5
12
1
2
3
9
2
y
18
166
140
145
153
145
149
137
132
121
112
101
83
90
87
97
58
20
9
7
3
14
6
8
------- jAL
3» K<h 8’00 rg.
4« Is Forb
5. 1T
2432
[
r.g.
!<•
8. Jj UI Kv vfr.
■
h
F
S'I
2
!•
T.n.
Nrme o.«' D.
ise za *.
?474
.2
10105
13188
12352 7533 h
6318 |9006
5421 I
10503
4
10050 22481
10613 8018
5926 11117
2167
1. r.^*. iTco K ip.
2. £Hi 8no r-> 14000
3. IS Foit Ir OOO
4. IN K JOOng.
5. inn. ico r^. noco
’■3.. ;
APP.II
,r. - - ; \ 1. ah
THE RAHA INFRASTRUCTURE
Village Health Workers
1755
VHW Supervisors
63
TAB trained active
410
Noo of School Health Guioes
275
No. of Nurses RNRH
40
NOo of Nurses AiSJH
23
Noo of Rural Health Centres
62
Referal Hospitals
3
copulation covered by RAHA
Total population of both
districts
R
3,00, 000
S
4,00,000
25,00,000
MSDICAL INSURANCE SCHEME
Membership
Total
1980/1
1982
1983
1984
1985
1986
1987
1988
1989
2000
10000
37000
45000
50000
51000
56358
50226
75032
RAHA Patients refered to Hospital
1981
1982
1983
1984
1985
1986
1987
1988
1989
I
300
551
711
594
387
272
267
234
231
Total No o of patients cared in the village by VHP
3,36,000
Total No. of patients treated in the Health centres
1,92,000
I
I
App-II
RAHA Patients Bills Paid by RAHA
H.C.HOS KUNKURI
A.Pur
Raigarh
Tptaj
1981
50,487.95
26,477.25
15,081.00
92,046.00
1982
1,17, 076<,40
38,694O75
27,336.00 2,83,806.00
1983
1,76,904.05
76,889.65
29,780.00 2,83,570o00
1984
1,33,365.50
34,293.25
16,493.00 1,84,151.00
1985
1,65,878.00
44,307.00
12,707.00 2,22,992.00
1986
1,23,198.00
40,724.00
11,363.00 1,75,285.00
1987
1,25,477.00
55,949.00
8,519.00 1,89,945.00
1988
1,36,462.00
69,749.00
6,082.00 2,12,293.00
1989
1,00,046.00
70,500.00
15,000.00 1,85,546.00
Pergamon
0277-9536(94)00134-0
Copyright < 1995 Elsevier Science Lid
Printed in Great Britain. All rights reserved
0277-9536'95 59.50 + 0.00
QUALITY, COST AND UTILIZATION OF HEALTH
SERVICES IN DEVELOPING COUNTRIES.
A LONGITUDINAL STUDY IN ZAIRE
Cc.N H
Slim Haddad and Pierre Fournier
Universite de Montreal. Unite de Sante Internationale. Groupe de recherche interdiscipli; '»ire en same.
Pavilion Marguerite d’Youville. C.P. 6128. Succursale A. Montreal. Quebec. Canada KC 3J7
Abstract—Many developing countries, particularly in Africa, have recently introduced payment schu 'es
based on the selling of essential drugs. This is one of the main elements of the Bamako Initiative according
to which the income generated would ensure a reliable supply of drugs and would improve other aspects
of the quality of the services offered. Thus, qualitx improvements would compensate for the financial
barrier and as a result the utilization of public health services would be increased or at least maintained.
These hvpotheses have proven to be partially valid, since there have been cases where the utilization of
health services has increased and others where it has decreased: these inconclusive results have fuelled
criticisms concerning the inequitable nature of these measures.
This loneitudinal study in a rural community of Zaire shows that the utilization of health services had
diminished^by close to 40% over 5 yr (1987-1991) and that 18-32% of this decrease is explained by cost.
The regular supply of drugs and the improvement in the technical quality of the services technical
qualification of the staff, allocation of microscopes, and renovation of the infrastructures—was not enough
to compensate for the additional financial barriers created by the increased cost of services. However, on
a local level, the interpersonal qualities displayed by some of the nurses sometimes helped to compensate
for the negative effects of the costs, and even to increase the level of utilization of some health centres.
The quality of public services has often been neglected in developing countries. While some attention
is given to technical qualities, the interpersonal components of the quality of the services are generally
ignored or underestimated by planners and they are the ver\ components which are most resistant to
change. It will be a major challenge for health systems to address this issue of quality of care in order
to minimize the negative impact of the introduction of user payment schemes. Therefore, now is the time
to place quality next to coverage in planners’ agendas.
Kev words—Bamako initiative, utilization of health services, quality, costs, qualitative methods,
quantitative methods.
INTRODUCTION
""'he austerity measures imposed by the international
economic climate of the 1980s led health care officials
in developing countries to reexamine their service
development policies, adopting strategies like the
Bamako Initiative. The experiences of payment
schemes and the Bamako Initiative raise several
questions about equity, and the impact of costs on the
activity of health facilities is among the main issues
under discussion.
In the 1980s. some authors defended the idea that
demand for health services was independent of the
prices charged by the health facilities. According to
them, “people are able and willing to pay for health
services." [1-3]. This point of view, which is based
primarily on the results of certain cross-sectional
studies [4. 5]. has received only partial support, since
this position was seen by some as being too narrow
and even dogmatic [6-8]. Many studies suggest that
direct costs are among the principal criteria which
health system users take into account in their
decisions [9-14] and several longitudinal studies re
port a dramatic drop in the activity of health facilities
following the introduction of direct cost recovery
systems [8. 15-21].
Several studies suggest that the most vulnerable
social strata (poor [8. 17.20]. rural [17] or isolated
[19] populations, children and the elderly [17]) are
those most affected by the introduction of direct cost
recovery systems. The price elasticity of demand may
differ significantly from one social category to
another [13]. A recent review of studies on utilization
reveals that income and. more generally, ability to
mobilize resources are highly associated with the
utilization patterns of the communities [22]. Lastly,
non-users frequently report that they have not sought
health services because the utilization costs are too
high [7. 22-28].
The negative impact of the introduction of direct
cost recovery systems is also often seen as the conse
quence of the poor quality of the services provided by
the public system. The World Bank suggests that an
improvement in the quality of services would com
pensate for the negative effects of prices, knowing
that “the relatively longstanding practice of the
743
744
Slim Haddad
and Pierre
Fournier
church-mission facilities gives fairly conclusive evi Rurale), with a population of some 90 000. is about
dence that people will pay for quality health care'* 500 km northeast of Kinshasa and covers approx..
and there is ample “. .. evidence that the poor can 10.000 km2. Nioki and Ntandambelo are the main
and will pay for some health service, when the cities in the zone. The remainder of the inhabitants
services and pharmaceuticals are available and their are scattered among villages of varying sizes, located
quality is perceived to be high.” [1]. UNICEF re near the main travel arteries (roads and rivers). The
cently took the same position: ‘’the trend towards region of Nioki is poor and the economy is one of
decreased demand for services can be reversed when subsistence. The standard of living has dropped
efforts are made to improve the services before a considerably in the last 5 yr as a result of high
inflation rates and the decrease in market price of raw
system of payment is introduced." [18].
This point of view seems to be widely accepted. In materials.
Since it was established in 1982. the ZSR has
fact, there are numerous examples where under-utiliz
ation of public health facilities is directly attributable benefitted from the support of the Canadian Inter
to the poor quality of the services [25, 29-35]. The national Development Agency (ClDA). The Central
health facilities run by religious orders are often Bureau (known as the BCZSR) provides administra
preferred to the structures in the public network tive backup and support for curative and preventive
because they offer better quality services, though their activities. The health facilities include the health
fees are often higher [1,25. 36]. Populations are some centres (HC) run by the ZSR and a 110-bed hospital
times prepared to travel much greater distances to in Nioki owned by a private forestry company. There
reach these missions than they are for the govern are now 39 centres, four of which are in Nioki. They
ment-run structures [37]. Lastly, several experiences, usually have a nurse and a midwife, and sometimes
notably in Benin, Guinea and Mauritania, suggest a lab technician. Through a building renovation
that revitalization of the public sector and general program, most of the older centres have gradually
improvement of the quality of services are capable of been refurbished with the financial participation of
stimulating utilization of these services [18,38.39]. villagers.
The ZSR has favoured an approach incorporating
Yet, we do not know precisely what changes are
likely to modify public perception of the quality, and community involvement: village management of the
subsequently, to effectively compensate for the nega health centres and the drug fund, contributions
tive effects of the costs. Some studies suggest that towards the construction and renovation of the
patients are attracted by the presence of qualified health centres, and the purchase of equipment, and so
personnel [5. 32:. 34. 40. 41] and that they would be on. Proceeds from the sale of drugs are used to
prepared to make substantial efforts to use services maintain the system for purchasing and distribution
which they recognize as technically competent of basic drugs. The BCZSR sells the drugs to the
[37, 42—45]. The availability of drugs also appears to Village Health Committee which, together with the
have a significant impact on the utilization of public nurses, is responsible for managing the funds derived
health resources [ 17. 18. 30, 38. 39,45-48]. It is not from selling drugs to the patients. The BCZSR
certain, however, that the quality of the infrastruc reviews the prices regularly to maintain its ability to
tures has a significant influence on utilization patterns resupply and to adjust its prices to those of the
[46]. Some components of quality which patients private sellers. In addition to this drug recovery
seem particularly concerned with, such as the inter system. there is a fee-for-service system. The patients
personal qualities of the health staff, are rarely men pay a lump sum fee and they are then given a
tioned by planners and health care officials who seem registration card which entitles them to use the health
to focus more on the technical aspects of the quality centre services free-of-charge throughout the dur
[49]. Thus, rejection of public health facilities is ation of the episode of illness. The amounts collected
sometimes associated with a negative perception of help to pay part of the nurses' salaries: 35% of the
the health care workers who are sometimes faulted consultation fees and 10% of the sums generated by
for lacking compassion, or being inattentive, dishon the sale of drugs goes directly to the nurses. This
payment scheme (fee-for-service plus drug sales) can
est, or disrespectful [12, 16, 17,30,45,49-53].
The longitudinal study presented here was carried be considered as a good example of current practices
out in a rural health zone in Zaire. It aimed primarily under the Bamako Initiative, even though it was
to evaluate the impact that the different components implemented five years before the BI was launched in
of the supply of services has on the level of activity 1987.
The quality of service delivered in the ZSR of
of public health facilities. The study focused on an
analysis of the consequences of changes in cost and Nioki is quite high as compared with other zones in
quality in a zone offering a high degree of accessibility Zaire or similar settings in Africa. As a result of a
good operations in the system, drugs are available in
and quality of services in the African context.
all the health centres. Standardized protocols of
Study setting
treatment have been established. To ensure that
The Nioki rural Health Zone (hereafter referred to complete cures are administered, drugs cannot be
using the French acronym ZSR: Zone de Sante sold by the unit. Lastly, the nurses' skills and knowl-
j
Iv
I
I
;■
!
1
*
Quality, cost and utilization of health services in developing countries
"45
edge are kept up-to-date through refresher training
sessions and there is regular stringent supervision of
deflated on the basis of the monthly inflation rates
observed in Kinshasa.
the nursing staff.
Interviews with administrators and nurses of the ZSR
The interviews with ZSR administrators aimed to
validate
the operational data collected and to gather
METHODS
missing information. The administrators were asked
The study is longitudinal, covering a 60-month
to rate each of the nurses in the zone according to
period from January 1987 to December 1991. It uses their technical competence, interpersonal qualities,
qualitative and quantitative data drawn from three and integrity. Then, open-style interviews were con
main sources briefly described below. All of the ducted with the nurses and midwives to qualify the
information was collected on site by the researchers perceptions of the staff members in terms of: (1) the
with the cooperation of the BCZSR.
local structure of the supply of health services (exist
ing health care providers, visits by the population,
etc.); (2) health-seeking action of the villagers (domi
Administration data*
nant therapeutic sequences, links between morbidity
We constituted a cohort of the 21 rural centres open
on 1 January. 1987 to follow the evolution in their and utilization, etc.): (3) the evolution of the centre s
monthly activity from that date to December 1991. activity; (4) causes of changes observed: and (5) howWe were able to construct and validate monthly much importance the population attaches to the
reports of new cases, as well as quarterly reports of different components of quality.
new cases of malaria for each centre. Each month, a
Semi-structured interviews with the villagers^
utilization coefficient was calculated for each centre
The first theme addressed in these interviews re
by dividing new cases by population served by the
centre. For each month, we counted the number of ferred to the characteristics of the population in the
centres: (1) which came into service after the begin health area, with the accent placed on details about
ning of the study; (2) in which there was a certified the local context. The villagers were then questioned
nurse; (3) equipped with a microscope: and (4) reno- about their usual utilization patterns and the influ
vated.t Three cost indices were compiled: the first ence of cost, accessibility and illness on these pat
deals with fees for consultations, the second is based terns. Then, the discussion focused on perceptions of
on the costs of four common drugs, and the third is the quality of the services. Many questions referred to
an overall index, weighted in terms of the average what villagers consider to be the top qualities of
relative cost of the consultations and drugs used by nurses and whether the qualities of the nurses had an
a household.; Each of these three indices was then effect on their health-seeking strategies. Other ques
tions focused on the effect of the presence of a
microscope or renovated facilities on their health
♦The BCZSR information system is functional and reliable.
The operational data is systematically recorded and decisions.
We also added several questions to a parallel
compiled on a monthly and quarterly basis by the
research study of 228 mothers who had recently
nurses. The record-keeping is monitored and checked
during regular supervisor} visits made by the BCZSR.
delivered babies A These questions focused on: (1)
til should be borne in mind that throughout the period
actions that these women (or other members of their
studied, supplies were by and large regular: thus it was
not possible to directly evaluate the impact of the family) followed during their most recent episode of
illness; and (2) their perceptions and expectations
continuity of supplies on the level of activity.
JA detailed description of how the indices are constructed concerning the qualities of the health care personnel.
can be found in Ref. [22].
§Members of the health committee, village authorities,
patients of the centre or passersby. It should be noted
RESULTS
that the purpose of these interviews was not to carry out
a precise survey on the health behaviour of the house
A considerable decrease in activity was observed
holds. Instead the goal was to improve our knowledge
of the evolution of different parameters influencing over the 60 months of the study. On average,**
utilization of the health centres and to improve the utilization in the cohort dropped by close to 40% (see
validity of our results by studying this information in Fig. 1). There are major seasonal fluctuations in
relation to the statistical data collected and the state
activity. It rises during the height of the rainy season
ments of the nurses and key informers.
*]Study conducted by Mr Karl I. Taj Nawel; the results are (December and January) when the incidence of com
municable diseases is higher, the rivers are too high
to be published shortly.
♦♦The use of averages rather than totals is justified because
for fishing, and there is little work in the fields. It
certain data is missing. The use of a variable such as
during the dry season when the villagers are
drops
“total new monthly cases in all of the centres in the
busy
and working the fields and their financial
fishing
cohort'' would result in a systematic bias and an under
estimation of the actual values.
liquidity is lower (April to August). The
test
+tThe null hypothesis is: all the monthly seasonal indices judging the presence of a monthly component is
equal 1. The alternate hypothesis is: at least one of the
highly significant (/2 = 62: P < 0.001ft) [54].
monthly indices is different than 1.
Slim Haddad
746
and Pierre
Fournier
Costs
Utilization
10
180
9
Original Values
8
7
6
100
Deflated Global
Cost Index
5
.1
4
Values after correction
for seasonal variations
3
I
t-1 -t I I Ul I ■ 4 I i I i L ■ I 1 i-l-i-4-^
I ! 1 I ! I I i I I II i I i I i M I ! i I I J-i I I I I i
Sc
£
2
£
O'
1
i
I
I
i
>>
«
r
s
20
«
Fig. 1. Utilization (month!) average utilization coefficient) and costs (1987-1991).
The profiles of those who sought treatment in the
health centres changed over the course of the study.
The number of cases of malaria* recorded dropped
even more than the total number of cases. On aver
age. 48% of the new cases in 1987 were attributed to
malaria. This figure dropped to 41 % in 1991. Accord
ing to the administration and staff in the zone, this
drop cannot be explained by an endemic reduction in
malaria, but rather is the result of changes in the
health-seeking behaviour of the local population.
Effects of changes in costs
The ZSR fees increased dramatically between
January 1987 and December 1991. The fee for consul
tation increased 94 times in current zaires and that for
medications rose 100 times. Overall, these increases
outstripped inflation rates. The actual cost of utiliz
ation (inflation aside) thus also increased, following
a trend clearly opposed to that of new cases (see
Fig. 1). To study the degree of association between
*The cases listed under the diagnostic category of “malaria"
include not only cases of malaria, but also feverish bouts
which indicate this diagnosis and are considered by the
patients and nurses to be cases of malaria.
tTwo types of analyses were used. The first was based on
ARIMA models: the second on linear regressions where
auto-correlation is corrected by the so-called iterative
approach. Both generated comparable results. Here we
are presenting only those results obtained with the
second method, which is easier to interpret.
Jin Zaire, more than 200 nursing schools, the majorit) of
which are private and/or illegal, have trained a plethora
of nurses and private nurses can be found even in small
rural villages.
series of costs and utilization, we resorted to statisti
cal models which take into account the auto
correlation components of temporal seriest [55]. The
first model relates the average utilization coefficient,
corrected for seasonal variations, to two variables:
the global deflated index and the number of centres
opened after the study began. This last variable was
considered a potentially confusing factor: it was
introduced to allow for modifications in the catchmem areas of the centres in the cohort to be
considered in the cost-effect analysis. In the
second model, the global index is replaced by
indices of drug prices and episodes (Table 1). In
both models the independent variables are signifi
cantly associated with the level of activity. The
total explained variance (R2) is 50 and 56%. The
partial determination coefficients of the costs, for
which we assigned minimal and maximal values
because of the presence of multicolinearity, range
from 18 to 32%. As Fig. 1 suggests, this association
between costs and activity seems strong from the
second to the fifth year of the study (it is not
the case in the first year where covariations were
modest).
The interviews with the staff members and the
villagers suggest that the changes in cost had modified
some characteristics of both demand for and supply
of public health services.
(a) Modifications in demand. Many nurses stated
that they are seeing more and more patients who had
previously been seen by other providers (drug sellers,
traditional practitioners, private nursesj and other
informal resources) and that the public would only
/47
Quality, cost and utilization of health services in developing countries
Table 1. Results of regressions—Model I and Model 2. Dependent variable. monthly utilization coefficients after correction for seasonal
variations
Model 2
Model I
Independent variables
Intercept
Global price index
Price index—episodes
Price index—drugs
Opening of new HCs
General linear lest
Total contribution (R2)
Partial R2
Coefficient
Partial R2
Coefficient
Minimum R2 Maximum R2
Bela
B. Stand.
6.5*
-0.022*
-0.409
18.7%
32.5%
-0.189*
-0.389
17.2%
30.9%
Beta
B. Stand.
Minimum R2 Maximum R2
7.3*
F = 24.64; P < 0.0000
49.6%
-0.006*
-0.017*
-0.157*
-0.462
-0.377
-0.343
20.6%
18.1%
13.5%
24.7%
22.2°/o
17,6%
F = 21.06: P <0.0000
56.3%
*P < 0.01 (/-statistic)
come to the centre later on. if these first treatments is their fear of seeing the public turning to the
failed. This was confirmed by several villagers who competition. Nevertheless, they seem more inclined
told us that they cut back on their visits to the health to resist requests to waive the registration fee than to
centre, restricting them to situations where they felt pressure regarding the sale of drugs by the unit. Some
that the health problem was particularly troubling. nurses say they compensate for their refusal to waive
Some said that when the illness was not serious, they the registration fee by extending better payment
id not use any treatment at all and others admitted conditions and allowing greater flexibility in terms of
that they buy more drugs outside of the public the drus. quantities. One explanation for this resist
ance is that waiving the registration fee translates into
facilities than they did before.
Several nurses feel that even though they charge a loss of income for the centre and the nurses have
more for drugs than the zone does, the private nurses a vested interest in the amount collected. In addition,
and sellers are successful because they “do not charge the nurses and midwives are often frustrated because
for the card” and they are willing to sell drugs by the the public does not give them enough recognition for
unit (a practice which, in theory, is prohibited in their work and their technical training. “People do
public services). The villagers go to these private not want to understand that they are paying for the
resources to buy their prescriptions one day at a time, work that is done and not for the paper. We are
as long as they feel it is necessary. One nurse com nurses, not pharmacists.”
ments that even though the drugs sold by the private Effects of the changes in quality
resources are more expensive (penicillin is sold for
(a) Impact of microscopes and renovations. During
25.000 zaires as opposed to 15,000). the total cost of
the treatment is less. He reports that each time the the study period, the number of centres equipped
zone modifies its fees (which have to be posted at the with microscopes rose from 12 to 16. We expected the
door), the private nurses in the village come by to allocation of microscopes, requested by the village
check them so that they can readjust their prices. health committees, which assumed the acquisition
Finally, the nurses and health committee representa costs, to be positively associated with utilization. The
tives report more and more requests from the public statistical analysis did not reveal significant associ
for credit. “Many of those who no longer come were ations between the number of microscopes and ac
on credit: they have not repaid their debts and now tivity. though the interviews with the nurses and
villagers strongly suggested the existence of these
they do not dare to come when they are sick.”
The increased costs had a more significant impact associations. The nurses felt that the centres without
on malaria patients than on those who suffered from microscopes were at a disadvantage and that even
illnesses which were considered more serious or more though microscopic tests were expensive, many
difficult to treat. Malaria is in fact so common that patients came solely for that purpose. Some expressed
it is often regarded as a matter of course. In addition, the opinion that microscopes were one of the primary
most of the villagers know how to recognize and treat assets of the zone centres as compared to the
malaria themselves. Thus, people do not necessarily “private” resources. All those working in centres
have to seek treatment from the health centre since equipped with a microscope stated that the loss of it
there are numerous ways to procure antimalarial would lead to a decrease in the centre's activity, even
drugs (travelling drug sellers, dispensing pharmacies, to a “uprising among the citizenry.’
The villagers appear to be unanimously in favour
informal sources, friends and relatives, etc.).
of
microscopes: “You can see diseases in the blood
(b) Modifications in supply. Most of the nurses
stool. ” “It keeps nurses from using guesswork to
and
bend to these requests. They justify these practices by
prescribe
treatments.” “It can see what the nurse
humanitarian concerns, citing the need to do some
can
t.
one of the centres, the villagers had such
’
”
In
thing for the poor and elderly. The second reason
image
strong
of their microscope that when they
a
they give, and probably the more important reason.
748
Slim Haddad
and Pierre
were asked what they would do if it disappeared, their
first response was “the microscope cannot disap
pear!’’ They then admitted that they would probably
go to another centre. Most of the villagers say that
they are ready to travel to a centre further away from
their home for a microscope.
During the study period. 14 of the 21 centres of the
cohort were renovated. Here too. we did not find a
significant statistical association with the level of
activity in the health centres. However, this finding
was not surprising. Even though the renovations had
the support of the health committees, improving the
quality of the building seemed to correspond more to
a professional vision of quality than users' percep
tions. The villagers seemed very happy that their
health centres were being renovated. Obviously, the
village derives some prestige from having a pleasant
health centre and the inhabitants can be proud of
it. Yet, the renovation seems less important than
the microscope and whether or not the centre was
renovated did not have a true influence on utilization
patterns. All of those interviewed told us that they
would prefer an unrenovated centre equipped with a
microscope to a renovated one. with no microscope.
Some were amazed that we even asked them this
question since the answer was so obvious: “Even if
there were no walls, what counts is that there is a
microscope in the centre.” “It's not the centre or the
paint on the walls that will cure people.’*
(b) Effect of sex. length of stay, and qualification of
the nurses. The majority of those interviewed prefer
male certified nurses. According to a few people, this
is because “men are more competent.” even though
women are “more compassionate.’* Most often, how
ever. it is because the men are “braver” and more
available and they can “stand more than women.”
Though there is a clear preference for men. this does
not seem to have an influence on utilization patterns.
None of the respondents indicated that he would
leave the centre if it was run by a woman. There is
no evidence of a systematic rejection of women
nurses.
Insofar as length of stay of the nurses, our subjects
were usually in favour of keeping their nurse on the
job for a long period of time. This opinion, however,
is always conditional: “on condition that he is good,”
“on condition that he receives patients warmly.” “on
condition that he works well,” and so on. Some
villagers think that a nurse should not stay in the
same job for too long because “after 2 or 3 yr, the
people know his weaknesses” and he will be subject
to pressures which could be harmful to the centre.
However, a high turnover of certified nurses does not
seem to have a significant impact on the evolution of
the activity in the health centres even if the people
often say that they wish to avoid such a situation.
This impression coincides with the findings of the
multivariate statistical analysis which did not reveal
a significant association between the utilization of the
HCs in the zone and the number of centres in which
Fournier
the certified nurse has been working for more than 3
months.
Lastly, the villagers do not seem to focus on the
official qualifications of the health care staff nor do
they use this as an important criterion to judge them.
In fact, most of the villagers do not seem aware of the
difference between an A2 nurse (4 yr of professional
training) or an A3 nurse (2 yr of training).
(c) Effects of the qualities the villagers attribute to
the staff. We did not use statistical models to assess
the global impact of the nurses’ qualities on the
evolution of the activity: instead qualitative ap
proaches were used to shed light on this centre issue.
A prerequisite to the analysis of these effects was to
identify which qualities the community valued in
health personnel. The responses of the 228 women
who were surveyed show that these mam qualities
were conduct and technical competence and to a
lesser extent, integrity. The top quality mentioned (by
96%) was the nurse's interpersonal qualities (respect,
patience, courtesy, attentiveness, friendliness, and
straightforwardness) while technical qualities (good
treatment, good work, good diagnosis and punctual
ity) were listed by only 4%. In response to a question
about the second quality of a good nurse. 86% of
those who mentioned conduct first, chose technical
next and 68% of those who mentioned technical first,
chose interpersonal qualities second. In all, over
four-fifths of the respondents placed the relational
aspects first, followed by the technical ones.
These findings are corroborated by the interviews
in the villages, though the predominance of the
relational components is less marked and honesty is
a quality which seems more important than it ap
peared in the survey of the women. The quality of the
reception was mentioned very often. A good nurse is
one who “knows how to welcome you” and “receives
people well.” The initial greeting is of prime import
ance since “even if he is competent, a nurse who does
not extend a warm greeting is discouraging ” and
therefore his treatment cannot be effective. The re
lations with the community outside of the centre, and
in particular, respect for women is often mentioned,
especially in the villages where there have been
problems with “playboy nurses.”
Most of the time, competence is judged according
to results: a competent nurse “cures us when we are
sick,” his treatment is effective and leads to a quick
full recovery (especially for children). The quality of
the process and the relevance of the diagnosis are also
common criteria. The good nurse “works well” and
“provides proper care.” He also has to prescribe
medication in accordance with the illness. Another
criterion used to evaluate competence is whether or
not the nurse's recommendations and decisions are
deemed to be well founded by other a priori
more qualified health workers. For example, when a
patient is transferred to the Nioki hospital, a nurse’s
decisions should not be reversed by those working
there. In a rural centre, the good nurse is considered
<
4
r
i
I
■■
|
i
*
S
£
'=
Quality, cost and utilization of health services in developing countries
*
one “who provides treatment on-the-spot, ” and does
not transfer patients to Nioki.
All the villagers we met reported that they linked
their health care decisions to the qualities they at
tribute to the nurses. In order to shed more light on
this relation, the following sections report two
examples drawn from the 11 case studies. The first
one deals with technical matters and the second one
with the nurses* behaviour.
Example /. The Inunu centre, like many others,
experienced a marked decrease in activity during the
period studied due to rising costs and competition
among providers. From January 1987 to June 1990.
the drop in activity was about 60%. Following this
drop, the centre faced a sudden rise in monthly users:
from 39 in October to 142 in June. Then the activity
decreased steadily, and by December had returned to
the levels of June. That sudden peak closely followed
the death of a child who had been placed on intra
venous by the “private" nurse of the village and then
'eloped a fatal case of septicemia. This death
caused a big stir in the village and prompted all of the
“private" nurse's patients to go running back to the
centre which they considered less “dangerous." Ac
cording to the nurse in the centre, after a few months,
as the villagers' “memories faded." those who had left
the private nurse gradually went back to him.
Example 2. The nurses Mon. . . and Mpe. . . Mon. . .
is probably the most competent nurse in the zone (he
earned the highest score on the BCZSR's technical
evaluation), but he conducts himself poorly and lacks
integrity. In the three villages where he worked, none
of our respondents had anything negative to say
about his competence, but they all complained about
his conduct, especially his lack of warmth in dealing
with patients and his lack of respect for the villagers.*
In two centres, following Mon. . .'s appointment,
there was a brief increase and then a decrease in the
nber of the monthly users. It is possible that in
tuese two centres, part of the population was initially
attracted by his competence, but after a while he was
rejected because of his attitudes and conduct. The
third centre experienced an extreme drop in activity
when Mon. .. worked there and we thus defined the
Mon. . . effect as: “A drop in utilization follows the
appointment of a nurse who is competent, but whose
conduct is highly offensive.”
Mpe.. .’s competence is considered by the central
bureau as “average to good” and his conduct and
integrity are judged “excellent.” He worked in two
villages where he clearly had a favourable image:
people remark on his modesty, sobriety, personal
warmth, and his respect for his patients and the
■>
*While we did not meet him in person, the villagers'
descriptions of Mon. . . paint a portrait of a very arro
gant individual: a beer-drinking, womanizing young
man. self-confident and aware of his privileged back
ground and the advantages that his level of education
and his technical competence carry.
749
villagers. During our visit, we noted that in contrast
to some of his colleagues. Mpe.. . was unpretentious
and respectful in dealing with the people that we
questioned. In the first centre, the annual average
utilization coefficient has strongly decreased since
Mpe... left the centre. In the second, his arrival
coincided with a clear rise in the level of activity. In
the two villages, several respondents declared that
Mpe.. .’s transfer had modified the villagers’ health
seeking practices. These observations led us to formu
late the Mpe. .. effect as: “The appointment of a
relatively competent nurse whose strength lies in
interpersonal relationships has a positive influence on
the activity of a centre."
It is difficult to say whether or not the “Mon...”
and “Mpe. .." effects are epiphenomena, since so few
nurses received such divergent evaluations and were
the subject of such clear positions expressed by those
we interviewed. It is clear, however, that interactions
between the local population and those appointed to
work in the health centres influenced the level of
activity.
DISCUSSION
A complex phenomenon like utilization trends of
public modern health services over a period of several
years and the role of its various determinants can be
understood only by using qualitative and quantitative
methods applied to different units of analysis. In the
specific context of Nioki. where utilization of the
public health services dropped dramatically over a
5 yr period, utilization is significantly associated with
the deflated costs even after controlling for poten
tially confusing factors. The observed partial determi
nation coefficients for costs suggest that 18-32% of
the variation of the utilization can be explained by
cost variations. However, these values cannot be
compared to other results since previous longitudinal
studies published in developing countries did not use
statistical tests to quantify the long range effects of
costs.
The increased costs have had effects on the demand
for and the supply of health services. First they
reduced the demand for the services provided by the
zone in cases of common diseases like malaria. Sec
ond. the villagers have made a partial substitution of
sources of care and supply even though in most of the
villages the unit cost of drugs sold by the health
centres is lower than that of the “private” resources.
So the public responded not only to the unit cost of
drugs and services, but especially to the total amount
that they had to spend. Third, the villagers requested
more credit, fee exemptions and drugs sold by the
unit to decrease their expenses. Many nurses ac
knowledged that they had adjusted their practices in
response to these pressures. With regard to this, they
demonstrate a more sophisticated sense of marketing
than the central office. The way that they work
around the official regulations illustrates their ability
750
Slim Haddad
and Pierre
Fournier
to adapt to the changes: to the consequences of the higher than that of the neighbouring centres and the
increase, the loss of buying power among the people cohort (even after excluding the patients who reside
outside of the health area, the monthly utilization
and the pressures that they face.
It is well known that improving the drug supply is coefficient at the Mesilo centre is on average still
the first attribute of quality which leads to a dramatic much higher than that of the cohort: 8.5% vs 5.8%).
increase in utilization of health services. Availability The most plausible explanation for these differences
is in the relations between the community and the
of drugs was not a problem in this setting, although
nurse. Mesilo is the only one of the eleven centres
the zone attracted patients from neighbouring zones
because of the availability of drugs. Renovation had visited where the nurse on duty has not changed since
1987 and the inhabitants of Mesilo have never re
no effect on the villagers' utilization patterns even
though it was an important concern for the nurses quested that the BCZSR transfer him. There has been
and the administrators of the zone. The villagers were a considerable sustained cooperation between the
clearly in favour of microscopes, another aspect of nurse and the chairman of the health committee, who
technical quality. However, the acquisition of micro is a traditional practitioner. This cooperation, which
scopes did not generate global changes in utilization must be very reassuring to the local residents, con
tributes to reinforcing the image of quality and
patterns, even though many respondents reported
that they consider the presence of microscopes in competence of the health care team. On the contrary,
their health-care decisions. The effects of microscopes the Mpole centre has had six different certified nurses
may be modest or non-existent. As the number of during the study period and relations between them
microscopes presented few variations, a lack of power and the villagers have never been satisfactory. We
were told of various incidents where the local people
in statistical analysis could also be responsible of the
and the nurses clashed and two out of these six nurses
non significant associations observed between utiliz
were judged very harshly by those we interviewed.
ation and microscopes.
Activity in the health centres was closely related to The integration of the nurses in the local community
the changes in personnel. As the Mpe. .. and Mon. . . was difficult. Since the population had a reputation
for being “difficult” and very attached to traditional
examples show, the villagers were very sensitive to the
conduct and interpersonal skills of their nurses. The beliefs, the nurses’ motivation was low and they did
not like this low-paying and out-of-the-way centre.
competence attributed to the nurses and, in particu
lar. the results of their care (the example of Inunu is Indeed a transfer to Mpole is often seen as a disci
particularly instructive in this regard) clearly influ plinary measure prompted by problems in another
enced the patients’ decisions to seek services. Because centre (conflicts with the locals, misappropriation of
funds, poor performance, etc.). Shortly after we
competence is seen as perfectible whereas interper
sonal skills are not, the villagers prefer a nurse of visited Mpole, the health committee sent a request to
average competence with good interpersonal qualities the central bureau in which it explained that as a
to a competent one with poor interpersonal skills. result of the excesses of the preceding nurse and the
Even if costs seem to have a negative impact on constant turnover of certified nurses, the villagers
utilization and some other factors a positive impact, were requesting that the departing nurse not be
replaced, that the nurse-midwife be certified and that
it is not easy to assess how these divergent determi
nants interact. This can be illustrated by the case of a new birth attendant be assigned to perform deliver
the centres of Mesilo and Mpole. These two villages ies.
These two cases illustrate how cost and quality
are about 15 km apart and both centres face strong
interact. In contrast to most of the other centres, the
competition from numerous traditional practitioners.
attraction that Mesilo has for the local population
In Mesilo. the activity has not followed the general
trend in the zone and there was only a minimal drop and that of the neighbouring villages has played a
in utilization over the period studied. Moreover, the “protective” role, compensating somewhat for the
negative effects of the cost increases. On the contrary.
monthly utilization coefficient is one of the highest in
Mpole seemed to be the example of the type of village
the zone (9.3% on average vs 5.8% for the entire
cohort). Mpole’s profile of evolution is diametrically in which the increased fees had the maximum impact.
The unsuccessful integration of the nurses and a
opposed: there has been a constant and pronounced
negative perception of them by the local population
decrease in the number of patients, the monthly
utilization coefficient for the centre is on average probably aggravated the decrease in the number of
5.4%.
patients using the centre.
A study of the Mesilo centre's records shows that
approx. 20% of its patients come from villages
CONCLUSION
located outside of the catchment area. These patients
This study confirms, as other longitudinal studies
give two main reasons for coming to the Mesilo
that in the long term, major increases in cost
have,
centre: the microscope and the certainty of finding
drugs. Nevertheless, the microscope and the avail (higher than inflation) have a negative impact on the
utilization of health services. It identifies the aspects
ability of drugs cannot explain the fact that the level
of quality of care that may compensate for this
and the trend in utilization at Mesilo is so much
I
I
I
J
|
i
1
!
I
751
Qualiu. cost and utilization of health services in developing countries
Quality
Availability of drugs (+++)
Presence of microscopes (?)
Centres renovated (0)
Competent nurses (++)
Good interpersonal skills (+++)
Increase in costs
¥
Demand for health services
- Decrease
- Shifts in sources of care
Reduction in Utilization
A
Requests for credit
Requests for fee exemptions
Requests to buy drugs by the unit
Changes in nurses' practices
Fig. 2. The effects of costs and quality on utilization in Nioki
situation and shows how cost and quality
interact.
Cost seemed to be a major criterion in the choice
of resources in this context where many of the people
are poverty-stricken and the competition between
providers is strong. However, other components of
the supply of services also had an influence on the
tilization of the health centres. Technical aspects of
the quality had variable effects, but the image of
quality projected by the nurses clearly influenced
utilization patterns.
The reduction in the utilization of public services
occurred within a context where the services were
considered to be of excellent accessibility and good
quality, higher than those in many similar settings.
Moreover, the “technical quality” had even improved
over the course of the period studied. Yet, neither the
steady supply of drugs, nor the relative competence
of the nurses, nor even the substantial improvement
of the infrastructures and the equipment were able to
offset the drop in activity due to the increased costs.
However, as some examples suggest, good quality of
services can partially compensate for the negative
effect of the prices. This protection, however, is highly
*Incidentally. a recent study in Cameroon used the same
expression [48). In that case, the equation appeared valid
but the measure of quality was based only on the
availability of drugs and shortages of drugs was an
important characteristic of the study setting.
relative. On the one hand, it always occurs on a ven
local level and in situations which, all things con
sidered. are marginal. On the other hand, of all the
components of quality examined, only that related to
the interpersonal relations between the local people
and the health workers seems to be truly able to
secure this protection. Figure 2 presents our in
terpretation of the dynamic process that linked costs,
quality and utilization in Nioki during the study
period.
This study suggests that the dictum according to
which an increase in the quality of services compen
sates for the negative effect of the increased costs of
these services is only partially valid and that it would
be very difficult for this statement to serve as the
basis of a revision of the strategies for service deliv
ery. This brings us back to the concerns already
raised about the inequitable nature of the effects of
the Bamako Initiative. At the same time, we might
ask if those who defend the equation “increase in
costs 4- improved quality = increase in utilization”
have not advanced this idea simply to justify the
introduction or increase in user fees in public services,
following what is an essentially accounting logic.*
The “technocratic” vision of quality that health
care authorities have and the vision that the general
public has are not necessarily congruent. Authorities
are least aware of the interpersonal relationships
which may partially compensate for cost effects and
■'i
Slim Haddad
752
and Pierre
for which they are least capable of introducing
changes. As illustrated in a recent UNICEF update
on the progress and obstacles to the implementation
of the Bamako Initiative [56], they place more empha
sis on the technical competence of the staff, supply
and distribution of drugs, availability of equipment
and infrastructures. But for the general public, the
meaning of quality could be primarily respectful
personnel, availability of drugs and effective care.
It is a major undertaking to improve the quality of
services in a way which will be appreciated by users.
Improving drug availability and accessibility is cer
tainly a first priority and often a major challenge, *
but once this goal is reached, further improvements
in quality will require far-reaching modifications of
the attitudes held by health care planners whose
values most often reflect that of the biomedical or
accounting logic models. These changes also raise the
question of the relationships between the public
authorities and the people they serve in countries
where democracy or any form of dialogue still re
mains to be invented.
Acknowledgements—The authors would like to thank Dr J.
Pepin of Dniversite de Sherbrooke, head of the project for
the Nioki Rural Health Zone. They would also like to thank
Ds L. Ethier. F. Milord. Mr M. kaliala. Dr L. Lutete and
Mr I. Bongla as well as all the other members of the central
bureau who so graciously helped with this research. They
would also like to thank their colleagues R. Pineault and
A. P. Contandriopoulous for having read and provided
valuable comments on the first drafts of this article. This
research was made possible through the support of the
International Health Unit of the Faculty of Medicine at the
Universite de Montreal. The field work was carried out with
funding provided by the Canadian International Develop
ment Agency.
REFERENCES
1. Vogel R. J. Cost recovery in the health care sector.
Selected country studies in West Africa. Wld Bank,
Technical paper No. 82. 1988.
2. De Ferranti D. Paying for health services in developing
countries. An overview. World Bank staff working
papers, 12, 111, 1985.
3. Akin J. S.. Birdsall N. and De Ferranti D. Financing
health services in developing countries: an agenda for
reform. Wld Bank, 1987.
4. Akin J. S., Griffin C. C.. Guilkey D. K. and Popkin
B. M. The demand for adult out patient services in the
Bicol region of the Philippines. Soc. Sci. Med. 22, 321,
1986.
5. Heller P. S. A model of the demand for medical and
health services in peninsular Malaysia. Soc. Sci. Med.
16, 267, 1982.
6. Gilson L. Government health care charges: Is equity
being abandoned? Evaluation and Planning Centre for
Health Care, London E.P.C.. Publication No. 15 (1988).
7. Stanton B. and Clemens J. User fees for health care in
developing countries, a case study of Bangladesh. Soc.
Sci. Med. 29, 1199, 1989.
*The 50% devaluation of the Franc CFA (Communaute
Financiere de 1'Afrique) in 14 African countries on
January 1994 will make it more difficult.
Fournier
8. Yoder R. A. Are people willing and able to pay for
health services. Soc. Sci. Med. 29, 35. 1989.
9. Nnadi E. E. and Rabat H. F. Choosing health care
services in Nigeria: a developing nation. J. Trop. Med.
Hygiene 87. 47. 1984.
10. Bailey W. and Philips D. R. Spatial patterns of use of
health services in the Kingston metropolitan area. Ja
maica. Soc. Sci. Med. 30, 1, 1990.
11. Chernichovsky D. and Meesook O. A. Utilization of
health services in Indonesia. Soc. Sci. Med. 23, 611,
1986.
12. C.R.D.I. La medecine traditionnelle au Zaire. Fonctionnement et contribution potentielle aux services de
same. Ottawa 63 pp.. 1979.
13. Gertler P., Locay L.. Sanderson W., Dor A. and Van
Der Gaag J. Health Care Financing and the demand for
medical care. Wld Bank LSMS 37. 62. 1988.
14. Wong E. L.. Popkin B. M., Guilkey D. K. and Akin
J. S. Accessibility, quality of care and prenatal care use
in the Philippines. Soc. Sci. Med. 24, 927. 1987.
15. De Bethune X., Alfani S. and Lahaye J. P. The influence
of an abrupt price increase on health service utilization:
evidence from Zaire. Hl th Pol. Plann. 4, 76. 1989.
16. Waddington C. J. and Enyimayew K. A. A price to
pay: the impact of user charges in Ashanti-Akin
district. Ghana. Int. J. Hlth Plann. Management 4, 17,
1989.
17. Waddington C. J. and Enyimayew K. A. A price to pay,
part 2: The impact of user charges in the Volta region
of Ghana. Int. J. Hlth Plann. Management 5, 287, 1990.
18. UNICEF. Revitalisation des SSP/SMI. LTnitiative de
Bamako. Rapport d’activites presente au conseil
d'administration de I'Unicef en 1990. UNICEF, Avril.
1990.
19. Creese A. L. User charges for health care: a review of
recent experience. Hlth Policy Plann. 6, 309, 1991.
20. Xingyuan G., Bloom G., Shenglan T., Yingya Z.. Shouq
Z. and Xiingbao C. Financing health care in rural
China: Preliminarv report of a nationwide study. Soc.
Sci. Med. 36, 385^ 1993.
21. Kanji N. Charging for drugs in Africa: Unicef’s
Bamako Initiative. Hlth Policy Plann. 4, 110, 1989.
22. Haddad S. Utilisation des services de sante en pays en
developpement. Une etude longitudinale dans la zone de
sante rurale de Nioki au Zaire. PhD Thesis. Universite
Claude Bernard. Lyon. France. 1992.
23. Kroeger Z., Zurita A.. Perez-Samaniego C. and Berg H.
Illness perception and use of health services in north
east Argentina. Hlth Policy Plann. 3, 141, 1988.
24. U.S.A.I.D. Etude sur le financement des zones de sante
au Zaire. Projet Reach. 1986.
25. Kloos H., Etea A.. Degefa A. Aga H., Solomon B.,
Abera K.. Abegaz A. and Belemo G. Illness and health
behaviour in Addis Ababa and rural central Ethiopia.
Soc. Sci. Med. 25, 1003. 1987.
26. Kloos H. Utilization of selected hospitals, health centres
and health stations in central, southern and western
Ethiopia. Soc. Sci. Med. 31, 101. 1990.
27. Glick D. C.. Ward W. B., Gordon A. and Haba F.
Malaria treatment practice among women in Guinea.
J. Hlth Soc. Behav. 30, 421. 1989.
28. UNICEF: Fabricant S. J/ and Kamara C. W. The
financing of community health services in Sierra Leone:
seasonality, socio-economic status, gender and location
factors affecting access to services. UNICEF Bamako
Initiative Technical Report Series 8. 1991.
29. Annis S. Physical access and utilization of health ser
vices in rural Guatemala. Soc. Sci. Med. 15d, 515, 1981.
30. Abu-Zaid H. A. and Dann W. M. Health services
utilization and cost in Ismailia. Egypt. Soc. Sci. Med.
15b, 45. 1985.
31. Murphy M. and Baba T. M. Rural dwellers and health
care in northern Nigeria. Soc. Sci. Med. 15a, 265, 1981.
g
1
I
I
I
I
I
1
I
I
■
4
Quality, cost and utilization of health, serves it deveLoping smaknes
32. Berman P. A. Village health workers in Java. Indonesia:
Coverage and equity. Soc. Sci. Med. 19, 411. 1984.
33. Berman P. A., Ormond B. A. and Gani A. Treatment
..r-o
and PYnenditiiTP
use and
expenditure nn
on cnrativp
curative rare
care in
in rural
rural Indonesia
Indonesia.
Hlih Policy Plann. 2, 289. 1987.
34. Sauerborn R.. Ngoutara A. and Diesfeld H. J. Low
utilization of communith health workers: results from a
household interview survey in Burkina Faso. Soc. Sci.
Med. 29, —
1163, —
1989.
35. Van Luijk J. M. Profile expectation and satisfaction of
outpatients (1970-1972). Trop. Geographical Med. 31,
»
533. 1979.
36. Mwabu G. M. Health care decisions at the household
level: results of a rural health survey in Kenya. Soc. Sci.
Med. 22, 315. 1986.
M 37. Stock R. Distance and the utilization of health facilities
in rural Nigeria. Soc. Sci. Med. 17, 563, 1983.
38. UNICEF: Parker D. and Knippenberg R. Community
cost-sharing and participation: a review of the issues.
L-NICEF: Bamako Initiative Technical Report Series 9.
New York, 1991.
39. UNICEF: Less unites sanitaires de base—Presentation
des premiers resultats du programme national de soins
de sante primaires en Republique Islamique de Maurinie. UNICEF: L'Initiative de Bamako Rapport techrque No 11. New York. 1991.
40. De Walt K. M. The illnesses no longer understand:
changing concepts of health and curing in a rural
&•
community. Med. Anthrop. Newslett. 8, 5. 1977.
41. Abosede O. A. Self Medication: an important aspect of
primary health care. Soc. Sci. Med. 19, 699, 1984.
42. Ben Youssef A. and Wessen A. F. Utilization of health
services in developing countries—Tunisia. Soc. Sci.
Med. 8, 287, 1974.
43. Slikkerveer L. J. Rural health development in Ethiopia.
Problems of utilization of traditional healers. Soc. Sci.
Med. 16, 1859. 1982.
44. Wahid Saeed A. A. Utilisation of primary health ser
vices in Port Sudan. Trop. Geograph. Med. 36, 267,
1984.
45. Zwart S. and Woorhoeve W. A. Community health care
and hospital attendance: a case study in rural Ghana.
Soc. Sci. Med. 31, 711. 1990.
I
it
I
753
46. Unger J. P. and Diao M.. From Bamako to Kolda: a
case study of medicines and the financing of district
health services. Hlth Pol. Plann. 5. 367, 1990.
47. Haddad S. and Fournier P. Initiatives de Bamako.
Systemes de paiement et utilisation du medicament.
Position du probleme. aspects conceptuels et methodologiques pour une recherche multicentrique. Rappori
de recherche, 1993.
48. Litvack J. L. and Bodart C. User fees plus quality
equals improved access to health care: results of a
field experiment in Cameroon. Soc. Sci. Med. 37, 369.
1993.
49. Bichman W.. Diesfeld H. J.. Agboton Y.. Gbaguidi
E. A. C. and Simhauser U. District health systems:
users' preferences for services in Benin. Hlth Policy
Plann. 6, 361. 1991.
50. Lasker J. N. Choosing among therapies: illness
behavior in the Ivory Coast. Soc. Sci. Med. ISA, 157.
1981.
51. Kroeger A. Anthropological and socio-medical health
care research in developing countries. Soc. Sci. Med. 17,
147. 1983.
52. Swantz M. L. Community and healing among
the Zaramo in Tanzania. Soc. Sci. Med. 13b, 169.
1979.
<
53. Bruce J. Fundamental elements of the quality of
care: a simple framework. Slud. Family Plann. 21, 61.
1990.
54. Warner M.. Holloway D. C. and Grazier K. C. L.
Decision Making and Control for Health Administration.
The Management of Quantitative Analysis. 2nd Edn.
Health Administration Press. University of Michigan.
Ann Arbor. 1984.
55. Netter J.. Wasserman W. and Kutner M. H. Applied
Linear Statistical Models: Regression. Analysis of
Variance and Experimental Designs. Richard D. Irwin.
Inc. Second Edition. 1985. Third Edition. 1990.
56. Jarrett S. W. and Ofosu-Amaah S. Strengthening
health services for MCH in Africa: the first four years
of the “Bamako Initiative”. Hlth Policy Plann. 7, 164.
1992.
57. Cosminsky S. Women and health care on a Guatemalan
plantation. Soc. Sci. Med. 25, 1163. 1987.
H
ri
THE LANCET
The World Bank has published its new
‘Sector strategy paper on the health,
nutrition and population sector’. The
Lancet published this commentary on the
World Bank paper. RIAC / INFI
obtained copies of the document. You
can request yours, in English or in
French, on the ‘Request form for
scientific documentation’ included in this
Newsletter.
More dollars, more sense?
Unlike its earlier healthy-policy pronouncement,the
World Bank’s recent Scrategy Paper on the Health, Nutrtnon
and Population Sector5 sets out what the Bank itself intends
do in the sector over the next decade. We should sit up and
listen, for the strategy will have an impact on the health and
well-being of millions of people world wide.
The Bank’s central objective lies in reducing poverty.5
According to the sector-strategy document, the
organisation’s mission is threefold: (1) to address the health
needs of the poor and vulnerable through increased
targeting of health-sector resources to specific groups; (2)
' to correct the performance of health-care delivery systems
■ through reforms in public-sector organisation and resource
• allocation; and (3) to ensure the financial sustainability of
the sector by reconfiguring financing mechanisms and
• reinforcing cost-containment measures.
Underlying the strategy is the view that, although
affordable and feasible solutions to the most common
causes of poor health are available, inappropriate public
policies and poor government regulation and weak health
programmes render much spending on health care
ineffective and inefficient. The document asserts that there
is almost consensus that government performance (eg, use
of public health facilities by the poor, allocation of public
resources and cost-effective health-care interventions, cost
containment) will not improve with just more public clinics
and better-paid public-sector health-care providers. It
argues that the solution is in public-sector reforms that
strengthen governance, regulation, and institutional
capacity, enhance public-sector accountability, improve
senior-level management, and develop public-private
initiatives. The central message of the strategy document is
the need for “a substantial redefinition in the role of the
state and non-governmental” actors.
Most of these policies have been elaborated and
advocated in earlier Bank policy documents. Newsworthy is
how the Bank will attempt to ensure adherence to these
ideas. First, it will strive to put the dysfunctions of the
health sector on the public agenda, by financing more
broad-based policy analyses, country-specific sector work,
1494
and analyses of how systems are working. Second, the Bank
will pursue “lending approaches that take a more
comprehensive view of the HNP [health, nutrition, and
population] sector, rather than just activities supported
directly through Bank assistance”. This measure entails a
gradual shift from project-specific investments to a “sector
wide approach”. Third, the Bank intends to practise greater
country selectivity through a strategy of “aid-triage”. It will
refuse further health-sector credits to those countries whose
governments do not meet a threshold of commitment to
the sector and where the Bank and the government cannot
agree on the above principles of reform.
The strategy document sets out an ambitious and
complex agenda for the sector and for the Bank itself. The
Bank acknowledges that it entails risks and challenges.
Accordingly, the document spells out how the Bank needs
to change the way it does business. It notes that more
process-oriented approaches will be required, and one
recommendation is that greater auention be given to policy
and institutional analyses during project preparation and to
monitoring during implementation. Both would be
facilitated by a greater presence of the Bank in the
countries themselves.
In view of declining levels of govemtment-to-govemment
development assistance, the compensating role of ±e Bank
and its strategy of re-engaging other donors in the sector
are encouraging. The Bank has placed the health sector
firmly on domestic-policy agendas and focused attention
on critical health reforms long ignored. The strategy
document, which is frank and self-critical, deserves to be
recognised as a constructive initiative to fostering debate on
global cooperation for health-systems development.
However, there should be caution in support for the part
the Bank wishes, and intends, to play in the sector. While
few would question its impressive range and depth of
technical expertise in health-sector reform, there is still a
need to nurture and mobilise the expertise resident in
ministries of health, as well as in other agencies, and to
support the strengthening and capacity-building efforts
within governments. Despite the beneficial contribution
that economic analysis has made to the sector, the
relevance of complementary analytical disciplines and
medical knowledge should be recognised. And while the
Rank strategy acknowledges the importance of other
members of the international community and the need for
its parmership with other agencies, it gives little mention to
WHO, UNICEF, UNFPA, and the bilateral aid
organisations. The overall impression given is that the Bank
wants to go it alone. However, it will serve no-one’s health
if the Bank becomes the world’s Surgeon General.
Kent Buse, Gill Walt, J Patrick Vaughan
Department of Public Health and Policy. London School of Hygiene and
Tropical Medicine. London WC1E 7HT. UK: and International Centre for
Diarrhoeal Disease Research. Dacca. Bangladesh
1
World Bank. Financing health services in developing countries: an
agenda for reform. A World Bank Policy Study. Washington: World Bank,
1987.
2 World Bank. World Development Report 1993: investing in health.
Washington: World Bank, 1993.
3 World Bank. The health of adults in the developing world. Washington:
World Bank, 1992.
4 World Bank. Better health in Africa experience and lesions learned.
Washington: World Bank, 1994.
5 World Bank. Sector strategy paper on the health, nutrition and
population sector. Human Development Network. Washington: World
Bank, 1997.
Vol 350 • November 22. 1997,
HEALTH POLICY AND PLANNING; 8(1): 61-71
© Oxford University Press 1993
Paying for the Kasongo hospital in Zaire:
a conceptual framework
BART CRIEL AND HARRIE VAN BALEN
Public Health Research and Training Unit, Institute of Tropical Medicine, Antwerp, Belgium
Experiences and discussions relative to community financing of health services tend to focus on the health
facility of first access, that is, the health centre. The referral level, the hospital, a crucial element in the
"strict health system, is hardly mentioned in the debate.
in this paper a conceptual reference framework for user fees is presented. It is argued that a financing
policy at district level should be comprehensive and, therefore, not a priori exclude the referral level.
Criteria for raising fees, as well as the rationale for fees - apart from raising funds - are discussed.- Special
emphasis is put on fees charged at the district hospital, which may be an important source of financing
(complementary to external - national or international - funding). The case of the Kasongo hospital is
presented in detail.
Introduction
The financing of health services is a subject of
major concern throughout the world, especially
in developing countries. Particularly in subSaharan Africa, it is clear that the central budget
allocated to health services is insufficient to
allow the health system to provide the population
with appropriate health services at an acceptable
level. The need to mobilize additional resources
is obvious. Aid from developed countries and in
ternational institutions is limited, and the bleak
outlook for funding from outside the health
sector has increasingly led to the exploration of
possibilities of mobilizing resources from within
lamely through increased cost-recovery
i'
. users. Consequently, community financing
i
schemes have received much more attention in
recent years.
Obviously, in poor developing countries, a com
munity is not in a position to meet the cost of the
entire district health service by self-financing
alone. Part of this service still has to be financed
by sources other than the community, such as
national (government) and/or international
sources. There is general agreement about this
position. Opinions differ, however, when it
comes to choosing the nature of health services
that are most suitable for community financing
and national/international financing respec
tively. Which section of the health services
should be funded by community financing, and
which part by other sources? Why? What is the
rationale behind such decisions?
A framework for the analysis of the suitability
of user charges for health services is discussed
in this paper: reference is made to the local
context, namely, the district health system
(DHS). According to the Harare Declaration
(WHO 1987) ‘. . . a district health system (DHS)
is taken to mean a more or less self-contained
segment of the national health system which
comprises a well-defined population living within
a clearly defined administrative and geographical
area, either rural or urban, and all institutions
and sectors whose activities contribute to im
proved health.’ An ‘integrated’ district health
system is one in which the first-line health ser
vices (the health centre) and the referral level (the
hospital) each fulfil their specific and com
plementary roles with reference to a common
goal, which is the acceptance of responsibility for
the health of a well-defined population. In fact,
in the present discussion, we shall focus on the
district health services system, which is a sub
system of the district health system, even if the
latter denomination will be used throughout.
62
Bart Criel and Harrie Van Baleiin
In this framework for analysis, criteria for the
suitability of user charges refer to the place of a
given activity within the district health system,
rather than focus on the nature of the activity
itself (whether curative or preventive services).
What is meant by ‘place’? Two issues are to be
considered.
Firstly, user charges should contribute to the
possibility of the community making ‘informed’
choices concerning organization and planning of
the health service. An informed choice is easier
for activities with a low technology, which take
place near to people, and which people use more
often. Indeed, people can then experience which
problem has been solved by which effort (for ex
ample, a financial effort), and can then assess if
the effort is worthwhile compared to alternatives
such as self-care or self-medication. The logic
underlying this issue is aimed at strengthening
participation.
Secondly, user charges should contribute to the
process of using the appropriate level within the
system, and should not hamper accessibility and
continuity of care. For example, charges should
temper the tendency to make trips to hospital for
health problems that could have been treated not
only at lower cost, but also more effectively, at a
properly-functioning health centre. Conversely,
charges should facilitate the use of the referral
level when this is necessary - the logic is to in
crease the effectiveness and the efficiency of the
system.
In this paper, the financing of the Kasongo
health district is presented, and its rationale as
well as its practical implementation (with par
ticular emphasis upon the referral level - the
hospital) is discussed.
Financing policy in the Kasongo health
district
The Kasongo health district is a rural area
*n eastern Zaire. It covers an area of
5 00° kms- and, in 1980, had a population of
195 000, some 30 000 of whom lived in the
argest town in the area. The health services have
overall responsibility for health care in the area,
supplying the population with integrated and
continuous care (Kasongo Project Team 1982).
The district is organized as a uniform, two-tier
structure consisting of a decentralized network
of 16 health centres and one referral hospital
with 180 beds. The health district is managed by
a district medical officer, who leads a team of
four medical doctors, - an administrator and a
nursing officer. Each health centre is staffed by a
nurse, a nursing assistant, a clerk and a manual
worker, and serves a population of about 10 000.
The district executive tz™.
team was composed of
Zairean and Belgian doctors,. , with,
on average,
about four doctors present
present at every point
throughout the history of the project 'two
national and two expatriate doctors). Thi
irrent cost/per inhabitant (inh)/per year tor the
whole health district, in 1986, amounted to USS
2.9/inh/year (Pangu 1988). The available budget
was similar to what was nationally foreseen in
Zaire at the time (all sources of financing
together); the major difference with most other
districts m Zaire was that, for the Kasongo
district, these funds were readily available. The
figure of USS 2.9 includes the net wages of ex
patriate doctors, as well as the cost of the super
vision of the project by the senior staff of the
Institute of Tropical Medicine, from Antwerp
Belgium.
Approximately half of this total cost (USS
1-41/inh/year) occurred at the hospital level,
Figure 1 represents the total recurrent costs of
the district per inhabitant per year, when the
district functions with national staff alone, as
well as the incremental cost of having additional
expatriate staff. If the district functioned with
irean medical doctors only (assuming there are
k0UTrTc?Cidln? ^°ctors), then the total cost would
be USS 1.93 per inhabitant per year.
The financing of the district health systt,.. m
Kasongo relies upon four sources: the com
munity, the Zairean government, Belgian aid
(Co-operation Beige) and multilateral aid. Figure
2 represents the relative distribution of these
financing sources in 1986.
In Kasongo, the option was taken to limit local
community financing to the health centre level
and to subsidize the cost of the referral hospital
rough external funds. It was deemed preferable
to concentrate community financing on those
parts of the health system that depend least on
63
Paying for hospital care
cost/inh/year (US $)
3-f
2-
1.5 -I’
0.5 H
0
Total district
Hospital
| National staff
Health centres
Adm. office
Expatriate staff
Data for 1986 (source: Pangu 1988)
Figure 1.
Recurrent costs Kasongo district (distribution according to services)
100 -
i
80 60
5? 40 -
20 /
0
Total district
■■ sell-financing
Prd Belgian aio
Hosoitai
Health centres
.■
Adm. office
frWd Government
international aid
Data for 1986 (source: Pangu 1988)
Figure 2. Financing sources Kasongo district (distribution according to services)
64
Bart Criel and Harrie Van Balen
technology, where people understand, and can
the whole, there was a gradual decrease in the
take part in the choices made, and where the
external funds available.
results are clearly visible (Pangu and Van
Lerberghe 1990). The health centre, compared to
the hospital, is the unit within the health system
Paying for hospital care in Kasongo:
where people can more easily participate in the
who
pays? Why? And how much?
decision-making process: decisions taken at that
It may appear as if at hospital level no fees were
level are less technical, and the health centre is
charged. This is not the case. Some of the
nearer to people and more frequently used by
them than the hospital. Users of the health centre
patients using the hospital did pay for the ser
will more readily see and understand what they
vices provided. This leads us to the main issue to
have paid for (Van Balen and Mercenier 1986).
be discussed in this paper. Who does and who
does not pay for hospital care? For the sake of
The hospital was therefore considered more
suitable for external funding in Kasongo.
clarity, we propose to formulate this question as
follows: Whom amongst the patients i
the
The following principles guided the choice of the
referral level can benefit significantly
the
mode of payment at health centre level. The fee
external funding? Why is this so? The overall
should not be related to the individual cost of the
guiding principles were as follows:
care but to the total operating cost of the health
• The external funding will support the cost of
centre, and to the total number of users of the
justified hospital care, which can be provided
facility. In addition, it should not hinder conby the hospital within the limits of its
ll?care’ A flat-rate payment per episode
resources,
to all people who need it, provided
of illness or of risk (for instance for pregnancy or
they live in the district.
under-fives) was considered to fit these prin
This funding will not support the cost for
ciples. This payment entitles all to the care re
people living outside the district, nor will it
quired for dealing with the particular problem
support the cost of justified care which cannot
including referral to the hospital. The funds thus
be offered within the limits of the resources
raised stay at the first level, enabling a self
available. In these situations, the full cost of
funding of operating costs’ and a participation
care will be charged.
of the community in the management of the
• Finally, this funding will not support care
health centre. This promotes cost-sharing among
which can be delivered at lower levels of the
all users (more than, for instance, a feehealth system (health centre or community), or
for-service payment would do) and enhances
care which is technically not justified. In these
solidarity. Solidarity can be defined as the con
situations, the fees charged will be beyond the
sciousness of togetherness and the willingness to
real cost.
bear its implications (Ministry of Welfare, Public
Health and Culture, The Netherlands, 1991).
It is useful to briefly present some crude data
concerning the Kasongo hospital, prior to a more
Obviously, the flat rate paid at the health centre
m-depth discussion (Annual report 1987' The
cannot cover the real cost of a referral and a
hospital had 180 beds, with paediatric, i
tai
hospital admission (even if technically justified),
medicine, surgery and maternity wards, ao well
given the limits of people’s income in Kasongo,’
as an intensive care unit. Technical services,
and it was never the purpose that it should. At
such as a laboratory and an X-ray department
this level, the district authorities decided to cover
were available. Thirty-two qualified nurses,
the cost of referred cases and justified admis
14 auxiliary nursing staff and about 35 admini
sions at hospital level with the (available) fund
strative, technical and maintenance staff were
ing from national and international sources. This
employed at the hospital.2 In fact, the available
complementary funding will be labelled ‘ex
facilities at the hospital were limited to the more
ternal funding throughout this paper. In the
ones. Extra facilities, such as catering
technical
1980s, government funding decreased dramati
services, were not provided for (food was sup
cally, while international funding remained more
plied by the family members of the admitted
or less constant, in absolute terms. In reality,
patients). Even some tasks, such as washing
the latter decreased because of inflation. On
patients (except at the intensive care unit) were
Paying for hospital care
handled by the family. In 1987, there were 2665
patients admitted, of whom 416 (15.6*70) died.
More than half of the deaths (237 out of 416)
occurred in the intensive care unit. The overall
admission rate in 1987 was 14.3 per thousand
(37.5 per thousand for the urban population; 9.3
per thousand for the rural population and; 1.25
per thousand for the population of the district
not yet covered by a health centre (Annual report
1987)). In the same year, 449 major surgical in
terventions took place.
The classification of an individual patient into
either category - fee-paying or non fee-paying at
the hospital - was based upon the principles men
tioned above. In practice, two distinctions were
made.
The first was between users ‘within’ the (district)
system, and users ‘outside’ of the (district)
system. Patients ‘within’ the district health
system were:
(a) Individuals who lived within the defined
geographical area of the district, and where a
health centre was operating (a system of regu
larly updated family files, kept at each health
centre, enabled people to be identified); those
who had been referred to the hospital by their
health centre.
(b) Individuals who lived in areas located within
the boundaries of the district, but where no
health centre had yet been set up,J and who then
used the first-line service on the compound of the
hospital, usually a clinic held by a nurse.
(c) Individuals of any of the previous groups
who presented with an emergency who came
straight to the hospital, that is, even if they had
bypassed their health centre.
Patients ‘outside’ of the district health system
were:
(a) Individuals from other districts, those who
did not belong to the well-defined communities
living within the district boundaries.
(b) Individuals from the district who did not
follow the proposed procedure within the health
system, such as patients who came straight to the
hospital (except emergencies) when there was a
health centre located within their community.
55
For patients within the system, internal barriers
(for instance, financial barriers) between the dif
ferent units in the district health services system namely health centres and hospital - were to be
avoided. Indeed, continuity of care should be
preserved for the population for which the
district health system has explicitly accepted the
responsibility of care.
On the whole, the proportion of patients coming
straight to the hospital gradually decreased.
Table 1 illustrates the evolution of the number of
visits to the hospital outpatients clinic, com
pared to the total number of primary consulta
tions in the district health centres. In the period
from 1973 to 1983, there was a gradual and
substantial decrease in utilization of the hospital
as a first-line service, as well in absolute and
relative terms. This decrease was associated with
an important increase in health centre utilization.
This trend illustrates an increasingly more effec
tive and efficient use of health services in the
district health system in this period. This evolu
tion was shaped by the gradual extension of the
district’s health centre network in that period
(starting in the town of Kasongo), as well as by
the presence of financial disincentives against
direct hospital utilization.
Table 1. Evolution of proportion of patients attending the
hospital’s out-patient clinics versus the health centre's out
patient clinics (1973-1983)
Year
1973
1974
1975
1976
1977
1978
1979
1980
1981
1982
1983
1987
1989
Hospital OP clinics
(first access health
facility)
N
«7o
11 780
10 880
7726
5943
7000
7226
7774
7792
6599
3245
2572
1050
(data not
available)
47
30
19
12
13
17
14
13
11
7
6
1.9
Health centres
OP clinics
Total
13 522
25 308
34 013
42 348
45 000
34 410
46 639
54 362
54 589
42 000
39 883
54 381
59 285
25 302
36 188
41 739
48 291
52 000
41 636
54 413
62 334
61 188
45 245
42 455
55 431
Source of data from 1973 until 1983: Pangu 1988.
Source of data for 1987 and 1989: Annual repons 1987, 1989.
66
Bart Criel and Harrie Van Balen
The relative importance of each factor is difficult
to assess objectively; however, in a setting where
at the beginning of the 1970s, most of the people
of the district hardly had the opportunity to
utilize a properly-functioning health centre (with
a presence of well-trained staff, the use of flow
charts, a constant availability of drugs and
regular supervisory visits and so on), the former
explanation is very likely to be more pertinent. In
addition, other factors may very well have con
tributed to this trend, such as a perception by
health service users of the benefits of utilizing the
appropriate level of care in the system.
A second distinction was made between justified
care on the one hand (qualified here as ‘need’),
and unjustified care, or justified care which can
not be provided within the limits of the available
resources (both qualified here as ‘demand’) on
the other. Former (‘need’) patients were favour
ably assessed in terms of fees, so as not to hinder
continuity of care. The following two examples
illustrate this distinction. A caesarian section was
considered as need, and the request for an X-ray
in the absence of a technical indication for it
as demand. A strangulated inguinal hernia was
considered as need and a non-complicated in
guinal hernia as demand. The former example is
c ear-cut, while the latter is not. Indeed, at first
glance, it may be argued that the distinction is
arbitrary and unacceptable.
loading staff with work is to be avoided (and toe
much work would eventually lead to less time
available to treat more serious conditions). The
ethical concern behind this policy is the need to
maintain a sustainable and financially viable
tt i nr' SyStT f°r the peop,e for wh°n^
the health services has taken an explicit respon- >
sibility. This system has not only to be effective *
when tackling the health problems of the popula- V
tion, it should also be efficient.
In the Appendix, a range of services provided
at the hospital, with the fees charged (or not
charged for them), are listed, accordir
the
distinctions discussed earlier. The yearly client
revenue raised at health centre and at hospital
contrih ‘r6 Kas°ngo dis.trict - cash Payments and
contributions from private insurance schemes3
-is presented in Table 2. It appears that
approximately 40% of the total patient revenue
generated m the entire district was raised at
hospital level. This revenue remained more or
less constant in 1986, 1987 and 1989, as well in
absolute and in relative terms. Periodical in
creases in hospital fees and in contributions for
e employer-organized insurance schemes took
P’ace several times a year, with the purpose of
catching up with inflation. Additionally, two
other ways of raising revenue at the hospital level
were established in Kasongo.
In fact, the surgical cure of a simple non
Additional hospital funding
complicated hernia is justified in se, but, out of
consideration for efficiency, it is necessary to set
hospiul care"™65 W,thin
b°dy of justificd
priorities within the body of justified care. The
volume of work foreseen for the doctors did not
The decision to categorize a given health problem
allow equal commitment for all the justified
Kas°ngo under the label ‘demand’ or ‘need’
care. In the case of the example given, the oppor
was made after consideration of the kr cir
tunity cost of performing surgery on all the
cumstances. This decision included an
sshernias would become too high. Indeed, hernias
ment of the severity of the problem (for example,
are a highly prevalent problem in the Kasongo
the suffering it caused, whether it was life
district. A survey done in 1974 indicated that one
threatening if not treated), the frequency of the
male out of four in Kasongo presented a hernia
P^okm, and the resources available at hospital
(De Muynck 1979). Half of the (major) surgical
k kThiS ca.te8orization was regularly reviewed
interventions at the hospital at that time were
by the district executive staff. In the 1980s f
performed for hernias (51.6%, or 284/550).* If
however, in a context of decreasing government
inguinal hernias had been a rare problem, imply
ing a negligible workload, it could very well have
ifunding, most of the changes in this categorization
were unfortunately carried out with the pur‘
bee" considered as priority for justified care (a
i
pose of generating additional resources.
need). It is not possible, given the scarcity of the
resources available, to do everything for '
The following examples illustrate the dynamic of
everyone under the same conditions, if over(
this distinction. In 1986, the following surgical
Paying for hospital care
67
interventions were considered as priority
ferent health centres (could) use the hospital.
justified care (in the category of ‘need’): removal
This participation was to be proportionate to the
of a benign tumor (such as lipoma) and a non
real possibilities of hospital utilization by the
urgent hysterectomy (a myoma). In 1987, these
communities of the different health centres. As
interventions were then classified as non-priority
such, linking the financial contribution simply to
justified care (in the category of ‘demand’). Con
the number of people covered by each health
sequently, patients were charged a fee for these
centre would not solve this concern. Theoreti
interventions even if they were ‘in’ the system,
cally, the larger the population, the higher the
although only approximately half of the fee being
(potential) utilization of the hospital. But
charged to patients ‘out’ of the system present
obviously other factors, other than the number
ing the same problem (see Appendix).
of people, play a role. For example, the distance
from health centre to hospital, the transport
The dynamic in this categorization is an impor
facilities to the hospital, and the scattered
tant issue, because it refutes the idea that
population within the health centres’ catchment
categories had a certain arbitrariness. The
area. A coefficient was then determined for each
distinctions made were as a flexible answer to.
factor and for each health centre. For example, a
changing situations - in this case a situation
coefficient of 1 for health centres located within
where external funding decreased, and where
a range of less than 5 km from the hospital, a
additional patient revenue was necessary. Con
coefficient of 0.9 for health centres within a
sequently choices had to be made, and priorities
range of 5-15 km from the hospital down to a
defined.
coefficient of 0.3 for health centres situated at
more than 80 km from the hospital. The contribu
Contributions from primary to secondary
tion of each health centre was calculated accord
ing to the following formula:
An additional measure was considered in 1986:
number of inhabitants x coefficient distance x
the implementation of a scheme of financial par
coefficient transport facilities x coefficient
ticipation towards the cost of the referral
population scatter x flat rate.6
level by the health centre network. The purpose
was to link this financial contribution to the ex
Some of these coefficients were fixed (like the
tent to which the populations covered by the difcoefficient for distance), whereas others could
Table 2. Patient revenue in the Kasongo District (in Zaires)
First line health services:
Payments for health care
Employer organized insurance schemes
Subtotal (in Zaires)
(in US S)
(% of total)
Referral level:
Payments for health care
Employer organized insurance schemes
Subtotal (in Zaires)
(in US S)
(% of total)
Tola! (in Zaires)
(in US S)
1986
1987
1989
1 851 835
254 935
2 106 770
35 113
(61.6%)
3 428 686
554 790
3 983 476
36 213
(60.9%)
10 860 539
1 605 040
12 465 579
35 616
(60.6%)
584 420
729 345
1 313 765
21 896
(38.4%)
844 054
1 717 601
2 561 655
23 288
(39.1%)
3 442 288
4 667 122
8 109 410
23 170
(39.4%)
3 420 535
57 009
(100%)
6 545 131
59 501
(100%)
20 574 989
58 786
(100%)
Source: A
Annual reports Kasongo district 1986. 1987 and 1989; data for 1988
was 60 in 1986. 110 in 1987 and 350 in 1989.
was not available. Exchange rate (average) Z per S
68
Bart Criel and Harrie Van Balen
Table 3. Yearly contributions in Zaires (per health centre) to the operating costs of the referral hospital (1986)
Health centre
Number of
inhabitants
Coeffic.
distance
Coeffic.
transport
Coeffic.
scatter
Total/
year
1.0
1.0
1.0
1.0
HC Sengamali
HC Mulangabala
HC Nianga
HC Kabumbu
HC Kunda
HC Rudika
HC Kongolo
HC Lupaya
HC Mwanandcke
HC Kamumba
HC Karomo
12 466
10 233
11 715
12 333
6283
II 096
9022
9800
4716
II 639
8953
5000
7168
8978
7897
13 972
1.0
0.7
1.0
0.7
0.7
0.8
0.8
0.4
0.3
0.5
0.7
0.7
0.4
0.8
0.5
0.8
12 466
7163
II 715
4835
2463
5681
4619
1098
85
1746
2193
1225
2322
3771
1658
4695
Total
151 271
HC I
HC 2
HC 3
HC Kipaka
HC Kieshi
1.0
1.0
0.7
0.7
0.8
0.8
0.4
0.8
0.8
0.8
0.8
0.7
0.2
0.3
0.5
0.7
0.7
0.9
0.7
0.6
0.7
0.6
0.5
0.5
0.9
0.75
0.7
0.6
67 735
Note-. In 1986, the average exchange rate was 60 Zaires =* 1 USS. From 1988 on, the same coefficients were used, but with a flat
rate of 2 Zaires instead of I Zaire.
very well change over time (such as the co
efficient of transport facilities). The charac
teristics considered in the above formula are, of
course, not exhaustive, but it was considered that
they would give a fair enough approximation of
the opportunity to use the hospital.
In 1986, the yearly contributions to be paid
covered a range of 85 Zaires to 12 466 Zaires
(Table 3). Urban health centres within the district
(health centres 1, 2 and 3 in Table 3) had on
average, substantially higher utilization rates
than the rural health centres, and easily managed
to cover their operating expenses. They referred
more patients to the hospital (in absolute and
relative terms) than rural health centres (Table
4). According to the formula established, they
also contributed substantially more to the cost of
the hospital. In 1986, the total contribution for
the entire network of health centres yielded
approximately 68 000 Zaires (USS 1133). This
contribution represented 5°7o of the total amount
of users’ contribution to the hospital.7
These rising payments were of course an addi
tional financial burden to the health centres,
which already had to cover their own operating
Table 4. Proportion of referred cases by health centre
network (1988)
Health centre
Total number of
new contacts/yr
Proportion of
referred cases to
the hospital (Vo)
HC Kieshi
HC Sengamali
HC Mulangabala
HC Nianga
HC Kabumbu
HC Kunda
HC Rudika
HC Kongolo
HC Lupaya
HC Mwanandcke
HC Kamumba
HC Karomo
HC Kahambwe
5920
13.6
3555
27.2
5642
12.3
2489
28.8
3682
6.1
3858
2.8
3222
5.0
2597
12.3
2403
2.5
1607
1.2
2637
3.3
3595
2.3
1276
4.1
1659
17.8
(no complete data available)
1784
3.6
2.7
3441
3580
1.6
Total
52 947
9.1
Urban HC (HC
1,2,3 and 4)
Rural HC (all
other HC)
17 606
18.1
35 341
4.6
HC I
HC2
HC 3
HC 4
HC Kipaka
Paying for hospital care
gg
expenses. As mentioned above, this was not a
problem for urban health centres, but may have
been one for some of the rural health centres
which had lower utilization patterns. Health
centres had to regularly increase the flat rate in
order to pay all the operational expenses. These
increases obviously had implications for the
financial accessibility of the first-line health ser
vices for the poorest in the community. In that
respect, the possibility cannot be excluded that
these payments contributed to this burden in
some of the health centres.
It is important to emphasize the fact that the
district authorities decided upon these distinc
tions: indeed, it was their responsibility to decide
upon the allocation and optimal use of resources.
The sustainability of an effective system has to
be secured and this may imply - to varying
degrees - a discrimination against some patients
out of considerations of efficiency. It is obvious
that it is not for the population of the district to
take such decisions, because the population is
not in a position to step back from their situation
and make a rational decision in this matter.
"'n the other hand, the increased payments were
Jt implemented on an arbitrary basis. Even if
the total yield in revenue was relatively marginal,
the exercise was an attempt to link the contribu
tions paid, to the opportunity to use the hospital.
These payments clearly avoided a situation where
only the actual hospital users would contribute to
its cost. Indeed, potential users also contributed.
The logic behind this decision, as well as the
criteria used to determine the contribution, were
acceptable to the different health committees.
This was not the case for a proposal to invoice
part of the cost of supervision to each health
centre. Such a policy would have implied that the
more remote health centres were to be penalized;
some committees even proposed to discontinue
supervision if such a policy were implemented.
Additional contributions to be made by the
communities in the district (and not merely by
the users of the hospital), such as those discussed
in this paper, should be fairly distributed across
the population. Not only may this be a means to
increase resources, it may also focus on issues
people understand, so that they know and
support what they are paying for.
Conclusions
The hospital in Kasongo is not financed as an
isolated unit within the district health system:
health centres and hospital are financed as
elements in one system. The system of user fees
at the hospital was conceived so as to dis'minate positively in favour of the patients
ng within a well-defined geographical area,
tor which the district authorities had taken
responsibility; those who had not bypassed the
first level within the district health (services)
system; and those who presented a health
problem considered to be of high priority (a
source of suffering and/or which was potentially
life-threatening). Thus, this scheme of user fees
was not arbitrarily imposed; it explicitly aimed to
strengthen the district health system, and the
discrimination introduced was intentional.
Resources were limited and choices had to be
made.
Appendix
Fees levied at the Kasongo hospital in 1986.’ (in Zaires; in
1986 the av. exchange rate was 60 Zaires for 1 USS)
‘In’
system
1. Primary consultations
at the hospital
(held by nurse)
emergency (‘need')
no emergency
(‘demand’)
50
system
150
250
11. Secondary consultations
at the hospital
(held by doctor)
patients referred by
health centre (‘need’)
patients referred by
primary hospital
consult, (‘demand')
111. Hospital admission
shared room
‘need'
‘demand'
single room (per dav)
•need'”
'demand’
private room (per day)
‘Outside’
100
300
300
300
75
250
100
300
500
70
IV.
Bart Criel and Harrie Van Balen
Surgery
Need:
strangulated hernia
appendectomy
urgent splenectomy
urgent laparotomy
caesarian section
hysterectomy (upon
complication)
annexectomy (after
extrauterine
pregnancy or
pyosalpinx)
uterine prolapse cure
non invasive
orthopaedic surgery
invasive orthopaedic
surgery
urgent
haemorrhoidectomy
amputation
resection tongue
frenulum
abscess incision and
evacuation
tooth extraction
eye surgery
Demand: •••
removal benign
tumour
circumcision
unilateral
hydrocaelectomy
bilateral
hydrocaelectomy
unilateral inguinal
hernia (non
complicated)
bilateral inguinal
hernia
other hernia
non urgent
haemorrhoidectomy
non complicated
gynaecological
tumours
V.
VI.
1500
1500
1500
1500
2000
Demand:
X-ray
ECG
500
400
500
400
2500
2000
1500
800
2500
1000
2000
300
300
300
1500
800
200
1200
400
1000
1500
1500
2000
1000
1500
1500
1000
2000
1500
300
500
300
500
Maternity
Need:
normal delivery
(after referral)
complicated delivery
(after referral)
tubal ligature
curettage
therapeutic
pregnancy
interruption
suture
Demand:
normal delivery
(without referral)
tubal inflation
Specialized examinations
Need:
X-ray
ECG
300
500
500
500
500
300
1500
200
2000
500
500
400
The most common services provided at the hospital level
are listed here.
•• i.e. if the doctor decides that the isolation of the patient in
a single room is necessary.
••• Demand refers here to justified hospital care which was
considered not to be a priority.
Endnotes
1 The health centre’s operating costs covered by local com
munity financing were the costs of drugs and minor supplies,
the wages of locally paid staff (the nurses being paid either by
national/international sources), costs of transport material
(such as bicycles) and maintenance of the health centre
building.
2 The salaries of staff were fixed according to the (grossly in
sufficient) nationally proposed rates. This was compensated
for by fringe benefits, such as free housing and free medical
care for staff and their family members; by the status linked
to the profession'; and by unofficial payments from patients
which certainly occurred to some extent.
3 In 1980. approximately 40 000 inhabitants of the district
(total population 195 000) did not yet have access to (he ser
vices of a health centre within a reasonable distance. The ex
tension of the coverage with first-line health services within
(he distric( was a gradual process. Indeed, out of a concern of
efficiency, the communities living in areas with a more dense
population and with earlier access to the hospital were, at the
first stage, to be covered by first-line health services.
The data refer to a period before the discussion and iden
tification of priorities within the body of justified hospital
care, that is. in 1974. In 1989, this distinction had been valid
for several years. Then, 'only' 29.1% of the major surgical
interventions (127/436) were for non-complicated inguinal
hernias. There is no reason, a priori, to assume that the
°f hern'aS W°uld havC becn s‘8nif>can‘ly lower in
5 These private insurance schemes consisted of the payment
of a quarterly contribution/employee, which guarani
-ee
care for the employee and his family at any level
.ie
district health system.
In I—. thc amount
T of; this contnbu------- '-1
tion was 3500 Zaires per quarter (approximately USS 10).
In !O
________
fl< (kt,
*" In
1986.
this rt-.__
flat rate
was <1 Zaire;’in .nn.
1988 .it was ____
2 Zaires.
financial contribution to (he
In 1986, the community's financial
referral level was as follows (in Zaires):
- payments for care:
- private insurance
schemes:
- contribution of
health centres:
Total
584 420
729 345
68 000
I 381 765
(approximately
USS 23 000)
Paying for hospital care
References
De Muynck A. 1979. Fac.eurs de risque des hernies
inguinales etranglees. Etude de 243 cas a Kasongo, Zaire
nJ"?.?1 de la S°Ci‘l* Belge de M^ecine Tropicale 59:
I oj —98.
Kasongo District. 1986, 1987, 1989. Annual reports
Kasongo, Zaire.
Kasongo Project Team. 1982. The Kasongo Project. Lessons
o/ an expenment in the organization of a system of
primary health care. Editions Goemare, Brussels.
Ministry of Welfare, Public Health and Culture. 1991
2°PP°rt Commissie keuzen in de zorg. The Hague. The
Netherlands. November.
Pangu KA. 1988. La ‘sante pour tous1 d’ici I’an 2000: e’est
possible. Experience de planification et d’implantation des
centres de same dans la zone de Kasongo au Zaire. PhD
thesis. Free University of Brussels.
ngu KA and Van Lerberghe W. 1990. Autofinancement
Autofinancement
et autogestion des services de same de base. World Health
Porum 11: 451-54.
H’ a-ud Mercenier P’ l986- Financing of the health
service contributing to primary health care. Public Health
Rwearch and Training Unit, Institute of Tropical
w
AntwerP« Belgium. Unpublished.
World Health Organization. 1987. Report of the inter
zonal meeting on strengthening district health systems
based on primary health care. Harare. Zimbabwe
71
Acknowledgements
0 Ke8',s ind j va-
v'-
'r'am (ZairC*
>he Held
research for this paper under the direction of the Unit of
Research and Training in Public Health (co-directors Dr P
Mcrcenter and Dr H Van Balen).
Biographies
Bart Criel MD. DTM&H. MSc. has worked for 7 years at
district level in Zaire, for the Belgian bilateral aid agency in
a staff memV fB*anlanda hcallh districts. He is currently
Unk PHRTtVnf rh i
Hcal,h RCSCarch and Tra*n*nS
Amlerp S °f
,nStUUtC °f TrOpicaJ Mcdici"'
to^fiVnZ 8^"’^0- DTM&H- MPH worked from 1955
!hen9H9
a.nd Rwanda ’ 'lining medical assistants and
hen dunng the last five years as director of the hospital
hashhef^nU hy °.f m;d,“ne in Butare, Rwanda. Since 1972 he
(PHRbTm a^h ? -hC U?il f°r Rcscarch and Training
(PHRTU) at the Institute of Tropical Medicine in Antwerp
and is jointly responsible for projects in Zaire, Niger'
Morocco, Thailand and Bolivia.
8 ’
MedHnr^^ ?r B CricI’ PHRTU' Insti,ulc °f Tropical
Medicine, Nationalestraat 155. 2000 Antwerpen, Belgium.
<SO IVA H -
2. 14
Original Article on Health Care Policy
WILL COST EFFECTIVENESS ANALYSIS
WORSEN THE COST EFFECTIVENESS OF HEALTH CARE?
David U. Himmelstein, Steffie Woolhandler, and David H. Bor
Cost effectiveness analysis is increasingly advocated as a basis for health policy.
Analysts often compare expensive interventions with highly cost-effective programs
such as hypertension screening, implying that if the former were curtailed resources
would be reallocated to the latter and the efficiency of health care would improve.
However, in practice, savings are unlikely to be targeted in this way. We present
refined policy models that take into account actual patterns of resource allocation in
the United States, and provide more realistic estimates of the likely uses of savings.
We illustrate the implications of these models in an analysis of the effects of diverting
funds from an expensive but effective practice. Eliminating such a practice would
actually worsen the overall cost-effectiveness of U.S. health care unless there are
radical changes in health policy. Cost effectiveness analysis incorrectly predicts health
and cost outcomes of policy initiatives because it ignores the political constraints to
health care decision-making.
“There's no economy in going to bed early to spare candles if the result is twins. “
Chinese proverb
!
J
4
Few question the need to wisely apportion health resources. Clearly, expenditures
without benefit should be eliminated and those that result in long-term savings should
be encouraged. Efficacious but expensive medical interventions, raise more vexing
questions.
Cost effectiveness analysis (CEA) is increasingly advocated as a basis for these
difficult decisions. Cost effectiveness analysts determine the costs and effects of a
medical intervention, and summarize the results as a cost per death or morbid event
prevented (1). They advocate curtailing exhorbitantly expensive practices in order to
divert funds to better uses. They implicitly assume that savings from eliminating costly
programs will not be wasted but will be spent on more cost-effective care, thereby
improving the efficiency of the health care system as a whole (2).
This assumption seems unwarranted, at least in the United States. In our health
care system it is quite easy to curtail expensive interventions by denying insurance
payments for them. However, short of radical changes in the organization of health
care there is little hope of diverting savings to the 35 million people without any
health insurance, a group currently denied many basic services that are very cost-
International Journal of Health Services, Volume 18, Number 1, 1988
© 1988, Baywood Publishing Co., Inc.
1
2 I Himmelstein, Woolhandler, and Bor
effective. Thus, though the advice of CE analysts may result in freeing up resources
now devoted to expensive practices, these resources are unlikely to be spent on prefer
able alternatives. As a result the overall efficiency of health care may actually decline.
Unfortunately, virtually all published CEAs compare the cost effectiveness of
expensive practices with ideal alternatives, not the real uses to which savings would
be diverted. Thus coronary artery surgery has been compared with highly costeffective interventions such as control of hypertension (3), though savings from the
former are unlikely to be targeted for the latter.
Health policy analysis should take into account not only the relative cost effective
ness of services, but also the complexity and frustrating irrationality of current
mechanisms of resource allocation. Within the framework of the existing U.S. health
care system, savings from curtailing an expensive intervention would either reduce
total health care spending or be redistributed to a wide variety of medical services,
including many of dubious cost effectiveness. In the former case, the overall cost
effectiveness of the health care system will improve only if the practice eliminated is
less cost-effective than the system-wide average. Alternatively, if savings are used to
expand other health services, the efficiency of the system will improve only if the
practice eliminated is less cost-effective than this array of added (marginal) services.
In this article we explore the implications of two refined policy models that take
into account actual patterns of resource allocation in U.S. health care. Our findings
suggest that unless patterns of resource allocation are radically altered, eliminating
practices characterized by CEA as exhorbitantly expensive would actually worsen the
overall cost effectiveness of health care.
THREE ANALYTICAL MODELS
Traditional CEA implicitly or explicitly contrasts an expensive intervention with
other more cost-effective practices, based on the assumption that resources can be
redistributed from the former to the latter. The number of lives saved by such a
transfer is calculated by the Traditional Model as:
Additional lives saved - (savings from eliminating expensive intervention/cost per
life saved by ideal alternative practice) - (savings from eliminating expensive inter
vention/cost per life saved by expensive intervention).
The change in the average cost effectiveness of care (health spending/lives saved by
health care) is:
Change in cost per life saved = [total health expenditures/current number of lives
saved by health care] - [total health expenditures/(current number of lives saved
by health care + additional lives saved by transfer of resources to ideal alternative
practice)].
The more realistic assumption that savings from the eliminated intervention will be
redistributed to other health care and apportioned in the same manner and pattern as
Cost Effectiveness Analysis of Health Care I 3
in this way is:
life saved by the intervention eliminated).
«. p.. “
savings will not be reinvested m
ea
activities In this model the number of lives
ii; bb;lX"" ”7 XXX XT”h,d
previously preserved, and the change in system-w.de cost effectiveness is.
1 nor life saved = (current total health expenditures/current number of
Change in <costpe life sa
_(
toul health expenditures - savings from
- X.— £ " nX> I
“"<■ W
lost by eliminating the intervention)].
METHODS FOR ESTMAT1N0 THE COST EFFECTIVENESS OF CARE
,b. Redistribution .nd S^dW XeTXXXsXXX'—marginal and average cost effectiveness o m
jzed in Table 1. The marginal cost effec .ven .
of two types of data:
calculated from either
^g7‘d mortality
or
and mortality. statistical models relating
Table 1
Estimates of the marginal and average cost effectiveness
---------------------------------------------Marginal cost per
life saved by
medical care,
dollars
Source of estimate
1,081,965
Geographical variation
3,248,299
Time trend 1980-83, assuming
medical care responsible for
1 5% of decline in mortality rates
flSee text for calculations.
of medical carefl
Average cost per
life saved by
medical care,
dollars
1,056,985
4 / Himmelstein, Woolhandler, and Bor
groups in the United States in 1970 have been developed by Jack Hadley (4). He
correlated health spending and death rates for various age, sex, and race cohorts after
controlling for factors such as income, education, marital status, work experience,
cigarette consumption, and disability. A 10 percent increase in per capita medical
expenditures was associated with an average decrease in the mortality rate of 1.57
percent. Since the communities studied all had basic medical services, the differences
between high- and low-cost areas approximate the effects of marginal increases in
medical spending, yielding an estimate of:
Marginal cost per life saved = (health spending per 100,000 population) (0.10) /
(death rate per 100,000) (0.0157).
Given a 1983 U.S. health spending of $1459 per capita and the death rate of
858.9 per 100,000, the marginal cost per life saved by U.S. health care can be esti
mated as $1,081,965. (We have based this and all subsequent estimates on 1983 data,
with costs for other years inflated to 1983 dollars using the Consumer Price Index.)
Alternatively, the marginal cost effectiveness of care can be estimated from
temporal change in U.S. mortality rates and health care spending between 1980 and
1983. Decreases in mortality rates during this period reflect, in part, the most recent
additions to medical care and hence the marginal value of health services. The propor
tion of the mortality decline that can be attributed to medical care is not known, but
has been estimated as at most 3.5 percent (5). We conservatively assumed that 15
percent of the mortality improvement is attributable to improvements in health care,
and performed sensitivity analyses based on the assumption that medical care
accounted for between 2 and 30 percent of the improvement in mortality rates
(Appendix). The cost per life saved by the marginal increment in medical care can be
calculated as:
Marginal cost per life saved = (increase in inflation-adjusted health spending per
100,000, 1980-83) / (decrease in age-adjusted death rate per 100,000, 1980-83)
(0.15).
Age-adjusted mortality rates per 100,000 population for 1980 and 1983 were
588.8 and 549.6 respectively (6). Per capita health care spending was SI049 in 1980
(adjusted for inflation to SI268 in 1983 dollars) and SI459 in 1983 (6). Thus, based
on temporal trends we estimate that the marginal cost per life saved by U.S. medical
care is $3,248,299. (See Appendix for sensitivity analyses.)
The relation between health spending and the number of lives saved by medical care
based on time trends for the period 1920-1983 is displayed in Figure 1. The slope of
the curved line at a given level of health spending is the marginal cost to save a life (in
1983 dollars) at that level of spending.
THE AVERAGE COST EFFECTIVENESS OF CARE
The average cost effectiveness of medical care can be calculated from temporal
change in U.S. health spending and mortality rates between 1920, when spending was
negligible and curative medicine had little effect on mortality (7), and 1983. We again
Cost Effectiveness Analysis of Health Care / 5
1983
1982
1981
1980
150 q
l
§ 120-
1975
a
U4
CU
z
o
J
J
1970
90-
£
o
0
z
1965
60*
A 1960
Q
Z
1*4
cu
tn
§s
A 1950
30*
1930
z
1940.
1920
0-1------- -- —I-------------'
o
30
60
90
120
150
LIVES SAVED BY MEDICAL CARE (PER 100,000)
Figure 1. Relation between health spending and number of lives saved by medical care, 1920-83.
assumed that medical care accounts for 15 percent of historical improvement in death
rates, and explored the range of 2 to 30 percent in our sensitivity analysis (Appendix).
The average cost effectiveness of care can then be calculated as:
Average cost per life saved = (increase in inflation-adjusted health spending per
100,000, 1920-83) / (decrease in age-adjusted death rate per 100,000, 1920-83)
(0.15). ’
Age-adjusted mortality rates per 100,000 population for 1920 and 1983 were 1420
and 549.6, respectively (6, 8). Per capita health spending grew from about S16 in 1920
($79 in 1983 dollars) to $1459 in 1983 (6, 8). The estimated average cost effectiveness
of care is $1,056,985 per life saved, equivalent to the slope of the straight line in
Figure 1.
Table 2
Effect of eliminating an intervention costing $10 billion, with a cost effectiveness of $1 million per life saved,
and reinvesting savings in health care (Redistribution Model)
o\
D
E
A
B
C
Estimated marginal cost
to save a life by medical
care,fl dollars
Lives lost by eliminating
the intervention
($10 bil/$ 1 mil)
Lives saved by reinvesting
savings in medical care
($10 bilM)
Net loss of lives
(B-C)
1,081,965
10,000
9,242
758
2,389
6,921
22,215
3,248,299
10,000
3,079
Increase in average cost
to save a life/’ dollars
flSee Table 1 for source of estimate.
= health spending/[(lives currently saved by health care) - (lives lost by redirecting spending)) - current average cost to save a life = 355.4 billion/
(336,139-£>)- 1,056,985.
Cost Effectiveness Analysis of Health Care / 7
THE EFFECTS OF CURTAILING AN EFFECTIVE BUT EXPENSIVE
INTERVENTION
In order to illustrate the implications of these alternative cost effectiveness models,
we calculated the effect of eliminating an effective but expensive medical practice that
consumes $10 billion per year, and has a cost effectiveness of $1 million per life
saved. We chose this hypothetical example because its cost effectiveness is similar
to that of interventions that have been singled out in CEAs as very expensive
(3,9,10).
.
u
i u
Eliminating such an intervention and reinvesting the savings in health care
(Redistribution Model) would result in a net loss of either 758 or 6921 lives per year,
depending on whether geographical or temporal data are used to estimate the marginal
cost effectiveness of care. The average cost per life saved by the health care system as a
whole would rise by either $2,389 or $22,215 (Table 2).
Eliminating the hypothetical intervention and using the savings to reduce health
care costs (Spending Reduction Model) would result in the loss of 10,000 lives and
increase the average cost per life saved by the health care system as a whole by $1748.
DISCUSSION
Cost effectiveness analysis frames difficult health policy questions in appealingly
simple and apparently objective equations. When similar techniques are applied to the
straightforward problems of the family budget their usefulness is indisputable.
However, the usefulness of CEA rests on the assumption that funds denied to
inefficient services will be diverted to more efficient ones. This assumption ignores the
political realities constraining health resource allocation, at least in the United States.
A private system of health care that allocates resources through market mechanisms
cannot shift money toward the most efficient services because those most in need,
the poor, are precisely those least able to pay. The rational decision-making needed to
render CEA a useful tool is only possible within the framework of a universal, egali
tarian health system. Yet cost effectiveness analysts in the United States have not
advocated such a national health program. In the absence of this reform, their advice
to curtail seemingly exhorbitantly expensive practices may actually be worsening the
efficiency of care.
Our analysis of the effect of curtailing inefficient programs refines the traditional
CEA policy model to take into account real patterns of resource allocation. This
refinement is based on admittedly imprecise estimates of the average and marginal cost
effectiveness of health care. Yet even such flagrant imprecision is almost certainly
more representative of actual outlets for savings from curtailed interventions than are
the theoretical possibilities traditionally offered as comparisons in CEAs. Our
estimates of the cost to save a life are of similar magnitude to, though higher than,
figures derived from the Rand Health Insurance Experiment, which examined the cost
effectiveness of free care (11). Because free care preferentially aids the poor who are
likely to have important unmet medical needs (12), it “targets” funds to interventions
likely to be more cost-effective than other marginal increases in health spending. For
this reason our results appear consistent with those of the Rand Experiment. As shown
8 I Himmelstein, Woolhandler, and Bor
in our sensitivity analysis (see Appendix), even widely divergent estimates of the
effectiveness of medical care lead to the same conclusion: CEA is useless unless health
decision-making is radically changed.
It is surprising that the average cost to save a life by health care is so high. Yet even
this seemingly high figure translates into approximately 340.000 deaths averted in
1983 by health care. The high average and marginal costs reflect several factors. First,
such calculations ignore the benefits of care that diminishes suffering but not
mortality. Second, because mortality is tabulated yearly, patients saved several times
in a year (e.g., diabetics with frequently recurrent ketoacidosis) will be counted only
once. Finally, the cost effectiveness of care is diluted by a large body of useless
activity practiced under the rubric of medical care. Thus CEAs treat the 10 percent of
U.S. health spending wasted on excess administration (13) as a fixed cost of medical
practice, i.e., as a constant in the cost equation that inflates the cost of care without
improving health.
Cost effectiveness analysis has been criticized for ignoring or distorting “soft”
endpoints (14) and implicitly reinforcing discrimination against the elderly (15) and
the poor (11). We would add to these philosophical criticisms a technical one: CEA
incorrectly predicts health and cost outcomes because it assumes ideal rather than
real patterns of resource allocation. Our calculations suggest that in the absence of
improved means to target care, curtailing even the most costly interventions ever
identified by CEA (3, 9, 10) would have little or no beneficial effect on the efficiency
of U.S. health care.
It is possible that in the context of a different health care system, such as the
British National Health Service, CEA could be a useful tool. This, however, should not
be assumed. Wise clinicians have long demanded that therapies be tested in the
complex milieu of human populations, and have been wary of evidence based solely
on in-vitro study. Similarly, the clinical and cost outcomes of CEA can and should be
measured in well-designed trials. Until this is done, we believe that CEA should be
considered experimental and of uncertain value. Health policy analysis that claims to
be an objective technical exercise apart from politics may lead to wrong and harmful
answers.
APPENDIX
For our analysis we assumed thar medical care is responsible for 15 percent of the
historical improvements in death rates. Because this assumption is inexact, we repeated
the analysis using the alternative assumptions that medical care accounts for 2 or 30
percent of mortality improvements. All other calculations were carried out in the same
manner indicated in the text.
If medical care is responsible for 2 percent of the changes in death rates, the
marginal cost effectiveness of care is S24,362,245 per life saved, and the average cost
to save a life by medical care is 87,927,390. Eliminating the hypothetical intervention
and redistributing the savings to health care would cause a net loss of 9590 lives and
increase the average cost to save a life by $31,033. If savings were used to reduce
health spending, 10,000 lives would be lost and the average cost to save a life would
increase by $1,988,779.
Cost Effectiveness Analysis of Health Care / 9
If medical care is responsible for 30 percent of the changes in death rates, the
marginal cost effectiveness of care is $1,624,150 per life saved, and the average cost to
save a life by medical care is $528,493. Eliminating the hypothetical intervention and
redistributing savings to health care would cause a net loss of 3843 lives and increase
the average cost to save a life by $12,222. If savings were used to reduce health
spending, 10.000 lives would be lost and the average cost to save a life would decrease
by$7117.
REFERENCES
1. Weinstein, M. C., and Fineberg, H. V. Clinical Decision Analysis.^. B. Saunders, Philadelphia,
2. Weinstein, M. C., and Stason, W. B. Foundations of cost-effectiveness analysis for health and
medical practices. TV. Engl. J. Med. 296: 716-721, 1977.
3. Weinstein, M. C., and Stason, W. B. Cost-effectiveness of interventions to prevent or treat
coronary heart disease. Anna. Rev. Public Health 6: 41-63, 1985.
4. Hadley, J. More Medical Care, Better Health? Urban Institute Press, Washington, D.C., 1982.
5. McKinlay, J. B., and McKinlay, S. M. The questionable contribution of medical measures to
the decline of mortality in the United States in the twentieth century. Milbank Meni. Fund Q.
55:405-428,1977.
K]
6. Health. United States. 1984. Department of Health and Human Services Publication No.
(PHS)85-1232. National Center for Health Statistics, Hyattsville, Md., 1984.
7. McKeown, T. The Role of Medicine: Dream. Mirage, or Nemesis? pp. 80-92. Nuffield Provin
cial Hospitals Trust, London, 1976.
8. Historical Statistics of the United States Colonial Times to 1957. Bureau of the Census,
Washington, D.C., 1960.
9. Fineberg, H. V., Scadden, D„ and Goldman, L. Care of patients with a low probability of
acute myocardial infarction: Cost effectiveness of alternatives to coronary-carc-unit admission.
N. Engl. J. Med. 310: 1301-1307, 1984.
10. Rosenshcin, M. S., ct al. The cost effectiveness of therapeutic and prophylactic leukocyte
transfusion. N. Engl. J. Med. 302: 1058-1062, 1980.
11. Himmelstein, D. U., and Woolhandlcr, S. Free care, cholestyramine, and health policy. N.
Engl. J. Med. 311: 151 1-1514, 1984.
„
12. Entcrline, P. E., ct al. The distribution of medical services before and after free medical
care-the Quebec experience. N. Engl. J. Med. 298: 1174-1178, 1973.
13. Himmelstein, D. U., and Woolhandlcr, S. Cost without benefit: Administrative waste in U.S.
health care. TV. Engl. J. Med. 314: 441-445, 1986.
14. Bayer, R., ct al. The care of the terminally iU: Mortality and economics. N. Engl. J. Med.
309:1490-1494,1983.
j
15. Avorn, J. Benefit and cost analysis in geriatric care: Turning age discrimination into health
policy. N. Engl. J. Med. 310: 1294-1301,1984.
Direct reprint requests to:
Dr. David U. Himmelstein
The Cambridge Hospital
1493 Cambridge Street
Cambridge, MA 02139
mai 1 box:/C%7C/Netsc...nl.net.in&number=59
4
H 2--I3
mai1 box:/C%7C/Netsc...nl.net.inS]
Subject: Forward mail from 326
Date: Sun. 08 Nov 1998 23:16:35 +0500
Fr om: Dr.Thelma Narayan” <tnarayan@giasbg01.vsnl.net.in>
To: sochara@blr.vsnl.net.in
This is a trial transfer. Please print this out.
7 •
Ravi
date: Sat, 7 Nov 1998 09:55:12 +0500 (GMT+0500)
>From: Bharat Jhunjhuwala <bharatjQgiasdlOl .vsnl .net.in>
>To: Binu S Thomas <pau&actionaidindia .org>
>cc: "Dr. Thelma Narayan" <tnarayan@giasbg01.vsnl.net.in>,
>
Radhika Ramasubban <soctecHgiasbm01 . vsnl .net.in>r
>
ashishQgiasdl 01.vsnl .net.in,
>
Prabir Purkayastha <sagrik@giasdl01.vsnl .net.in>
>X-Status:
i
>
>Dear friend:
>
>1 am working on a book on Indian economy. I am arguing strongly agaisnt
government expenditures on heath and education,
'.I..., welfare state in general.
>1 send the relevant chapters.
>
>1 will be very happy if you would see what is wrong with this and let me
>have your comments.
>
>regards
>
>bharat
>Content-Type: APPLICATION/octet-stream; name=0
>COntent-TD; <Pine.OSF.4.05.9811070955050.22824@gi asdl01.vsnl .net.in>
>Content-Description: wp51 for dos
>Content-Disposition: attachment; filename=O
>Attachment Converted: C:\Eudora\SCRIPTS\0
>Content-Type: TEXT/PLAIN; charset=US-ASCII; name=Oraraa
^Content-ID' <Pine.OSF.4.05.9811070955051 .22824@gi asdl01. vsnl. net in>
>Con^ent-Description: ascii
>Content-Disposition: attachment; filename^Orama
>
>Attachment Converted: C:\Eudora\SCRIPTS\Orama
>
1 Of 1
11/09/98 1'
PREFACE
1
3
ABBREVIATIONS
4
THE ARGUMENT
5
1
FALSE ALARM
2
WE DON'T NEED FOREIGN INVESTMENT
8
14
LONG TERM LOSS
14
FOREIGN INVESTMENT TROUBLES
20
PROMOTING COMPETITIVENESS
31
MULTILATERAL AGREEMENT ON
38
THE BOGEY OF FINANCIAL SECTOR
41
INVESTMENT
REFORMS
3
FOREIGN TRADE
43
OPTIMUM AND MAXIMUM FOREIGN TRADE
43
FREE TRADERS IN TROUBLE
45
EMERGING GLOBAL RECESSION
46
PRESUMPTION OF PERPETUAL INEQUITY
52
THE TRADE GAP
58
AGRICULTURE AND GLOBALIZATION
63
WTO
65
4
71
71
83
WORK
101
107
111
117
WELFARE STATE
WORK VERSUS WELFARE
THE DRAG OF TAXES
SOCIAL SECTOR EXPENDITURES DON'T
86
CASE STUDY OF HEALTH SECTOR
PUBLIC DISTRIBUTION SYSTEM
WATER HARVESTING STRUCTURES
REGULATION
LIVING WITH INEQUALITY
123
I
5
INCREASING DOMESTIC INVESTMENT
128
INCREASE GOVERNMENT EXPENDITURES
128
LAW AND ORDER AND DEFENSE
134
SALE OF GOVERNMENT ESTATE
138
PUBLIC SECTOR UNDERTAKINGS
141
INCOME TAX AND SAVINGS
147
6
TRADE AND THE REAL ECONOMY
151
IMPORT DUTIES
151
SMALL SCALE INDUSTRIES
155
7
WORK AS WELFARE
163
AMELIORATING POVERTY
163
WOMEN AND CHILDREN
167
8
GETTING OUR ACT TOGETHER
175
TAX AND INVESTMENT POLICY
175
EXPENDITURE POLICY
176
MONETARY POLICY
177
COMMERCE POLICY
178
INDUSTRIAL POLICY
179
RURAL POLICY
180
WELFARE POLICY
180
9
REFERENCES
182
ANNEXURE 1
183
FOREIGN INVESTMENT
ANNEXURE 2
185
PROJECTED IMPACT OF
LONG TERM EFFECTS OF FOREIGN INVESTMENT
DATA FOR STATISTICAL ANALYSIS
185
RESULTS OF REGRESSION ANALYSIS
186
ANALYSIS OF RESULTS
187
ANNEXURE 3
LONG TERM EFFECTS OF FOREIGN TRADE
188
2
DATA FOR STATISTICAL ANALYSIS
188
RESULTS OF REGRESSION ANALYSTS
189
ANNEXURE 4
IMPACT OF FAMILY WELFARE EXPENDITURES
191
CHANGE IN CRUDE BIRTH RATE AND PER
191
CAPITA INCOME
EXPENDITURES
ANNEXURE 5
193
IMPACT OF FAMILY WELFARE
192
HUMAN CAPITAL AND ECONOMIC GROWTH
DATA
193
ALLEGED LINK BETWEEN PUBLIC
195
IMPACT OF PUBLIC EXPENDITURES
EXPENDITURES AND GROWTH
196
IMPACT OF GOOD GOVERNANCE
198
ANNEXURE 6
199
HUMAN DEVELOPMENT RANKINGS
THREE PARAMETER RANKINGS
199
FOUT PARAMETER LOG RANKINGS
202
ANNEXURE 7
EQUILIBRIUM
MARX'S THEORUM AND LOWER AND HIGHER
205
3
PREFACE
There exists a consensus today that (1) we ’need’ foreign Investment although some would
restrict it to certain sectors only; and (2) it is the solemn responsibility of the state to provide I he
basic needs—health, education and housing-to all the citizens of the country.
This book challenges these two consensus. It is shown that the long term effects of foreign
investment are negative and that welfare state is actually hitting at the poor.
The Western economies have a vested interest in perpetuation of these falsehoods. They waul (o
penetrate the Indian economy and establish their stranglehold before Indian business can come
into vogue. And, in the name of welfare state they are leading the Indian government Io increase
spending on social sectors at the cost of economic infrastructure.
India lies at the threshold of becoming a world economic power. She may, however, slip and
miss this opportunity if she does not reconsider these two misinformation.
The limited purpose of this book is to draw attention of the public to this wrong consensus so
that we are saved from the pitfalls that lie ahead.
THE ARGUMENT
Foreign Investment
Foreign investment leads to short term growth. In the long run it has a negative effect because
of two reasons:
1. The rate of return on domestic capital declines. It is these profits that are reinvested in the
economy in the long run. The foreign investor, as the term ’foreign’ denotes, will reinvest
according to profitable opportunities available on the global scale. Thus, in the long run
foreign investment itself is uncertain. And, the domestic profits decline. As a result, foreign
investment hits at economic growth in the long run.
2. The foreign currency received from the inflow of foreign capital has to be used to import
something or the other. It is mostly used for imports of consumer goods. These inflows
increase the supply of foreign currency and lead to the appreciation of the rupee. This hits al
our exports. These increased imports and reduced exports, if allowed to persist for a long
time, lead to a structural deformity in the Indian economy. It becomes dependent on imports
of consumer goods.
As a result we see that countries which have relied on foreign investment have had high rales ol
growth as long as these net capital flows are positive. However, when they turn negative, lhe
economies crash as has happened in Latin America, East Asia and Russia.
Foreign investment, on the other hand, has the beneficial effect of cajoling domestic businesses
to become globally competitive. This same objective could be achieved by making them face
import competition by throwing open trade. This would have a short term impact. Even heller
would be to put into effect a domestic competition policy and to encourage new entrepreneurs
to secure latest technologies and challenge the stranglehold of inefficient domestic producers.
4
Our foreign investment policy should be as follows:
1. Increase government expenditures on law and order and justice. This provides (he
framework for domestic investment.
2. Release national debt by sale of PSEs and unproductive real estate. Use the savings in
interest to finance expenditures on public goods including infrastructure. This will lay (he
foundation for increased domestic investment.
3. Encourage technology purchase instead of foreign investment. Impose profit reinvestment
clause in foreign investment approvals.
4. Abolish Income Tax and collect similar revenue by imposing import duties; and higher
excise duties on luxury consumption goods.
Trade Policy
The benefits of foreign trade are real. However, they come along with the long term risks of
disturbances across the borders. As the share of foreign trade in our economy increases these
long term risks increase.
The benefits from every 1-percent increase in the share of foreign trade declines due to the law
of diminishing returns. The risks and costs from every 1-percent increase in such trade increase.
An optimum level of foreign trade is determined where these incremental benefits and costs arc
equal. Thus, we need to pitch our foreign trade to such ’optimum’ level rather than ’maximum'
level as determined by short term comparative advantage alone.
Thus we find that countries which have aimed at ever increasing levels of foreign trade have
crashed when the international markets have turned weak. By this time their economics have
been so thoroughly geared to meeting global
demand that they are unable to retrace their steps and revert back to a domestic demand-led
growth pattern.
The long term costs of foreign trade are likely to increase in the coming years because the
demand from the industrial economies is likely to crash. There is a strong underlying movement
towards global equalization of wages. This is slowly but inexorably putting pressure on (he
wages of the industrial countries and also their demand for goods from the developing
countries.
Therefore, we would do well to limit the integration of our economy into the global market. We
should aim at self-sufficiency in essential goods so that our domestic economyrcmains
unaffected by such global turmoil.
Therefore, instead of running after foreign investment, we must take measure to increase
domestic investment. It is not the shortage of capital but that of a pro-business environment
that hinders domestic investment.
Our trade policy should be as follows:
5
Increase import duties and provide export subsidies to
1
close the trade gap. This
would ensure that the economy is not getting structurally deformed into an import
dependent one.
2
Cross-subsidize small scale industries by increasing the cost of credit to large
capital-intensive borrowers. This will create more jobs.
3
Where necessary subject domestic businesses to limited spurts of import
competition to cajole them into global competitiveness.
4
Shift internal terms of trade in favour of agriculture to reflect the shadow cost ol
urbanization.
Welfare State
Government expenditures on social sectors have two opposite effects:
1
food.
They lead to betterment of lives of the poor by provision of health, education and
The taxes imposed to finance these expenditures reduce surplus with the business,
2
hit at investment and job creation and at the poor themselves. A further negative
effect of the welfare state is that it makes the people psychologically dependent on (he
government instead of invigorating their efforts at self-earning.
An statistical analysis shows that those states and countries which have delivered good
governance have achieved better growth rates and poverty eradication than those who have
incurred heavy expenditures on the social sectors.
Instead of increasing government expenditures on social sectors our policy should be as
follows:
1
Increase government expenditures on public goods like water supply and reduce
those on private goods like heath cure.
2
Dovetail a 'Right to Work' programme within such a provision of public goods. The
will
poor
be able to secure social services with such income.
Regulate private providers of social services like education and health. This will
3
provide succor to the poor from the exploitation of the private providers.
4
Honour our tradition of private charity to take of the poorest of the poor.
6
1 WELFARE STATE
[Public expenditures on private goods in social sectors have direct positive effects but indirect
negative effects due to imposition of taxes, curtailment of investment and lesser job creation. It
is shown that the latter predominates. Therefore, instead of providing social services, the
government must switch to the provision of public goods and regulation of private providers ol
private goods].
WORK VERSUS WELFARE
Two Levels of the Problem
The objective of the government is to secure the welfare of its citizens. Our constitution states
"The state shall, in particular, direct its policy towards securing that the citizen, men
and women, equally, have the right to an adequate means of livelihood" (Article 39(a)).
This is fine. The problem is that such welfare of the people can be secured by two almost
contradictory policies.
Tax the business and spend the money in provision of the means of livelihood to the
1
poor. Even if they do not have an opportunity to work and earn, let food, housing
education and health be provided to them.
Minimize tax on the business and enable it to provide jobs to the people, who then
2
secure their livelihood from such income. Enable the people to work, earn, express
themselves, and autonomously secure livelihood in the process.
Our suggestion is that work-based livelihood has two distinct advantages. First, il enables
people to realize their higher faculties as human beings. Second, it leads to greater economic
growth and better lives for all.
Gandhi
Gandhi was a harsh critic of consumption-based approach to human welfare:
The Western civilization has "bodily welfare (as) the object of life... This civilization
takes not neither of morality or religion" (1908:17).
He felt that material welfare was an endless trap:
"We notice that the mind is a restless bird; the more it gets the more it wants, and slill
remains unsatisfied. Our ancestors, therefore, set a limit to our indulgences. They saw (hat
happiness was largely a mental condition. A man is not necessarily happy because he is rich,
or unhappy because he is poor. Observing all this, our ancestors dissuaded us from luxuries and
pleasures" (\\1908:21).
The object of life, therefore, was not an ever increasing level of material well being, but to
procure "freedom for full expression of (one's) personality" (WPyarelal 1951:326).
7
The primary requirement for the expression of personality, or the discharge of one's duty by the
poor people of India was that work and food be available to them. Gandhi was too deeply
moved by the poverty and starvation that he had seen during his travels. Independence from I he
British was required precisely because the British had singularly failed to create such a society
during their rule.
Gandhi's solution to this problem was the charkha. He repeatedly stressed the role of the
charkha in the provision of this immediate relief:
"These starved men, refusing to work, were like mere animals. Now, how can wc
solve the problem of getting work out of people like this? I see no way except that of
universalizing spinning" (WDesai 1924:179).
Between work-based and consumption-based approach to livelihood, Gandhi preferred the
former
"I must refuse to give the naked by giving them
giving them work which they sorely need" (\\1921 a:227).
clothes they do not need, instead of
It will be clear that his focus was on provision of work. If basic livelihood is provided to the
people by doles, it may secure livelihood but it does not secure self-expression, which was the
objective of society.
Tagore
Tagore's economic thought is based upon what might be called an 'evolutionary' concept of
man. The purpose of this human life, according to him, is not mere consumption and yet more
consumption. He compares material consumption to the cooking of food. The purpose of
burning wood is not an end in itself. Its meaning arises in the food that is cooked" (1969:32).
"Progress has come to mean to go on walking without ever reaching the home" (\\1969:33).
Thus, mere increased consumption or improved standard of living was not the objective of life.
Modem technology makes it easier to meet one's natural necessities with less effort. The
energies that are thus saved must be used for karma-kshaya. This is defines as 'working
out' one's inner tendencies. It is working out. There is no karma-kshaya in consumption because
there is no karma. Thus, for Tagore, consumption was at a discount and work at a premium.
Logically the next step was to reduce the role of government in welfare. People had to become
self-dependent. They should not only work and engage in karma-kshaya but also take care of
their social needs themselves:
"Today the thoughts of the Bengali people has been separated from the villages.
Today the responsibility of providing water is that of the government. The burden of health
provision is upon the government. For learning also one has to knock at the door of the
government. The tree that flowered itself today begs the sky for a rain of flowers with its naked
branches."
8
This is as direct an indictment of the provision in our constitution that the state shall secure
adequate means of livelihood as provided in our constitution.
Amartya Sen: The Futility of Endless Choices
The thinking of Gandhi and Tagore is based on working out one's inner tendencies and restraint
of consumption. In sharp contrast Western thinking makes no distinction between the inner and
external self of man. It is entirely based on expansion of material consumption. One modern
variant of this approach of consumption-is-welfare is the concept of expansion of choice.
Economist Amartya Sen is the votary of this approach. He says:
"Both the fasting monk and the starving pauper may be hungry—the difference is that
one exercises a free choice, and the other does not." (WHuman Development Report).
Therefore, he concludes, instead of worrying about generating growth per se, we must begin
examining whether it leads to expansion of choice or not.
It is true that industrial societies do provide a wider range of choices to their people. But it is
equally true that these high standards of living are not translating into a better quality of life.
Let us examine this by an example. John has high education, income and health. He has a wide
choice. His heart's desire isto eat good food. But he sees on the TV the money that the tennis
players make and the acclaim they get. His mind develops an attraction for tennis. He exercises
his choice and goes playing. At the end of the day, however, he is not happy. In the exercise ot
choice of tennis, he has missed out on a good meal with his friend. His heart's long standing
desire for good food remains unfulfilled although his mind's newly acquired desire has been
fulfilled. He is distraught not because he has limited choice but because he has exercised his
choices incorrectly.
Now, let us say he, that is, his mind, somehow realizes that his heart's desire is that of eating
good food. So he travels around the world enjoying food in various countries. This time around
he exercises his choice correctly. But, after a while food also gets into a rut. The bother ot
travelling becomes too much and he can tell the taste by the look of a dish. It becomes boring.
Again he becomes distraught.
The reason is that having fulfilled one of his heart's desires, he has failed to move on to other
deeper desires. Perhaps, at a deeper level, he wanted to listen to music. But, not realizing this,
he kept on eating more of good food. Even the exercise of choice correctly did not lead to a
satisfactory life for him.
Interestingly, if he had been listening to his heart more attentively, he might have understood
his deeper desire to listen to music earlier. Food would not have retained the same attraction. 11c
could have reached music easily by restraining his longing for food.
Therefore, it is self-restraint not expansion of choice that can lead to a better quality of life.
John made two mistakes. First, he allowed his mind to lead him into tennis while his heart
wanted food. Second, he did not realize that 'food' was not the deepest of his heart's desires. It
o
was just the one that was most prominent at a particular moment. He should have tried to
discover other deeper desires of his heart as he went along.
The improvement in quality of life, therefore, can come not from expansion of choices but by
choosing wisely within what is available. By restraining oneself from the non- or superficialdesires one reaches deeper into one’s heart and improves his satisfaction with life. The extent ot
choice that is available is, really, irrelevant. What matters is giving correct direction to oneself
within the choice that be available.
The basic proposition of welfare state is that people should have more income, education and
health to be able to expand their choices. This is fallacious. Surely, people should have more
income, education and wealth but only so that they can fulfill their inner desires and transcend
them. The manner of provision of such welfare, therefore, has to be such that helps them
transcend. It has to be work and self-expression based provision.
The Environment Lobby: Limits to Consumption
The environment lobby argues that man must be able to consume in the long run—'sustainable
development.' They are afraid that if man consumes too much of the earth's resources today,
not enough may be left for the future generations. In order to ensure that future generations can
consume and consume and consume yet more, they say that we must take some precautions
now. Some of the 'key priority areas' for action are: energy efficiency, environmentally sound
technologies and conservation of fresh water resources.
No dispute with these. That, however, does not solve the inherent conflict between demand and
supply. If earth's capacity to supply is finite and mankind's desires are infinite, small
improvements in the supply brought about by such measures do not really eliminate the
imbalance. The hard fact is that there is no solution in the long run except by curtailing man's
consumption.
The question then is how to promote man's welfare while restricting his consumption. We have
to seek ways of enhancing people's welfare without requiring unlimited increases in
consumption. It is here that our philosophy comes in. Our Sages developed a four point
progressive scale of desires or vasanas—lowest being material consumption followed by money
making, power-seeking and self-understanding—kama, artha, dharma and moksha. They said
that all human beings have all the four desires. The purpose of man's life was to evolve from
the lowest-kama, to highest-moksha. Thus consumption, money-making and power-seeking,
or kama, artha and dharma, were all certainly necessary but only as a means to attaining
moksha.
For the Western environmentalist, kama is the sole purpose of human life and objective of
social and economic governance. Success is judged not by how many saints it produces but by
the number of cars that it does. Kama is at a premium and moksha at discount. GDP per capita
is the high altar of all measures of human progress.
Our sages broke this logjam by saying that consumption, or kama, is the lower of one's desires.
It is to be fulfilled as much as necessary but no more. The objective of life was to transcend
kama and move on to artha, dharma and moksha.
io
^L.|l
•-
HEALTH
i
/
ECONOMICS
INDIA : A review of work done and an agenda
IN
•for research under Panchayati Raj .
- by Ravi Duggal
Economics
ot
health
care emerged
a yt, a
discipline
in
the
seventies in w e s t e r n c a p i t a 1 i s t e c o n o m i e s b e c a u s e t h e n e e d t o c u r b
escalating costs of health care had become urgent,
in
the f i scal c risis
context o-f
the
a 11 r a c t q 1 o b a 1
heal th
Heal th
The World Bank got interested in this area and
T h e W H 0 t o o f 1 a r e d u p t h i s a r e £«.
b r o u g h t o u t v a r i o u s p u b 1 i c a t i o n s..
to
capita1ist
First World Congress on
need culminated in the
E c o n o m i c s i. n 1980.
t ha t t ac ed t he
so
1973)u
s t a t e (see 0'connor,
T his
especially
issues on
attention to
h e a 11 h e c o n o m i c s
and
H e a 11 h A s s e m b 1 y
to
t he 1987 Wor1d
•financing by devot:i.ng
this theme.
Tod ay
considered
health
health
as
and
economics
in
importan t areas
p o 1 i. c y m a k i n g
even in
heal th
■f inane inq
the former it developed
least) 11"* e p u b 1 i c
countries
be
countries
is
as a response to
investment in the
countries.
capitalist
escalating costs but in the latter no such need
(at
11 may
deve J.oping coun tries«
not independent of the interest in western
In
r ese a r c h an d
h e a 11 h s e r v i c e s
noted that the interest in this field in developing
being
are
their need to
existed
cur b
because ,
h e a 11 h s e c t o r i n
these
is at best marginal compared to the requirements of the
population in terms of a minimum decent 1eve1 of deve1opment-
In
t he d eve 1 o p i n g c oun t r i es
this interest has
appeared for
two
e c o n o fn i s t. s
of
are
poor m
Hence n
many o-F our
own )
•fee 1 th cit
cduntries
Fi rst ly j.
these
the west
(as we11 as
reasons.
T he r e f o r e , t h e y
i s a lack of resources i n t h e s e c o u n t r i e s „
there
care i n u s t b e t a k e n i n c o m m i 11 i n g r e s o u r c e s e s p e c i a 11 y t o t h e
•Feel
soc i a. 1
To
sec tors..
sort out
experts
i n t e rn a t i o n a 1
this problem
to
have come
Ct f
their aid
resource
c run c h
through
various
•funding agencies with low-cost models which would reduce strain on
resources.
T h e s o c alied v o1untary sec to r i n I n d i a h a s b e e n m o s t
w i 11 i n g
obiige
to
agencies
in 1 o w - c o s t h e a 11 h
e x pe r i m e n t s
by
ou t suc c ess f u 1
carrying
c a r e d e 1 i v e r y , especia 1ly
d emo n s t r a t i ort h as
This
areas -
rural
these
he 1 ped
in the
c h a n g e g ov e r n men t
h e a 11 h p o 1 i c y t o w a r d s s u p p o r t i n g s u c h p r o g r a m s „
Second 1 y j,
changes
in
n e w m e d i c a 1 t e c hn o 1 o q y
hea 11 h
de1ivery.
care
h a s b r o u g h t a bo u t
It
rad ical
comp1 eted
I" 11 id
the
commodification of health care and made it an extremely profitable
business -
This
now
which
Ananthram,
to
demand
has brought
into
the fold
a stepping
up
of
c o r po r a t e i n te res t s
fj r i v a t i s a t i o n (J e s a n i
and
1990).
Hence
bie a 11 h e c o n o m i c s an d he a 11 h f i n an c i n g be c o me i m po r t an t
he 1 p
focus
concerned
today
and
debate
various
issues,
especially
w i t h res ou r c e a11oc a t i on an d man ag emen t.
the
framework
and context
of
t his
However
ti 11
d i sc i p 1 i n e h a s
been
largely
r e s t r i c ted t o J. i b e r a 1
wes te rn ec o n o m i c s „
thought
c u r r e nt/idealog y
d i f fused rapid1y
c learly
in health
has
policy and
prog rams both
those
In
India this
a n d i s r e f 1. e c ted
in the
pub1ic
and
way
on 1 y
p r i v a t e s e c t o r s.
In India health services research emerged in a big
■
in
bee oiTies eas i 1 y ava liable
•f and ing
m i d -e i g h t i e s
hea 1 th
area of
im po r tan t
+inaneing
too
•f i n a n c. e s s u c h r e s e a r c h e -f -f o r t s .
i n t e rn a t i on a 1
And
suc h p u r p o s e s .
for
and
that
•fact
health
econo fn les
becofties an
1 n s t i t la t i or-! s
s u. b s e q u e n 1 1 y g e t. s
Today a -
the
in
j lACH p
i n te re s te d an d
f
ao-f
airiaunt
groundwork
i
r
been done and the -foundation laid for the development or this
the
o p era t. i o n a 1 a s p e c t s
research institutions dominate
research
•focus o-f such
U n -f o r t u n a t e 1 y t h e m a j o r
d i sc i p 1 i n e on 1 y
o
the
n d n i a n y r e s e a r c bi
research
T h e g o v e r n m en t
into
has
t
prifftarily due
the eighties
h e n c e m a n a g e rn e n t
an d
t I'i i s -f i e 1 d n
and
is
market
T h e p o 1 i 1.1 c a 1 e c o n o m y
aspects are being looked into by only a couple o-f institutions.
1 i k. e I n d i a i t
a n u n cl e r d e v e 1 o p e d c o u n t r y
For
is the
1atter
kind o-f research that is more important to understand analytically
the
ranging
w i ci e
research.
We
are not
research.
11 i s
area of
o-f
issues in
this
u n d e r es t i m a t i n g
the value
o -f o p e r a t i o n s
and complex
set
i m port a n t „ b u t.
it becomes
m e a n i n g 1 e s s i -f
backed up by signi-fleant research in political economy
o -f
not
hea 1 th
care.
Be-fore
• w e p r e s e n t a r e v i e w o -f known studies in this -field in
India it is important to briefly discuss the context in which such
research
has to be placed i . e. t h e u n d e r d e v e 1 o p e d s t. a t e o -f h e a. 11 h
services in I nd ia.
care
.1 gives a historical
Table
overview of
health care s e r v i c e s and he a 11 h -f i n a n c i n g in India.
There is a remarkable continuity in the colonial character o-f
hea 1 th
enclave
services
development
pat t e r n o -f d e v e 1 o p m ent
in
the
present
continues
times .
urban
The same
c on c en t r a t i on 3
class/caste biases? state subsidies -for the private sector
and
a
i n ci e v e? 1. o p 1 n q t h e
part of the state
lack of interest on
general
health sector, tor universal access«
T h e h e a 11 h p o 1 i c i e s a n d
the rura 1 --urban differentia 1 deve 1 opment.
aval lable
the
t he
to
access
primary
are
not
a d e q u a t e 1 y u n d e r t h i s p r i m a r y h e a 11 h c a r e a p p r o a c h «
In
services
med ical
basic
programs
control
dis ease
med ica1
c o m in u n i c a b 1 e
and
f am i 1 y p 1 an n i n g
mean s
in effect
care
he a 1 th
and
I n I nd ia
p r i. m a r y h e ca 11 h c a r e .
W H0 p o p u 1 a r i s e d as
better
V i 11 a g e s t o d a y h a v e
r e s i d e s i n v i 11 a g e s .
papulation
•a
when 3/4th of
in urban areas
a r e a v a i 1 a b 1 e m o s 11 y
services
Haspi tai
h e a 11 h s e c t c:< r s .
of the urban
de'--el opmen t
favoured
clear1y
have
government
the
of
pre grams
whs t
is
s p e c i a 1 i m p o r t a n c e i n t h e c o n t e x t o f h e a 11 h e c o n o rri i c s ?
Of
t o w n s a n cl c i 11 e s t h e r e i s fj o p r i h i a r y h e a 11 |-i care a p p r o a c I": b u t
de1ivered
through
similar bias exists with
regard to
services
medical
simp1e
and
pu!-~e
being
d i s o e n s a r i e s a n d h o s p i t a 1 s»
t he p r i v a te sec t o r a
In
a11opathie
p r o f e s s i o n a 1 s«
ce~ ters.
In
rural
areas
a
variety
and
unqualified )
are
They
(qualified
fi o n - a 11 o p a t h i c
of
and
allopathie
practice
‘quacks'
urban
in
located
mos 11y
medicine and provide services at whopping costs to the population
care
private
me d i c a 1 p r ac t i c e
a lucrative
district of
study
in Jalgaon
heal th
expenditure
to
be
t
and Amin,
1989).
a suppliers
per
were
ma r k e t m a k es
a recent
found net
capita
per
a
i
spent
by the pgovernment
The r ia r a 1 — la r b a n d i f f e r e n c e s a s
expenditure
In
business u
Ma ha ras h t r a w e
Rs.174.99
per c
o
Rs.26.09
coiiipar ison
heal th
basica1ly
services being
Hee. 1 th
n o t s i g n i f i c a n 11 y
regards
different.
a
private
year
in
(Duggal
t
a
private
In fact
users a-f public health services were significantly higher in urban
areasn
a n ci n o n - ci se r s o+ any type c.H: service higher in rural
( i bid ) .
This i.s a c 1 e a r
h e a 11 h s e r v i c e s „
jl n d i c a t i o n
o F gross i n a d e q la a c y o -f p la b 1 i c_
We will not.
espec.iall.y in rla ra 1 areas„
y'~'
in to
any
•Flak 'then details as this is a well d o c la i n e n t e d a r e a a n d T a b 1 e
is
sei•F~-explanatory showing the slow growth o-F health services in
q e n e r a I a n d t h e g r o w i n g r la r a 1
la r b a n
1
1. n e q la a 111 y .
Review of Studies done in Health Economics/Financing
Hea1 th
sources.
care
services
•F inanced
are
It is iinportant to
through
a
variety of
u n d e r s t a n d a 11 these i-F
the review
iTi la s t. b e c o m p 1 e t e
Sources of Health Financing
The
1 east
1 a r g e s t s o la r c e
of healt.fi
sec tor n
e x p en d i tu res
India (and
are p r i v a t e h o la s e h o 1 d s '
d oc u me n ted an d k n o w n )
of-pocket
financing in
that
go
mostly
to
the
direct out-
p r i v a t e h e a 11 h
In the Jalqaon study we found tl- .at 88% of
a
health expenditure goes to the private health sector
Amin,
t he
household ■’ S
(Duggal
and
198?)H
The. Ministries of Health of the Central a n d S t a t. e g o v e r n m e n t s
finance
p u b lie h e a 11 h c a r e s e r v 1. c e s -
d i s pe n sa r i es „
hea1 th
centres„
government owned hospitals,
me d i ca1 colleg es
etc . «
T hese
services
a re avai1ab1e to
services
(of course„ reg i s t r a t i on
services t.
as well as for certain class of patients does exist but
all c i t i zens w i t.hou t
any charges
fees and charges
for
for
certain
it.
const i t u. t e s 1 e s s t h a n 17n of the expencl i ture by t.his m:i.n ist.ry ) .
For
instance in 1984-85 the
Central and State govern merits
Rs - .34 x 638.46 mi 11 ion on a 11 it e a 11 h s e r v i c e s a n cl i t
Rs.
other direct receipts like medical e d i.!. c: a t i o n -t" e e s .
If we add
Post
&
Government
M i n i s t r i e s a n cl
Telegraphs, Mines
heal th
care
by these
amoun t.
substantial
to
cl e p a r t m e n t s 1 i k e l::;' a i 1 w a y s
and Steel, Defense
d e p a r tmen t i s
e t c. a 1 s o s p e n d
Tot a 1
not known
but it
is a
For instance the P & T department in 1988-89
2
(CBHIn
on
expenditore
spent Rs. xi 2 2 m i 1 ]. i o h a n d t h e Rail w a y s s p e n t R s . 1 ,2 7 2
1987-88
bare 1y
t o t a ]. h e a .11 h e x p e n d i. t li r e (CAG-1989).
he a 1.1 it se rv 1. c es bu. t on 1 y f o r t he i r em p 1 o y ees..
on
hea 11h
pu. b 1 i c
services and sale of contraceptives even t h e n i t c o m e s
□ t he r
on 1 y
received
104.03 million (or 0.37„) a s c h a r g e s f r o m p a t i e n t s»
0.5 Z o f t h e g o v e r n m e r i t s'
spen t
1989).
T here
a r■ e m a n y m o r e
mi 11 ion
in
cl e p a r t m e n t s b i g
and
s m a 11 w h o s p e n d on h e a 11 h care a n d w h o s e e m p 1 o y e e s q e t f a i r 3. y 4 g o o d
services
or
r e i iii b u r s e m e n t
consider
the
fact
of
that the
costs
for
government
is
treatment «
When
one of
the biggest
employers in the organised sector and the fact that
spending
Rs.148/- per beneficiary
Rai 1ways
(e m p 1 o y e e a n d f a m i 1 y
we
are
members)
the total finances involved from this source must be very large.
Li ke
the
government
departments
a
1 arge
proportion
of
organised sector employees in both the private and
pub1ic
get
some medical benefits
f r o m t h e i r e m p 1 o y e r s.
Information on
this
source is also poor1y
documented.
administered
per
t h r o u q h t h e E 81S, w h i c h
benef ic iary.
8imi 1ar 1y ,
Part of this
sec tor-
benefit is
i n 1986-87 s pent Rs.
99.58
1 a r g e p u b 3. i c s e c t o r u n cl e r t a k i n g s a n d
private companies spend between Rs„700 and Rs.1200
per
emp1oyee.
I1
In
the
benefit
J a 1 g a on
received
by
study we
such
have
-Found
employees
to
be
ben e f i c i ary (em p1oyee and f am i1y mem be rs).
to
even half of
t h e to t a 1 o rg an i se d
the average
about
medical
Rs. .100
per
If we extrapolate this
sector the resources
being
spent will amount to a huge sum.
Another
bodies j.
source of
access
heal th
finance are
the local
especia 11 y the municipal ities and municipa 1 corporations .
on municipal finances is
Data
the
important
today very sketchy? it
exists but
is difficult because of the sheer' lack of compilation.
pre-- i n d e p e n d e n c e
period
alongwith
state
Jalgaon
district
we
(which
is
for urban
government
finances
on ly
heal th
entire district.
municipal
but
found
that
that
areas)
expenditure
finances
practice
municipal
was
were
has
compi led
stopped.
hea1 th
In
In
expenditure
117. more
than the total
(e x c 1 u d i n g w a t e r
supply) for the
So this again is a v e ry m a j o r source
of
heal th
care funding.
Some of the other sources that are as yet small in volume are
health insurance packages (private and public).. foreign assistance
and
local
scattered
charitable
initiatives.
and requires a
Data
1ot of research
on
these
sources is
initiative to
compile
it.
Studies in Health Economics
There
have
colonial India.
I
had
been very
few studies of
the health sector
At best these studies have been
ma inly been un d er taken
to facilitate health
descriptive
in
and
administration.
Heal th
e c. o n o m i c s o r h e a 11 h t i n a n c i n g
as an issue definitely
cl i cl
not -figure.
c:> t t h e e £■< r 1 i e s t a n cl
One
Crai/rford „
a
by D..G..
His two volume history of the Indian Medical Service
classie (Crawford
on a
best documented studies is
19.1.4) ..
."i. s
0-f course n hi s work .1 s b a s e d 1 a r g e 1 y
lot o-f similar exercises undertaken by his p r e cl e c e s s o r s „ on 1 y
the latte;
ch jcueents are not easily accessible today.
B u t t h e f i. r s t d o c u m e r«t t h a t t a k: t.-.' to a s m ax 11 p e e k at the areax o-f
hea 1 th
•f inane ing
(1938).
is
E!rad-fields'
I his is perhaps tor
pertaining
to the health
1 it.erat.ure
(o-f
heal th
course
Indian
Medical
the -first time that
sector is discussed
data
e;• p e n d i t u r e a r e
’’ An
on
c e n t u r y o r p e r hi a. p s e v e n e a r 1 i e r,
tinancial data
in I nd ia ' s
g o ve r n me n t t i n a n c e s
ava i 1 a b 1 e s i n c e
Review"
the middle
•for public:
o-f the
India
analysis
o-f health
conditions
which was undertaken by
Committee
.1 9th
i n o -f -f i c i a 1 d o c u m e n t s ) .
B r ad -f i e 1 d ' s r e v i e w i n a sense was an a n t i c i p a t i o n o -f
detai led
hea 11h
4
a
more
and health
services in
t h e H e a 11 h S u r v e y a n d
Development
under the chairmanship of Joseph Bhore between 1943 and
1946 „
f h e E< h o r e C o m m 111 e e R e p o r t was the first detailed analysis of
the health situation in India (GO I „ 1946).
is
exhaustive
analysis.
heal th
leaving
out. no
It provided a very
service
r e c o m m e n cl a t i o n s
a r ea
f h e f o u r v o 1 u m e re [Sort
re 1 a ted
to health
comprehensive plan for a
in
nationa1
in India.
Not only is
i t u n -f o r t u n a t e t hi a t
of
commi ttee ?
which
this
decentralized heal th care services structure,
provided
its
•f o r
the
a
r e m a i ri u n i m p 1 e m e n t e d
F
but it is also tin-Fortunate that such a c o iti p r e h e n s i v e
analysis
o-F
the India health situation h ci s n o t t a k e n p 1 a c e s i n c e t h e n B
The
on 1 y
heal th survey
in
p r e i n d e pe n d e n t I n d i a
known to have looked into issues re1 a ted to hea11h
the Singur Hea 11h Survey in Senqa .1. i n 1944..
Lal
which is
economics
"I" h i s survey
by R»B
provided the -First known estimate o-F private househo 1 d hea 1 th
expenditure
in
India „
This
survey
recorded
private
heal th
expenditure to be Rs - 2B50 per capita per year in the
Sinqur
whic h was seven times more than what the
government
was
(36
was
pai sa)
on
hea1 th
care
services-
Together
expenditures constituted 47; o-F per capita GDP at that
e t. a 1 . ,
spending
bo t h
these
time
(Sea 1
8»C n
Sea 1
1958)„
T h e f o u n d a t i o n laid by R.B. Lal was built
upon by
during
area
his tenure
at the
Al IHy&F'H..
Sea 1
carried
out
4
genera 1
heal th surveys in 9 districts (o n e i n e a c h s t a t e)
between 1955 and
1958 „
These su rveys w^re one o-F the -First of its kind
in India
and they recorded
p r i v t e h o u s e h o 1 d expenditure«
The average
private household expendi ture recorded
in
these su rveys was
Rs.3.34 per capita per year and
it ranged from Rs .. 0 „ 29 .in
Raj asthan
to Rs.10,40 in Bengal (Seal et,.al:i
respective years).
In the resurvey of Singur in 1957 this
e x pend i tu re wo rked
ou t to
Rs.5.60 per capita per year (Sea1 et.a1.
.1958) .
The
only other major
survey resu1ts that
India are those from the National
Sample Su rvey.
of
the
recorded
and
NSS
in 1951
private
as Rs.5.77 per capita
R s. 11 0 4 i n u r b a n
areas)
household
are available
In the 3rd Round
hea. 11 h e x pen d i tu re
per year (Rs,3.84 in
(NSS,
1952).
in
was
rural areas
Alongwith the
state
JO
health expenditure in that year t bi e t o t a 1 w o r k s o u t t o f s. 6.6 3 p e r
6.7 times
NSS
be i n q
GDP; private health expenditure
w h i c h w a s 2.5 3 7.. o -F
capita
state health expenditure.
ot
i ri
i t s c o n s u iti p t i o n
has
s u rveys
re c o rd i n y
been
h e a 11 hi
expenditure, but -For the MSS this is not an important category and
hence in i t s r e p o r t s h e a 11 h .1. s n o t r e p o r t e d s e p a r a t e 1 y b u t
oF
'' m i s c e 11 a n e o u s q o o d s a n d
services".
s pa r t
makes
CSU
However, the .
e s t i m a t e s a n n u a 11 y b u t t h e s e a r e q u e s t i o n a b 1 e .
heal th
Public
Comptroller
and
Auditor
is
Gen e r a 1 ‘ s C om b i n e d
e a s i 1 y a v a i 1 <a b 1 e F o r
F i n an c e an d Reven ue
has never been analysed in a n y s i g n i f i c a n t m a n n e r „
has
b e e n 1 oo k i n q a t
t hi i s d a t a •F c j r
the last two
plans«
five-year
It must be
for4
c r i t i c a J.
a
in India d u r i n q t he
the
first six
pointed out here that
whenever any
taken up either by
the Planning
analysis
o f hi e a 11 h f i n a n c i n q i s
Commission
o r a c ad e m i c i an s aq d
i s s u e s o n 1 y P1 a n d a t a i s u s e d .
The FRCH
years
period 1951-52 to 1984-83 and will s o £3 n b e p u b 1.1. s h i n g
of public health finance
t hi i s
However j,
s c:. r u t i r i y a n d a n a 1 y s i s.
data
analysis
the
through
available
These are the audited accounts o-f the nation and
A c c o u n t s (C F R A) .
are
data
•F i nance
hea1 th
re s e a r c h e r s i n t e r e s t e d i n
Non-plan data that constitutes the
larger portion has very rarely been considered for
analysis.
We
Sec tor Heal thi
Services
and
hope
that the
FRCH study on State
F i n a n c i n g -F i 11 s t h i s q a p p a r t i a 11 y (s e e D u q q a 1 ,
19 8 ;
for
19 9 0
a
pre1iminary analysis of this).
The
1986)
1imited
!
L
Operations Research Group has done 2 studies (ORG,
1985;
a
very
of state
sector health
coverage.
A study
financing but
by I IM, Ahmedabad
these have
provides a
better
out o-f it depends entirely on who grabs this opportunity.
i
If
it
is going to be the same marketing and management institutions then
the
same story as in the c a s e o + h e a 11 h s e r v i c. e s r e s e a r c h w i 11 be
repeated.
Local
bpdy f inanee c onsti tu tes ano the r
i m p o r t an t a re a w h i c h
a 1 so
has not received any attention inspite of the fact that with
some
effort the data can be put together-
recent
years c ont r i buted i m po r tan t
finance (NCAER,
In
the
19805 NIUA,
s tu d i es o f u r ban
b o d y f i n a n c e d a t a was
after Independence this
and hence it fs no longer compiled at the national
is
local
body
1989) - see' Table 1 -
the colonial period local
National Accounts but
NCAER and NIUA have in
part of
was separated
1eve1 -
There
perhaps a need to revive this compilation so that consolidated
data is available for analysis.
The
studies
voluntary
heal th
4
sec tor J
corporate
sec tor j,
hospital
are areas where some sketchy work has been done but these
are
emergent areas for further research.
of
the
voluntary
sector
is
getting
Infact health financing
special
attention
assistance from Ford Foundation (see special issue of
Heal th
wi th
f nr
the Millions Vol.XVI Mo.3) and a lot of research and documentation
has already been done.
An agenda for Research under Panchayati Raj
One important fact that emerges out of the above
■
should
review
and
be of direct concern to Panchayati Raj organisation is the
r
o-F health financing in
review
of
Rog er Je -f t e r y ' s
time but
I n cl i a '
\1988)
sec tor i n
India that
(1985)
(I IN,
1987 )
book
'■ The
Politics o-f
the
he? a 1 th
g i ves
” H e a 11 h a n d F’ a m i 1 y P1 a n n i n q 8 e r v i c e s i n
more
and
a better
I nd ia in
c r i tic a 1
the
an a 1ysi s
of
p o s t •" i ri d e p e n d e n c: e
T h o u g h h e a 11 h f i n a n c i n q a n d e c o n o m i c s d o e s n o t f e a t u r e i n
classical
sense
a fair1 y
■=> o li ri d a ri a 1 y i s
e c cj n o m y o f h e a 11 h i s p r e e n t e d .
However,
of
it is
the
po 1. i t i c a 1
manner..
sign i fleant
g i ven
espec ial1y
t ha t
unfortunate
none of these? works looks at the private? health sector in
any
in
Hea1 th
of the state?
the first review
d e v e 1 o p m e n t o f h e a 11 h s e r v i c e s i n
period a
at~a. sing 1 e poin t
1 oo Is a t h e a .11 h f i n an c i n q h i s t o r i c: a 11 y an d i n
Banerji's
D.
some detail.
I nd i a ’
is perhaps
I nd ia
the
f ac t
I ri d i a i ri
that
it
c cj n s t i t u t e s a n o v e r w h e 1 m i n g p r o p o r t i o n o f t h e h e? a 11 h c a r e d e 1 i v e r y
strueture .
Perceiving
hea1 th
t Ft i s
s he e r a bs e n c e
of
analysis of
sector PRCH has undertaken a number of studies in the past
five years to try and establish a data base that will
proper
analysis of
sector.
sec tor
and
the private
the po 1 i ti c a 1
T hese s t u d i es
(desani et.al.
Amin
1989 ) ,
Ananthram,
corporate
sector
investment
in
p r i va t i sa t i on
a
have looked
.1988) ,
p r i v a te
1990),
economy of
heal th
d istr i c t
the private
so called
heath
vo1untary
house hoId he a11 h e mpendi tu r e (Dugga 1
sector
private
at the
facilitate a
a n d p r i v t i s a t i on
p r a c t i t i on e r
b e n e f i t s (o n g o i n g )
(on q o i n g)„
Given
c 1 i fi i c s
(d esan i
and
(ongoing),
a n d c o m p 1 e t e hi e a 11 h
the
fast pace
of
and e x p a n s i o n o f t h e p r i v a t e h e a 11 h s e c t o r research
initiatives in this area are being taken up and many international
ag en c i es a re c om i n g forw a rd to su p po r t suc h s t.ud i e s .
the next few years health economics.
private
sector,
I n f ac t n
in
e s p e c i a 11 y a s i t c o n c e r n s t h e
i s i n f o r a boom period.
W h a t r e s e a r c h w i 11 come
bias ot health care services in I n d i a -
urban
Whatever little has
a p p ro p r i a te d
developed in t h e h e a 111"! sec t o r o -F I fi d i a h a s b e e n
The re to re j, ti Ft d e r P a n c h a y a t i R a j
the industria 1 --urban sett 1 ements..
reo r i en t a t i u n
o t li e a 11 11 c a r e
benetit
se rv i c es t o r t he
p o p i i. 1 a t i o n s i s v e r y j. m p o r t a n t..
by
ru r a 1
ot
betore we get into research
Hence..
i t i s important to lay out a structure tor the development
issues
o t h e a 11 h c a r e s e r v i c e s u n d e r P a n c h a y a t i P a j o
I Fi
th is context it must be pointed out that the basic trame
work ■ a 1 r e a d y e x i s t s i n t h e r e c o m m e n d a t i o n s o -f t h e B i'i o r e C o m m i 11 e e
Report
1946) ..
( G?CJ I n
We will
Ft ci t g o
11"! i
details ot
into the
r e p o r t b u t w o u 1 d o n 1 y c o m m e n t t h a t w e a q r e e w 11 h i t s b a s i c u n i t o t
us.mg
the
.10 n O 0 0 p o p u 1 a t i o n
•F o r e s t a b 1 i s h i n g
1 eve 1
we tee 1
min imum
a
(and this
decent 1 eve 1 o t h e a 11 h i n t r a s t r u c t u r e«
B r i e 11 y
may be a 1 i 111 e m a d i t- i c a t i o n o t B hi o r e )
t h a t t hi i s 1 e v e 1 should have
a
hospi ta1
bedded
50
g y n a e c o 1 o g i s t .t
T he sc
a medical specialist and a general surgeon.
shoald b e s u p p o r t e d b y 10 n u r s e s :i * 4 p u b 1 i u h e a 11 h nurses
p a r a m e d i c p e r 1000 p o p u 1 a t i o n .
a
P r ac t i t i o n e r s ,
Genera1
2
with
ai id
one
T hi e d o c t o r s m u s t b e m o b i. 1 e b y t u r n
to provide support to PHNs and paramedics who would
be
providing
strueture
w i t hi
T he 10 000 pcj piu 1 a t i on 1 eve 1 i s £< p r a g m a t i c a n cl e c o n o m 1. c
1 eve 1
domici1iary
T hi i s
care.
must
be
a
universa 1
adequate support ot secondary and tertiary levels.
to
set up
services„
a variety
ot services
and p rograms ,
hea1 th
H e n c e t fi e b a s i c c o n t r o 11 i n g u n i t o t t h e P a n c hi a y a t i R a j
should also be at this level.
with
Such Panehayati units should
complete
c o n s t i t u t i o fi a 1
creation
adm i n i st ra t i ve
and tinaneial control .
and
besides
management
must
necessarily
that
powers
However
vest
be
a
tac i1i tate
technica 1 c on t ro1
w i t. h
t he
concerned
p r o -F e s s i o n a 1 b o cl y
the
intention
o t this
to discuss a
paper is not
Sin e
p r o -F & s s i o n 1 s..
i n t h i s c a. e t h e h e a 11. h
mode 1 we will
leave this here and move on t o r e s e a r c: h i s s u. e s«
base „
ep i dem io 1 og i c a 1
service
researsh
This
is the
:i. n I n d i a u
most urgent
in nature
on 1y c1 inica1
not be
soc i a1
an d p o 1 i t i c a 1 b a s i s „
hea1 th
ot
health
E p i d emo 1 i og i c a 1 re s e a rc h
services b e o m e s a m e a n i n g 1 e s s exere ise
shou 1 cl
need in
this n planning
Uii thoi.it
an
o-F
T he b as i c. we a k n e s s i n ola r hie a 11 h p 1 an n i n g a. s t hie 1 a c k
have a
but must
is
0n c e t h i s d a ta ba se
strong
es ta b 1 i s he d
o n 1 y t h e n ci o e s o t h e r r e s e a r c h h a v e a n y m e a n i n g »
1 -F
Closely linked to social epidemiology is social auditing..
socia 1 e p i d e m i. o 1 o g y c o n s t i t u t e s t h e r o la n d a t i o n o n w h i c h t h e h e a 11 h
mon i toring
s t r la c t u. r e m la s t b e e r e c t e cl.. social auditing is the
guiding
e .1 emen t
that
t ha t a ssu r e s
t i"i e hea 11 h
and
se r v i c es p rov i d e
s o c: i a 1 j u s t i c e «
To
bridge
intormation
soc i a1
e p i cl e m i o 1 o g y
and
soc i a 1
sys t em an d d a t a b a s e i s n e c es s a ry -
a
a ud i t
Tirm
A 1 o t o s- researsh
needs to he undertaken with the assistance ot health workers as t o
w h a t w o u 1 d b e t h e r e q u i r e m e n t s o -F s la c. h a s y s tern.
On 1 y
wi th
these Tacts
r e s e a r c h b e un d e r t a k en .
hea1 th
estab1ished
Hence,
can any
in t he p roc ess o t
s t r u c t u r- e u n cl e r F' a n c h a y a t i R a i
o t he r r e 1 e v a n t
c on s t ruc t i n g
a
the above issues have to be
discussed if the struc ture must be et Fec tive and e F t ic ien t.
Some
economics
ot the other important
areas o r r e s e a i" c h u n cl e r
wou 1 d be prescri pt i on
s t la d i e s 9 cos t a n a 1 y s i s
hea 1 th
stud ies,
r
uti1isation
studies, heal th worker-patient
re1ationshi p studies,
among many others that may be listed.
To
work
c o n c 1 u d e w e wo u 1 d
like to stress
that all the
that is undertaken should not be the prerogative of research
a
institutions or academic departments but they should be
e-F-fort
research
o f r e s e a r c h e rs , b u r e a u c r a t s , P a n c h a y a t i
matrix
1 ead e r s a n d o t he r
citizen body representatives and various health personnel involved
in providing health care services■ i
t
Table 1 i Health Care Berviceffi and Health Expenditure in India 1890-1989.
i
year;
__________ Health Care Services
Hospita1s &
Beds
Dispensarles
(7. Rural/
7. Pvt.)
—
1
Allopathic
Doctors
(7. Rural/
7. Pvt.)
3
Hea1th Expenditure
! State Municipal " Total
4 -i- S
(onlyurban )
(Rs, per capita)
4
6
5
1880;
1212«>
(MA/NA)
MA
MA
0.05
0..43
0„ 09
19005
1736“°
(MA/MA)
MA
NA
0.07
0„ 78
0.18
19201
!
5067
(MA/27..8)
55772
(NA/MA)
MA
0.12
1 ..67
0.30
1930;
6448
(MA/28..0)
67245
(NA/NA)
NAi
0.19
2.74
0.51
1940;
7441
(MA/12.7)
74111
(NA/NA)
47524
(WA/76)
0.18
2.0
0.46
0.61
NA
i
■
1951:
i
~2694 ”
(NA/NA)
Disp.,
6587
(79.3/NA) !
117000
(MA/MA)
61440
(MA/NA)
3374
(39.0/MA)
7446
(84.5/NA)
152888
( 23.5/NA)
76904
(MA/NA)
•3ju?.4-
(33.9/NA)
954*0
(79.9/MA)
229634
(22.4/NA)
I
83756
S
(29.5/60..4) !
3982
(33.0/WA)
10231
(79.9/NA)
295530
(20.6/W)
103184
(MA/MA)
3862
12180
348655
151129
(39.4/MA)
I
1'956!
i
19611
19=66 5
i
I
1971;
■
NA
MA
3.64
NA
6.47
24.68
(MCPER)
(1971)
12.88
48.08
(M2AER)
(1977)
i
i
1976!
4465
i
11696
i
448866
210504
i
1981!
6805
!(26.7/43.8)
16754
504538
(69.2/14.0)! (17.2/28.4)
I
268712
! 25.67
(27.2/70.6)!
>
7764
1986!
!(21.0/45.3)
25871
594747
(53.2/40.0) ! (17.6/26.1)
319254
(NA/73.4)
I
I
55.10
(NIUA)
(1987)
i
1989!
10145
*. (31.1/55.6)
a)
.06
334.48
(NIUA)
(1980)
29189
!
622668
(46.8/53.6)! (17.7/29.4)
352000
(NA/NA)
; 75.00
I
NA
Only state -financed institution
(
■
Sources of Table :
1.
'T
3.
4.
5.
6.
7.
3.
Health Information of India and Health Statistics of India,
CBHI, GOI, Various years.
Combined finance and Revenue Accounts, CAG, SOI, Various
years.
Statistical Abstracts of British India and Statistics of
British India, SGI, Various years.
NCAER : A Study of Resources of Municipal Bodies, 1980
NIUA : A Study of Financial Resources of Urban Local Bodies,
1983.
NIUA : Upgrading Municipal Services, 1989.
Shore Coaaittee, SGI, 1946.
Census of India, 1971 and 1981, Economic Tables, SGI.
References :
Bradfield ENC, 1938 : An Indian Medical Review, 601, New Delhi.
CAG, 1989 : Combined Finance and Revenue Accounts, 1984-85, CAG,
601, New Delhi.
CBHI, 1989 : Health Information of India - 1989, CBHI, Ministry of
Health, GOI, New Delhi.
Crawford D.G, 1914 : A History of the IMS 1600-1913, (2 VolsJ, W.
Thacker and Co., Calcutta.
Duggal R., 1986 : Political Economy of Health Financing',
‘Radical -Journal of Health', Vol. I, No.3, Dec. 1986.
Duggal R., 1990 : The Need to Realign Priorities : The State's
Role in Financing Health Care', in Health for the Millions, Vol
XVI, No.3, -June 1990.
(higgal R. and Asin S., 1989 : Cost of Health Care - A Household
Survey in an Indian District, FRCH/ICNR, Bombay.
GOI, 1946 : Report of the Health Survey and Development Committee,
(4 Vols.), GOI, New Delhi.
IIM, 1987 : Study of Health Care Financing in India, UN,
Ahmedabad.
Jeffery R., 1988 : Politics of Health in India, University of
California Press. Berkeley.
Jesani A. and Ananthram 6., 1990 : Private Sector and
Privatisation in Health Care Services, FRCH/ICSSR-ICMR, Bombay.
Jesani A., Gupte M. and Duggal R., 1986 : NGOs in Rural Health
Care, Vol.l, An Overview, FRCH/ICNR, Bombay.
NSS, 1952 : Report of the 3rd Round 1951-52, National Sample
Survey, 601, New Delhi.
0'connor J., 1973 : The Fiscal Crisis of the State, St. Martin's
Press, N.Y.
0R6, 1985 : Health Finincing in India - A Case Study of Gujarat
and Maharashtra, ORG, Barada.
0R6, 1986 : Health Financing in India and the States, ORG,
Baroda.
Seal, S.C., st.al. 1958 : Report of the Resurvey of Sinqur Health
Unit Area 1957-53, ALLHY PH, Calcutta.
Seal S.C. et.al., Respective years : Reports of the Short General
Health Survey, D Blocks, Ekanqasarai, Captaingunj, Dabra,
Dunqarpur, Saktiqarh, Thoubal, Ranqiya, Thalcher and Vetapalesi,
1955-1958, ALLHY PH, Calcutta.
■
i
t
f
fJ
——, nwiiiiimnuj^_
The cost of caring
pressure of a severe experience of all other countries except the
,"dia.’_S2,^,th_?re SySten‘ fa d0se to breaki"g Point- und«r
resource crunch, an enormous population and a growing disease burden
US, whose health system at present is based
on private insurance and out-of-pocket ex
ost effective health care is today a the incidence ofmalaria, tuberculosis, chol
penditures, a pattern that has sent health
major concern all over the world. In era and other communicable diseases. The
care costs spiralling out of control. In all
India it has assumed particular public sector accounts for 45 per cent of other OECD countries over 75 rercent of
urgency considering the need to reconcile hospitals, 70 per cent of hospital beds, em- ’ “
health care is publicly financed.
thCfh?h^«
Carene^ds.oftheP’oys 25 per cent of registered allopathic
Financial constraints have impeded
with the fiscal constraints facing an econo doctors and trains 85 per cent of all medic il
public
health'care delivery in India. But,
my undergoing structural adjustment. In graduates.
even
these
scarce financial resources are
dia’s health care system must cater to a
__ Departments of
This large public health network, howbeing optimally used.
p >pulation fast approaching one billion. It ever, accounts for a total expenditure ofjust not
health (excluding family welfei^)
) at the
must struggle to contain more than half the
1.5 per cent of GDP. In the current fiscal state ’level* are spending around 5 percent of
R'
known cases of endemic diseases in the year, 1993-94, the Ministries of Health and
world. And it must do this with an infra- Family Welfare at the centre and in all states total government expenditure, plan and
siructure so thinly stretched that it com- and Union territories will ospend about non-plan, on medical and public health
pletely fails io reach millions at the margins Rs.6,600 ciw on health Ll'fa^ly^l- programmes. The health sector’s share of
... •.
the total plan outlay in majorstates is around
of the system.
fare rMinistry
of—
Finance estimates placed 3 per cent. However, instead of producing
rnAndihimot
De <
t aaa
.•
•
- . .
r
°
i. India is to develop an efficient health this expenditure
at Rs.6,000crore
for 1992effective health interventions, these alloca~
care r“—
30(1• P0.1^ ^3. In addition, an estimated Rs3,000crore llions are largely supporting a gargantuan
makers must soon tackle the daunting
~ chal-‘ will be spent by municipal bodies from their health bureaucracy.
, lenge of reallocating health care
mm »
serious problem in sec| e <pcndimres to achieve greater
toral
allocation
of public health
9
1 effectiveness in solving themaspending has been the large and
J j jor health care problems of the
increasing proportion of ex
nation. Existing approaches are
fl § penditure on salaries... (while)
unlikely to significantly amelio
fl | non-salary components like
rate the problems facing health
* medicines, equipment, etc are
care re India.
inadequareiy funded,” states a
By investing in a large public
current report on health financ
| health network, medical educaing issues released by the Min
| (ion and research,.the State in
istry of Health.
•1 I ndia Iras played a dominant role
This problem has affected
? m providing health care. Today,
one
of the most essential com
1 however, this network is being
ponents of public health care,
f suppianied by the large private
disease control. While the Cen| sector in health, the result of a
_ __
h Kh SHI
tre makes sectoral allocations
I
| perceived loss of confidence in High
arjdrty: coping with an ailing health care system
towards disease control pro
f the public sector.
grammes, it fails to ensure their
Yet, while it is fashionable to decry the own resources.
____
_
effective
utilisation
programme-wise.
public sector in health in India, it has made
The erstwhile socialist countries spend. Once
allocations
---------------U
are
made
for the plan
considerable progress since Independence. on average, 33 per cent of their GDP on
Over die last 20 years the health infrastruc- health care, while OECD countries spend period, allocations for non-salary inputs
ture has grown dramatically. Hospital beds over 6 per cent of GDP. bi its Atoi^Ata begin to shrink and the concerned pro
have increased two and a halftimes, and the Declaration, the WHO has recommended grammes suffer correspondingly.
The sustainability of these programmes
primary health care network has expanded that public health expenditures should gross depends
'» on allocations made by the state.
rapidly over the Sixth and Seventh Plan at least 5 per cent of GDP. However, if the
However, as the report observes, “States
periods. More than 2,060 Community private spending of4.8 percent is included,
have shown a tendency to divert pro
Health Centres, 22,000 Primary Health India’s total expenditure on health care
gramme funds away from components they
aiK^ *
sub-centers now pro- would increase to over 6 per cent of GDP.
are earmarked for resulting in a mismatch
vide basic curative care.
For a low income country like India this of priorities allaiati7e^ffici^y’^d
The lower level facilities within the pri represents a highly distorted pattern of
mary network also serve the purpose of health investment. The ratio of public the consequent inability to fulfil pro
gramme objectives... The declining share
communicable disease control, reducing to private spending
goes against the of non-salary spending will only further
1
i
i
i
ompeinently
acting
ecicus
I.
3ank)
CANCO/93
SSI
18
I
I
PI
' 5
•i
BUSINESS INDIA - November 8-21, 1993 • 129
1
i
Special Report
aggravate inefficiencies within
he says. “This, however, masks
Composition of Public Health and Medical Expendlturesthe system causing further dam
the fact that disaggregated data
1988-90 (%)
go.27
■ Medical Supplies
age to the already poor reputation
show considerable compression
H
■ Salaries
of the public health services.”
in spending on disease control
As health infrastructure ex
pr4»grammes which are essential
65.38
panded in the ’80s, expenditure
ly in the nature of preventive
58.64
on salaries .rose faster than on
56.84
health spending. Preventive ex
components like medicines and
penditures are known to have
44.55
equipment. Expenditure on sala
high cost effectiveness. There
39.32
ries is between two to three times
fore, a cut in this item of expendi
that of materials. Studies have
ture will cause allocative
22.91
shown that non-availability of ba
inefficiency.”
14.86
10.85
sic medical supplies is a major
If disease control has been
5.39
reason for poor utilisation of pub
adversely affected, evidence
lic health services.
shows that the public health sec
Andhra
Gujarat
Kerala Maharashtra W.Bengal
Further, the emphasis from the
Pradesh
tor is not even fulfilling its pur
Fifth Plan onwards on creating a
pose of delivering curative health
rural health infrastructure to re
care to the people. “If the PHCs
duce disparities between urban
and other public facilities are
and rural health facilities could
functioning well, why is it that
have proved counterproductive.
more than half the rural patients
“There is some evidence, albeit
go to private doctors and that
circumstanstial, that the rapid
district hospitals are over
growth in health care facilities
crowded with rural patients?”
during the ’80s resulted in
asks Prem Vashishta, deputy di
spreading resources thinly on too
rector general. National Coun
many
facilities,”
says
cil of Applied Economic
V.E.Tulsidhar, senior economist.
Reseach. “Utilisation of gov
National Institute of Public Fi
ernment facilities at the all-Innance and Policy. “The alloca
dia level is as high as 40 oer
tion of funds to complementary
cent. However, the utilisation of
non-personnel inputs fell during
PHCs by rural households is
the ’80s. This could be partly on
only 8.02 percent.”
account of the resource crunch
The limitations of the public
and partly due to the creation of Rural health care needs public support not private solutions
health system have meant in
more physical facilities than the
creased private health care
resource position permitted.” Consolida government. States have come under se spending in India. Including out-of-pocket
tion of existing facilitiesbefore investing in vere budgetary pressure since expenditure expenses and expenditure by the institu
new ones is a good way to arrest this trend, cuts at the Centre have sharply reduced the tional sector, it is estimated io amount to
he suggests. This would improve the Centre’s grants to centrally sponsored more than two-thirds of the total health
utilisation rates and bring down the unit schemes.
expenditure. NSS estimates for 1984-85
costs of care with marginal, additional in
show that the share of the Central govern
vestments.
Asa percentage of total health expendi- ment and local bodies in health expenditure
“A related issue is the better targeting of AVture, grants fell sharply from 6.7 per was around 37 percent while the household
existing programmes which have high cost cent in 1984-85 to 3.9 percent in 1989-90. and private non-household sector account
effectiveness and are administratively ame For disease control programmes funded ed for the remaining 63 percent.
nable to targeting,” suggests Tulsidhar. mainly through central transfers, the share
“Per capita health expenditure was
“Disease control programmes have these of central grants fell from 41 per cent in about Rs. 120.10 for the year 1984-85, with
characteristics, but unfortunately, alloca
1984-85 to 29 per cent in 1988-89, finally public expenditure per capita being
tions to these programmes are being cut.” declining to 18.5 per cent in 1992-93.
Rs.44.55 compared to a per capita house
An important element of health finance is “However, revised estimates indicate that hold expenditure of Rs.75.55,” says
central intervention in crucial areas of the figure could be around 25 per cent, Ramesh Bhat-in ‘Paying for India’s Health
disease control.
almost equivalent to 1991-92 revised esti Care’, a study of health economics in India.
Slates spend around 90 per cent of the mates for the states,” concedes Tulsidhar.
“Given the rate of inflation and the increase
total expenditure on medical and public
“In spite of the fall in transfers to states, in the demand for health care services since
health, since the provision of health care is the real expenditure on medical and public
1984-85, overall expenditure in absolute
mainly the responsibility of state govern health and on medical services grew fairly terms must have gone up significantly."
ments. However, a part of this expenditure
rapidly between 1985 and 1991 and fell
Significantly, the number of rural
is fully or partially funded by the Central marginally during the adjustment period,” patients seeking treatment from private
ri fl
Ime’.
)16.
<
ii
a
Q_
i
O
BUSINESS INDIA • November 8-2 1. 1993 • 133
■■Uli
■f
...............-*9»*
. F
Special Report
doctors increases as their income level de analysis, whether the massive fixed invest public and private hospitals is that the latter
creases. One reason is that rural private ment in PHCs is justified.” Average daily can control their work load,” says Dr Pragpractitioners often provide credit or even attendance at PHCs is 20 patients. With nya M.Pai, dean, KEM Hospital. “Private
accept payment in kind for their services. around 22,000 PHCs, this means about hospitals tum away patients if all beds are
Studies by Vashishta and associates have 440,000 patients receive routine curative occupied, and also those who cannot pay a
shown that the cost of treatment differs care per day in the face of an estimated d^ily cash deposit. Emergency and complicated
significantly between private and public morbidity of over 5 million cases in rural cases are refused. In public hospitals there
doctors. Average expenditure for treatment India. Thus, PHCs are treating only about 8 is no selection, services are provided to all
comers, rich or poor.” Patients from low
from private doctors is Rs. 146.7 per illness percent of morbidity in rural India.
In fact, all studies show that the public and middle income groups have little choice
episode and Rs. 169 for government doctors
at 1990 prices.
sector accounts for only around one fourth but to use public hospitals and this results in
Oddly, the average cost of treatment per of health care in both rural and urban areas. overcrowding and huge work loads.
illness episode increases with a rise in the The 42nd National Sample Survey shows
Public hospitals have a full complement
patient's income in the case of private treat that while public hospitals are the single of highly trained staff that few private hos
ment but declines in the case of treatment largest providers of in-patient care, ac pitals can match. With a staff-patient ratio
at a public facility. “Aplausible explanation counting for 60 per cent of all hospitalisa of 3.3 to 1, (3:1 in the US) and a work load
is that the better-off sections of rural society tions, routine out-patient care is provided ten times that of private hospitals, “Therapy
manage to get some services from
wise, public hospitals are as good
Centre and State Public
Health
and
Medical
Expenditures-^)
public facilities free of cost,
as the private ‘five-star’ ones,”
.. ____ __ _
while the not so better off have to
says Pai. “They offer all services,
Share in total
1984-85
1989-90
public health and
1992-93
pay unofficially. For instance,
including super specialities, at
medical expenditure
obtaining medicines free is a
no or minimal cost.”
major problem since shortage of . States’own expenditure
However, public hospitals are
medicines is perpetual,” says
not cost-effective in the long run,
Vashishta.
Grants from Centre
Pai points out. “Treatment at
The problem is, however, one
public hospitals will not be costof access rather than quality 'States'ton
effective if the disease process
.....
of service. In a paper on health ;.
does not stop,” she says. “Mor
care utilisation patterns, health
r
tality and morbidity rates are not
Centre
researcher Meera Chatterjee
enre50Wr
coming down, we are merely
remarks, “There is no evidence Sara: National Institute of Pubte Finance 4 Policy
buying time.” More investment
that people make a conscious
in water, sanitation and housing
choice between the public and private mainly by the private sector.
and innovative measures to increase the
health systems per se. In rural health
role of public hospitals in preventive care
surveys, the vast majority of consultations
R fl uch criticism of the public sector in
are necessary, suggests Pai.
IVI health is, in fact, directed at the
reported have occurred with health provid
‘Regionalisation’ of health services,
ers who are nearby and have convenient unduly large share of public hospitals in where a public hospital would be responsi
timings.” Though services at public health expenditures. However, these hospi ble for the total health care, including im
facilities are free, the transport and opportu tals also show the public health system at its munisation and other preventive measures,
nity costs are daunting, clinic timings are best. A comparison of expenditures and of a population within a ‘catchment area’ of
often unsuitable and the doctor is often not health care delivery at King Edward Me perhaps five miles, is one way to do this. In
available.
morial Hospital, Bombay and two private addition, a three-tier system of outreach
Moreover, “The shortage of medicines hospitals in the city shows that the former services, periphery hospitals specialising in
at government facilities results in having to provide services on a scale that cannot be particular ailments, supervised by apex
fil prescriptions at a market chemist from rivalled by any private hospital.
hospitals offering super specialities would
whom credit is usually unobtainable,” adds
While total annual expenditure for build a network that would result in more
Chatterjee. Thus, she found that, on aver
1991-92 at KEM amounted to around Rs. 17 rational and productive use of resources.
age, only 15 per cent to 20 per cent of crore, annual income was Rs.3.23 crore. In
Drawing upon the resources of the pri
consultations reported are with government contrast, while expenditure at two private vate sector is another avenue that could be
health providers. Significantly, the closer hospitals, was Rs. 16.15 crore and Rs. 13.77 explored. “Public and private hospitals
the public facility, the higher the rate of its crore, their income was Rs. 16.78 crore and should complement, not compete with,
consultation, and the rate could be as high Rs. 18.63 crore respectively. With roughly each other,” says Pai, Co-operation in areas
as 60 per cent in the vicinity of a district equal expenditures, KEM, however, pro like investigation, where private hospitals
vided medical services to 63,695 in-pa have the technology and public hospitals
hospital.
Says Vashishta, “While the role of PHCs tients, as opposed to 11,085 and 12,853 in the clinical material would put the heavy
in implementing various public health and the private hospitals, and 1,428,064 out expenditure in the private sector to more
family welfare programmes cannot be patients as compared to 39,532 and 21,514 productive use.
underestimated, it is important to examine, respectively.
The private health sector is an amalgam
in the framework of social cost-benefit
“A significant difference between of institutions of different sizes from
■
Malaysia Airl 6
-
While a
a wide
? you fly,
rid with
ications
cd with
9U mean
Airlines.
-
BUSINESS INDIA • November 8-21, 1993 • 135
<2-242443, 24240
<11
'
■'...........................
recious
ime in wind
I
•1*J
I
itwpfullI
resits '
it crowns it
I
fl
ING
os
out-patient clinics and dispensaries to nurs is it quite as rational as its proponents would per cent of the population is covered. In
ing homes and hospitals run by single own have us believe. “Whether private spend1989, three years after its launch, the Mediers, partners or as companies. According to ing
— is making
j a positive impact on the claim insurance scheme covered only
( entral Bureau of Health Intelligence esti- health of the population is highly question 264,000 people. The Central Government
mates, in 1988, private organisations and able,” says consultant surgeon Arun Bal. Health Scheme launched in 1950 as a con
\ oluntary agencies owned 56 percent of the Most of the expenditure is accounted for by tributory health scheme at present covers
9.831 hospitals in India and 30 per cent of investment in sophisticated diagnostic 41.20 lakh beneficiaries. The Employee
the approximately 586,000 hospital beds, equipment in large cities. “Bombay now State Insurance Scheme which provides
besides 49 per cent of all dispensaries. In has five MRI facilities, where only one health coverage to employees of factories
status like Kerala and Maharashtra, the would suffice for its entire population; and establishments with salary not exceed
share of private and voluntary hospitals as a London has one,” he remarks. “The recur- ing Rs. 1600 a month, now covers
proportion ofal! hospitals is 70 percent and ring expenditure for one scanner is Rs.56 26,748,750 beneficiaries.
92 per cent respectively.
lakh a year, enough to set up three new
“The costs of medical care are so high
“Analysis of the characteristics of these PHCs.”
today that it is not possible for any individu
institutions in cities like Hyderabad shows
Overinvestigation is the easiest way to al to pay for all his own health care needs,”
a hierarchical arrangement of private ser recover such heavy investments, and since says Ashok Bhatkhande, director, adminis
vices that broadly matches the purchasing many patients> are reimbursed by employ tration at P.D.Hinduja National Hospital,
power of different sections of society,” says ers, they don’t complain. Overmedication
Bombay. “Today any private service is un-_
Rama Vaidyanathan Baru in a
affordable for middle income
/
doctoral study on the private sec
group
families and public serSocial Insurance In Selected Countries -1990 (%)
tor in medical care and its inter
v ices are unacceptable. The only
relationship with the public
Share of
Social insurance
way out is some insurance
population covered
as share of total
sector. The structure manages to
scheme.” Private insurance
RBW*
health
expenditure
reach all sections of the popula
schemes like Mediclaim have
tion, belying the popular notion
not worked in India because they
that the private sector caters only
are not properly designed, he
to the rich and the publ ic sector to
feels. “For instance, premia for
die poor. The evolution of the •Jndonesf;
insurance schemes abroad de
private sector in India has not
pend on risk; here, there is no
RC
taken place independent of the • Korea
.—
scheme of differential premia.”
public sector but, in fact, “has Source: World Development Report 1993
“Mediclaim, it is reported,
used manpower, resources and a
has not even been able to recoup
variety of subsidies offered by the state to resulting from aggressive marketing poli its advertising expenses through premiums
foster its own growth,” remarks Baru.
cies of drug companies is another harmful as yet,” says Tulsidhar. “Canada is one
practice in this sector. “Broad spectrum country where social insurance works.
ver the years, concessions in the form drugs like ciprofloxacin are being pre However, in India, even the preconditions
of loans and tax exemptions by the scribed even in rural areas, with dangerous
for social insurance do not exist.” Canada
government and reduction of import duties consequences, ” says Bal. “Since these introduced national health insurance in
following economic liberalisation have medicines are expensive, most people do
1971. Every province in Canada runs a
given a fillip to the growth of this sector. not complete the course, turning large sec public insurance plan with the federal gov
“During the ’70s and ’80s, gpvemment tions of the population drug resistant.”
ernment paying about 40 per cent of the
expenditures on medical care remained
The major dilemma that confronts poli- cost.
static. This provided the scope for the ,cy makers is reconciling the need for equity
The insurance plans are funded through
growth of the private sector from the mid- in health care with the need to make the federal and provincial taxes and private
seventies onwards,” she says. The rise of system, to some extent, financially self sup insurers are prohibited from offering covercorporate hospitals with large business porting. Even in advanced capitalist econo- . age for the same services as the provincial
groups and NR Is investing in hospitals lo mies like (he US, the universal provision of plans. Hospitals and doctors are private and
cated in large cities, providing mainly
. spe.
health care, with no one excluded because are paid through global budgets; doctors are
cialist care, is a phenomenon of this growth, of inability to pay, is an accepted responsipaid on fee-for-service basis and patient
While the expansion of public services bility of government.
charges and extra billing of patients is
was curtailed form the mid- 70s onwards.
Health insurance is a good way to mo- banned.
the government did not cutback the number bilise funds from employers and employees
Though the system has led to rationing,
of medical students graduating each year, for health care in urban areas, freeing tax with shortages of equipment and long wait
Low employment opportunities in the pub- revenue to upgrade and consolidate prima- ing lists, Canada is one of the few countries
lic sector, coupled with the rising demand ry healthcare services. India's experience that has managed both to contain costs and
for medical services, fuelled the growth of of health insurance, however, has so far look after the health needs of all its people.
the private sector.
been discouraging. Despite the launch of If India is ever to create a durable social
While private health expenditure is comprehensive health insurance schemes safety net, it would have to follow suit.
high, it is not necessarily cost effective. Nor by the government, at present only about 5
■ JEANNE PRASAD
MM
BUSINESS INDIA • November 8-21, 1993 • 137
-7’
■
<-O>^ H %-b
CGi*
47/1,(First Fioor)Su
BANGALORE - 560 001
u
C'-.W,.
1
A« (i'Af
VonymmiRY Heal ™ Assocdatdo
NOTE
ON
* l WM*
..^ . .wm
BANGALORE -560 001
^ ©f Dwoa
FINANCE
HEALTH
For a long time now, one of the major concerns of organisations
working in voluntary health care has been the timely and sustained
funding of their activities. Dearth of finance or its untimely
availability may put a project off-the rails. Available funding
is generally of a periodic nature, say for a period of two or
three years. Many organisations are unable to manage the recurring
costs of a project for a further period i.e.r beyond the committed
period of funding. It is therefore worthwhile for a project
to try and create its own resources with a view to making it
financially controllable and manageable. Divergent financing
avenues available with the voluntary organisations can also help
them protect from the dangers of unforeseen financial ambiguity.
In many organisations including hospitals, self-generated finance
represents a substantial portion of their total income. In some
cases, there are other more innovative self-financing schemes,
such as health insurance etc. Some effort by voluntary organisa
tions for mobilising finance have been successful and others
not so successful. It is also seen that many voluntary organisa
tions committing themselves to self-generating financial activities
do so on a temporary basis to remove their short-term difficulties
only and not with an eye to overcome such problems in the long
run and on a permanent basis.
>
Self-generating financial activities may be.an important and
workable solution for the financial constraints being.facec.by
voluntary organisations. This may also help them achieve financial
independence, enabling them to carry out the desired programmes
without any time-lag. Till now, however, there has been.little
systematic effort to document these processes for self-financing
of primary health care activities. There has also not been much
discussion of these experiences with a larger number of voluntary
organisations so that they can learn from these experiences.
Over the last year, the Ford Foundation has been reviewing the
funding experiences of voluntary health projects and taking up
case studies. Leading on from these case studies, the Ford Founda
tion organised at Pachod a workshop ’’Paying for health in the
voluntary sector: experiences and prospects”. This workshop
brought together a small number of voluntary health organisations,
intermediary support institutions and donor agencies.
The meeting discussed existing financial constraints faced by
voluntary organisations, different funding options were
. . .2
Tong Swasthya Bhavan,
40 Institutional Area, Near Qutab Hotel New Delhi-110016, INDIA
Phones: 668071, 668072.'665018. 655871.652953
Fax:011-676377
Grams: VOLHEALTH. N 0 16
47/»,(
''.’.TH CFU
k.\o?d
ai
1
VHAI
-2-
explored and the information and data that may be required by
organisations wanting to initiate self-financing activities.
Support needs and future help for voluntary organisations wanting
to strengthen their financing capacity were also discussed.
Among the conclusions emerging from this workshop, the following
are of broad interest:
1.
A large number of Indian voluntary organisations working
in health make some use of internally generated funds. This
is a flexible, appropriate response to their perceived needs
and is likely to continue. They are concerned about overdependence
on outside donors, including government, and see advantages,
both financial and programmatic, in some degree of self-financing.
There are problems and disadvantages as well, which are of sig
nificant concern to the organisations.
2.
Voluntary organisations are already an important testing
ground for innovative approaches to health financing in India,
which merits further attempts. For example, some groups have
shown that use of a progressive fee schedule can generate a signi
ficant part of hospital costs from communities while still providing
access to free services for poor patients. Others have been
experimenting with prepayment and health insurance schemes.
Much can be learned from the voluntary sector and the wider
community from both successes and failures.
3.
Voluntary organisations recognise the need for better
information, documentation of experiences and technical support
to improve their financing activities. There is a need for
resources and institutions to fill this gap.
As a follow-up of this meeting, it was decided to organise a
national-level meeting where a larger number of voluntary organi
sations, relevant government officials and representatives from
management and donor institutions could come together and discuss
these issues to provide a sense of direction to organisations
who are looking at various aspects of health finance and also
to identify areas of priority where sustained work needs to be
taken up.
pv
COMMUNITY H
CELL
E
47/1,(First Floor)St. Marks Road
BANGALORE - 5
Heal ™
Volujinitaw
0
6
0
9
A
0
L
1
©f Dgmiooa
AGENDA FOR NATIONAL WORKSHOP ON HEALTH FINANCE
Wildflower Hall, Shimla
1-4 May, 1990
Day 1: 1st Mayr 1990
Session I
Introduction
9.30
10.30 a.m
Opening remarks - Mr.Alok Mukhopadhyay
Introduction of participants
Review of agenda. Organisation of
discussion groups,
appointment of rapporteurs.
10.30
11.00 a.m
TEA BREAK
Session IT
Issues in the Financing of the
Voluntary Sector.
11.00 a.m -1.00 p.m
Current scenario -Dr.Ashok Dayal Chand
Issues -Mr.Alok Mukhopadhyay
Plenary discussion
1.00 -2.00 p.m
LUNCH BREAK
Session III
Background: The past and future of
Government Financing of Health Care;
Implications for the voluntary sector.
2,00-2.30 p.m
Government Financing of health care
from the early 50s’ to date, paper
presented by Dr.Ravi Duggal
2.30 -3.00 p.m
Health Finance in the Sth Plan:
What we in the Vol untary Sector can
expect, paper presented by
Dr.Rameshwar Prasad.
3.00-3.30 p.m
Plenary discussion of papers
3.30-4.00 p.m
TEA BREAK
4.00-4.30 p.m
Government, funding of health care
programs of the Voluntary Sector
Dr.A.K.Mukherjee & Dr.S.C.Sharma.
4.30-5.30 p.m
Group discussion of issues raised by
.Dyg- Mukherjee & Sharing
Tong Swasthya Bhavan,
40 Institutional Area, Near Qutab Hotel New Delhi-110016, INDIA
Phones: 668071, 668072, 665018, 655871.652953
Fax: 011-676377
Grams: VOLHEALTH. N D 16
:2:
Day 2: 2nd Mayy 1990
Issues in Financing the Voluntary
Health Sector.
Session IV
An overview of issues and current
experience - Ms.Priti Dave
9.30
10.10 a.m
10.10
1C. 3 0 a . m
Discussion
10.30
11.00 a . m
TEA BREAK
Presentation of case studies:
11.00 - 1.00 p.m
IE;*/■ c, Hicic
s-y^cKufLe
1.00 -2.00 p.m
2.00
3.00 p.m
- Integrated health development project
- Purely health project
- Hospital - based health project
- Umbrella organisation.
LUNCH BREAK
Discussion and listing of issues
brought out in case studies.
3.00 - 5.00 p.m
Small group discussion of above Issues.
8.30 - 10.00 p.m
Plenary presentation of group repor;
..3/-
:3:
Day 3: 3rd May, 1990
Session V
Strengthening skills for Financial
Soundness in the Voluntary Sector.
2.30
10.00 a . m
Opening Statement outlining session
Plan: Skills needed and Strategies
for skill development. Dr.Peter Berman
10.00
10.30 a.rr
10.30
11.00 a.m
Skills development strategies
for Voluntary Organisation’s experiences
in India - Dr.Prem Talwar
TEA BREAK
11.00 - 1.00 p.m
Case* presentations of applications of
specific skills:
Assessment Methods - Mr.Sanjoy GhosA>
Costing — Dr.?shok Dayal Chand
Management Information and
Supervision,
.
Financial Planning - Mr.Thulsiraj
1.00 - 2.00 p.m
LUNCH BREAK
Session VI
Strategies for the future:
developing a plan of action.
2.00 -4.00 p.m
Group discussions to develop
specific proposals for future
activities including researcht
training, documentation, policy etc.
Identification of problems and
prioriti es.
4.00 - 5.30 p.m
Plenary to discuss future
strategies/develop resolutions.
7.00 - 9.00 p.m
Cultural Programme
***
ts | 25041990
*
COMMUNITY HEALTH CELL
47/1.(First FlooDSt. Marks Road
BANGALORE 560 001
7 .
INTRODUCTION
<210 no VA
There has been a growing recognition of the important role of
the voluntary sector as
ii
innovators of health development". It has
been suggested that many of the strands of the current "Primary Health
Care" approach have evolved from the experiences of the voluntary
sector, such as the training of community based health workers (Newell
1975).
In addition to providing "models" in health service
organization and delivery, voluntary organizations have also provided
valuable lessons in qualitative aspects of program management and
community participation.
A recent review of the health financing experiences of four
voluntary organizations in India indicates that the sector may also
provide lessons in program financing (Ford Foundation 1989). The
studies show that voluntary agency health programs are funded from a
4
number of different sources, including government, donor agencies, and
community and self-generated sources. In many projects, the community
and self-generated sources represented a significant proportion of
total health income. Moreover, within this category organizations
exhibited many innovative financing mechanisms, such as progressive
fee scales, prepayment/insurance schemes and income generating
schemes.
The widely held view that the current level of resources
available to the health sector is unreliable has prompted the search
for alternative sources to complement existing ones. Increased
contributions from the community have been identified as an important
financing option (Stinson 1982). There are many lessons to be learnt
from the financing experiences of the voluntary sector, both for other
4
2
voluntary organizations as well as larger public health providers.
This paper presents the findings of a larger survey of the
health financing experiences of voluntary organizations in India. In
particular, it examines the scale and methods of community and self
financing adopted by them. Community and self-financing methods are
described, and then evaluated in terms of both their overall net
contribution and their distributional impact on service beneficiaries.
Some questions posed are:
What types of health activities are supported by community
and self-financing methods?
What costs do they cover?
Are costs borne equally? by rich and poor? by healthy and
sick?
How (and by whom) are community and self-financing activities
planned and managed?
The organizations studied represent a broad cross section
of the voluntary sector health community. They were sampled to
reflect a range of the different types of voluntary organizations
providing health care, as well as different locations, size, and
types of health care provided. They were also chosen on the basis
that they were known to be tapping at least one community or self
financing source.
3
THE ORGANIZATIONS
This paper provides a summary of the health financing
experiences of 12 voluntary organizations. Each of the organizations
were visited by the author for approximately two days. During these
visits the author gathered information on the kinds of health
services provided and the overall structure of their financing.
Additional information about their community and self-financing
methods was also collected. Some of the groups were identified with
the help of the Voluntary Health Association of India (VHAI), others
were groups already known to the Ford Foundation. They were chosen on
the basis of a number of criteria:
(1)
That the overall sample represented a broad cross section of
the voluntary health community, including organizations that
provide health care as their main activity, as part of
integrated development activities, or as a support service
(eg. to economic activities or as an employment entitlement).
(2)
That they reflected a range of geographic locations, size,
and type of clientele served. Organizations differ in the
type of health services provided (eg. hospitals and outreach
services), and their mode of organization and delivery.
(3)
That they tap community/self-financing sources.
Table 1 provides a summary of organization characteristics.
It outlines their location, date established and/or health program
started, a brief description of project activities (both health and
non-health), mode of health service organization and delivery,
population served, and total expenditure in a most recent year.
The 12 organizations are located over six states in India.
The oldest organization was established in the 19th century and the
newest in 1984. In terms of their health activities some projects
provide only community based care (SEWA and Goal para Cooperative
4
Health Society), others provide only hospital level care (BMCWS), and
some provide both (Christian Hospital and Aravind Eye Hospital). Some
of the organizations provide health care alone (Students Health Home
and Christian Hospital), while others also provide non-health related
services, such as child welfare centers, a women's income generating
scheme, environment and sanitation programs (CINI and Tribhovandas
Foundation). RAHA and UPASI differ from the other organizations in
that they do not provide health services directly. They serve a
supportive role to health providers, helping with staff training and
management. RAHA is a federation of catholic health providers, and
UPASI an association of tea growers.
Most of the community based health programs have trained
Community Health Workers (CHWs) who provide basic curative,
promotive and preventive care. Health services at Tribhovandas
Foundation are closely integrated with the Amul dairy cooperatives.
The community projects differ greatly in the size of population
served. Goalpara serves a population of 1,247 and Tribhovandas
Foundation serves 8 lakh population. Similarly, total annual
expenditure ranges from Rs.18,527 (Sewagram) to 110 lakh rupees
(Aravind Eye Hospital).
5
SOURCES OF REVENUE
Table 2 provides a breakdown of the major sources of health
revenue for the organizations. There are three main sources, community
and self-financing, government, and donor agencies. All the
organizations, with the exception of SEWA generate revenue from
community and self-financing sources. In eight organizations it
represent the sole source of income. In fact, SEWA (although not
indicated by the table) also taps a small amount of revenue from
community sources. This will be discussed later. Government does not
represent a substantial source of income for the majority of these
organizations. Tribhovandas Foundation received 55 percent of its
total income (both health and non-health) from the Overseas
Development Administration (ODA), through the Government of India.
Donor funding represented almost 100 percent of SEWA's health income
and the Christian Hospital's community health project.
Table 3 lists the different methods of community and self
financing adopted by the organizations. There are five main methods:
User fees, prepayment/insurance schemes, commercial schemes, fund
raising activities, and "in-kind" contributions. The "Other" category
includes contributions from the Amul Union and village milk societies
in the Tribhovandas Foundation, and contributions from tea estates in
UPAS I.
Ten out of the 12 organizations levy some form of user
charge, six organizations implement a prepayfnent/insurance scheme,
three run commercial schemes, four raise revenue through fund raising
activities, and three accept payment in-kind. Each of these community
4
6
and self-financing methods are described in turn, and examples drawn
from the 12 organizations. The financing methods are then evaluated on
the basis of the following criteria:
(1)
Yield. This assesses the financial performance of community
and self-financing methods. It asks: does the method
successfully fulfill its financing goal? what is the level of
revenue raised? what costs are covered?
(2)
Equity. This assesses the distributional impact of financing
methods. It asks: are financing burdens borne equally or
differentially by the rich and poor? are there mechanisms in
place to protect those judged too poor to pay? and if so,
how, and by whom is means testing done?
(3)
Risk sharing. This assesses the degree to which risks are
successfully shared in prepayment/insurance schemes. It
asks, is there a sharing of burden of illness between the
healthy and sick?
7
COMMUNITY AND SELF-FINANCING METHODS
USER FgES
User fees are defined as any payment made by beneficiaries
directly to health care providers, such as fees for services or prices
paid for supplies, eg. drugs and immunizations. User fees for
community based care are not widespread, although some organizations
charge for drugs (SEWA). The BMCWS charges Rs.5 for an immunization.
Immunizations were initially provided free of cost by BMCWS, however,
on the introduction of the fee they registered an actual increase in
the follow-up rate of immunization from 50 percent to 90 percent.
Organizations running prepayment/insurance schemes often ask
members to pay for drugs, either at a subsidized rate (Tribhovandas
Foundation) or at cost price (Goalpara, SSSS). This type of payment
made by members is called a co-payment.
As well as raising revenue
co-payments also serve the purpose of deterring overuse of health
services by members as may happen if care is provided at nil cost
after payment of the membership fee. Organizations affiliated to RAHA
raise a substantial proportion of their revenue from non-member fee
collections, both through service fees and drugs sales. However,
levying of service fees for community care is, overall, not
widespread.
At the hospital level, fee collections represent a major
source of income. In BMCWS, Christian Hospital and Aravind Eye
Hospital they represent the sole source of income. All these
institutes are financed 100 percent through fee collections. The
Christian Hospital levies fees per item of service rendered, for
8
example for consultations, diagnostic tests, drugs, bed charges and
operations. BMCWS charges Rs.250 for a "package of maternity care" and
a five day stay. The Christian Hospital has private wards where
patients are charged a higher bed charge and also higher service fees.
The Aravind Eye Hospital has different classes of wards which have
graded service charges.
Evaluation of user fees
(1) Yield
On the whole, organizations did not explicitly state what
their financing objectives with user fees were. As a result it is
difficult to assess how successfully funds are raised with this
financing method.
Nevertheless, it is estimated that SEWA recovers
approximately 47 percent of its basic drug costs, and Tribhovandas
Foundation roughly 60 percent. Both charge for drugs on an ad-hoc
basis. Goalpara's objective is to provide drugs at cost price to
members and at over cost price to non-members. It is not possible to
determine whether this pricing strategy is successful.
In all
community based projects, drug income is pooled into the general
revenue pool. It is not used directly to replenish drug stocks.
Three hospitals raised sufficient fee revenue to cover all
costs. The Aravind Eye Hospital generated a "surplus" which
subsidized outreach care, in the form of rural eye camps.
9
(2) Equity
All organizations were concerned that by charging they
should not exclude the poor from services. Organizations waived fees
either partially or totally for patients considered unable to pay. At
the community level both Goalpara and Tribhovandas Foundation waive
drug fees for those patients judged unable to pay. In the case of
Tribhovandas Foundation the CHW judges capacity to pay and at Goalpara
the doctor. In both cases ability to pay is assessed on a
discretionary basis, although the CHW is better placed to judge since
she resides in the community.
At the referral level, institutes raising fee revenue also
had mechanisms in place to protect the poor. The BMCWS and the
Christian Hospital partially waive fees for those patients considered
unable to pay full treatment costs. The Christian Hospital presents
non-affording patients with a fully itemized service bill and asks
them to meet an agreed portion of the total. Ability to pay is again
judged on a discretionary basis, this time by hospital doctors. The
Aravind Eye Hospital has two separate institutes, one providing
totally free care and one which charges patients for care. The
ii
quality" of care provided in the two facilities is identical. They
differ only in the "hotel" facilities offered, ie availability of bed,
degree of privacy, bathroom facilities, etc. It is left to the patient
to decide whether they would like to stay at the free or paying
hospital. This takes away the burden of assessment from the doctor or
other gatekeeper.
10
PREPAYMENT/INSURANCE SCHEMES
Prepayment/insurance schemes are usually contributions made
by individuals and households in advance of service need. Only the
sick avail of services.
Therefore, in such financing schemes risks
are shared between the healthy and sick. Schemes may provide different
levels of coverage for community and hospital care, varying from
partial coverage to total coverage.
Six organizations implement prepayment/insurance schemes.
Table 4 presents a summary of the schemes. Coverage is provided on
either an individual or household basis. The Students Health Home
provides coverage to educational institutes, although in Calcutta
individuals may enroll at a higher premium. Annual memberships fees
vary from Rs.2 per person to Rs.6, and for households from Rs.10 to
Rs.18. In some schemes, membership fees may be paid in either cash or
in-kind (sorghum in Sewagram, rice in RAHA, and either rice or
"community labor" in Goal para). The number of members enrolled in each
scheme varies considerably, from 6,800 in SSSS to 5.5 lakhs in the
Students Health Home.
The schemes vary in the type and level of coverage offered.
In some, membership entitlements include totally free referral and
community care (Sewagram and RAHA). Although at Sewagram, a
differentiation is made at the referral level between planned and
unplanned illness episodes. Members with unplanned illnesses are
treated free of cost and those with planned illnesses (eg. pregnancy
and chronic ailments) are given a 25 percent subsidy. At RAHA, members
after paying an initial entrance fee receive free hospital care upto a
11
ceiling of Rs.1000. The Tribhovandas Foundation scheme provides free
CHW services, drugs at subsidized rates, and hospital care at 50
percent of cost. Goalpara and SSSS provide free doctor consultations
and drugs at cost price. SHH provides free doctor consultations and
other services at nominal rates, for example drugs, diagnostic tests,
bed stay, operations etc.
Non-members are not entitled to avail of services at
Sewagram, SSSS and Students Health Home. In Goalpara and RAHA, non
members can use the services but at a cost. They are charged
commercial rates for a doctor consultation and drugs. At Tribhovandas
Foundation non-members are not discriminated at the primary level.
Like members they can also avail of CHW services and obtain subsidized
drugs. Non-members are most often not affiliated to milk societies and
do not own milch animals. Therefore, the Foundation feels that they
are usually the poorest in the community and are least able to pay for
services. In fact, even drug fees are waived for those non-members
considered too poor to pay. Non-members, however, are not entitled to
subsidized referral care.
The prepayment/insurance funds are managed in different ways
by the organizations. At Sewagram the community health worker is
responsible for collecting membership collections, both in cash and
kind. Collections are undertaken once a year, usually at harvest time.
The health worker sells the collected grain Jn the open market. From
the funds generated he purchases drugs, pays Sewagram for mobile
support, and then retains the difference as his salary. It is
compulsory that at least 75% of villagers enrol in the scheme. In RAHA
12
individual health centers are responsible for enrolling members. This
is undertaken once a year. New members have to wait for two months
before they are entitled to member benefits. Membership collections
are split into two separate funds, one managed by individual health
centers to cover community costs, the other managed by RAHA to cover
referral costs.
Village milk societies in the Tribhovandas
Foundation are responsible for membership collections. Collections are
usually undertaken once a year at the time that the societies
distribute milk profits. Funds are passed up to the Foundation. The
Goalpara village health committee is responsible for collection and
management of funds. At the Students Health Home individual education
institutes are responsible for membership collections. All collections
are passed to the Home. Doctors at the SSSS dispensary are responsible
for collecting membership fees. This is all year around and there is
no waiting period between enrolling and service uptake.
Evaluation of Prepayment/Insurance Schemes
Table 5 summarizes the evaluation of pre-payment/insurance
schemes in terms of the three criteria.
(1) Yield
It is estimated that membership fee income covers
approximately 96 percent of all community costs at Sewagram, that is
the salary of the VHW, drug costs and mobile support costs. Referral
costs of members were covered from other sources. In RAHA, membership
income (comprised of a portion of membership fees and entrance
i
13
charges) was sufficient to cover all referral costs. However, at the
community level income from membership fees represents a relatively
small source of revenue, covering no more than 10 percent to 20
percent of total community costs. The major source of income for
health centers are non-member fee collections. It appears that members
may be using services in excess of their contribution, and/or that
there is not sufficient risk sharing between healthy members and sick
members (this is investigated further below). At Tribhovandas
Foundation, membership fee income and member (and non-member) drug
collections account for only 13 percent of total income (both health
and non-health). A rough analysis of costs and financing of the scheme
at the community level indicates that membership fee income and drug
sales together cover approximately 70 percent of community health
costs, (ie. salary of the CHW and drug costs). The remaining 20
percent of costs are covered by milk societies, and 10 percent from
other sources. Higher level support and referral costs are met from
other Foundation sources, namely the Amul union and Government of
India. In practice funds are not earmarked for specific costs, all
revenue is pooled in a general fund. Data is not available to assess
the financial performance of the Goalpara Health Cooperative scheme.
At the Students Health Home, contributions from members cover
approximately 54 percent of total cost [membership fee income (34
percent) and member service fee collections (20 percent)]. Government
grants, donations and fund raising activities covered the remaining
costs. Contributions from members cover approximately 45 percent of
program costs at SSSS (membership fee collections (15 percent), and
14
member service fee collections (31 percent). Domestic donors covered
44.5 percent of costs, and the balance came from miscellaneous
sources.
(2) Equity
Sewagram and SSSS have membership fees related to ability to
pay. At SSSS, patients earning below Rs.1000 a month are charged Rs.2
annual membership fee and those earning above Rs.1000 are charged
Rs.5. Income assessment is carried out by the doctor, whose own
discretion is used to assess ability to pay. At Sewagram, members are
categorized into the following socio-economic groups: households that
own irrigated land and employ contractual labor for agricultural work,
called salder; households who own irrigated land and a pair of
bullocks, but do not employ salder; households who own unirrigated
land and a pair of bullocks, and do not employ salder; landless
laborers.
Membership contributions are graded according to these
categories. These income groups were established by the communities
themselves, through a village committee. The committee is also
responsible for assessing and allocating families to categories.
Another mechanism in place in some schemes to ensure that
the poor are not excluded is the option of paying membership fees in
either cash or in-kind. At Sewagram, contributions may be made
in Sorgham, at RAHA in rice, and at Goalpara^either in rice or
through community labor (eg. crop watching). Schemes that request
members to pay a co-payment, mostly towards drugs (Tribhovandas
15
Foundation, Goalpara and SSSS) all waive fees either totally or
partially for those members (and in Tribhovandas Foundation also nonmembers) judged unable to pay. Assessment of ability to pay is
undertaken by the CHW at Tribhovandas Foundation, and by doctors at
Goalpara and SSSS. In all cases assessment of capacity to pay is left
to the discretion of the assessors. Although in Tribhovandas
Foundation, the CHW is in a better position to judge patients paying
capacity since she lives in, and is a part, of the community. As
already mentioned in the discussion on equity concerns with user fees,
Tribhovandas Foundation allows non-members the same community health
service entitlements as members. Non-members are usually not
affiliated to the milk societies, do not own milch animals, and
therefore, are often the poorest in the community and least able to
afford health care costs.
RAHA has an additional financing policy to ensure greater
equity among members. Members referred to any one of three hospitals
affiliated to RAHA, pay an entrance fee related to the distance
travelled. Charges are Rs.200 if the distancetravelled is less than
200 kms, Rs.150 if over 25 kms but less than 100 Kms, and Rs.100 if
over 100 Kms.
(3) Risk sharing
Ideally in a prepayment/insurance scheme members enrol when
healthy and only those who fall ill avail of'services. Pre
requisites for successful risk sharing in prepayment/insurance
schemes are that members contribute in advance of service need, and
16
that a large enough number of people enrol to ensure a sufficient
pooling of risks. The first criteria may be ensured by introducing a
waiting period between enrolment and membership eligibility.
All the prepayment/insurance schemes, except SSSS fulfill
the first criteria, i.e. members enrolling prior to service need. The
scheme run by SSSS functions as more of an "entrance fee", since
members join at the time of service need. RAHA is the only
organization to have a formal waiting period of two months for new
members before they are entitled to use services. In Tribhovandas
Foundation there is an incentive to enrol only when referral care is
required, since non-members are entitled to the same community
services as members and there is no official waiting period between
enrolling and member entitlement. However, the Foundation did not
express this to be a problem. This may be because the fund is closely
linked to the village milk societies, providing a village level
structure to assist in the collection of dues.
It is not possible to comment on the degree to which schemes
fulfill the second criteria - that there is a large enough number of
people to ensure sufficient pooling of risks.
The actuarial soundness
of schemes is unknown in the Indian context and is difficult to
assess. Clearly, some schemes like the Students Health Home which
have large membership do achieve successful risk sharing.
While in
RAHA it appears some centers do not have adequate membership for risk
sharing between healthy and sick. Sewagram is the only organization
where it is compulsory that a fixed proportion of households enrol, 75
percent of village households must join before services are provided.
17
COMMERCIAL SCHEMES
Commercial schemes are activities (both health related and
non-health related) that are run by organizations on a for profit
basis to help finance health care. The BMCWS runs two commercial
schemes which help fund health services, a day care center and
convalescent home. A day care center located in a affluent area of
Bombay provides creche, nursery and school facilities for children.
Parents are charged a monthly attendance fee, in addition to which on
joining they are each asked to pay a deposit of Rs.2000. The Society
has invested this money in fixed deposits, and this provides them
steady interest earnings. Surplus from this center is used to finance
health services as well as other day care centers situated in poorer
localities, where fee income is not sufficient to cover costs. In
addition, a convalescent home located in one of the maternity
hospitals provides accommodation to patients attending the Tata cancer
hospital. It is very difficult for patients undergoing protracted
cancer therapy to find affordable accommodation in Bombay. The home
offers a single room for the patient and two family members at a rate
of Rs.50 a day. In 1987/88 the Home generated a profit of two lakh
rupees. This was used by the Society to fund health services.
The Aravind eye Hospital has an optical shop and a pharmacy
on the hospital premises. These are owned by hospital doctors and run
on a for profit basis. Profits generated are distributed among the
shareholders. These schemes were initiated, partly to compensate for
the low salaries paid to hospital doctors. The optical shop and
pharmacy pay rent to the hospital.
?
18
SEWA has recently opened a drug shop, which stocks only
rational, generic drugs. They plan to supply drugs to municipal
hospitals and other charitable institutes with some mark up but
trying
to keep well below commercial rates.
They will use profits to
directly fund other health activities.
FUND RAISING
Organizations in many cases devoted considerable time and
effort to fund raising activities. In one group (SSSS), it
represented a substantial source of revenue, in others a relatively
minor source (Goalpara and Students Health Home). Goalpara raises
revenue from hosting charity plays and melas (fairs). Revenue raised
in this manner represented
approximately 5 percent of total income.
SSSS raises funds from society subscriptions. Individuals and private
businesses can subscribe to the Society as either annual or life
members. This source, combined with other private donations
represented roughly 45 percent of total Society income. The Students
Health Home, among other activities held a sponsored walk. Internal
fund raising represented 3 percent of total income at the Home.
IN-KIND CONTRIBUTIONS
As already mentioned, many organizations provide the option
of paying for services in either cash or in-kind, in rice (RAHA),
sorgham (Sewagram) or community labor (Goalpara). However, in all
cases it is for payment for prepayment/insurance scheme membership.
None of the organizations offered payment in-kind as an on going
I
19
payment option. This could be because the management of such a
financing scheme might be too cumbersome. A one time payment is
simpler to manage, plus it is easier to sell grain in the market in
bulk rather then smaller quantities.
OTHER SOURCES OF COMMUNITY AND SELF-FINANCING
The Tribhovandas Foundation provides health care through
village milk cooperatives. The milk cooperatives and Amul Union
contribute a significant amount of revenue towards health services.
Milk societies support 50 percent of the CHW's salary, plus they
contribute approximately Rs.1000 per year.
The Comprehensive Labor
Welfare Scheme run by UPASI is financed largely through membership
subscriptions from private tea estates. Contributions are linked to
land holding. Tea estates by legislation have to provide health
services to their employees. Prior to UPASI's involvement this meant
providing hospital care. UPASI has helped train link workers to
provide preventive and promotive health care.
>
20
CONCLUSIONS
This review of the health financing experiences of voluntary
organizations in India shows that community and self-financing methods
represent an important funding source for the sector. In eight
organizations they represent the only source of funding. Some
organizations rely on only one method of community/self-financing,
while others tap a mix of sources. In one case, Goalpara,
community/self-financing methods were stepped up when donor funds
dried up.
Organizations exhibit an array of community and self
financing methods. User fees were an important source of funding for
hospitals. They were not so widely used at the community level,
although some groups charge on an ad-hoc basis for drugs and one group
charges for immunizations. User fees were frequently used as a co
payment for prepayment/insurance schemes and for non-member service
charges. Prepayment/insurance schemes were an important source of
funding for community based health care. Commercial schemes were only
used to fund hospital care, although one organization, SEWA, has
recently opened a drug store which will supply drugs at prices that
allow some income to accrue. Profits will be used to fund outreach
care. Fund raising was an important source of income for only one
organization.
Experiences with these community/self-financing methods are
mixed. The review highlighted both the strengths and weaknesses of
financing activities. Some important examples are:
the three hospitals that are financed solely from fee revenue, and
>
21
the prepayment/insurance schemes run by Sewagram and RAHA. At
Sewagram, income from membership fee collections was sufficient to
cover almost all community costs. The policy that at least 75 percent
of households must enrol in the scheme before services are provided
has ensured that risks are sufficiently pooled to make the scheme
financially viable. At RAHA, experiences with the
prepayment/insurance scheme varies at the community and referral
level. At the community level, individual health centers are
responsible for managing funds. Membership fee income on average
covers 10 percent to 20 percent of community costs. Non-member fee
collections cover the majority of costs at centers. RAHA manages the
referral fund, reimbursing hospitals directly for member costs. This
is an example of third party prepayment/insurance, where the insurer
and health provider are separate. The RAHA fund was sufficient to
cover all referral costs. Introduction of a waiting period between
enrollment and service entitlements has ensured that members do not
join at the time they are in need of services.
Although tapping revenue from the community all
organizations were concerned that the poor should not be excluded
from services. All groups had mechanisms in place to protect non
affording patients from the potentially adverse effects of charges.
These included waiving fees either partially or totally for those
patients considered unable to pay, a sliding membership fee scale for
a prepayment/insurance scheme, and the optioif to pay
membership fees in either cash or in-kind. However, the assessment of
ability to pay in a systematic manner remained a concern. Groups
f
22
tackled this in a number of different ways: some left assessment of
ability to pay to service "gatekeepers", such as doctors or CHWs,
others left it to the patient to decide whether they wanted to utilize
a free or paying facility, in one case a village health committee was
responsible for allocating households to income groups.
On the whole, organizations were not explicit about
their
financing goals were with community and self-financing activities.
This made it difficult to assess the degree to which any one financing
method was successful. They often did not link a financing activity
with a particular health activity, or state what proportion of costs
they wanted to cover with that source. Very often they were not aware
how much cost recovery they were achieving with a particular source.
However, the widespread use of community/self-financing methods
implies they are useful and at least somewhat successful. Income from
community and self-financing methods is usually pooled into a general
revenue fund.
It is generally felt that organizations need to improve the
planning and management of community and self-financing activities.
For example, it is unclear on what basis organizations establish fee
levels and prepayment/insurance premiums. They appear to be largely
set in an ad-hoc manner. Fees and premiums should be set with some
reference to service cost and some measure of ability to pay, usually
gauged on the basis of household income. The only exception is
Sewagram which considered the ability of households to pay when
setting premium levels. In addition, for insurance premiums actuarial
risks also need to be considered. Some knowledge of household
>
23
demand/utilization behavior is also important when setting user fees
and prepayment/insurance premiums. The Aravind Eye Hospital was the
only organization to have a financial management system, that tightly
monitored costs.
Little is known about the extent to which organizations
consult and involve communities in financing decisions.
It appears
that some, like Tribhovandas Foundation and Sewagram do have on going
dialogue with the communities they serve.
Participation of the
community in both the planning and management of financing activities
will also ensure their commitment to the service.
The structures and
processes required to enhance community participation is an area that
needs to be further explored.
Some organizations have ideal village
structures that might facilitate such interaction between service
providers and the community, such as village committees, milk
societies and Mahila Mandals.
This review has shown a voluntary sector rich with
experiences in community and self-financing of health programs. In
many cases voluntary organizations have forged ahead with innovative
financing activities, sometimes in response to declines in funding.
Some of these financing activities can be further strengthened with
better planning, management and monitoring.
It is hoped that such
documentation and sharing of financing experiences will help other
health providers wanting to explore financing possibilities.
9
24
REFERENCES
Newell. K. (ed) (1975), "Health by the People" Geneva World Health
Organization.
Ford Foundation (1989). Set of 4 case studies on "Costs and
Financing of Voluntary Agency Health Projects"
Stinson W. (1982), "Community Financing of Primary Health Care,"
American Public Health Association, Primary Health Care Issues,
Series 1 No. 4, Washington,D.C.
Table 1 Voluntary Organization Characteristics
Voluntary
Organization
Sewagram
Bombay Mother &
Child Welfare
Society (BMCWS)
Health Service
del ivery/organization
Location
Date Started
Services Provided
Wardha,
Maharashtra
Hospital
1945, Cormunity Health
Program 1972
2. Outreach Community
Health Program
Trained male VW provides
basic curative preventive
& promotive health care.
Mobile with doctor and
ATM provides supportive
care every 2 months
1947
Health activities
- Outpatient and Inpatient
Maternity Care
- Outpatient Paediatric
care including inmunization
Chawls in
Bombay
1. 500 bed hospital
- 2 Maternity Hospitals
(40 beds each) with
Child Welfare Centers
Non-Health Activities
Population
Served
10,297
- Day care centres
- Convalescent Home
Raigarh, Ambikapur
Health Association
(RAHA)
Christian
Hospital
Raigarh
1969
Orissa Community Health
activities
started 1974
Bissamcuttack Hospital 1954
Orissa
Outreach commu
nity care 1980s
Federation of 3
referral hospitals
and 65 independent
health centres with
outreach comnunity
care
- RAHA functions include:
Management of insurance
scheme, training and
support for health centers
- Health centers staffed by
nurse provide outpatient
care, run MCH clinic
- VWs provide comnunity
based care
120 bed hospital, comnunity project currently
not operational
Outpatient/inpatient care, speciali
ties include: obstetrics, gynecology,
surgery, ophthalmology
4,00,0
2,50,0
Association of Tea
CLWS provides training, management
growers, run Comprehensive support to health programs of individual
tea estates. Tea estates have small
Labor Welfare Scheme
cottage hospital, and outreach care
(CLWS)
provided by link workers
UPASI
Coonoor,
Tamil Nadu
Goal para
Cooperative
Health Society
Shantiniketan
W.Bengal
1984
Dispensary, Periodic
Comnunity health
activities
Doctor provides outpatient care
twice weekly
Students Health
Home
W.Bengal
1955
Polyclinic, Plus 28
Regional Clinics
Polyclinic has 70 beds; provides out
patient and inpatient care
Regional clinics; outpatient care only
Health education campaigns, blood
donation camps
Saheed Shibsankar
Saba Samity
(SSSS)
Burdwan
W. Bengal
1978
Dispensary occupational
health activities, Rural
Health Program, School
Health Program, Fair
Price Medicine Shop
Doctors provide outpatient care
weekly MCH clinic
Aravind Eye
Hospital
Madurai,
Tamil Nadu
1976
2 Urban Hospitals
(800 beds)
2 Rural Hospitals (500
beds), Outreach Program
Outpatient and inpatient eye care.
Tribhovandas
Foundation
Anand
Gujarat
1980
Comnunity based Health
Program-linked with Anul
Milk Cooperatives,
Nutritional Rehabilita
tion Centers, Balwadis
Women's Income Generating
Scheme
OWs provide basic curative, preventive
and promotive care, Field Supervisors
provide support to CHWs
Milk Society building used as base for
coordinating health activities
19th Century
CLWS-1971
1,2
5,50,0
Regular eye canps organized
8,
SEM
Health Centers in urban slims and rural
Union of self-enployed
Ahmedabad Union 1972
villages
Gujarat Health Program women. Helps organize
CHJs provide basic care, doctors provide
women into cooperatives
1984
support twice weekly
of various trades,
provides credit facilities
legal aid etc.
Provide health care as a
support service to mentoers.
Run a drug shop which
stocks rational, generic
drugs.
CINI
Daulatpur
W. Bengal
1975
1. Latest year available 1983/84
2. Based on 3 monthly average expenditures
Conmunity-based Health
Program, Dispensary and
Nutritional Rehabilitation
Center.
Other activities: Income
Generating Schemes, Farm,
Health Training, Research
CLWs provide MCH care through Mahila
Mandals, doctors run daily OPD, weekly
MCH clinic, Supplementary Feeding
6
(C
H
P
Table 2
Source
Sources of Revenue
Sewagram
(Conmunity
EMCWS
Project)
Christian Hospital
RPHA
Hospital
Community
Progranme
UPASI Goal para
Students
Health
Home !SSSS
Aravind
Eye
Hospital
Percentage of total income
Conmunity/
Self-financing
methods
96
97.7
100
100
100
100
100
100
100
100
33.5
2.3
Government
66.5
100
Donor Agency
Other
4
Total
100
100
100
100
100
100
100
100
Table 3
Method
Methods of Carmunity/Self-financinq
Sewagram
1. User fees
2. Prepayment/
Insurance Scheme
X
X
Hospital
UPASI
X
X
Goalpara
Students;
Aravind
Health
Eye
Hospital
!
Home SSSS
X
X
X
X
X
X
X
X
Tribhovandas
Foundation
X
X
X
X
4. Fund raising
6. Other
RPHA
X
3. Cannercial scheme(s)
5. In-kind
contributions
EMCWS
Christian
X
X
X
X
X
X
X
X
Table 4
Coverage
Prep/
?nt/Insurance Scheme Characteristics
SEJAGRPM
RAHA
Household
Individual
Goal para
Students
Household
Instituti
and Indiv
Rs.18 in cash
or in kind
(rice or labor)
Rs.2 - per
for institu
Rs.6 - for
approx. 1/5 to 1/6 of 150 out of 175
all households in
households in
villages (317 vill
village
ages covered)
630 Institu
total 5,50,
students co
Tribhovandas
Foundation
Household
Annual subs
cription fee
8 payali sorghun (land
Rs.5 or 2 Kg rice
less) and 2 payali sorghun per acre (landholders),
or equivalent cash.
Niirber of
members
At least 75% of households 75,000
(12 villages covered)
Member
entitlement
Conmunity care: free CM
services, drugs and
mobile (doctor+AW)
services.
Hospital: free care
for unplanned illness
episodes, 25% subsidy
for planned illness
episodes e.g. pregnancy
and chronic ailments.
Conmunity care: free Cormunity care: Free Dispensary: free
CM services and
services, subsidized doctor consulta
drugs. Free health
tion and drugs at
drugs.
center services in
cost. Free percluding MCH clinic.
Hospital: 50% subsidy iodic public
health activities
Non-members not
entitled to use
conmunity health
services
Non-members charged
Non-members have same
for drugs (over cost), entitlements to cornunot entitled to
unity services as
attend MCH clinic.
members, but not
VM responsible for
membership collections.
Collections once a
a year at harvest
time. Compulsory that
75% of villagers
covered.
Individual health
centers responsible
for membership coll
ections. Collections
once a year. New members waiting period
2 months before ser
vice entitlements.
Rs.3 retained by
center, Rs.2 to RAHA
for referral fund.
Non-member
entitlements
Management
of fund
Rs.10
Hospital: free care
after paying entrance
fee upto ceiling of
Rs.1000.
hospital care.
Milk societies res
ponsible for member
ship collections.
Collected once a
year at time milk
bonus payments dis
tributed.
(Non-milk society
members can also
enroll in scheme).
Non-members
charged for
drugs (over
cost).
Polyclinic/
clinics: fr
sulfations.
diagnostic
operations,
at nominal
Non-membe
entitled t
of service
Village health
Institutio
comnittee mana
once a yea
ges funds. Collec- viduals o
tions once a year. (No waitin
Table 5
Eva1
RAHA
Mon of Prepayment/Insurance Schemes
Tribhovandas
Foundation
Goalpara
Estimated that:
- Membership fee collec- - Membership fee collec NA
tions over approx.
tions together with drug
10 to 20% of comnunity
income covers approx.
costs. Non-member fee
70% of comnunity based
collections cover
costs. 25% of costs are
roughly 60% of costs.
covered by milk socie
- Membership fees cover
ties.
100% of referral costs. - Referral costs are met
by Amul Union and a donor
agency. However, in prac
tice all income pooled in
general revenue account.
Students H
Heme
1) Yield
- Member fee collec
tions cover approx.
96% of Community
health program costs
(VHW salary, drugs
and mobile costs)
- Referral costs met
from other sources
2) Equity
- Sliding membership
- Can pay membership fee - Non members not ex
- Drug fees
fee scale. Income
in cash or in kind
eluded from comnunity
waived for
assessed on basis
(rice).
poor. Ability
services. They are
of whether landless
- Referral charge related usually poorest in
to pay asses
laborers, landholders, to distance travelled
sed by
comnunity, often
size of landholding
to hospital. The
ewing no milch animal
doctor.
and income. Income
greater the distance, - Drug fees waived for
the less charged.
assessed by village
those judged unable
conmittee.
- RAHA provides a match to pay. Assessed by
- Can pay membership
ing contribution to
VW.
fee in cash or inthose centers requir
ing funds.
kind (sorghun)
3) Risk sharing
(a) do mentoers
join prior
to service
need?
(b) are there
sufficient
members for
"pooling
of risks"?
(a) Members join
prior to service
need.
(b) Compulsory that
at least 75% of
village house
holds enroll.
Membership
collections
35% of serv
costs. Serv
fee collect
from member
20% of cost
Balance cov
from fund r
activities.
a) Members join prior to a) Members join prior a) Members enroll a) Memb
prior to
t
prior
service need. 2 month
prio
to service need.
official waiting period
service need.
serv
serv
Reportedly, a few
for new members between join at the time
b) Larg
enrollment and service
hospital services - b) 150 out of
ship
175 households
required.
eligibility.
enrolled.
b) Overall 75,000 members, b) 1/5 to 1/6 of all
village house
Individual health
center membership varies holds enroll,
depending on location
and population density.
COMMUNITY HEALTH CELL
47/1, (Fi.-st Flo or) St. Marks Road
BAH GALORE -6€O 001
August 1, 1989
Dr. Peter Berman
The Ford Foundation
New Delhi
INFORMATION NEEDS FOR PROGRAM FINANCING
Introduction
Over the past year, we have been reviewing experiences with
financing voluntary organization health programs in India. This has
included published literature, program reports, and new case studies,
the reports of which have been distributed at this workshop. It is
abundantly clear from what we have seen, that India's voluntary sector
is rich with experience and innovation in meeting the financial
demands of non-government health programs, including hospitals, rural
health facilities, and community-based activities.
The self-financing efforts of voluntary organizations are often
based primarily on the experiences and insights of successful program
leaders and managers. Our explorations suggest that while this often
provides a sound basis for developing new approaches to program
financing, sometimes it does not. For example, while some of the groups
we have visited accept the principle of raising extra funds from
"deluxe" or "luxury" services, there may sometimes be uncertainty about
what level of charges will generate a real surplus (over costs) as
opposed to just a cash flow.
As voluntary organizations seek to increase their self
financing capacity, whether for reasons of greater independence or
simply to expand their operations, there will be an increasing need to
develop capacity to plan and analyze alternative financing strategies
and to monitor and evaluate their results. This will require practical
information that can be collected and analyzed rapidly and that
provides relevant guidance for program decisions. This brief paper will
review some of the different dimensions of information needed for such
planning, the range of methods for getting it, and how it might be
utilized.
INFORMATION NEEDS AND DIFFERENT METHODS OF FINANCING
Appropriate information can help in deciding which methods of
program financing may be most advantageous and how to organize and
manage different approaches to financing. Experiences with different
types of financing activities will also generate much relevant
information about what works and doesn't work in the field.
2
The menu of financing methods is limited. The paper on
community financing experiences around the world by Wayne Stinson
provides a broad review of these methods, including: fees charged to
users, sale of drugs/supplies, personal or production-based prepayment
schemes, donated labor, income-generating activities, and
contributions/donations/special fund-raising activities. To these
"community” financing methods, we might add government and donor grants
and loans as other important sources of financial support.
For each of these methods -- and different combinations of
methods -- certain types of data or information are relevant for
planning, monitoring, and evaluation. One can identify four major
I
categories of data needed, e.g.:
1. Data related to defining the financing problem,
2. Data related to the costs of program activities.
3. Data related to generating revenue for program activities,
4. Data related to assessing results of financing activities,
certainly including the financial success, but with special emphasis on
the social and economic impact or implications of self-financing.
DEFINING THE FINANCING PROBLEM
Voluntary organizations are moved to develop self-financing
activities in response to some perceived need. This could include the
simple desire to increase the funds available for programs in general,
or an effort to remove excessive dependence on one or several sources
of funds because they are unreliable or inappropriate in some way,. or
>
other reasons.
Often, one can more easily identify the problem qualitatively
than quantitatively. Dependence on donor funding is a frequent
complaint. For example, programs expand rapidly when funding is
available initially, but are forced to contract if funding is not
renewed. Expenses are reimbursed, but late or irregularly or not fully.
How can these perceived disadvantages of dependence be
translated into goals or targets for self-financing activities? How
much funds should be raised internally to offset the negative effects
of rising and falling fortunes in seeking outside funds? What kind of
financial buffer could protect against reimbursement problems?
3
To answer these kinds of questions, organizations need to look
carefully at their total funding, at the composition of their funding
by its source as well as its use, and at changes over time (and
possible future changes) in these aspects. An example of one attempt to
examine such questions can be found in Table 11 of the VHS-Madras case
"study attached, which provides a trend analysis of the composition of
sources of finance for the hospital.
Another useful approach is to attempt to quantify the financial
goals of self-financing activities, say, year by year. In part, this
requires some knowledge of the cost, revenue,, and social and economic
dimensions discussed below. However, it also requires that one try to
develop a financial plan with some analysis of possible results under
different assumptions about future conditions. Priti Dave will present
an example of such a planning exercise on day 3 of this workshop.
Tools. The main tools for generating this kind of information
are those of financial accounting. Much of the data needed is probably
available in annual financial reports. For the financial planning,
simple "spreadsheet" analysis is useful. Much of the data and methods
discussed below can also contribute.
COSTING PROGRAM ACTIVITIES
For general fund-raising activities and for setting financing
targets, knowing the gross amounts of resources required for a given
program or activity can be adequate. For example, program managers may
know how much is required per village or block to set up and maintain a
certain project model. A hospital's annual recurrent costs may be
easily estimated from the previous year's experience.
But for some types of self-financing activities, knowing the
actual cost for specific units of service or more detailed breakdowns
of types of costs may be important. Costs provide a useful indicator of '
efficiency in program activities and, of course, they are the benchmark
against which any efforts at raising funds related to the provision of
individual services must be assessed in terms of ability to generate a
surplus. For example, if services such as "luxury" beds in a hospital
are established to generate revenue to support regular services,
clearly the charges for those beds must exceed their costs. Otherwise,
the hospital will be subsidizing its "luxury" users, not earning income
from them! A more difficult example might be estimating the cost of
services to be provided under a prepayment or insurance scheme, where
the final result depends not only on the operating costs of the
program, but on the utilization of services by scheme members.
4
Not all self-financing activities seek to generate a surplus of
success
surplus while others might be intentionally under-priced,
to earn a
E—
“-
program.
The "Costs and Financing" case studies distributed here provide
a number of examples of such ^nal/sis For- instance TabTIe 3 fr
h
Parivar Seva Sanstha case study (achec^here) show^how in^
^rhiSherincS’^a Recovers -g^^^^no^JargL^he^l inic
^r?Xri^e?nSg:?e:nJu2W:rdS^e^to lower9charges and
larger numbers of patients treated free.
Health services are produced by combining a variety of inputs in
the
dS’^r eza„ le the tj.e »f healt «or ers
remand
Ca~: £ "a;-X?^Tf,Ce
S:s;^itot?ts9:o s SSi ;h Si ^“» m =; f
the
staff-population ratios or Pr^^abing pr ^“R’;a™'t'^attached).
aslE gisl
cases coming. But it does help
goai.of health programs,
y g
not t e g
improve management W le low c°
a
i
r
wasted resources mean that rewer services
while
generating financial resources for programs.
Some of the basic measures in costing services include the
following:
1. Total cost: the sum of the value of all inputs to a program
or activity.
5
2 Average cost: the total cost divided by the total number of
units of output9of an activity, e.g. the cost per hospital bed-day, the
cost per outpatient visit or immunization.
3 Fixed/Variable cost. Fixed cost is that portion of cost that
remains the same no matter how much service is provided, e.g. the cost
of constructing a clinic building. Variable cost is that part of cost
that increases with the amount of service activity, for example the
drugs used in an outpatient clinic.
4 Investment/Recurrent cost. Investment cost is the base cost
incurred to get an activity or program started, e.g. construction,
training, etc. Recurrent cost is the cost that mustbe met in each
period of time to keep activities going, e.g. salaries. This concept is
similar to fixed and variable cost but also somewhatJifferent -- the
former relates to the quantity of service provided, while this
concerned with the time of expenditures and use of resources.
In self-financing activities, one may not initially try t° meet
all costs (total costs) from new financing sources, but first seek to
cover part of costs, such as variable or recurrent costs.
Tools. A range of methods is available for calculating the
costs of services. Most of what is done is common sense, although it is
helpful to be familiar with certain accounting conventions. Some °f th
imoortant issues that need to be dealt with are: 1) costs that are
incurred at one time but provide inputs used over subsequent time
period! eq training of a health worker, purchase of a vehicle, etc.
2) joint colts, or colts of inputs that are usedin Providing several
different services, e.g. the kitchen or laundry in a hospital, which
services patients in different wards. For small outpatient facilities,
these matters can often be adequately handled by appTying simple
allocation rules, possibly based on interviews with workers o
managers. For larger facilities like hospitals, which/ave1mo^hn5°re
services and a larger administrative component, more formal methods
exist such as "step-down" cost allocation methods.
FACTORS AFFECTING REVENUE
While knowing costs provides a benchmark against which to
assess certain self-financing activities, understanding the factors
affecting revenue is essential to the design and management of those
activities. These factors include the behavior of heaHh care users,
their economic resources and spending patterns, the availability of
□
alternative sources3 of services and other market factors, and other
community, social and economic conditions affecting the program. What
kinds of information are needed to better understand these issues an
their implications for self-financing activities?
levels and patterns of.use of services. Several methods of
self-financing depend heavily on the service utilization behavior of
the population being served. Such methods especially include user fees,
drugsales, and prepayment and insurance schemes. When.revenue depends
on individuals using or subscribing to the use of services and when one
seeks to alter the conditions of such use, by introducing a fee for
example, factors affecting user behavior can significantly affect
results.
For planning purposes, it is useful to be able to estimate the
volume of services likely to be sought, e.g. the number of
in-patients, outpatient visits, pregnancies, immunizations, etc. This
depends not only on the population rates of need for such services,
but, perhaps more importantly, on whether and how they act upon that
need.What proportion of the population does not seek services and why
What other sources of care are used and how do they compare in terms of
access, cost, etc.? Information such as this can be used to help
estimate the likely uptake of services.
Of equal importance is the need to monitor and assess what
happens to service use once self-financing activities are introduced.
What is the impact on use levels and patterns and who is affected.
levels and patterns of health expenditures. Again, where
f°r
sel.f-financing activities depend on individuals making
something, one must consider how much people are willing and able to
oav. One way of gauging that capacity is to understand how much they
are already spending on comparable services available elsewhere. Thi
at least provides an estimate of the most people might be WTlling
spend on comparable services provided from the voiuntary sector. Where
similar services can be provided at lower cost, one might reasonably
assume some willingness on the part of the population to support such
programs.
For example, a recent household health expenditure study in
Indonesia estimated that, on average, households spend about IRp°250
per person per month for primary curative care, with about 8-94 of
population ill during any given 2-week period. !t was estimated that,
if over 90% of those cases were treated at primary health care clinics,
7
the full cost of that care would be around IRp. 79 per person per month
on average. This was seen as a simple test of the feasibility of
establishing a prepayment scheme for primary curative care that could
provide equivalent services at less than one-third the cost of those
already being purchased privately. On the face of it, such a scheme
should be popular and improve people's well-being as well.
Similar calculations could be done for services such as
hospital care, although there the need and use of services is much
rarer for individual households and the level of expenditures much
higher.
Such information may indicate an economic justification for
self-financing activities, but this does not necessari y translate
easily into success in running such schemes in the field- People s
attitudes and preferences play a crucial role in how well such
activities are received.
Consumer preferences. In addition to learning more about where
people go for health care and how much they spend, it is important to
try to understand why they do what they do. People may be unwilling to
pay for services they feel ought to be provided free of charge or they
may be reluctant to pay in advance for the possibility of treatment at
some future date. Project services may appear to be comparable with
private alternatives, but other factors not obvious to project managers
may be important to users, for example, the age/seniority of service
providers, waiting time, clinic hours, etc.
Market information. Some self-financing activities depend on
being able to sell goods in order to generate a surplus to support
program services. Examples of this include lotteries, special income
generating activities, and sales of drugs. Voluntary organizations need
to undertake appropriate market research to gauge whether such schemes
are feasible or not. One should also consider what the effects of such
schemes might be on other producers in the market.
Tools. A standard method for assessing health care utilization
and spending factors is the household survey This need not be a major
research undertaking, especially if one can identify clearly a f
important aspects on which information is needed. The advantage^of the
survey is that it can give a reasonably representative picture of the
whole population to be served. An important disadvantage, however,
that some of the information needed is difficult to collect accurately
in a formal interview setting.
8
Other methods may also be very useful, especially when
resources are limited or there is little time available. Interviews
with key informants in the community can give a good picture or the
health care marketplace and provide insights into utilization patterns
and consumer preferences. Group interviews, such as focus groups, can
also be useful in this regard.
Another method usually not recognized as such is the monitoring
and assessment of experiments and pilot projectsin self-financing.
Even with the best survey data, it is often difficult to predict how
populations will respond to changes in the way services are provided or
to
to efforts
efforts to
to raise funds from the community. There is much to be
learned from just getting started and keeping careful track of what
happens, perhaps augmented by qualitative research methods.
SOCIAL AND ECONOMIC IMPACT
The major concern about self-financing activities in the
voluntary health sector is their effect on the poor. Voluntary
organizations exist as social service and development institutions
dedicated to meeting the needs of those most disadvantaged in society.
There is much discomfort with taking on some of the characteristics of
the commercial sector, such as charging for services, producing and
selling goods at a profit, etc.
It is also clear that different approaches to self-financing
have different effects in terms of who pays and who receives benefits.
Donor funding, while it has its difficulties, may appear to be the
least problematic.in this regard. The burden of payment is somewhere
far.outside the community -- the benefits go to those being served.
Nonetheless, the widespread use of at least partial self-financing in
the voluntary sector suggests that the distributional issues need to be
addressed.
Stinson's paper provides a good summary of the strengths and
weaknesses of different methods of community financing. For example,
user charges, while easiest to administer and most familiar to
populations, place the financial burden of illness only on the sick
and probably disproportionately on the poor. In contrast, prepaymen
schemes share the risks of illnesses more equally, but require more
effort at administration and management and membership charges are
difficult to vary by income classes.
There are no simplistic answers or solutions to the
distributional questions, but it is critically important to address
them frankly and openly. This requires information on differences in
9
" for
health needs, service use, and spending within the
pxamnle bv income groups or other relevant groupings such as
discussed'i^th^preceding sectioS.^'addifion^uch can ^earned by
the distribution if benefits and costs to different groups in the
community.
Tools. The methods available for looking at social and economic
imoact are similar to those already mentioned above. Of particular
mnoSance however, is the need to develop appropriate definitions of
JiffS groups in the community. Survey information on income is
socio-economic position.
INFORMATION VERSUS RESEARCH
Voluntary organizations are action-oriented and may have little
t e and
appropriate for a voluntary organization, whose goal is service
research?
. . There is no single answer to this question. Obviously, it
Clearly, »bat Is needed Is not researe , but appropriate
information for planning, monitoring, and evaluation.
Experience to date suggests that there is stil'l a lonj, way to go
9
in developing appropriate information to support the self
activities of the voluntary sector. Methods need to be adapted to the^
ij c-ifnatinns nf a 1 arqe number of groups working in differen p
x^ierSa^r:!
10
repeating others' mistakes. Steps are being
which while constantly facing the critical test of Prac?cality ana
usefulness, will also hopefully contribute to strengthening the
financial stability of voluntary health programs.
<
Com h 2^ *z_
COMMUNITY H
CELL
E
47/1, (First Floor)St. Marks Road
BANGALORE-560 0
0
SELF FINANCING PARTICIPATIVE
COMMUNITY HEALTH CARE PROGRAMME FOR
TIRTHAHALLI TALUK OF SHIMOGA DISTRICT, KARNATAKA
Sponsored jointly by Ford Foundation, Kasturba Medical
College (Department of Community Medicine), Kasturba
Hospital, Manipal and Manipal Industrial Trust.
The programme is being implemented in the backward taluk
of Tirthahalli in Shimoga District. A local co-ordination
Committee was constituted in April 1989. The recruitment and
training of the staff was done in October, November and
December 1989, and the actual work started in January 1990.
The objectives of this project include the following:
a)
b)
c)
d)
To provide improved domiciliary care especially in the
field of MCH and family planning.
To impart intensive health education.
To build up a good referral system.
To generate community participation.
There are 2 main components in this programme:
I
i)
The Mobile Medical C1inic: This is staffed by a husband
_________________________
and wife team of doctors (husband - MD in OBG and wife MBBS with Paediatric experience), supported by Medico
Social Worker, ANM and a Lab Technician-cum-Dispenser.
19 clinics are conducted in different places where Govern
ment facilities are not available. Some of the clinics
are once a week and others are once a fortnight. About
20 to 40 patients attend each clinic. Initially the number
of general patients was more, but this is gradually coming
down, and more women and children are attending the clinics.
ii)
The field component: Domiciliary maternal and child health
care is rendered by village health volunteers (Sanchalikas).
There are 100 Sanchalikas. Each Sanchalika looks after 100
households. They have identified and maintained a register
of pregnant women, underfives and eligible couples in the
100 households. The most important activity of the team is
health education and motivation of mothers. 10 Sanchalikas
are supervised by one Lady Supervisor, who is a graduate
and who has received training at Manipal. The Sanchalikas
were also trained at Manipal in 3 batches.
Ms. Erika Larson, an Anthropologist and a medical student
from the United States spent about 4 weeks in March/April 1990
in the project area working with the mobile clinic team, the
field staff and the community. She has given an interim report.
A meeting of the project staff was held at Agumbe on 7th and 8th
April in 3 batches of about 35 each. The following issues were
considered:
a)
b)
c)
d)
e)
f)
Knowledge, attitude and skills of Sanchalikas in the
delivery of MCH care.
Acceptance of the health care facilities offered by the Trust.
Extent of utilisation of the health services.
Willingness of the community to meet the cost of the health
care facilities offered by the Trust.
Attitude of the people towards acceptance of family planning.
Cultural factors influencing health and diseases.
...2<
A
1
2
It is too early to come to any definite conclusion.
However, the following views can be considered for the purpose
of making interim assessment of the situation:
a)
Sanchaiikas and Supervisors: The raw—material is good.
They are enthusiastic and have the right attitude. From
the registers maintained by them it is observed that they
have made a good job of identifying 100 households each,
with women in the reproductive age group, pregnant women,
lactating mothers and children under five. However, they
require further training. This has been arranged in 3
batches in May 1990 starting on 2nd May, 14th May and 23rd
May respectively. A Lady Community Development Officer,
who is already working in Tirthahalli area has been asked
to supervise their work. A Lady Doctor has been appointed
and she will be incharge of the field wing, with emphasis
on the spreading of health education in the community.
According to the survey carried out by the field staff
each 100 households being looked after by a Sanchaiika has
between 2 to 8 pregnant women. The total number is expected
to be around 500 at any given time in a population of about
50,000 being looked after by the Sanchalikas. It is planned
to organise group meetings regularly through Mahila Mandals
and impart health education to the pregnant women and the
members of the Mahila Mandals in the villages, so that in a
couple of years time there will be at least about 1,000 rural
women trained by us, who will form a purely voluntary force
at the grassroot level, in addition to the Sanchalikas
working with the Trust.
b)
Acceptance: There is need for the services offered by the
Project, but it is not reaching the people in the interior
villages, and also the poor sections of the community. The
reasons put forward are distance, lack of bus facility,
loss of wages and the cost of the service (registration
charges and payment for costly medicines). Alternative
arrangement suggested was providing medicine kits to the
VHVs and giving them the necessary training in the use of
such medicines. This is being arranged.
c)
Extent of Utilisation: More general patients than women and
children attend the clinics. This may be because the health
education imparted so far has had only a weak impact. This
right, The location of some of the mobile
is being set right.
clinics is inconvenient, Some of them are being changed to
more convenient locations.
d)
family From
Acceptance of
planning:
the survey of the 10,000
______
households already made, there are 2 to 8 pregnant women out
of each group of 100 families. This shows that family planning
norms are acceptable to the people.
e)
Cultural factors: There are still a large number of people
in the villages who believe that diseases are caused by God
or Evil Spirits. Their approach invariably is to appease
the God/Evil Spirits, and also to seek medical intervention.
The medical intervention may be home remedy, ayurvedic
medicine or allopathic system. The choice depends upon the
economic conditions of the family and the easy accessibility
of the facilities.
i
3
:-
In view of the inability of the mobile clinics to deliver
health care facilities in the interior inaccessible villages,
and the comparitively high cost, it is doubtful whether the
community or the Mandal Panchayats will come forward to
contribute towards its maintenance, when the Ford Foundation
Grant ceases. However,! the field component is considered most
crucial. Its members are a part of the community and they are
involved in the spread of health education, providing first aid
at the door steps in the interior places, and act as a friend,
philosopher and guide. With sufficient training and experience,
and under the guidance of a qualified doctor the field component
is expected to become popular. The cost not being so high, the
community is likely to agree to contribute towards the mainte
nance of this component.
The monthly medical camp conducted by the Kasturba Medical
College and Hospital, and the referral services of the Kasturba
Hospital, Manipal are considered invaluable. The assurance of
these facilities being continued even after the Ford Foundation
Grant ceases, goes a long way in creating in the minds of the
people of Tirthahalli that their participation in the programme
will be beneficial to them in the long run.
28th April 1990
Manipal
■ i
P.V. Rao
Executive Secretary
Manipal Industrial Trust
Position: 1209 (13 views)