Population explosion in India; way ahead
Item
- Title
- Population explosion in India; way ahead
- extracted text
-
JANASANKHYA
STHIRATA KOSH
(NATIONAL POPULATION
STABILISATION FUND)
Population explosion in India; way ahead
Presentation by
Dr Amarjit Singh
Executive Director
Jansankhya Sthirata Kosh
( National Population Stabilisation Fund)
An Autonomous Body in the Ministry of Health & Family Welfare
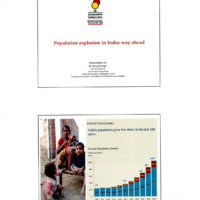
POPULATION SCENARIO
India's population grew five times in the last 100
years.
Decadal Population Growth
Population (million)
1200
1,029
1000
846
800
683
182.31
163.0
600
109.0
361
846.3
400
683.3
548.2
(TIM
200
238.4 238.4
1901 1911
1921
1931
1941
1951
1961
1971
1981
1991
Source: Census 2001
2001
Where are we?
Average
Projected
Population
Total
Under 5
Under 5
Population
Population
Growth
Fertility
Mortality
Mortality
(millions)
(millions)
Rate (%)
Rate
(Male)
(Female)
(2009)
(2050)
(2005-10)
(2009)
(2005-10)
(2005-10)
India
1198.0
1613.8
1.4
2.68
77
86
China
1345.8
1417.0
0.6
1.77
25
35
Pakistan
180.8
335.2
2.2
3.87
85
94
B'desh
162.2
222.5
1.4
2.29
58
56
Total
Country
Source: The State of World Population 2009; UNFPA
Projected Population of India: 2001-2026
Share of additional 371 million
Bihar
Jharkhand
3%
Madhya Pradesh
Chhattisgarh
Uttarakhand
2%
1%
Rajasthan
7%
Orissa
2%
Uttar Pradesh
22%
Four Southern
States
13%
Rest of the Country
35%
Source: National Commission on Population MOHFW 2006
1
JANSANKHtA
SIHIIATA UHH
Population of Indian states matches that of large countries
183 million 1187 million
Uttar Pradesh
Mexico
1Q4|104
Maharashtra ■■■■
CMB^BHBH
Germany
90
Bihar
Bl Vietnam
West Bengal
85|85
~80|84
Bl Philippines
Andhra Pradesh ■
W^6|63
Thailand
Madhya Pradesh
A i
■■■■■■V A V
65161
Tamil Nadu
SHBHM France
Rajasthan
££■■■■■ Italy
Gujarat
L9HHH South Africa
Orissa ■■■KS KMBBB Argentina
Kerala
Canada
Jharkhand ■K) HSH Uganda
Assam
Ml Uzbekistan
Punjab HKl
Peru
Haryana HE)
Romania
Chhattisgarh
^B Ohara
Delhi ■Id tUl Cambodia
MKUtra
Jammu & Kashmir U EDI Belgium
ilt
R.G.I
Uttaranchal El El Austria
»•»)«*
Brazil
£
r'
Estirnfllft- 2OO('
POPULATION SCENARIO
While some states have achieved replacement
level fertility, others will still take many more
years
Kerala (1988)
Tamil Nadu (200W^ __ Uttar Pradesh (2027)
Madhya Pradesh
Delhi (2001)^^M|
(2025)
\ Chhattisgarh (2022)
Himachal Pradesh
(2002)
Andhra Pradesh /
(2002)
Uttarakhand (2022)
Bihar (2021)
West Bengal (2003)
Rajasthan (2021)
NE States (2005)
Assam (2019)
Karnataka (2005)
Punjab (2006) X.
/'Jharkhand (2018)
/
Maharashtra (2009)^^^"
Orissa (2010T
-^Haryana (2012)
Gujarat (2012)
Source: National Commission on Population MOHFW 2006
Achievement in Sterilizations against ELA
2009 -10
■ %ACHIEVED
I
I
62
58
43
■ %UNACHIEVED
68
73
74
RAJASTHAN
CHHATISGARH
Hi
BIHAR
MP
UP
----- AndraPradesh
—Bihar
-- UP
JHARKAHND
10685
9195
8068
6871
6247
4989
4359
3295
2771
3329
1768,
2704
1981
1985
2795
1991
1995
2001
2005
Sterilized couples per 10,000 eligible couples
1000
900
860
Bihar
India
AP
800
769
669
700
591
600
581
488
500
478
425
400
365,
300
336
337
299
341
272
257
277
-
250
200170
211
15!
2(
92
153
100
131
87
89
0
1973-74
27
62
2!
1978-79
1983-84
1993-94
1988-89
1998-99
2003-04
2008-09
Demographic dividend?
2008
lndia2071
Male
Female
65-49
60 64
50 54
30-M
25 29
20 24
05-09
00 (M
Source: Census 2001, DemProj model
Prevalence of Anaemia among Women and Children
Education
Equity
■ NFHS-3, 2005-06
■ NFHS-2,1998-99
79
■ ■I
Children 6-35 months (%)
Pregnant Women 15-49 age (%)
Ever Married Women 15-49 age (%)
High percentage of anaemia among children and women results in higher risk of infant
and maternal deaths
Source: UPS NFHS-2 and 3 2005-06
Deaths due to communicable diseases per lac population
Communicable
Diseases
Brazil
China
Indonesia
Sri Lanka
India
1 TB
7.9
20.8
58.5
6.9
34.8
2 STD's /other then HIV
0.3
0.0
1.2
0.3
4.6
3
HIV/AIDS
7.4
3.3
0.8
0.3
34.4
4
Diarrhea
9.8
8.3
16.3
3.6
43.5
5
Malaria
0.4
0.0
3.2
5.5
0.9
6 Respiratory Infections
29.6
22.4
49.0
34.8
107.0
7 Maternal Condition
2.6
0.8
4.8
1.6
12.7
8 Perinatal Condition
40.2
20.9
33.7
12.3
72.6
8.9
0.6
10.1
7.0
12.3
40.1
52.3
50.6
35.8
76.2
37.7
24.0
24.8
44.8
23.8
9
Nutritional Deficiency
Injuries
1
2
A. Unintentional
Injuries
B. Intentional injuries
Right to education?
• 13.3 lac new teachers required UP (3.9); Bihar (2.2)
• 9.43 lac additional class rooms required UP (2.5); Bihar
(2.5); 33,405 pucca schools and 27000 kutcha schools
require upgradation
• 7 lac girl toilets required
• 3.4 lac schools require drinking water facilities
• UP requires 38,000 crores; Bihar 26,000 crores in the next
five years for implementing RTE
Quality of life
• 37.2% below poverty line; cost of implementing
food security law annually Rs 40,400 crores
• Number of people living in slums in India has
more than doubled in the past two decades and
now exceeds the entire population of Britain;
• 61.8 million people were living in slums in
2001, up from 27.9 million in 1981. In Mumbai
almost half of city's residents, approximately 6.5
million people live in slums. In Delhi almost 2
million people live in utter squalor.
TFR in Madhya Pradesh, Bihar and Andhra Pradesh
Children per woman
-♦-Madhya Pradesh
Bihar
-*-Andhra Pradesh
5.0
4.4
4.5 *---- -
4.6
4.0
3.0
2.0
0.5
0.0
1991
2006
2001
1996
2007
SRS, RGI
State
Adnl. pop in a
Equivalent
decade over
to
NGRof
Addnl
2009 Est.
Pop
Growth
Pop in
over AP
000's
AP's NGR in
000's
AR
10.9
MP
19.4
8.5
69,897
5941
HP
Bihar
21.6
10.7
95,026
10168
Punjab
UP
20.7
9.8
193,763
18989
Rajasthan
20.7
9.8
65,650
6434
> HP
41532
> Kerala
Child deaths
Mother deaths
24,92
1,66
-k' J
If we continue to grow at the current pace, we
r J will double our population in SOyears - making
: sustainable development unattainable
Urgent need to reduce population growth
Population (billion)
Possible Population Scenarios
Fertility remain
constant at 2005
level
2.01 billion
2.00
High variant
1.87 billion
Medium variant
1.61 billion
1.50
Low variant
1.39 billion
1.00
2005
2010
2015
2020
2025
2030
2035
2040
2045
2050
Source: Census 2001
ti'B
I'L)
FACTORS THAT IMPACT POPULATION GROWTH
1 ><
High Infant Mortality leads to greater desire for
more children
Madhya Pradesh
70 I
-
, 73'1
67 I
75 1
Orissa
Uttar Pradesh
76 I
i
Assam
__ 68 I
Rajasthan r
~6T1
Chhattisgarh
«?7 I
63 I
„ 6T1
56 I
Bihar
Andhra Pradesh g
1
s>l
57~1
54 I
50 T
,50 I
^61
_ 50 I
Gujarat
Jharkhand
Karnataka
_45J
3'6'1
33 I
; 371
Maharashtra
Tamil Nadu
2006
31. I
2009
Kerala '
Source: SRS
Percentage of Rural Currently Married Women who married before age 18
Bihar
70
|
62
Rajasthan
Uttar Pradesh
59
58
Madhya Pradesh
Jharkhand
West Bengal
58
Andhra Pradesh
Karnataka
Chhattisgarh
56
54
I
■■M 48
■■ 44
■ 41
Orissa
Delhi
|
40
I 39
Haryana
K
Maharashtra
Assam
Gujarat
Tamil Nadu
Uttaranchal
Goa
Kerala
■■ 20
M 19
|
Punjab
Himanchal Pradesh
Source: DLHS-3 2007-08
29
26
|
■ 17
16
FACTORS THAT IMPACT POPULATION GROWTH
Pregnant teenage
girls are at high risk
of death or disability
In India almost one fourth of teenage girls were
pregnant or mothers by 18
Percentage of teenage girls in India who are pregnant or
already mothers
36
24
13
A
6
3
rZ
16
15
17
Age
18
19
Source: NFHS-3 (2005-06)
Girls with less than
10 + education are
not able to exercise
control over their
Reproductive Rights
FACTORS THAT IMPACT POPULATION GROWTH
Fertility declines with increase
in education levels of girls
Percentage of teenage girls who are pregnant or
already mothers
33
21
14
No education
<5 years
complete
I
5-9 years
complete
6
4
10 -11 years
complete
12 or more
years complete
Source: DLHS-3 (2007-08)
Education Status of Rural Unmarried Women (age 15-24)
District Level Household Survey DLHS-3 (2007-08)
□ Less than 10 Schooling {%)
■ 10 Plus Schooling (%)
■ non literate (%)
15
72
14
Chhattisgarh
15
71
14
Rajasthan
17
63
Bihar
19
56
25
Jharkhand
21
53
26
21
25
Uttar Pradesh
30
59
16
52
18
11
28
Himanchal Pradesh
71
Kerala
75
High percentage of Non
Contraceptive Users
indicates lack of
awareness and gap in
service delivery
25
FACTORS THAT IMPACT POPULATION GROWTH
56 % of the married women in UP with 2 children
want no more children yet:
Female
Sterilizatio
n
8.0%
■Pl
I
ft
L.
JANSANKHYA
STHIRATA KOSH
Mmjrviuro'!
Madhya Pradesh
Orissa
1
Non user
69.1%
41
Male
Sterilizatio
Pill
n
,2.0%
0.1% /
IUD
0.9%
Condom
8.0%
p\_Any
Traditional
Method
11.9%
III
limiting
27%
I 'k5'
Spacing
19%
k
Total
unmet
need
46%
Total unmet need
Source: DLHS-3 (2007-08)
Acceptance of Family Planning method by Number of Children
(Percentage ofSterilized couple with two children faster support to stabilized population than the three or more children)
Andhra Pradesh
Uttar Pradesh
Four and
more
children
15.3%
Four and
more
children
57.5%
Three
children
32.3%
Two
children
48.0%
Three
children
27.9%
Two
children
12.8%
One child
4.3%
One child
> 1.7%
Sterilisation
Sterilisation
Source: NFHS-3 (2005-06)
FACTORS THAT IMPACT POPULATION GROWTH
Early and long period of fertility impacts
mother and child health.
Births per thousand women
300
Uttar Pradesh
4.2 child average
250
200
Andhra Pradesh
1.8 child average
150
100
50
Tamil Nadu
1.8 child average
0
15-19
20-24
25-29
30-34
35-39
40-44
45-49
Source: SRS (2006)
What do we do?
Family Planning is Cost - Effective...
Repositioning
FAMILY PLANNING
PROGRAMME
F
MATERNAL
HEALTH
5/12/2010
CHILD HEALTH
Family Welfare Division, MOHFW.
OVERALL
DEVELOPMENT
28
Family Planning
Saves Maternal Lives
Evidence from States
75
400
70
350
65
TFR showed the
strongest relation
with maternal
mortality of all
covariates;
300
60
250
55
V
200
50
45
150
III
100
Greater fertility was
associated with
increased maternal
mortality.
SO
a
0
K^IMR (SRS-2004-06)
40
35
30
25
♦ CPR Any Method DLHS-III
Parallel Relationship between TFR & IMR
3.11------------------------------------------------------ --------------------------------------------- r62
3.0
60
3)
57
2.8
56
2.7
54
2.6 -I—
2.5
50
2003
2004
2005
2006
2007
2008
Parallel Relationship between
TFR&IMR
4.5
80
70
69
4
70
63
3.5
60
53
iO
3
.45
50
2.5
40
2
2
30
1.5
20
1
10
0.5
0
0
x./
z
/zzz </ zz;zxZ4z'z
-A-TFR(SRS- 2008
-*-IMR(SRS-2008)
Maternal and Infant Deaths Decline
65
-63t862.3
61.9
61.3
135
59.9
56.9
.60
95
100
63
50
45
50
33
49.5
45
40
10
Assam
Rajasthan
Madhya
Pradesh
IMR(SRS-2OO8)
Karnataka
Gujarat
-a-MMR (2004-06)
Tamil Nadu
Maharashtra
-«-CPR Any Method DLHS-III
Kerala
Meeting the unmet need will avert
nearly 35,000 maternal deaths
Number of maternal deaths averted due to increased use of
family planning (2010-2015)
300.000
263,402
200,000
34,872
maternal
deaths
averted
100,000
Source: Sample Registration System, Registrar General of India, Maternal Mortality in
India, MDG analysis provided by USAID | Health Policy Initiative Project
Meeting unmet need will avert nearly
12 lakhs infant deaths
Number of infant deaths likely to be averted due to
increased use of family planning (2010-2015)
7,000,000
6,196,168
3,500,000
Meeting unmet need to achieve MDGs:
Social sector cost savings outweigh family planning costs
Cumulative Savings:
Rs 27,765 Crores (2010-2015)
I
2
30000
TB: 58
MH: 2,020
25000
Water and
Sanitation: 1,938
*
20000
15000
Immunization:
17,262
10000
Cumulative Costs:
Rs 3,782 Crores (2010-2015)
5000
Education:
6,488
FP: 3,782
0
Source: Sample Registration System, Registrar General of India, MDG analysis
provided by USAID | Health Policy Initiative Project
Pregnant teenage
girls are at high risk
of death or disability
■
Challenge: Age at First Child birth
Percentage of teenage girls in India who are
pregnant or already mothers
9
8.2
8
7
6.3
5.9
6
5.6
5.2
4.6
5 '
3.2
I 2.6
3
2
Ji
1
0L
I
o
India
Bihar
Raj
Jh
UP
MP
Orissa
TN
I
Ker
■ Birth to women durin age 15-19 yrs out of...
Source: DLHS-III
Too young, Too many, Too Frequent
High-risk births lead to high child mortality
Delay child marriagesand promote birth spacing
0 •
:™ ™
<20 20-29 30-39 40-49
Birth Spacing (yrs)
Birth Order
Mother's Age
Source: NFHS - 3 (2005-06), UPS Mumbai
Girls with less than 10 +
education are not able
to exercise their
reproductive rights
Challenge: Female Education
Fertility declines with increase in education
levels of girls
Percentage of teenage girls who are pregnant or
already mothers
21
14
6
No education
A
<5 years complete
«ni> Kadri
5-9 years
complete
10 -11 years
complete
12 or more years
complete
Source: DLHS-3 (2007-08), UPS Mumbai
Total Fertility Rate
Success and Challenges
2007
1
JANSANKHYA
STHIMTA KOSH
MHDMX FWUHN
lui buaw i .*2
TFR lowest amongst
EAG states
TFR
Less than or equal to 2.1
2.2-3.0
More than 3.0
Derived by JSK
Strategic Options
Wanted
Fertility
Unwanted
Fertility
Population
Momentum
• Fertility
Preferences
• Address High
IMR
• Son Preference
• Strengthening
Quality Family
Planning
services
• Delaying Age at
Marriage/ Age
at 1st Birth
• Healthy Birth
Interval
TRANSLATING POLICIES INTO ACTION
•
Improve contraceptive choice
•
Enhance use of birth spacing
Current use of contraception
57.4
5
I? »
55.4
48.5
44.2
si
II
>. E 20
40
28.5
13.3
s •
II
~
10
Q
5J
g5
India
Bangladesh
Indonesia
Nepal
Thailand
Countries
■ mCPR ■ Injectables
Source: DHS latest surveys
PPP options
Chiranjeevi? Mothers & New Born babies saved ( Up to January- 2010)
Total
Deliveries
under
Chiranjeevi
scheme
Estima
ted
Matern
al
Death
Maternal
death
reported
under
Chiranje
evi
scheme
Mothers
saved
under
Chiranje
evi
scheme
435047
1305
77
1228
• Normal Deliveries:
•C-Section:
• Complicated Deliveries:
• Private specialist enrolled:
so
-- O
Estimated
Neo-Natal
death
10006
Early Neo
Natal death
reported
under
Chiranjeevi
scheme
Early
Neonat
es
saved
1646
8360
386660
25918 (6.0%)
22469 (5.2%)
768/2000
9 PFP
JSK as a facilitator
Creating awareness - JSK Call Centre
1
JANSANKHfA
STHIUTA KOM
Call offered from June 2008 to March 2010
: Over one lakh calls
Enquiries made: Over one lakh seventy five thousand
Approximately 400 calls per day
Male callers are proportionately higher than the female callers
Married callers: 70% (average)
Majority of the callers from the age group 21-30
Major callers are target states of:
Uttar Pradesh, Bihar, Jharkhand, Madhya Pradesh and Rajasthan
5
Type of Calls
JANSANKHYA
STHNtAIA MSH
(percentage distribution of enquiries)
Lui.JlAllO* f>»3.
Other Health
Concerns
27%
Contraception
Puberty
3%
8%
5%
6%
1
Virtual Resource Centre
1AN5ANKHYA
SIHIUTA KDSH
fanoxi: rwiuM*
iuimum
VIRTUAL
RESOURCE CENTRE
News updates
Population of India
Population of World
s,eo».2ao.34»
lhe^HiM«HrMMrtcr« enlteraaone wlop vorvice rm ptovKitttu
4< <**« to 4<sroc.»CV <ti»u coinmunicriiott material total<«d to
wth Mpoput.thort. qihmIoi nto<bor. ttrfaril arid ctAW liranh.
WKibiMv. topcedMcWve healti. I«v • AOS. deciimnQwca iaho.
PtratoQiapii*
women*'* nantv momon octolescefrt
Pilnl»<1 Ms* •flats
uraual wwience
Poetai
HTV< AOS
IHlisa
Contraceptloii
iitfate* ft CMdion
You Can
Contribute
A<iolc«<-AfKe
Material
Poptiuoiim A Deveiopwtoin
jsk
GMWfAi
lfn|»o«i«Nit Doya
Vi*All
llMVill I
AAmocetl Search
| ContMrlUe
1
______
JANSANKHfA
STHItATAKDSH
-fcn KttmjrMd tv fct
*»” .»*
PRERNA
Responsible Parenthood
I
Award
Mhoui rvnAiro*
iuiiuum iwa;
Award aims to create local Role Models for:
Pushing up age of marriage
Spacing between children
Registration of marriage
Welcoming birth of girls
Importance of mother's health for child's health.
1
Prerna Awards 2008-10 and in pipeline during
2010-11
District
State
JANSANKHtA
STHIUTA KOSM
rmuMM
iUllUUBMt MM
Couples
awarded
In pipeline
Rajasthan
Dhaulpur, Jodhpur &
Barmer, Jalore, Pali
206
1000
Orissa
Nabrangpur& Kalahandi
92
250
Chhattisgarh
Rajnandgaon
24
UP
Most districts
MP
Most districts
Bihar
Most districts
500
Jharkhand
Hazaribagh
18
1000
41
363
Total Awardees
■ V?r!E - SOCI i/
.
,
Kora ma ng a la
Banq<ilore ---------- — - < ' * y
- (Cl IC) ’ A..'"
I
550
3318
SANTUSHTI
1
JAHSANKHYA
STHItATA KOSH
MHD4U rwutfo*
tlUUUBM 1U»9:
PPP Model
The strategy offers private sector empanelled surgeons/facilities to
perform sterilization operations (male/female) in accredited private
nursing homes/hospitals after receiving an advance of Rs.15,000/- and
Rs. 1,50,000/ for conducting 100 cases
The facility gets Rs. 500/- extra per case if 30 cases are done on a
single day in a fixed facility
Certification of CM HO with regard to quality of care /authenticity of
couples, necessary to release funds
Both API /BPL clients are entitled for free service
Working with state governments
Bihar - Pilot state
JSK is holding motivational meetings for
the field level staff for promoting IUD and
sterilizations in low performing districts
such as E & W Champaran, Gaya and
Bhojpur.
More than 95% of staff have attended
these meetings.
The outcome is positive from 40,000 IUDs
annually, 2.14 lac IUDs have already been
inserted by the end of during 2009-10
•9, IV
] JVJ*-
1
JANSANKHYA
STHHATAKDSH
West Champaran, Bihar
Progress of Family Planning in Bihar
404,035
250,550
11
2007-08
2008-09
2009-10
450000
12000000
400000
10000000
250000
60000000
200000
40000000
100000
20000000
1981
1985
1991
1995
2001
2005
2010
■Population
Progress of IUCD acceptors in Bihar
213,696
44,923
41,606
2007-08
2008-09
2009-10
Focus in 2010-11 on Family Welfare in MP
•20 1 O.g «-
cFH v^4TrTF^h f^vl
HI
nrot -.-teH *. 22 d-n*«S■»» «pw«
r»r iit «fi =?ini-t A tw
.thnr. -MIMIIh n*fit «w *»nnn
*I
wsth
jr-niwii
Htanw w»
>rfr■tp'i it
sttr
<.«<v
*;
i’''’
<■* ■4W. -*<t>n
Fw-on
•
f»rw*i *'uew M
t-
Jj/l
g-iW nn
——-
.
twiM w Pt.
««
, ——A«
llFtm «rfwir w.
wS
’l
■•<•'1 n
4R sitfiCT * M,“‘
--
firm
-
watt f-». upi"n
” t»a »’ i»b
»H?l ■=>fiKm
-------------------------------
*
J, ^;;=r --ft* td** nrs
«r»TW< .-ft* k^t* r=ra ■!
1
wwtn
»TW4f?<
r
wo a -<rw/n af.'
a-wtw'n -jPx «’ ’I”-
J « «’»■
“ar,■,
>1cW5>f4 jjFrftwa »ir**WTW«»
iF. «n"i * fewt iFTrtwr f«nm
«-rt •irn r*-t«>«n Pwnt «*> %
•afattfri m:
tmtnn A
**
ir jjit au >ntHvl aw «* fi i
fattani wwA
tn**
nu
<r.i
Mi
<pnnt fl »n« wr>.
'.rtktJ. * 1 t-IUW VftM 'WHR
xnprft -A
f* ‘nt 4 W
’«
w* nu
JT-Wt
vAmi
.zwrar fjwfvt^wi 1*1 t«3i: •! U’tm
T* fiw?
.let’ll mia tF«F'
——
2 2 ejxif^Tzh
WmMr-t
_
«>
”
HWll
-wtnnvn
a- h«w ««'-tmw
t**t wx>.a i
*l ^''n rfrsra’
Rethinking JSY?? Use savings for incentives
JSY Payment according to number of children in Bihar/
60
Payments made for more
than 2 children in crores
2008-9
88
2009-10
76
55
50
40
30
20
10
0
2007-08
■ JBSY who has 1& 2 children
2008-09
1
2009-10 till Jan
■ JBSY payment who has 3 & 3+ children
iiuf
Mission Population Stabilisation
Investment in FW as an investment and not expenditure - improve access to and quality of RCH services
•
Gender equity and women's empowerment-female literacy; delayed marriages; economic opportunities and
independence: Male involvement in reproductive health
Strengthening programme management - Mission in 4 high fertility states
•
Software for follow up on eligible couples - first delivery to be tracked for IUD insertions - Regular monitoring by number of children. JSY after 3 children? Incentive scheme for accepting sterilization??
Active involvement of the private sector- PPP
Enhancing contraceptive choices - Injectables
Enhancing awareness - Vigorous mass media campaign
Advocacy - Involvement of peoples' representatives - all party meetings
Reward good performers
Let us all join hands for Improving the HDIs of our
country.
We make a living by what we get;
we make a life by what we give!
Dr. Amarjit Singh, IAS
Executive Director
(National Population Stabilisation Fund)
Ministry of Health and Family Welfare Government of India
U. I
- Media
 16666.pdf
Position: 89 (207 views)