Karnataka Health System and Services
Item
- Title
- Karnataka Health System and Services
- extracted text
-
ch \n
■
_D
s lu^cL
9^ 5C4++6C4
1. INTRODUCTION
’
;
Karnataka Health System and Services need to
be considered not only on their own, but also in
relation to the neighbouring States that share its
boundaries along with people and problems which
are contiguous. Also, such a comparison would put
in context any understanding of health in relative
terms considering the better status of the Southern
partsof our country.
Historically, Karnataka's Health System and
Services evolved from an amalgamation of the
different geographical areas and their services
following re-organisation of States after India's
Independence. Karnataka includes areas from the
erstwhile princely Mysore state and adjacent Malabar
areas along the west coast, parts of Bombay and
Madras presidencies and Hyderabad from the
Nizam's dominion prior to reorganisation.
Karnataka and its people suffer from most of the
diseases in the country. In addition, Handigodu
Syndrome and Kyasanur Forest disease are peculiar
to this state.
2. FACTORS AFFECTING HEALTH
Some factors which are universally accepted
as affecting health of people are reiterated to
establish the setting in which Karnataka's Health
Systems and Services operate. A comparison with
the neighbouring states and national figures
clarifies Karnataka's position better. These include
population density, Decadal growth rates, Sex
ratio, Literacy rates (especially female literacy),
population below the poverty line, urbanisation
and road communications to villages and some
trends which have an impact on health. These
provide the milieu in which the Health Care
Services and System operate.
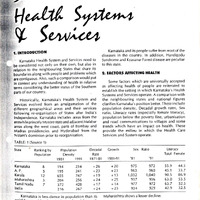
TABLE: 1 (Source 1)
State
Karnataka
A. P.
Kerala
Maharashtra
Tamil Nadu
India
Ranking by
Population
8
5
12
3
7
Population
Density
1981
1991
Decadal
Rate
1971-81
234
241
747
256
428
267
+ 26
+ 23
+ 19
+ 24
+ 17
+ 24
194
195
655
204
372
216
Karnataka is less dense in population than its
neighbours with a fast declining decadal growth
rate matched only by densely populated Kerala.
Th? sex ratio in Karnataka is adverse and
worsei ling. Only Kerala shows positive improvement.
Growth
Sex
Literacy
Total Female
Ratio
1981-91
’81
’91
+ 20
+ 23
. +13
+ 25
975
963
1,032
937
977
934
972
960
1,040
936
972
929
+ 14
+ 23
55.9
45.1
90.5
63.0
63.7
42.9
44.3
33.7
86.9
53.5
52.3
32.5
Maharashtra shows a lesser decline.
Karnataka is better only than Andhra Pradesh in
total and female literacy and far behind other
neighbours, especially Kerala.
r
L
Karnataka is better than country wide figures on
all counts.
How closely related are female literacy and an
adverse and worsening sex ratio as opposed to an
improving one is evident from the list below. Also,
the regional differences within Karnataka itself in
both these aspects is evident.
TABLE: 2 (Source 2)
DISTRICTS WITH WORSENING GENDER (SEX) RATIO AND FEMALE LITERACY LEVELS
Districts
Females per 1000 Males
1981
1991
Female Literacy Levels (%)
Rural
Urban
Bellary
Bidar
Bijapur
Culbarga
Raich ur
973
968
982
981
988
19.50
19.66
29.58
12.94
13.16
957
953
965
978
978
42.13
46.48
46.70
43.05
35.79
These districts are from Hyderabad-Karnataka area adjacent to Andhra Pradesh
TABLE: 3 (Source 2)
DISTRICTS WITH IMPROVING SEX RATIOS AND FEMALE LITERACY LEVELS (%)
Districts
Females per 1000 Males
1981
1991
Female Literacy Levels (%)
Rural
Urban
Chickmagalur
Kodagu
D. Kannada
Hassan
Shimoga
U. Kannada
953
933
1,059
987
947
958
40.39
49.98
55.45
33.83
37.16
42.27
977
969
1,063
1,000
961
967
62.13
67.05
68.84
65.62
61.26
63.42
j________
These districts belong to the Malnad area along the coast and Western Chats.
TABLE 4 (Source 3)
URBANISATION
Particulars
Ratio of urban (1991) population
to total (%)
Increase in% during 1981-1991
Population below poverty line
in 1987-88 to total (%)
% villages (1987-88) connected by
Fairweather Roads
India
Karnataka
A. P.
Kerala
Maharastra T. N.
25.70
36.20
30.90
29.10
26.80
42.60
26.40
60.90
38.70
38.70
34.20
19.30
29.90
32.10
31.70
17.00
29.20
32.80
40.70
32.90
43.00
100.00
52.90
63.20
Karnataka is less urbanised than Maharastra and
Tamil Nadu. The increase in the past decade is less
than all these except Tamil Nadu.
Karnataka is less well connected by fair weather
roads (only one-third), compared to all neighbours
and even by national standards.
Almost a third of the people of Karnataka live
below the poverty line, matched only by Tamil
Nadu.
Despitea slower rate of urbanisation overall, a few
centres in Karnataka are growing very rapidly. Medical
services tend to be concentrated in these areas.
40
i
TABLE: 5
POPULATION AND DECENNIAL GROWTH RATE
Place
Populations
(’000)
Decennial
Growth Rate
4,087
402
426
652
39.9%
33.7%
39.1%
36.2%
Bangalore
Belgaum
Mangalore
Mysore
TABLE: 6
VITAL STATISTICS AND TRENDS: SOURCE 4
Karnataka
India
Female
64.15
65.30
60.60
61.70
Rural
Urban
Combined
Rural
Urban
Combined
Rural
Urban
Combined
28.80
24.80
27.80
3.70
2.90
3.50
2.10
1.60
2.00
31.50
24.40
29.90
4.50
3.10
4.20
2.20
1.50
2.00
Rural
Urban
Combined
Rural
Urban
Combined
8.80
6.10
8.10
81.00
39.00
71.00
10.40
6.70
9.60
86.00
51.00
80.00
Neonatal
Postnatal
54.40
81.80
59.80
36.60
Particulars
1. Expectation of life at birth
(in years) 1991-96 projected
2. Fertility
a. Birthrates
b. Total Fertility Rates
c. Gross Reproduction Rate
3. Mortality
a. Death rate
b. Infant Mortality Rate
c. Neonatal and Postnatal
Mortality rates
Male
While there is a gradual declining trend in the Birth and Death rates in Karnataka between 1986 to 1989,
a comparison with similar figures of surrounding states is useful.
41
TABLE: 7 (SOURCE 5)
COMPARATIVE TABLE OF BIRTH RATES IN 1986 AND 1989
_________
Combined
Rural
Urban
Year
India
Karnataka
A. P.
Kerala
Maharashtra
T. N.
1986
1989
1986
1989
1986
1989
32.6
30.5
34.2
32.0
27.1
25.0
29.0
27.9
29.9
28.9
26.8
25.0
31.6
25.6
32.4
26.0
28.7
24.1
22.5
19.8
22.4
19.7
23.0
20.2
30.1
28.3
31.7
30.4
27.4
24.4
23.8
23.1
24.1
23.5
23.1
22.2
TABLE: 8 (SOURCE 5)
COMPARATIVE TABLE OF DEATH R
Year
Combined
Rural
Urban
1986
1989
1986
1989
1986
1989
India
Karnataka
11.1
10.2
12.2
,11.1
7.6
7.1
8.7
8.7
9.4
9.5
6.8
6.5
A. P.
Kerala
Maharashtra
T. N.
6.1
5.9
6.0
5.9
6.9
6.0
8.4
7.9
9.7
8.9
6.1
6.1
9.5
8.6
10.7
9.7
7.1
6.6
9.9
9.3
10.7
10.0
7.1
6.5
The death rates in Karnataka have not fallen either
...... iin |percentage or in comparison with our neighbours
or even national averages. The rural areas have a worsening situation.
TABLE: 9 (SOURCE 5) '
COMPARATIVE TABLE OF IMR'S (1989)
Particulars
Combined
Rural
Urban
India
Karnataka
A. P.
Kerala
Maharashtra
T.N
91
98
58
80
89
53
81
87
53
22
23
15
59
66
44
68
80
43
The Infant Mortality Rate in Karnataka is below national average and comparable to Andhra Pradesh
. The
rest of our neighbours have less infant mortality.
HEALTH MANPOWER WORKING IN RURAL AREAS OF KARNATAKA (31.12 1991)
MEDICAL SPECIALISTS
Sanctioned
Present
Surgeons
Obstetricians
Physicians
Pediatricians
42
66
45
70
33
59
37
68
27
Vacant
7
8
2
6
TOTAL SPECIALISTS (REQUIREMENT: 4 SPECIALISTS IN ONE CHC)
Requirements
Sanctioned
In position
Vacant
Karnataka
India
772
214
191
23
9188
3896
2450
1446
DOCTORS AT PHCS
Requirements
Sanctioned
In position
Karnataka
Kerala
T.N.
A. P.
Maharashtra
1312
1290
1104
908
1189
1189
1436
2728
2789
1283
1916
1555
1683
3257
2534
Karnataka is the only State which did not have the number of doctors required at the PHCs. All the other
neighbouring states had more than the required number (both sanctioned and in position).
HEALTH ASSISTANTS (MALE)
Requirements
Sanctioned
In Position
Karnataka
Kerala
T.N.
A. P.
Maharashtra
1312
862
689
908
1171
1039
1436
4418
4120
1283
1610
1610
1683
4055
3450
Karnataka did not have the required number of Health Assistants (Male). All the other neighbouring states
had more Health Assistants (Male), both sanctioned and in position.
HEALTH ASSISTANTS (FEMALE)
Requirements
Sanctioned
In position
Karnataka
Kerala
T.N.
A. P.
Maharashtra
1312
2091
1910
908
1094
1772
1436
2245
1947
1283
1872
1732
1683
4652
4156
Sanctioned posts of HA (F) in PHC not included.
All the states had more health assistants (female) compared to the calculated requirement. Maharashtra
had 250% of the requirements.
TABLE: 10 (Source 5)
NUMBER OF DOCTORS AND AVERAGE POPULATION SERVED (1990 )
DATE RELATES TO 31.12.1 990
Particulars
Karnataka
A. P.
Maharashtra
Tamil Nadu
Total Doctors
Pop. Served
31,028
1:1,457
33,283
1:1,924
62,770
1:1,179
48,291
1:1,165
43
tach of our doctors serves a larger population than in Maharashtra and Tamil Nadu and less than in
Andnra Pradesh.
TABLE: 11 (Source 5)
NUMBER OF HOSPITALS AND BEDS AS ON 01.01.1991 ACCORDING TO RURAL / URBAN AREAS
Particulars
Hospital
Rural
Urban
Total
Beds
Rural
Urban
Total
Karnataka
A. P.
Kerala
25
263
288
2,526
31,951
34,477
165
450
615
3,716
32,648
36,400
2,328
596
2,924
37,859
32,490
70,349
Maharashtra
345
1,759
2,104
12,120
99,300
1,11,420
T.N.
89
319
408
4,235
44,545
48,780
Karnataka has less number of hospitals, especially in the rural areas than any of its neighbouring states.
TABLE: 12 (SOURCE 5)
NUMBER OF DISPENSARIES AND BEDS ACCORDING TO RURAL / URBAN AS ON 01/01/1991
Particulars
Dispensaries
Beds
Rural
Urban
Total
Rural
Urban
Total
Karnataka
A. P.
Kerala
Maharashtra
T.N.
610
232
842
355
242
597
549
244
793
171
106
277
1,243
509
1,752
95
64
159
796
8,406
9,202
452
1,966
2,418
147
365
512
138
140
278
Karnataka’s rural areas are better served in terms of Dispensaries and beds than its neighbours Andhra Pradesh
and Tamil Nadu. We do not match with Kerala in terms of dispensaries, while Maharashtra is better with a
predominance of urban service.
TABLE: 13 (SOURCE 5)
NUMBER OF HOSPITALS AND BEDS ACCORDING TO OWNERSHIP AS ON 01.01.91
Particulars
Karnataka
A. P.
Kerala
Maharashtra
T.N.
209
28
51
288
26,424
714
7,339
34,477
345
4
256
615
25,251
46
11,103
36,400
137
0
2,787
2,924
26,474
0
43,875
70,349
693
92
37,781
1,11,420
282
0
119
408
37,935
479
10,366
48,780
Pop. Served
Per Hospital
1,57,000
95,416
10,269
35,184
1,36,159
Pop. Served
per Bed
1,311
1,612
427
664
1,139
Hospital
Government
Local
Pvt. & Vol.
Total
Beds
Government
Local
Pvt. & Vol.
Total
44
fa
I '
1,319
2,104
62,684
10,955
Karnataka has the least number of Govt. Hospitals
(except Kerala) among the southern states. The bed
strength is comparable to Kerala and Andhra Pradesh,
but less than Maharashtra and Tamil Nadu.
Local bodies running hospitals are few in the
southern states. There are more local hospital beds
in Karnataka than the neighbouring states of A. P.,
Kerala and T.N. Maharashtra is very much ahead.
strength makes the population per bed ratio better
than Andhra Pradesh.
Bed Capacity in taluks
(norm: 1679 persons per bed *)
Percentage of taluks satisfying the norm
. 1,679 persons per bed or better: 18%
1,700-5,000 persons per bed : 35%
5,000-10,000 persons per bed: 29%
In excess of 10,000 persons per bed: 18%
We have least number of Voluntary agencies and
Private Hospitals/beds compared to neighbouring
states. Both Kerala and Maharashtra are way ahead.
* Planning Commission had suggested a norm of 1
The Population served per hospital is the
maximum in Karnataka, while a higher bed
There is wide disparity between the various
taluks as regards the availability of inpatient beds.
bed per 1,000 population.
.ABLE: 14 (Source 5)
ESTABLISHMENT OF PHC’S, SUB-CENTRES AND COMMUNITY HEALTH CENTRES
PROGRESS BETWEEN 1985 TO 1990.
'
Type of Centre
As of
Karnataka
A. P.
Kerala
Maharashtra
T.N
Primary Health
Centres
Sub Centres
1.4.1985
1.4.1990
1.4.1985
1.4.1990
1.4.1985
1.4.1990
365
1,133
4,964
7,793
98
146
555
1,283
6,129
7,894
199
886
•2,270
5,094
4
54
1,539
1,646
6,391
9,248
147
283
436
1,386
5,860
8,681
30
72
Community Health
Centres
The progress is comparable to nieghbouring
states. Maharashtra remains ahead, with a better
coverage since the beginning of six year period.
Distribution of beds in Government Sector by
district shows wide variations.
27
46
Districts having poor ratio
Bangalore (Rural)
Belgaum
Bijapur
Raichur
Tumkur
2915
2226
2265
2552
2450
Districts having better off ratio with respect to
population per bed.
Bangalore (Urban)
Bellary
Chickmagalur
Chitradurga
Dakshina Kannada
Kodagu
Mysore
1015
1181
1100
1111
1142
330
935
Institutions for Primary Health Care
(as on 31 March 1994)
Primary Health Centres
Sub Centres
Primary Health Units
1253
7793
621
45
PRIMARY HEALTH CENTRE
3. COMMUNICABLE DISEASES
Communicable disease being a major cause of
morbidity and mortality, the ability of the medical/
health services to tackle these are important.
Among the vaccine preventable diseases under
the Universal Immunisation Programme, we have
the least problem of Measles and comparatively
better off than only Andhra Pradesh. Maharashtra is
worse off inmortalitydueto Diphtheriaand Neonatal
tetanus. Morbidity due to polio is more than in
Kerala and mortality more than in Kerala and Tamil
ladu.
In Respiratory infections, (ARI and Pneumonia),
we have less morbidity than Andhra Pradesh and
Kerala while mortality is less than in Kerala and
Tamil Nadu.
The morbid ity in tuberculosis is comparable to Tamil
Nadu and Maharashtra, though less tahn in A.P. The
mortality is less than in A.P. and Maharashtra.
Karnataka has the highest morbidity due to
guineaworm infection with Andhra Pradesh and Maha
rashtra reporting only a third of cases each and Kerala
and Tamil Nadu not reporting this problem at all.
Data from "SURVEY OF CAUSES OF DEATH
(Rural)"
The office of the Registrar General of India has
evolved a process of collecting reliable mortality data
from rural areas all over the country, started as the
"Model Registration Scheme" in the sixties and renamed
as "Survey of causes of death (rural), since 1982.
We have the highest morbidity due to Rabies, but
less mortality than in Andhra Pradesh and Maharashtra.
Karnataka has participated in this process since
1967, with the Bureau of Economic and Statistics as
the implementing agency. The Southern States have
provided more than 95% returns. Karnataka has
provided 100% reports from 52 sample PHC's out
of 1 133 (30.06.90) during 1990and 1991, reporting
872 and 916 deaths in these areas during 1 990 and
1991 respectively.
Among Sexually transmitted diseases like
Syphilis and Gonococcal infections, we have less
morbidity than only Andhra Pradesh. The mortality
is less than in Andhra Pradesh and Maharashtra.
Deaths being a definitive event vis-a-vis morbidity,
an analysis of these data and in comparison with our
neighbouring states will be revealing exercise to
understand the State's Health Profile.
In Gastro-intestinal infections (Enteric Fever &
Viral Hepatitis), we have least morbidity but greater
mortality than Tamil Nadu and Kerala.
46
*
I
TABLE : 15
REPORTED CASES AND DEATHS DUE TO COMMUNICABLE DISEASE DURING 1990
T.N
Karnataka 1993
Cases Death
Maharashtra
Cases
Death
Cases
Death
219
413
259
11
11
65
22
730
102
1
4
25
317
216
761
64
11
968
167
473
54
952
110
3,648
13,400
18,94,788
8,661
3
4
98
33
257
2,110
2,76,790
5,745
0
2,845
74
157 8,96,076
16,574
17
10
147
68
46
6,092
9
8,368
55
11,500
34
33,451
22
120
91
3
9,010
46,933
480
16
96
0
10,750
80
3,066
510
255
0
232
18
2,271
3
1424
0
2,629
34
5,597
58
20
59,939
2,16,192 1,250
1,986
49,288
0
236
1,753
79,363
36
905
75,796
649
6,352
43,786
9
537
A.P
Cases Death
Kerala
Cases
Death
Disease
Karnataka
Cases Death
Diphtheria
Polio
Tetanus
(Neonatal)
Tetanus
(Others)
Whooping
Cough
Measles
A.R.I
Pneumonia
Enteric
Fever
Viral
Hepatitis
Rabies
Syphilis
Gonococcal
Infection
Tuberculosis
460
204
393
7
8
54
1,515
1,987
814
24
23
61
66
68
41
4
1
8
499
104
1,081
123
37
3,906
2,230
4,23,803
4,369
1
3
186
59
11,966
6,377
8,64,618
20,923
17
36
253
105
8,062
15
48,019
2,441
1,345
7,439
89
40
2
15,433
680
20,465
8,085
79,459
6
821
311
0
9,818
3
54 1 ,63,400
7,359
253
6
I
TABLE: 16 (Source 6)
PERCENTAGE DISTRIBUTION OF DEATHS BY MAJOR GROUPS
Cause
India
Karnataka
A. P.
Kerala
Maharashtra
1. Senility
2. Coughs
3. Diseases of
circulatory system
4. Causes peculiar to
infancy
5. Accidents &
injures
6. Other clear
symptoms
7. Fevers
8. Digestive disorders
9. Disorder of CNS
10. Child birth
& Pregnancy
23.80
25.30
18.90
19.70
22.10
16.30
7.20
17.30
31.30
17.70
20.90
11.10
12.30
12.30
22.10
8.80
21.20
10.20
11.20
9.80
4.20
13.30
7.10
8.50
6.50
9.50
11.40
9.20
7.70
8.39
10.60
3.70
5.00
10.10
12.80
0.60
5.40
7.70
14.60
8.80
2.60
3.30
3.90
9.60
6.00
6.90
7.00
1.10
0.30
0.90
0.60
1.10
0.50
100.00
100.00
100.00
100.00
100.00
100.00
7.30
6.40
4.40
Deaths due to "Senility" where an individual is over
sixty years of age with no apparent sickness otherwise
account for a quarter of deaths in Karnataka, next only
to Maharashtra and above national figures.
4.90
6.40
9.20
T.N.
13.10
. "Other clear symptoms" are recorded less than
only Kerala.
"Fever" accounts for less deaths than in Andhra
Pradesh and Tamil Nadu.
The percentage of deaths due to "Cough" is
maximum in Karnataka, compared to other states
and national figures.
"Digestive disorders" are the least, except in
Maharashtra.
A less percentage of people d ie in Karnataka due
to circulatory diseases than in Kerala and Tamil
Nadu. It is equal to Andhra Pradesh percentages but
higher than national figures.
"Disorders of CNS" account for more deaths
than in Maharashtra and national average and less
than other neighbours.
'Causes peculiar to infancy' account for more
deaths than Karnataka's neighbours and Indian
average except Maharashtra.
Deaths (Percentage) due to "Accidents and
injuries" are less in Karnataka.
48
"Child birth & pregnancy" account for the least
percentage of deaths.
An analysis of the classification of the causes
of death from the above listing makes clear the
reasons for mortality, as in the next table.
TABLE: 17 a (Source 6)
PERCENTAGE DISTRIBUTION OF DEATHS UNDER THE CAUSE GROUP OF "COUGHS" (1991)
Cause
1. Asthma & Bronchitis
2. T. B. of lungs
3. Pneumonia
4. Whooping Cough
5. Not classifiable
India
Karnataka
A. P.
Kerala
Maharashtra
T.N
43.50
49.80
43.90
58.40
24.50
35.10
1.00
2.70
1.10
1.70
0.40
4.20
72.00
19.50
3.70
0.00
41.50
24.60
58.90
29.40
8.90
31.60
0.00
4.90
2.40
5.40
0.00
0.00
28.10
1.80
Asthma and Bronchitis take a high toll, less than only Kerala and comparable with Andhra Pradesh. All
southern states except Maharashtra show a higher percentage than national figures.
Death due to T. B of lungs is higher than national figures, though less than in Andhra Pradesh and Tamil
Nadu.
Pneumonia is more in Karnataka than in Andhra Pradesh, Kerala and Tamil Nadu; less than in
Maharashtra and much below national figures.
Whooping cough deaths still occur in Karnataka and Andhra Pradesh.
TABLE: 17 b (Source 6)
PERCENTAGE DISTRIBUTION OF DEATHS UNDER "DISEASES OF CIRCULATORY SYSTEM-1991
Cause
India
Karnataka
A. P.
Kerala
Maharashtra
T.N
1. Heart attacks
2. Anaemia
3. Other Heart Diseases
52.20
26.90
20.90
58.40
64.40
13.40
22.20
75.20
6.70
17.10
52.00
30.10
11.50
62.70
14.40
16.70
31.30
22.90
"Heart attacks ”1
take a big toll, though less than in Kerala, Andhra Pradesh and Tamil Nadu.
It is above
National and Maharashtra figures.
More people die of Anaemia by percentage, than in all the neighbours and even above national averages.
' Other Heart Diseases ' have a lesser percentage of toll.
TABLE: 18 (Source 6)
PERCENTAGE DISTRIBUTION OF INFANT DEATHS-1991
Causes
1. Causes peculiar to Infancy
2. Coughs
3. Fevers
4. Disgestive Diseases
5. Diseases of Circulatory Systems
6. Other Clear Symptoms
7. Disorder of CNS
8. Accidents & Injuries
India
Karnataka
A. P.
Maharashtra
T.N
68.00
76.90
6.00
6.70
100.00
0.00
0.00
0.00
0.00
0.00
0.00
0.00
80.60
85.80
6.30
15.00
5.40
3.50
3.00
2.40
1.60
1.10
3.00
2.20
2.20
0.70
2.20
14.90
0.30
0.90
0.30
0.00
2.00
0.80
1.10
1.60
1.60
1.60
1.60
0.00
49
TABLE: 19 (Source: 6)
PERCENTAGE DISTRIBUTION OF INFANT DEATHS-1991
Causes
1. Prematurity
2. Respiratory infection of new born
3. Diarrhoea of new born
4. Cord infection (including tetanus)
5. Congenital malformation
6. Birth injury
7. Not classifiable
India
Karnataka
A. P.
Maharashtra
T. Nl.
48.20
15.40
6.80
5.00
4.30
1.30
18.90
41.70
24.30
9.70
3.90
1.90
2.90
15.50
32.00
15.70
7.00
2.30
2.30
0.00
10.70
73.40
6.40
0.50
0.50
2.50
0.00
16.80
28.40
48.60
9.20
19.80
4.60
2.60
4.60
Prematurity and respiratory diseases of the newborn are thetwo largest contributions to death in infancy.
During infancy more children die in Karnataka due to "Prematurity" than in Tamil Nadu and Andhra
Pradesh. It is less than Maharashtra figures.
Respiratory infections take the next largest toll; it is less than in Tamil Nadu.
Diarrhoeas account for more deaths in comparison to all neighboursand all India figures. So does "Birth
injuries".
"Cord infection" in Karnataka is less than the Tamil Nadu figures.
Congenital malformation deaths are least in Karnataka.
TABLE: 20a
TRENDS IN MORBIDITY PATTERN, MAJOR CAUSES (GOVERNMENT HOSPITAL BASED)
Per thousand population
Out patient
Inpatient
1982
1992
1981
1992
1. Injury poisoning
2. Diseases of respiratory system
3. Infectious and Parasitic diseases
4. Diseases of blood & blood forming organs
5. Diseases of the digestive system
6. Diseases of the skin
7. Endocrine and metabolic disorders
32.83
27.30
26.73
12.57
7.99
6.70
5.24
'Injury and poisoning' is in the first place both
with respect to out patients and inpatients and the
increase over the decade is significant.
Diseases of the respiratory system requiring out
patient treatment are on the increase but they seem
to require less inpatient treatment.
There is a decrease in infectious and parasitic
diseases requiring out patient attention but there
50
44.92
33.64
24.16
14.77
11.32
13.27
6.30
1.93
1.53
1.37
0.40
0.62
0.06
0.28
2.83
1.23
2.35
0.51
0.49
0.22
0.48
was significant increase in hospital admission.
The number of patients with diseases of the
digestive system attending outpatients showed an
increase but the increased number did not appear to
need important care.
Endocrine and metabolic disorders showed
smaller increases.
TABLE: 20 b ( Source 6)
PERCENTAGE DISTRIBUTION OF DEATHS UNDER ” ACCIDENTS & INJURIES”
1.
2.
3.
4.
5.
6.
7.
8.
9.
10.
11.
12.
Causes
India
Vehicular Accidents
Suicides
Burns
Drowning
Snake bite
Natural Calamity
Fall from height
Homicide
Rabies
Scorpion bite
Excessive heat/cold
Not Classifiable
Karnataka
A.P.
Kerala
Maharashtra
T.N.
22.60
8.50
16.60
14.10
11.60
7.50
32.20
24.10
53.70
0.00
11.10
25.00
9.50
5.60
5.50
4.90
1.70
14.40
27.50
13.20
14.40
7.20
0.60
6.00
1.20
4.80
1.80
0.00
9.00
5.60
0.00
4.50
0.90
3.60
18.50
52.10
1.70
6.70
8.40
2.50
6.80
22.00
6.80
6.80
0.80
5.10
0.00
5.10
1.70
7.80
3.40
1.90
1.10
3.70
0.00
0.00
0.00
0.00
1.90
32.70
14.50
0.70
1.10
0.70
0.00
6.60
4.20
5.00
0.00
0.00
0.00
0.80
Karnataka has the least percentage of mortality compared to its neighbours of "vehicular accidents".
"Suicides" in Karnataka rank below Kerala and Tamil Nadu, though above national figures.
"Burns" account for least percentage of deaths in Karnataka in comparison to all states and national
figures.
"Snake bites" in Karnataka rank below Andhra Pradesh, Tamil Nadu and all India figures.
Deaths due to homicide rank above all the neighbouring states.
TABLE: 21 (Source 6)
PERCENTAGE DISTRIBUTION OF DEATHS UNDER OTHER CLEAR SYMPTOMS
Causes
1
3.
4.
5.
6.
7.
8.
9.
10.
11.
12.
13.
14.
Cancers
Jaundice
Cirrhosis & Chronic
liver diseases
Diabetes
Tetanus
Uraemia
Measles
Mental diseases
Hyperplasia of prostate
Leprosy
Poliomyelitis
Chickenpox
Obstructed hernia
Other medically
certified diseases
India
Karnataka
A.P.
Kerala
Maharashtra
T.N.
37.60
47.40
10.30
43.80
61.80
1.10
33.80
6.90
40.80
9.50
6.20
19.60
16.30
6.10
5.40
5.40
4.80
4.80
2.10
7.40
7.40
7.40
7.40
2.30
1.70
11.20
7.80
6.10
10.90
10.90
0.00
2.00
0.00
2.70
1.40
0.00
0.60
2.70
12.00
2.10
2.10
21.60
3.40
3.40
3.40
0.00
3.40
2.20
6.10
0.20
3.50
3.20
1.70
1.40
1.20
0.30
0.20
1.00
5.20
0.00
0.00
0.00
0.60
0.00
0.00
1.10
0.00
2.20
0.00
2.80
0.50
0.50
0.00
0.00
0.20
12.10
1.00
4.00
1.10
24.60
2.10
0.60
2.30
17.00
51
Death (Percentage) for
Cancers
Jaundice
Cirrhosis
Diabetes
Tetanus
Uraemia, Polio, Chicken
Pox, Obstructed hernia
Measles
Mental diseases
Prostate
Less than Kerala; more than others
Less than Andhra Pradesh, Tamil Nadu and India
Less than all except Tamil Nadu
Maximum in Karnataka
Less than India; more than others
Least in Karnataka
Less than India & Andhra Pradesh
Less than Kerala, Maharashtra & more than others
Less than India & Kerala figures
TABLE: 22 (Source 6)
PERCENTAGE DISTRIBUTION OF DEATHS DUE TO TEN SELECTED IMPORTANT DISEASES -1991
Causes
India
Karnataka
A.P.
Kerala
1. Bronchitis & Asthma
2. Heart attack
3. T B of Lungs
4. Prematurity
5. Pneumonia
6. Cancer
7. Anaemia
8. Paralysis
9. Vehicular Accidents
10. Gastroenteritis
8.20
5.80
11.60
7.20
12.40
16.70
5.30
5.80
8.10
7.90
7.10
4.90
4.60
4.70
1.70
5.00
3.10
0.30
4.40
4.40
4.40
0.50
0.90
6.10
6.10
1.40
1.30
3.10
3.00
3.00
1.90
1.90
Maharashtra
T.N.
7.40
7.70
13.30
3.40
0.80
0.60
4.60
4.30
9.80
5.60
11.60
13.70
13.70
2.70
1.30
3.00
2.10
2.10
2.30
0.60
4.60
2.00
0.70
3.90
5.70
5.70
1.40
0.90
3. NATIONAL HEALTH PROGRAMMES
1. NATIONAL LEPROSY ERADICATION PROGRAMME (NLEP)
Karnataka has a moderate presence of Leprosy as a health problem falling below 5 per 1000 population;
though pockets of Karnataka have a higher incidence.
To estimate the population at risk and compare with the surrounding states, the table below could help.
TABLE: 1 (Source 5)
Prevalence rate of leprosy per 1000 population
All India
Karnataka
Andhra Pradesh
Kerala
Maharashtra
Tamil Nadu
1981
1991
5.70
2.50
1.88
4.00
2.15
2.21
3.56
5.98
11.72
2.95
6.37
15.14
Leprosy being a social disease, many Voluntary agencies have been part of the effort in N.L.E.P. The
involvement of Voluntary agencies with support from Government has paid high dividends.
The progress under NLEP has been showing a good improvement in recent years.
52
TABLE: 2 (Source 7)
Year
New cases detected
1990- 91
1991- 92
1992- 93
1993- 94
Target
Achievement
%
18,000
22,000
25,000
20,000
25,668
25,796
19,065
26,465
142.6
117.2
76.3
132.3
No. of Cases Discarded as
Diseases Arrested/Cured
Target
Achievement
%
60,000
46,000
46,000
40,000
35,662
43,443
26,259
30,462
59.4
94.4
57.1
76.1
A doubt has been expressed whether, in the enthusiasm to report a higher percentage of patients in whom
the disease has been arrested / cured, there has been over-reporting and under treatment.
The physical components of the programme in comparison with surrounding states is listed below.
TABLE: 3
NLEP -ACHIEVEMENT OF PHYSICAL COMPONENT TILL MARCH 1990^
Particulars
India
Karnataka
Andhra Pradesh
Kerala
Maharashtra
Tamil Nadu
LCU
MLU
ULC
SET
tnw
. J
DLO
LTC
LRPU
SSAU
LCU/MLU
ULC
SET
THW
RSU
DLO
LTC
LRPU
SSAU
719
41
94
16
42
102
948
52
93
45
281
83
6097
673
164
254
970
24
291
22
53
5
23
52
75
6
14
2
11
9
244
20
31
7
24
20
45
5
7
1
7
6
13
2
1
1
2
1
39
3
3
3
1
5
Leprosy Control unit
Modified Leprosy Control Unit
Urban Leprosy Centre
Survey, Education, Treatment Centre
Temporary Hospital Ward
Reconstruction Surgery Unit
District Leprosy Officer
Leprosy Training Centre
Leprosy Rehabilitation Promotion Unit
Sample Survey and Assessment Unit
2. NATIONAL TUBERCULOSIS CONTROL PROGRAMME
National Tuberculosis Control Programme is implemented through 22 Tuberculosis centres providing
Institutional and domiciliary treatment. There are 10 Government T. B. Hospitals with a total bed strength of
3,545 for the treatment of complicated cases (1993-94).
TABLE: 4 (Source 7)
PROGRESS UNDER NTCP
Year
1990- 91
1991- 92
1992- 93
1993- 94
T. B. Cases detected
Target
Achievement %
85,000
83,000
85,200
88,080
77,437
75,740
68,109
67,790
91.1
91.3
79.9
77.0
Target
BCG Vaccination
Achievement
%
12,01,700
11,48,400
11,85,800
12,29,367
12,25,048
1 1,33,730
10,03,186
12,54,385
101.9
98.7
84.6
102.0
53
Karnataka has the National Tuberculosis Institute at Bangalore, whose initial surveys helped evolve the
National programme (See box for N.T.I)
A comparison of facilities for tackling tuberculosis among the Southern States is given below:
TABLE: 5 (Source 5)
Particulars
No. of
Di sts
T B Demo
Centres
Dist. T B
Centres
Total other
T B Clinics
No. of Beds
for T B
India
Karnataka
Andhra Pradesh
Kerala
Maharashtra
Tamil Nadu
443
20
23
14
30
21
16
1
1
1
1
1
378
20
23
10
28
16
338
6
26
9
19
40
46,984
3,545
2,559
2,283
8,207
3,630
PROGRAMME FOR CONTROL OF BLINDNESS
3. NATIONAL
Karnataka has the Regional Institute of Opthalmology located at Bangalore. Eye camps are periodically
conducted through 11 mobile ophthalmic units.
PROGRESS UNDER NATIONAL PROGRAMME FOR CONTROL OF BLINDNESS
Target
Achievement
Percentage
54,000
90,000
90,000
1,40,000
43,863
65,078
77,760
93,359
81.2
72.3
86.4
66.7
Year
1990- 91
1991-92
1992-93
1993- 94
Vitamin ’A' prophylaxis is implemented under the Nutrition programme
TABLE: 7
Target
First Dose
Achievement
%
2,000,000
3,000,000
2,725,000
1,909,054
2,023,847
2,264,462
95.5
67.5
83.0
Year
1990-91
1991- 92
1992-93
Target
Second Dose
Achievement
%
2,000,000
3,000,000
2,725,000
1,815,433
2,527,346
741,055
90.8
84.2
27.2
NATIONAL MALARIA ERADICATION PROGRAMME
This programme is implemented on a 50:50 sharing basis between the Centre and State on certain
components, in all districts as per modified plan of operation guidelines. The integrated vector control
4.
programme adds to the other remedial measures.
54
TABLE: 8 (Source 7)
PERFORMANCE UNDER NMEP
Year
Blood Smears
Collected
Examined
Total
+ve Cases
P. F.
Cases
Radical
Treatment
Given
ABER
SPR
API
1990
1991
1992
1993
6601484
6646213
6913592
7098519
6601484
6646213
70,012
44,565
81,057
1,96,466
23,209
10,135
16,826
49,246
71,9051
43,430
78,702
1,90,644
17.50
17:20
17.70
17.70
1.10
0.60
1.10
1.10
1.90
1.10
2.00
2.00
PF
ABER
SPR
API
Plasmodium Falcipuram
Annual Blood Examination Rate
Slide Positive Rate
Annual Parasite Index
An idea of trends between 1987 to 1990 in comparison to neighbouring states can be had from table
uelow:
TABLE: 9 (Source 5)
CASES/DEATHS
Particulars
India
Karnataka
A. Pradesh
Kerala
Maharashtra
Tamil Nadu
1987
1988
1989
1990
1,663,284/188
88,505/000
53,010/001
3,772/001
60,557/002
55,523/000
1,854,830/209
127,008/008
62,535/001
5,147/001
84,030/005
75,953/000
2,017,830/268
106,683/000
82,510/002
82,510/002
122,314/008
90,478/000
1,777,248/222
56,980/000
81,366/005
81,366/005
109,806/006
11 7,428/000
5. NATIONAL GOITRE CONTROL PROGRAMME
as Goitre endemic areas-Uttara Kannada, Kodagu,
Preliminary surveys show the following districts
c.
Dakshina Kannada and Chickmagalur.
TABLE: 9 (SOURCE: 7)
PROGRESS ACHIEVED
Year
1990-91
1991- 92
1992- 93
No. of persons
examined
No. of Goitre cases
detected
86,811
25,655
16,895
1,901
6,034
5,237
6. NATIONAL FILARIA CONTROL PROGRAMME
Filariasis is prevalent in the districts of Uttara Kannada, Dakshina Kannada, Gulbarga, B idar, Bijapur and
Raichur. Control measures are taken up through 6 Filaria control units and 16 Filaria night clinics in all
endemic areas.
55
7. GUINEA WORM ERADICATION PROGRAMME
The endemic districts are Bijapur, Raichur and Gulbarga where i ction is being taken for eradication.
TABLE: 10 (Source 7)
INCIDENCE OF GUINEA WORM DISEASE
Year
Cases
1990
1991
1992
634
226
167
8. DIARRHOEAL AND COMMUNICABLE DISEASES CONTROL PROGRAMME
TABLE: 11 (Source 7)
CASES/DEATHS
Disease
Gastroenteritis
Cholera
Viral Hepatitis
Japanese 'B' Encephalitis
Kyasanur Forest Disease
AIDS (HIV +ve/deaths)
1990
1991
1992
1993
8565/391
448/15
1807/30
138/47
1309/31
58/1
17455/691
747/15
659/17
302/114
967/16
86/1
14088/561
388/14
270/9
46/11
1183/11
168/1
36,206/855
424/13
287/67
699/3
868/9
There has been deterioration in the control of these communicable diseases.
=“°2sfor 5-7b863 cases and 343 dea,hs”93The total number of cases and deaths due to commnicable during 1993
were 83,16,349 and 8,946
respectively, far too high as most of them are preventable.
9. IMMUNISATION UNDER I.C.D.S PROGRAMME
TABLE 12 (Source 7)
PERCENTAGE A
Vaccine
B.C.G.
D.P.T
Oral Polio
Measles
Tetanus (Mother)
56
U
4---
1990-91
1991-92
1992-93
1993-94
64.9
70.4
70.5
70.5
51.6
45.7
71.2
67.3
67.6
57.4
58.5
50.6
44.7
63.8
63.9
45.7
40.9
47.2
63.6
65.6
ERADICATE POLIO
The World Health Day Slogan for 1995 is "Eradicate Polio", We are supposed to be on our way to
eradicate this disease, the second one after small pox.
What is the situation in Karnataka?
In Bijapur district alone, there were 230 paralytic polio cases during 1994! It is highest in the country.
There were a total of 648 cases in Karnataka. Other districts which showed large numbers are
Belgaum (125) and Dharwad (123).
The government is taking up a Supplementary Mass Immunization Programme in 11 districts.
FLUOROSIS
-
■
/T.:
V
■r-T
*J
t
-•nW
57
i
FLUOROSIS
Karnataka is affected by excess fluoride ( more than 1.5 ppm) in drinking water in 952 villages,
distributed in 17 districts. It is more in districts adjoining Andhra Pradesh and where there is less
rain.
Fluoride ingested with water is almost completely absorbed. It is retained mainly in the skeleton and
the teeth. Excess fluoride can cause mottling of enamel of teeth in children, osteosclerosis and
crippling skeleton fluorosis. When the level is very high other organs like thyroid and kidney may
be affected. Fluoride upto 1 mg/L may be beneficial in reducing dental caries.
Attempts at defluorination of drinking water have been partially successful. The Water Technology
Mission has a sub Mission on control of fluorosis, epidemiological surveys and taking preventive
measures.
Under the Sub Mission, a multidisciplinary trainers programme was held at Mysore during January
1994. These trained teachers were to conduct State Level Awareness camps.
HIV and AIDS
99. Cases were detected in Belgaum, Dharwad
and Bijapur.
Karnataka has its share of HIV infection and
AIDS. Between Jan. and Sept., 1993, of the 64000
blood samples from high risk groups, 700 had
tested HIV positive in the State. Bangalore Urban
and Rural districts alone accounted for 470
positive cases. Dakshina Kannada came next with
Sri B.S. Patil Sasnur, as reported in Indian Express,
Nov 19,1993.
The actual numbers for 1993 were 76,23 7 tested
among high risk groups; 868 were HIV +ve and 9
died from AIDS
1
HANDIGODU SYNDROME
Handigodu Syndrome is a permanently crippling disease which affects the spine, hipsand knee
joints. It was first reported from Handigodu village and is endemic in parts of Shimoga and
Chickmagalur districts, mainly among the low-income group agricultural labourers.
Handigodu Syndrome is a genetic disease, determined by a single gene. The disease affects
mostly the Chenangi and Chaluvadi communities (Adi Karnataka) of harijans.
The initial symptoms are pain in the lower back and hip regions. There is difficulty in running
and walking long distances. Flexion deformity is seen at the hips with compensatory lumbar
lardosis, stature is short, dwarfism may be seen in some. Deficiency of dietary calcium may be seen.
It may be a much as 700-900 mg per day. It is seen in all age groups.
Radiological changes are first seen around 8-10 years of age. The d isease progresses slowly over
several years.
A multicentric and multidisciplinary study (1992) was undertaken by the Indian Council of
Medical Research and the Government of Karnataka.
58
I
KYASANOOR FOREST DISEASE (KFD)
Seen in Shimoga and Dakshina Kannada districts. In common language, it is known as monkey
disease. It is due to a virus, transmitted through ticks from infected monkeys to children. It is
contracted while working barefoot in the forest by the bite of the tick. There is hemorrhage and fever.
No specific treatment has been found as yet. A vaccine has been developed. In 1993, there were
83 confirmed cases and 3 deaths.
taluks of 20 districts to cover 1% of the village
population in each taluk.
IODINE DEFICIENCY DISEASES
(Goitre prevalence in Karnataka-A base survey
(1988-91)-Bureau of nutrition, directorate of Health
& F. W. Services, Bangalore.)
Random sampling
1 % of the village population of all ages and 5%
of all categories of school, both boys and girls in
each taluk.
Village Survey
235 villages were randomly selected from 144
1,25,740 individuals :
56,731 males
69,009 females
School Survey
169 villages were random(y selected from 144
taluks of 20 districts to cover 5% of school children.
Pre-Primary to X standard (4-18 years)
No. of Children: 1,11,593
Boys = 65,427
Girls = 46,166
IODINE DEFICIENCY
(MENTALLY RETARDED)
g..
59
Enlargement of gland was present in
11,650 individuals out of 2,37,333 individuals
surveyed
3,997 males (1.68%)
7,652 females (3.22%)
Overall: 4.9%
4 districts had more than 10% of goitre
Chickmagalur
41.1%
Kodagu
23.18%
Dakshina Kannada
14.18%
Uttara Kannada
10.67%
In addition, thefollowing taluks had 10% or more:
Humnabad in Bidar Dt.
(9.87%)
Chincholi Gulbarga Dt.
(12.97%)
Hosnagar in Shimoga Dt.
(18.07%)
Sagar in Shimoga Dt.
(10.93%)
Soraba in Shimoga Dt.
(11.60%)
Thirthahalli in Shimoga Dt.
(12.22%)
In school children
Khanapur taluk in Belgaum Dt.
Aurad taluk in Bidar Dt.
Jewargi taluk in Gulbarga Dt.
Sakleshpur taluk in Hassan Dt.
:
:
27.88%
25.25%
Drugs play an important role in the management
of ill health. Essential drugs must be available at all
times. They must be affordable also.
Anti-T. B. drugs scarcity
The supply of anti-tuberculosis drugs is often
erratic posing a dangerous situation. The
nonavailability of the firstline drugs, namely
Rifampicin, Thiacetazone and Pyrazinamide under
District Tuberculosis Programme meant that even
sputum positive patients cannot be treated, Non
treatment of infectious patients (open cases of
tuberculosis) means spread of infection in the
community.
The prices of drugs in the open market have shot
up. They have become non-affordable to the large
majority of patients with tuberculosis.
The supply of anti-tuberculosis drugs is to be
shared between the centre and state; when there is
shortage, the blame is placed on each other.
15.0%
13.0%
12.1%
11.4%
Chickmagalur Dt.: Goitre prevalence taluks having
more than 10%
Koppa
26.91%
Mudigere
42.77%
Sringeri
57.61%
Kodagu Dt.
Madikeri
Somvarpet
SCARCITY OF ESSENTIAL DRUGS
The net result of non-availability and non
affordability of anti-T. B. drugs is manifold.
1.
2.
3.
More people die of tuberculosis
It induces drug resistance
Relapses are common
The situation is similar with many other diseases,
the essential drugs being not available.
CHINTAMANI EYE CAMP
The Division Mobile Opthalmic Unit, Bangalore Division, conducted an Eye Camp, organised
by the Lions Club of Chmtamani at Vasavi Kalyan Mandir, from 27 Jan, to 2 Feb. ’88. On 28 Jan
and next day 54 patients were operated upon.
Infection was noticed during the second dressings. Treatment was given after admitting the
patients into Minto Hospital, Bangalore. In ail 59 patients are affected. 17 patients lost their vision
in the operated eye.
Excerpts from the Report of the One Man Commission.
|
60
t
J
GOVERNMENT MEDICAL STORES
All drugs, accessories, instruments and
equipment required by the Government Health
Care Institutions (except the drugs against malaria,
leprosy and tuberculosis supplied by the Centre) are
procured and supplied by the Government Medical
stores. There are expert and high power committees
who decide what drugs to purchase and final ise the
rate contract.
The Government Medical Stores is under the
control of a Joint Director ( in the Directorate of
Health Services). There are two medical officers,
four graduate pharmacists and other staff (total: 130).
The budgetallocation for Drugs and chemicals is
totally inadequate considering the needs. It is
necessary to at least double the budget for drugs
immediately and thereafter increase the allocation
progressively.
There have been considerable complaints from
the public regarding the non-availability of drugs.
Often prescriptions are given for several essential
drugs. The poor do not have the purchasing power to
obtain the vital drugs. Complaints have also been
voiced by the Health care institutions regarding the
unsatisfactory supply of drugs, both with respect to
quantity and quality.
The preparation of the list of drugs and the
quantities needed leaves a lot to be desired. There
is need for a formulary of essential drugs for use at
✓arious levels (PHC, CHC, district and teaching
hospitals). The levels of supply of drugs (items and
quantities) and the budgets should be determined
and the purchases and supplies effected accordingly.
What are the essential drugs? Essential drugs are
those that satisfy the health care needs of the large
majority of the population. They should be available
at all atimes in dequate amounts and in appropriate
dosage forms. The choice of such drugs depends on
• pattern of prevalent diseases in the area
• treatment facilities
• training and expertise of the health personnel
• financial resources and
• genetic and environmental factors
It is understood that the Directorates of Health
and F. W. and Medical Education are in the process
of preparing essential drug I ists. The process must be
expedited to have an accepted formulary which can
then be updated annually. Hazardous drugs like
analgin should not find a place in the formulary.
The Government Medical Stores needs to follow
all principles of materials management to improve
efficiency and reduce wastage. Simple procedures
like ABC and VED classification, determining
maximum, minimum and re-order levels, procedures
for emergency purchases and physical verification of
stock must be followed. This would need training of
all persons concerned in the procurement and supply
of drugs.
Part of the purchases is made atthe District level.
There is need for proper systems of purchase, supply
and accounting at the district also.
The International Bill of Human Rights,
United Nations 1985
"Everyone has the right to a standard of living
adequate for the health and well-being of himself and
of his family, including food, clothing, housing and
medical care and necessary social services".
61
- Media
 CH-17.pdf
Position: 196 (107 views)