TB STUDY 'PATIENT'S PERSPECTIVES'
Item
- Title
- TB STUDY 'PATIENT'S PERSPECTIVES'
- extracted text
-
RF_DIS_5_A_SUDHA_PART_3
Tropical Medicine and International Health
if-JS'l
VOLUME 2. NO 8 PP 715-718 AUGUST 1997
Editorial: Tuberculosis control: did the programme fail or did
we fail the programme?
Introduction
Under pressure of the increasing numbers of tuberculosis
(TB) cases in the world, TB control has once again
become a major challenge. As such it is the subject of
intensive scientific activity, as evidenced by the numerous
studies and publications that have been devoted to it over
the last few years. The Lancet recently published two
documents which summarize present concerns: the
minutes of the conference organized in Washington DC
by The Lancet, in September 1995: ‘The challenge of
tuberculosis: statements on global control and
prevention’ (Enarson et al. 1995) and an article which
proposes substantial modifications of activities in the
standard tuberculosis control programme (De Cock &
Wilkinson 1995). From the most recent literature, two
major challenges may be identified (Reichman Sc
Hershfield 1993; Porter & McAdam 1994; De Cock <Sc
Wilkinson 1995; Enarson et al. 199^: On the one hand
there is a call for the development of new diagnostic
techniques, especially procedures that are faster and
more sensitive than smears or cultures and techniques
that would improve or facilitate the diagnosis of smear
negative TB; and a call for pew treatments that are
effective against multidrug-resistant TB and/or that
would shorten length of treatment. On the other hand,
the scientific community also acknowledges the
importance of some operational aspects of TB, such as
problems of drugs delivery and financing, and patient
compliance to treatment (Reichman & Hershfield 1993;
Porter Sc McAdam 1994; De Cock & Wilkinson 1995;
Enarson et al. 1995). This last point is considered a top
priority, and WHO is currently promoting DOT (Daily
Observed Therapy) as a new strategy to be implemented
by each TB control programme (Enarson et al. 1995).
However, other aspects linked to the organization
and the functioning of health services, or linked to the
perception of the illness by both health personnel and
patients, are underestimated. In his presidential address,
given at the 21st Andhra Pradesh TB and Chest Diseases
Conference held in July 1994 >n India, Dr Ranga Rao
71 S
© 1997 Blackwell Science Ltd
proposed a critical self-evaluation of the state TB
control programme which started more than three
decades ago (Rao 1994). This physician, who has been
working as a TB officer for more than 25 years,
identified 17 major weaknesses of the TB control
programme. His very impressive list begins with:
‘We failed in implementing the programme in the
health districts.
We failed in providing the services of all the trained
medical and paramedical key personnel continu
ously in some districts, due to frequent transfers or
otherwise.
We failed in improving the laboratory services in
the primary health centres.
We failed in seeking administrative support of the
competent authorities to run the programme ... etc.’
What is striking about this presidential address given by
a TB specialist to the members of a tuberculosis
association, is that most of the 17 weaknesses identified
are related to human or organizational failures and
some to lack of political will, but none are directly
attributed to a technical problem.
Whether in industrialised or in low-resource countries,
our experience points in the same direction: we failed in
implementing TB control programmes mainly for
operational reasons (human and/or organizational failures
linked to the overall functioning of health systems), nor
because of a problem of diagnostic tools or drug
resistance. These operational reasons are due to specific
challenges arising from the integration of a TB control
programme into general health services and from the
quality of the overall functioning of the health services.
An operational model for the analysis of TB control
programmes
Piot (1967), who at that time was attached to WHO’s
TB programme, put forward a model enabling a
Tropical Medicine and International Health
VOLUME 2 NO 8 PP 715-718 AUGUST 1997
B. Dujardin et al. Tuberculosis Control
In ideal circumstances, all new cases of TB consult
without delay, are suspected of suffering of TB and are
diagnosed promptly and accurately, receive a correct
At each step problems and difficulties arise: a suspect
individual is not identified, there is no reagent to carry
out the sputum smear, a positive sputum is missed by
the laboratory technician, drugs are out of stock, the
patient does not present ar the health centre regularly,
and so on ... The probability that a patient does proceed
from one step to the next is a measure of the
performance of different TB control activities.
Some steps are essentially technical (sensitivity of
diagnostic test, theoretical effectiveness of treatment)
and depend on the choice made at the central level by
the TB programme officers. Their probabilities are
theoretically independent of circumstances. Other steps’
probabilities are quite variable from one situation to
another because they depend in the first place on the
quality and performance of the health services where TB
control activities are integrated. These so called
‘operational steps’ depend on the operational quality of
the health services such as they are and include:
motivation, selection, examination, prescription,
treatment and regularity. To illustrate the importance of
the problems encountered in the field and the need of a
global approach, we briefly discuss two of these
operational steps, examination and regularity.
Examination is often the weakest link in the chain of
steps that should lead to the cure of TB patients. Many
types of problems are encountered in practice. First
there is the case of the doctor who failed to properly
explain the importance of this examination, and the
patient who thus is not inclined to queue up again at rhe
laboratory, especially if he needs to come back two
more rimes in order to complete the required series of
three sputum examinations and one more time to hear
the result (the whole process often takes more than a
week, several days at best (Aluoch et al. 1984). Secondly,
the laboratory technician does not adequately instruct
the patient on how to produce sputum or does not allow
him the necessary time; the collected specimen is saliva
instead of bronchial secretions. We have seen this
situation over and over again. Thirdly, the sputum
collection may be correct, but rhe smear not correctly
prepared: old slides are used (one of the sources of false
positives), the sputum is badly spread out, reagents are
treatment prescription, obtain the prescribed treatment
either past the expiry date or out of stock, procedure is
and take the full treatment regimen regularly to finally
be cured. This would lead to a 100% prompt cure rare
of new TB cases in the population and to a decrease in
rhe transmission of TB. Of course, real life is different.
not followed, the staining is done badly.
Lastly, an adequate sputum sample is correctly
prepared, but microscopic examination by the
laboratory technician is not reliable due to
comprehensive assessment of all the different technical
and operational aspects of a TB control programme. We
propose a simplified version of this model focusing on
the problems raised by the integration of the TB
programme into the general health services.
The model, which is conceptually simple, is based on
the passive detection strategy of smear-positive TB
cases. It starts from a description of the different steps
individuals in the community go through between
becoming ill with active TB and getting cured by the TB
control programme under consideration. The main steps
- the number of which may vary according to the
characteristics of the control programme - are
summarized below:
Step 1: Motivation:
Patients suffering from symptoms
related to TB contact a health care
delivery point.
Step 2: Selection:
The health professional suspects
TB and requests a sputum
examination (smear).
Step 3: Examination: The sputum test is correctly
carried out on the patients thus
selected.
Step 4: Sensitivity:
The smear is positive if the patient
has bacilli in the sputum.
Step 5: Prescription: The newly identified case of TB
receives the correct treatment
prescription.
Step 6: Treatment:
The TB patient obtains the
prescribed treatment.
Step 7: Regularity:
The TB patient takes his treatment
regularly as prescribed.
Step 8: Effectiveness: The patient is cured with a certain
probability if treatment is taken as
prescribed.
716
© 1997 Biackwell Science L'd
Tropical Medicine and International Health
B. Dujardin et al.
Tuberculosis Control
incompetence or lack of professional attitude. Another
explanation - our own experience in Latin America has to do with integration of TB programs. In their
willingness to detect as soon as possible all new TB
cases, TB officers tend to push health professionals to
identify more and more suspect patients (the sometimes
observed ‘rule’ that 1% of the new patients at the OPD
or curative clinic have to be selected for sputum
examination). As a consequence, too many ‘suspects’
may be referred to the laboratory, the workload
becomes too high, the health officer tends to select fewer
suspected patients and/or the laboratory technician does
not respect the prescribed duration of reading the slide
and the result is a false negative. This is an example
where maximization could be counterproductive.
The reliability of this step (quality of sputum
production and collection, quality of smear preparation,
quality of microscopic examination) thus appears to be
crucial, all the more so since it depends entirely on
factors within the health services, and especially since
high quality (in other words, a probability value close to
1.0) is technically and organizationally feasible. As a
matter of fact, operational research has shown that
decentralization of this step, and the reading of slides by
auxiliary personnel with only 6 weeks’ training (Toman
1979) and even less (2 weeks in one author’s field
experience - PM), could be done without any noticeable
loss of quality, but requires regular supervision. None of
these problems are identified or discussed in recent
literature. Knowing the present state of dilapidation of
many health services, regular surveillance of the
technical quality of this step is absolutely necessary in
order to avoid too many false positives as well as false
negatives.
Regularity or long-term compliance among TB
patients under treatment varies from one programme to
another. As for Step 1, Motivation^ this is highly
influenced by geographical accessibility, indirect costs,
quality of relationship between health professionals and
patients (Nagpaul et al. 1970), state of health of the
patient, defaulter retrieval procedures implemented by
the health services (Rao 1994), capacity of the service to
solve social problems, family problems and various
other kinds of problems that patients encounter
(Anastasio 1995). What is certain is that ensuring a TB
patient’s treatment regularity is difficult. In fact, we
know very little in this field; we do know many of the
factors that are associated with irregularity, but very
717
VOLUME 2 NO 8 PP 715-718 AUGUST 1997
© 1997 Blackwell Science Ltd
little research has been done to evaluate interventions
with a view to improve regularity. For certain authors,
admission of patients in the hospital would guarantee
better regularity, w’hereas it has been demonstrated that
in a functional health district the health centres can
ensure better regularity than can be obtained by
admission in the hospital (Kasongo Project Team 1981).
In Korea, experimental research showed a significant
increase of patients’ regularity from 65% to 79% when
central level supervision was organized in order to help
district health professionals to solve their operational
problems (Jin et al. 1993).
Direct Observed Therapy (DOT) is very fashionable
at the moment and sometimes presented as a panacea
(WHO 1995). This strategy guarantees of course a high
level of regularity, but also has a number of
disadvantages. It is costly in terms of human resources
and difficult to implement in sparsely populated regions.
The DOT strategy also presents another major problem:
the underlying assumption is that the patient is
incapable of understanding the importance of what he
or she is being asked to do: regular treatment for a
sufficiently long time. However, our experience does not
support this; if health professionals take the necessary
time to explain clearly what is at stake, and if they are
able to ensure an empathic follow-up of rhe patient, the
majority of TB patients can be regular (Kasongo Project
Team 1981; Grange & Festenstein 1993; Jin et al. 1993;
Anastasio 1995).
Conclusion
The use of an operational model like the one we have
proposed allows us to identify the problems that may
arise at different steps and can be used as a tool for
dialogue between specialists in charge of TB control and
public health professionals. This model also allows us to
improve the identification of research priorities,
especially in the field of operations research.
Of course, technical research on diagnostic tools (to
decrease the dependency on qualitative factors such as
staining, reading) and on treatment (to decrease the
dependency on regularity) may help control some of the
operational difficulties. However, new techniques will
more often simply displace the problem: if a one-day TB
treatment will solve the compliance failure, this
operational problem still remains a challenge with the
present ‘short course’ therapy.
Tropical Medicine and International Health
B. Dujardin et al.
Tuberculosis Control
To be effective, tuberculosis control needs to be
conceived in a comprehensive way, be it before or in the
HIV era. The different steps of a TB programme are
closely linked, and concentrating all resources on one
step, while neglecting the others, will not lead to
Anastasio CJ (1995) HIV and Tuberculosis: Noncompliance
Revisited. JANAC 6, n-zj.
De Cock KM &c Wilkinson D (1995) Tuberculosis control in
resource-poor countries: alternative approaches in the era of
HIV. Lancet 346, 675-677.
of new patients are not identified in a timely way. By the
Enarson DA, Grosser J, Mwinga A, Hershfield ES, Brien RO &L
Cole S (1995) The challenge of tuberculosis: statements on
global control and prevention (Lancet conference). Lancet
346, 809-819.
Grange JM
Festenstein F (1993) The human dimension of
tuberculosis control. Tubercle and Lung Disease 74, Z19—zn.
same token, the transmission of TB will not be reduced
Jin BW, Kim SC, Mori T & Shimao T (1993) The impact of
perceptible improvement. We will neither reduce human
suffering nor decrease TB transmission by curing a few
patients more with a novel treatment that is even better
than the existing ones if, at the same time, the majority
if we concentrate all resources on the DOT strategy
while failing to ensure correct selection and examination
of suspect cases, leading to false negatives who continue
to contaminate their environment.
There are no miracle solutions in TB control. We feel
that present approaches and research priorities are too
narrowly focused on technical aspects while ignoring
those that have to do with the overall functioning of
health services and integrating the TB programme into
the general health services. Furthermore, problems
related to the perception of TB by both health personnel
and patients are underestimated. The different elements
intensified supervisory activities on tuberculosis treatment.
Tubercle and Lung Disease 74,167-2.72..
Kasongo project team (1981) Le projet Kasongo: une experience
d’organisation d’un systeme de soins de sante primaires.
Annales de la Societe Beige de Medecine Tropicale 60,
S1-S54.
Nagpaul DR, Vishwanath MK &: Dwarakanath G (1970) A
socio-epidemiological study of out-patients attending a city
tuberculosis clinic in India to judge the place of specialized
centres in a tuberculosis control programme. Bulletin of
OMS 43,17-34.
Piot MA (1967) A simulation model for case finding and
treatment in tuberculosis control programme.
of an entire programme need to be improved together.
WHO/TB/Technical Information, WHO, Geneva, pp. 67-53.
An operational model like the one we propose will help
Porter JDH &C McAdam KPWJ (eds) (1994) Tuberculosis: back,
to the future. John Wiley, Chichester.
us to reach this comprehensive approach.
Bruno Dujardin, Guy Kegels, Anne Buve
and Pierre Mercenier
References
Aluoch JA, Swai OB, Edwards EA, Stott H, Darbyshire JH,
Fox W, et al. (1984) Study of case-finding for pulmonary
tuberculosis in outpatients complaining of a chronic cough at
a district hospital in Kenya. American Review of Respiratory
Disease 129, 915-910.
718
VOLUME 2. NO 8 PP 715-718 AUGUST 1997
© 1997 Blackwell Science Ltd
Rao IR (1994) On the national tuberculosis programme.
Bulletin of the National Tuberculosis Institute. Government
of India 30, 41-44.
Reichman LB, Hershfield ES (eds) (1993) Tuberculosis: a
comprehensive international approach. In Lung Biology in
Health and Disease (Ed. C Lenfant) Vol. 66, Dekker, New
York.
Toman K (1979) Tuberculosis case-finding and chemotherapy:
questions and ansivers. WHO, Geneva, pp. 14—21.
WHO (1995) Dangerous TB treatment practices threatening
lives of AIDS patient. Press Release WHO/70,12 September
-ST
t
1
BO'
I
H
to/- .
R
■
. Foreword
This report is the second in the Global
TB Programme's "DOI'S More Widely"
Research Series. The DOTS (Directly
Observed Treatment, Short-course)
strategy has been shown to transform
the outcomes of TB treatment from
cure rates of below 50% to over 80%.
Cure of infectious TB patients is cur
rently the best form of prevention.
Innovation and research to achieve
"DOTS More Widely" are among the
top priorities for efforts against TB.
This report, authored by Prof. Ravindra
Dholakia (Indian Institute of Manage
ment, Ahmedabad), was initiated and
edited by Dr. Joel Almeida of the
WHO's Global TB Programme. Peer
reviews were obtained from WHO, the
World Bank and other organizations.
-
■
o<
ffl
d
II
Table of Contents
'M.
1
Preface
3
Executive Summary
7
Potential Economic Benefits of DOTS (TB Cure) in India
7
I. Introduction
8
IL Steps followed for estimation
9
III. Estimates of population and work force, 1993-94
10 IV. Estimates of GDP and labour productivity, 1993-94
14 V. Deaths due to pulmonary TB in India
15 VI. The prevalence of pulmonary TB in India
18 VII. Estimates of workers with TB in India
19 VIII. Benefits of DOTS - Reduction in TB prevalence
21 IX. Benefits of DOTS - Reduction in TB deaths
25 X. The rate of discount and future benefits
32 XI. Saving of hospital beds due to DOTS
36 XII. Potential economic benefits of DOTS in India
38 XIII. Benefits of DOTS with gradual coverage of population
40 References
42 Appendices
43 Endnotes
44 List of Tables
45 List of Abbreviations
WWW
iii.-
Tuberculosis
destroys
people’s lives
and homes.
|
At-
' ASS’
■
■■
a-.-,
x
ry
••••
a
0
C
x
co
.
JT.TT fll
I
<
co
0
i
0
LU
I
R
Preface Tuberculosis (TB) kills several millions of people each year. Most
of these are in the wage-earning age group. The DOTS (Directly Observed Treatment,
Short-course) strategy reduces these deaths several-fold, and replaces ineffective
treatment with consistent cure.
This report asks a simple question: How much income would be gained by using
DOTS, instead of non-DOTS, against TB in India? The question addressed has a direct
bearing on the related question: How much investment and effort is worth devoting
to the DOTS strategy, to ensure successful TB control?
I
I
One approach, taken in this report, is to estimate the lower
(most conservative) bound on the magnitude of the tan
gible economic benefits from successful implementation
of the DOTS strategy. If successful DOIS in place of nonDOTS yields tangible economic benefits worth a given
present value, then DOTS deserves resources and efforts to
at least that value in order to ensure successful operations.
The main contribution of this report is to place a lower
bound on the magnitude of the tangible economic bene
fits to be gained from successful implementation of the
DOTS strategy against TB in India.
by discounting. All these benefits have been carefully
excluded from the present estimate, so as to avoid any
overstatement of the economic benefits of DOTS.
These excluded benefits (which might be captured in fur
ther studies which assess the Willingness to Pay) merely
underline the main message of the report: much depends
on the successful implementation of DOTS. Investing the
resources and effort required to ensure the success of DOTS
is the logical response.
DR. JOEL ALMEIDA
Reasonably careful efforts have been made to assess how
much of the lost income of TB patients could be salvaged
by successful DOTS in place of non-DOTS strategies. Being
a lower bound, the estimate of benefits carefully excludes
all benefits other than the proximate and tangible eco
nomic benefits from DOTS.
z
<
□
x
0
<
LU
I
X
O
£
V'.
ft ■
Bi
■
Research and Surveillance Unit
Global TB Programme
World Health Organisation
Geneva, Switzerland - January 1997
The anticipated financial cost per cure within DOTS pro
grammes in India may be noted. About 100 million US
dollars extra are being invested in DOTS for 30% of India,
in anticipation of producing about one million docu
mented cures of infectious TB during the next five years.
Should this extra investment prove sufficient to ensure the
success of DOTS, the cost per documented cure will have
been about USD 100 (at present, virtually no cures are doc
umented). Assuming that successful DOTS will be extended
throughout India to cure all the new cases arising each year
(roughly two million new cases per year) the incremental
cost of successful DOTS in India could turn out to be of the
order of 200 million US dollars per year. Within 15 to 20
years, the number of new cases is predicted to start declin
ing and the investments required for successful DOTS
should correspondingly decline.
It is also worth stating the obvious. Effective TB control
has benefits far beyond gains in income. Reduced suffering
and death are of the first importance, whether or not gains
in income follow. Multiple drug-resistant TB is a risk whose
upper limit can never be fully known, given the unpre
dictable nature and virulence of newly arising mutant
bacteria. DOTS is currently our best bet against multiple
drug-resistant TB. In the longer term, the transmission of
TB is expected to be reduced by effective DOTS: a delayed
benefit whose present economic value is greatly reduced
f- /
_______
IP
__
Ki
The tangible
economic benefits
of successful
DOTS are likely
to exceed the
financial costs by
several fold.
I \.'7 1
i
/ jk Jr
■
I
1
<
a
0
0
a:
kiE
cn
<
tn
0
o
LU
Executive Summary I. PulmonaryTB is among the top killer
diseases. According to the official statistics on the survey of causes of death in rural
India, the relative importance of pulmonary TB, even among the top killer diseases, has
been gradually rising in the country. About four million people in India are estimated
to suffer from pulmonary TB. It imposes a cost on the economy in terms of current
and future output loss because of premature deaths and ill health.
2. Currently, TB is treated with self-administered chemotherapy lasting 6 to 12 months.
Patients often discontinue treatment. This creates several problems such as low cure
rates, high relapse rates, high case fatality rates, drug resistance, etc.
L
The DOTS strategy (Directly Observed Treatment, Short
course) has been demonstrated to overcome most of the
short-comings of self-administered chemotherapy.
3. There arc several benefits from successful application of
the of the DOTS strategy. The constraining factors or the
impediments to the success of DOTS arc a sub-set of the
ones responsible lor the current situation with self-admin
istered chemotherapy. Therefore DOTS could well succeed
if sufficient effort and resources were invested.
z
0
<
</)
z
<
□
a:
0
I
<
ui
I
□
ft
O
£
4. In order to ensure that DO TS succeeds in India, several
aspects of implementation, organisation and manage
ment, need to be geared up. However, it is an important
first step to believe that all these efforts can be fruitful,
that they can yield good returns, that they are feasible and
that these efforts can contribute to the larger social goals
of alleviating poverty, raising the productivity of the
poorer sections, and improving the quality of life in the
society. Thus, we need to have some dimensional idea
about the lower bound of the economic benefits of suc
sectors are obtained.
Further, consistent estimates of average and marginal
labour productivity in the country arc derived, cross-clas
sified by age-sex-area and three broad sectoral categories of
the economy for the base year 1993-94. Aggregative macro
economic studies and estimates of productivity differen
tials are used to calculate the rural/urban incomes by
sectors, productivities of child workers vis-a-vis adult
workers, productivities of young adults (15-44 years)
vis-a-vis old adults (45+ years), productivities of male
and female workers in each category. These labour pro
ductivities are used to calculate the output gains predicted
when the DOTS strategy is successfully implemented. Al!
the calculations arc therefore made at 1993-94 prices to
account for future inflation and to express the estimates in
cessful DO TS in India.
real terms.
The main aim of this report is to estimate a lower bound
for the magnitude of potential tangible economi bene
fits of the DOTS strategy in India.
7. TB is largely a disease of adults. Within adults, it is
prevalent more among older adults than younger adults •
and more among males than females. Even the deaths due
to TB show a similar pattern. Estimates of labour produc
tivities are therefore needed to estimate the economic
benefits of DOTS. Workers with pulmonary TB among the
existing TB patients, and the future workers among the TB
deaths averted/averted by DOTS are also estimated by age
5. There are several potential benefits of successful DOTS
in Indi'a. They can be divided into two broad categories:
Pure social welfare increasing effects of DOTS which do not
generate direct tangible economic benefits. These would
include reduced suffering of TB patients, quicker and surer
cure from the disease, lives saved and disability reduced for
dependents and non-workers suffering from TB, poverty
alleviation (since TB hits wage-earning age groups), the
psychic benefits of living in a more healthy society, etc.
Direct tangible economic benefits of DO I S, which include
the following three types of benefits:
■ Reduction in the prevalence of TB due to DO' S
which improves the efficiency and productivty of
workers by reducing their forced absenteeism on
account of ill health;
■ TB deaths averted among current and future
workers, which adds to the productive capach.y of
the economy; and
■ Release of the hospital beds currently occupied by
the TB patients, since successful DOTS averts
hospitalization of patients.
£
I
6. We have estimated only the direct potential tangible
economic benefits of successful DOTS. In order to estimate
the economic benefits of DOTS, estimates of population
for the base year 1993-94 by age-scx-residence are derived
using the latest and most reliable figures available. Simi
larly, the estimates of workers by age-sex-residence and
sex and area.
The estimates of deaths averted and the reduction in
prevalence of TB on account of DOTS are estimated by
comparing the two scenarios "with DOIS" and without
DOTS" and considering the conservative estimates of
improvements likely to occur "with DOIS".
8. Since there are two alternative sets of estimates of
mortality due to TB in India, each having some followers/
users, two alternative sets of estimates have been gener
ated, of benefits due to deaths averted by DOTS. These
estimates are generated by using the marginal productiv
ity of labour and future workers among the deaths averted
by DOTS in each age-sex-area category. In order to gener
ate these estimates, the average age at death at present
within each age group by sex and area was considered, as
was the length of productive life for the future workers
among the deaths averted by DOTS.
The present discounted value of the contributions of the
future workers among the deaths averted in one year due
to DOTS, during the remaining part of their economically
active life, is considered as the economic benefits of deaths
averted by DOTS.
9. Similarly, the benefits of reduction in prevalence of
TB due to DOTS are estimated by using the available
information on the disability imposed by the disease on
workers. The improvement in the average productivity of
workers by age-sex and residence due to successful DOTS
is estimated.
10. Since benefits are also available in future from the
reduced prevalence and the deaths averted by DOTS, these
future benefits are estimated using alternative discount
rates.
I I. The alternative discount rates used are within the
broad range of 5% to 16% since the former represents an
estimate of the social time preference rate (STPR) and the
latter the social rate of return on capital (SRRC) in India.
The labour productivity in India is assumed to grow on
an average by 3(X) per annum, though the current trend
suggests 4% to 5% p.a. growth. Similarly, the TB deaths
and prevalence of TB in future "without DOTS" are
assumed to remain level. If they are taken to grow at the
annual rate of 1% to 2% per annum (to allow for popula
tion growth), the calculated figures remaining the same,
the implied discount rate would become higher by the
same number of percentage points.
12. Our estimates of the potential economic benefits of
DOTS in India at 1993-94 prices in terms of present value
are as shown (Rs. in billion) in the chart below:
13. The main implication of our finding is that DOTS is
potentially highly beneficial even at relatively high rates
of discount. With the most conservative set of estimates,
the potential economic benefits of DOTS to the Indian
economy are estimated at about 4% of GDP in real terms
or U.S. dollar 8.3 billion in 1993-94. This is the present
(1993-94) value of the entire future stream of benefits
from DOIS, not the annual benefit. So long as the Indian
economy spends a total sum whose present value is less
than this amount, the economy gets a return of more than
16% p.a. in real terms. Since the present value of all future
costs attributable to to DOTS is likely to be considerably
1
tr
U
O
a:
Discount Rates
Economic Benefit
5%
10%
16%
A) Reduction in Prevalence of TB due to DOTS
622
186
106
i) Set A
4035
703
259
ii) Set B
2469
422
152
26
13
8
A*
CQ
B) Deaths Averted due to DOTS
<
O
C) Release of Hospital Beds due to DOTS
LU
I
Total Benefits due to DOTS (P.V.)
i) With Set A (in Rs. billion)
(as % of GDP in 1993-94)
4683
(13%)
902
(5%)
373
(66%)
ii) With Set B (in Rs. billion)
(as% of GDP in 1993-94)
3117
(44%)
622
(9%)
266
(4%)
i) Set A
(as % of GDP)
234
(3.3%)
156
(2.2%)
90
(1.3%)
ii) Set B
(as % of GDP)
62
60
(0.8%)
43
(0.9%)
(0.6%)
Annualized Benefits due to DOTS
Note: Set A is based on Murray and Lopez (1996) TB Mortality rates. Set B is based on Survey of Causes of Death TB Mortality estimates.
in
*
less than 4% of GDI’, DOTS can effectively help step up
India’s future economic growth.
14. The estimates of potential economic benefits of DO I S
in India presented above are essentially based on twin
optimistic assumptions: a) DO I S can and will succeed in
■
10 years with effective coverage of 5%, 10%, 15%,
15%, 15%, 10%, 5%, 5%, 5%, and 5% in successive
years.
15. Our estimates of economic benefits of DOTS in Rs.
Billion at 1993-94 prices for all these five alternatives arc
presented in the chart below:
effectively tackling pulmonary TB in India; and b) DOTS
would effectively reach 100% ol TB patients with full and
instantaneous coverage. In order to be more realistic, we
may presume that DOIS will reach about 90% patients in
an area where the DO I S strategy is working. Special efforts
may he presumed necessary for the 10% ot patients who
are considered "hard to reach." Similarly, we need to con
sider some phasing in of DOTS implementation over a few
years largely because:
■ DOTS requires training of personnel;
■ organisational and management inputs require
some time;
■ drug supply systems take time to set up.
z
o
Five alternative phasing-in patterns arc considered in this
study. They are:
<
«/>
■
■
■
■
z
<
o
a:
O
Instantaneous "full" coverage (i.e., 90% covered);
5 years with 18% effective coverage every year;
10 years with 9% effective coverage every year;
15 years with 6% effective coverage every year;
16. Phasing in of DOTS (TB cure) over time reduces the
present value of the economic benefits. The longer the
time period for phasing in, the lower is the present
discounted value of the benefits. Similarly, the higher the
discount rate used, the lower is the present value of
benefit with a given pattern. Even with a linear phasing in
of the coverage over 10 years with a 16% discount rate,
the present discounted value of all the future economic
benefits of DOTS turns out to be about 2.1% of GDP (in
the year 1993-94). Thus, even if the Indian government
spends about USD 0.74 billion per year to ensure the suc
cess of the DOTS (TB cure) strategy (the present value of
which is about USD 4.6 billion or 2.1% of the GDP) the
investment would fetch a return of 16% p.a. in real terms.
(Projected incremental costs to the government for
successful DOTS implementation throughout India are of
the oner of USD 200 million per year, compared to the
tangible economic benefits of at least USD 750 million per
year - Editor's note).
Discount Rates
I
fl
<
Alternative Phasing Patterns for DOTS
LU
I
5%
10%
16%
1.
Instantaneous Coverage
2805
(39.7%)
559
(7.9%)
24
(3.4%)
2.
5 Year Linear Coverage
2697
(38.1%)
490
(6.9%)
191
(2.7%)
3.
10 Year Linear Coverage
2507
(.' 5.5%)
420
(5.9%)
147
(2.1%)
4.
15 Year Linear Coverage
2451
(34.7%)
363
(5.1%)
117
(1.7%)
5.
10 Year Non-Linear Coverage*
436
(6.2%)
156
(2.2%)
a
a:
O
■
2603
>36.8%)
★Effective coverage for successive years are 5%, 10%, 15%, 15%, 15%, 10%, 5 ■>, 5%, 5% and 5%.
Notes:
1. All these calculations are based on the assumption that there is a "hard to reach" 10% of patients in any area who require
special measures, and only 9()'M> are reachable by routine measures.
2. The benefits are based on the most conservative available estimates, fr m Survey of Causes of Deaths (1993).
3. Figures in parentheses are percentage of Gross Domestic Product in 19*3-94 at current prices.
4. The discounting of benefits is done by assuming real growth of 3% p.c in the labour productivity in the Indian economy over
time, and with no growth of TB patients in the "without DOTS" scena io. These are the most conservative assumptions.
Tuberculosis
%
is the leading
infectious killer
of adults.
n
J
hi
i
I
t
i.
■PT
2
X
<
' 3^
L* 1
cc
Lil-,
u
0
0£
co
fl
r
<
co
0
O
LU
I. Introduction Infectious TB is one of the most dreaded diseases. In
India, pulmonary TB is among the leading killers of adults.The mortality rate on account
of TB is so high as to imply that every minute, a death occurs due to TB in the country.
Moreover, the high prevalence of TB damages the national economy not only because of
deaths, but also because of prolonged illness. Regular and complete treatment is
required for cure. At least 75% of prevalent TB cases have been previously treated in
India through the traditional system in which regularity and continuity of the treatment
were not effectively monitored. Thus, they received palliation, not cure.
I■
I
This is thought to be the main reason why traditional
true benefits of DO TS. This is in the spirit of conservatism
approaches and strategies to deal with the problem of TB
often practised in the field of social cost benefit exercises.
in the country have failed. The DO IS strategy attempts to
In short, if the DOTS strategy is implemented on a
overcome this limitation. Indian pilot projects where the
national scale, there would be probably be substantial
DOTS strategy is rigorously applied have shown consis
economic benelits to the country. The main aim of this
tent, documented cure ol TB patients.
The advantages of the DOTS strategy over the tradi
report is to estimate a lower bound for the magnitude ol
tional I B treatment programmes include the following
strategy in India.
Based on the available secondary data — both in the
which arc relevant to our estimate (see Dalia, 1995 and
Ilf'l
National TB Control Programme, 1996).
.
.
■
DOTS cures the existing TB cases and produces a
r'
productivity and output in the national economy are
population.
The cure rate with successful DOTS can be taken as
attempted here.
85% as against 3()(X> with traditional treatment.
II. Steps followed for estimation
The relapse rate is only 1% to 2% with DOTS as
Z
o
<
>
<
□
hl ;
i! .
I
O
sources of data and information already collected for othe
2'K> as compared to about 20% with traditional
studies in the field. In order to estimate the potential
treatment.
Case fatality rates arc likely to drop from about 14%
DO TS. In lower income groups, to which most
Z
(X
The failure rales with DOTS are likely to be less than
economic benefits of DOTS in India, the following steps
arc needed:
with conventional treatment to less than 2'X> with
in
li
■ t may be noted that the present study is not based on
I any fresh primary survey. It is based on the secondary
therapy.
.
I
estimates of the potential gains in terms of employment,
quick reduction in the prevalence ol I B in the
compared to IS'X. to 2()'X> with the conventional
I
published and unpublished forms (including surveys
conducted by other organisations) — some preliminary
I
'I
potential tangible economic benelits from the DOIS
■
I
Indian households belong, the TB patient is otlen
in 1993-94 bv agc-scx-rcsidencc. The most comprehen
the sole wage-earner.
sive single source is used for estimating both these, in the
DOTS averts or shortens major illness from TB, and
absence of alternative data sources. The sectoral classifi
hence could release in future the 4% to 5'X> ol
cation of the work force into the standard primary,
hospital beds currently occupied by TB patients
(World Bank, 1995). As far as other costs go, it is
<
i. I stimalc the population and total work force in India
secondary and tertiary sectors of the economy is also
obtained using the same source.
UJ
most unlikely that the remaining costs "without
I
DOTS" would exceed the total costs "with DOTS".
ii. I slimalc the gross domestic product (GDI’) for 1993-94
Q
We have therefore ignored here any other cost
.it current puces b\ rural-urban residence and sectoral
saving "with DOTS" oxer "without DOTS".
classilkation. Moreover, the average labour productivity
a:
O
Aller 15 years or so, the annual incidence of I B is also
likely to fall and hence the deaths averted by DOTS would
co
by sex and age within the rural-urban classification is
obtained, by sectors.
further increase. However:
in
I stimalc Ihe total deaths due to TH in India in the
■
the rate of decline in the annual incidence is not
base \ car which is taken to be the year 1993-94. There is
more than one estimate of the number of deaths due to
■
\ery predictable;
the actual further gain is only marginal (because
most of the deaths from TB arc already averted even
due to TB in India in excess of 0.75 million. Survey of
without a fall in incidence);
the benefits lie at least 15 years or more in future
Causes of Death for 1993 implies TB deaths number 0.45
(which implies a relatively low present value).
I B deaths by five age groups among males and females.
■
I B in India. Murray and Lopez (1996) estimate the deaths
million. These two alternative sets of estimates provide
Considering all these, we have preferred Io ignore the tall
in annual incidence rale in future (.liter 15 years) on
i\. Istimalc the prevalence (i.c., stock) ol pulmonary IB
account of DOTS while estimating the economic benelits
in the population by agc-scx-rcsidencc. Here again there
of DOTS. To the extent the annual incidence declines in
arc several alternative estimates, though many experts
future, our estimates represents an underestimate ol the
use the parameters from the 1955-58 1CMR survey, with
some modifications. About four alternative sets of esti
mates of the prevalence rates of TB by age-sex-residence
have recently been made for India or some Indian states.
v. Estimate the total existing TB patients in iOOd-^H by
age-sex-residence from the alternative sets of estimates of
the TB patients in the country. Also, estimate the number
of workers with TB in the base year by age-sex-residence.
vi. DOIS would substantially reduce the number ol
deaths from pulmonary I B atid also the prc\alcnce ot I B.
Deaths averted among workers lead to a stream of future
direct output contribution. Similarly, reduced prevalence
of pulmonary TB by DOTS leads to gains in output on
account of decreased disability of patients with respect to
their economic activity. These latter estimates are based
on the productivity differential between workers with TB
and other workers.
vii. I he benefits accruing in the future are brought to the
base year 199?,-94 by discounting them at the appropri
ate rate. Since the benefits are largely in the form of the
wastage averted and increased consumption in future by
the cured persons and their dependents, the social time
preference rate (S Tl’R) for India is considered the best rate
of discount to use. In order to take policy decisions, it is
relevant to consider some alternative rates of discount.
The World Bank as also many other donors/ investors use
discount rates varying from 9% to 15% in real terms. We
can, therefore, consider some plausible alternative rates
of discount.
viii. Einally, an estimate is made of the saving of hospital
beds, currently used by the TB patients, from using DO IS.
All these benefits are aggregated to arrive at the estimate
of potential economic benefits of DOTS (TB cure) in India
with the base year of 1993-94. In the following sections,
these steps are discussed and the estimates derived. In
the final analysis, we have alternative estimates of the
potential economic benefits of DOTS in India using dif
fering estimates of the deaths due to TB and various
discount rates.
111. Estimates of population and
work force 1993-94
I n order to estimate any economic benefits of a TB cure
I strategy such as DOTS, it is necessary to have a consis
tent classification of the population by age-sex-residence.
The 1991 census estimates with these disaggregations are
not yet available in India. The only reliable and compre
hensive source of information on this pivotal variable is
the latest National Sample Survey. These are available at
the required level of disaggregation for the year July 1990
to June 1991 (see, NSSO, 1994). from this source, the age
distribution by sex and rural-urban residence for 1993-94
is assumed to be valid for the extrapolated population by
sex and rural-urban residence obtained from the 1991 cen
sus of India. The age distribution of population by sex and
rural-urban residence for the year 1993-94 (mid-year esti
mate) is presented in Table 3.1.
The estimated distribution of the work force in India
by the primary, secondary and tertiary sectors of the econ
omy in 1993-94 is obtained from the NSSO, (1994) taken
TABLE 3.1
Projected population (in '()()()) as on 1st Oct. 1993 (i.e., 1993-94) in India
Rural Areas
Urban Areas
All Areas
Age I Sectors
Males
Females
Persons
Males
Females
Persons
Males
Females
Persons
0-4
41920
38081
80001
13581
12959
26540
55501
51040
106541
5 - 14
91818
76702
168520
28968
25641
54609
120786
102343
223129
15 - 44
143076
140559
283635
60193
53583
113776
203269
194142
397411
45-59
37740
38707
76447
13665
11097
24762
51405
49804
101209
60 +
21707
20434
42141
6438
6994
13432
28145
27428
55573
All Ages
336261
314483
650744
122845
110274
233119
459106
424757
883863
Source: See the text, Section III.
c
x
X
<
X
0
with the estimates of population presented in 'fable 3.1
here. Il is assumed that the sectoral distribution of work
ers by age-sex-residence available from the NSSO (1994) is
applicable to the estimates of the population in 1993-94.
fable 3.2 provides the estimates of the workers for three
broad sectors so obtained by sex and rural-urban residence
for broad age groups. The primary sector consists of agri
culture and allied activities, fishing, and forestry and
logging; the secondary sector includes mining and quar
rying, manufacturing, construction, and electricity, gas
and water supply; and the tertiary sector which is largely
a service sector includes the rest ol the economy.
I
IV. Estimates of GDP
and labour productivity, 1993-94
I
he latest data from the Central Statistical Organisalion (CSO) on National Accounts Statistics provides
estimates of income at current prices by sectors, for the
year 1993-94. This is currently the latest year for which
confirmed income estimates are officially available. I he
CSO (1994) also provides official estimates of the Net
Domestic Product (NDP) by sectors and rural-urban areas
at current prices, for the year 1980-81. 1 his is again the
latest year for which official estimates of NDP by ruralurban areas are available. It is possible to derive the
TABLE 3.2
Estimates of workers (in '000) in India in 1993-94 (1st Oct. 1993)
z
0
All Areas
Urban Areas
Rural Areas
Age I Sectors
Males
Females
Persons
Males
Females
Persons
Males
Females
Persons
P
8529
4322
12851
89
123
212
8618
4445
13063
S
407
400
807
533
375
908
940
775
1715
T
551
180
731
548
159
707
1099
339
1438
9487
4902
14389
1170
657
1827
10657
5559
16216
P
81231
53777
135008
3554
2557
6111
84785
56334
141119
S
166684
5416
22100
15549
3575
19124
32233
8991
41224
T
21880
4432
26312
25952
4778
30730
47832
9210
57042
119795
63625
183320
45055
10910
55965
164850
74535
239385
I’
26744
15713
42457
1 154
942
2096
27898
16655
44553
S
3451
1343
4794
4075
711
4786
7526
2054
9580
T
5953
1507
7460
7719
1337
9056
13672
2844
16516
36148
18563
54711
12948
2990
15938
49096
21553
70649
P
13502
3372
16874
818
175
993
14320
3547
17867
S
847
347
1 194
747
196
943
1594
543
2137
T
1389
225
1614
1320
350
1670
2709
575
3284
Sub Total
15738
3944
19682
2885
721
3606
18623
4665
23288
All Ages: P
130006
77184
207190
5615
3797
9412
135621
80981
216602
S
21389
7506
28895
20904
4857
25761
42293
12363
54656
T
29773
6344
36117
35539
6624
42163
65312
12968
78280
Grand Total
181168
91034
272202
62058
15278
77336
243226
106312
349538
5- 14:
<
IT)
z
<
o
cc
0
Sub Total
15-44:
I
<
UJ
I
Sub Total
45 - 59:
0
£
o
I-
II
I
i'
II'
Sub Total
60 +:
i
Source: See the text, Section III.
B
hih
£
sectoral average labour productivity by rural and urban
areas combining these estimates of income with the esti
mates of workers from the 1981 Census of India. We
assume that the urban-rural productivity differential
remains the same in 1993-94 as in 1980-81. Based on this
assumption, it is possible to calculate the sectoral average
productivities for the urban and the rural areas in 1993-94
consistent with the overall Gross Domestic Product esti
mates using the break up of the workers given in Table 3.2
(methodology in Appendix 1). The estimates of average
labour productivity and GDP at factor cost by rural-urban
areas for the year 1993-94, at'current prices, are provided
in Table 4.1.
In order to estimate the average productivity of the
child labour (age 5-14 years) and the adult labour (15+
years) within the urban and the rural areas, we assume
that the children's productivity is a third of the average
productivity of labour.
Considering the predominantly rural character of the
child labour in the primary and low productivity sectors,
this assumption seems to be in overall conformity with
the B.H. Dholakia study (1974, p.l25n) in which similar
weights were used based on information then available
regarding agricultural labour. Table 4.2 provides the esti
mates of average labour productivity for the child labour
and adult labour by sectors within the rural-urban areas
in India in 1993-94. (methodology in Appendix 2).
The labour productivity differential between the
young adults (15-44 years) and old adults (45+ years) is
obtained from the detailed tabulation of the 1971 Census
which provides age-sex distribution of degree holders and
technical personnel by salary ranges. Based on this data
source, it is estimated that the productivity differential
between old adults and young adults is 1.76. Using this
productivity differential, the average productivities for the
workers belonging to the age groups 15-44 years and 45+
TABLE 4.1
Estimates of labour productivities and GDP, at factor cost, at current prices by rural-urban areas in India,
1993-94.
1
Labour Productivity (in Rs.)
Sectors
Rural
Urban
All Areas
Rural
Urban
All Areas
Primary
9761.67
12884.43
9897.51
202252
12130
214382
Secondary
29115.87
44628.80
36427.11
84130
114966
199096
Tertiary
33244.49
41173.30
37514.95
120069
173598
293667
406451
300694
707145
Total
<
GDP at EC. (Rs. Crores)
tz
O
0
x
cn
<
Cfl
O
Source: See the text, Section IV.
0
u
I
TABLE 4.2
Estimates of labour productivity in 1993-94 at current prices of child and adult workers in India (in Rs.)
Rural Areas
Urban Areas
Child
Adult
All
Child
Adult
All
Sectors
Workers
Workers
Workers
Workers
Workers
Workers
Primary
3253.89
10192.01
9761.67
4294.81
13082.37
12884.43
Secondary
9705.29
29673.56
29115.87
14876.27
45715.80
44628.80
Tertiary
11081.50
33702.33
33244.49
13724.43
41641.42
41173.30
Source: See the text. Section IV
___ _________________ __
I
years for the three broad sectors are estimated and shown
in Table 4.3. (methodology in Appendix 3).
For each sector and age groups in the rural and urban
areas, the male-female productivities are estimated with
the help of the male-female productivity differential. The
1971 Census, providing the age-sex distribution of the
degree holders and technical personnel by the salary
ranges, is used to estimate the productivity differentials
between male workers and female workers within the age
groups 15-44 years and 45+ years to be respectively 1.28
and 1.41. Moreover, it is assumed that among the child
labour i.e., in the age group 5-14 years, there is no male
female productivity difference. Based on all these, the
male and female average productivities arc worked out in
TABLE 4.3
Estimates of labour productivity in 1993-94 at current prices of young and old adult workers in India (in Rs.)
Urban Areas
Rural Areas
All
Adults
Young
Old
Adults
Adults
All
Adults
Sectors
Adults
Old
Adults
Primary
8272.57
14559.72
10192.01
10422.72
18343.99
13082.37
Secondary
25536.14
44943.60
29673.56
38900.72
68465.26
45715.80
Tertiary
28205.47
49641.64
33702.33
34798.72
61245.75
41641.42
Young
Source: See the text, Section IV.
TABLE 4.4
</)
z
<
o
Estimates of labour productivity in 1993-94 at current prices of male and female workers by age and area
in India (in Rs.)
Rural Areas
a:
0
Sectors and Age Groups
z
Primary Sector
Urban Areas
Males
Females
Males
Females
5 - 14
3253.89
3253.89
4294.81
4294.81
15-44
9062.19
7079.84
11472.84
8963.15
o
45 +
16062.09
11391.55
20499.46
14538.63
t£.
Secondary Sector
5 - 14
9705.29
9705.29
14876.27
14876.27
15 - 44
26982.64
21080.19
40559.30
31686.95
45 +
48961.75
34724.65
71769.19
50900.14
5 - 14
11081.50
11081.50
13724.43
13724.43
15-44
29284.50
22878.51
36023.97
28143.72
45 +
52558.79
37275.74
64181.02
45518.46
<
LU
I
0
£
CM
Tertiary Sector
I
F,
i
F
Source: See the text, Section l\'.
Si.
each sector, age groups and rural-urban areas in 1993-94
and are presented in Table 4.4. (Appendix 4)
Using productivities as reported in the Table 4.4 along
with the estimates of workers given in Table 3.2, we can
generate the estimates of Gross Domestic Product at factor
cost at current prices in the year 1993-94 cross-classified by
the age-sex-sector and area. These estimates are reported in
Table 4.5. These estimates are consistent with the avail
able evidence at the macro level and are comparable with
the overall GDP estimates available from the CSO. Table
4.5 along with Table 3.2 is useful for calculating the
possible contributions of various age-sex-residence cate
gories of workers. The DOTS strategy to cure TB would
have a different extent of influence on different categories
TABLE 4.5
Estimates of GDP in India, 1993-94 (Rs. Crores) - classified by age, sex, sector and area
'
Rural Areas
Total of All Areas
Urban Areas
Male
Female
Persons
Male
Female
Persons
Male
Female
Persons
5 - 14
2775
1406
4182
38
53
91
2813
1459
4273
15 - 44
73613
38073
111686
4077
2292
6369
77691
40365
118056
45 - 59
42956
17900
61816
2366
1370
3845
45322
19269
65661
60 +
21687
3841
24568
1677
254
1822
23364
4096
26390
Suh Total
141032
61220
202252
8158
3969
12127
149190
65189 214379
Sector
Primary
2
Secondary
5 - 14
395
388
783
793
558
1351
1188
946
2134
15 - 44
45018
11417
56435
63066
11328
74394
108084
22745
130829
45-59
16897
4664
21546
29246
3619
32767
46143
8283
54313
60 +
4147
1205
5366
5361
998
6456
9508
2203
11823
Sub Total
66457
17674
84130
98466
16503 114968
164922
34176 199099
a.
U
0
a:
<
CO
0
Tertiary
5 - 14
611
199
810
752
218
970
1363
418
1780
15-44
64074
10140
74214
93489
13447
106937
157564
23587
181151
45-59
31288
5617
37033
49541
6086
55464
80830
11703
92497
60 +
7300
839
8012
8472
1593
10228
15772
2432
18240
5 - 14
3781
1994
5775
1583
829
2412
5364
2823
8187
15-44
182705
59630
242335
160633
27067 187700
343338
86697 430035
45-59
91141
28181
120395
81153
11074
92077
172294
39255 212471
60 +
33135
5885
37947
15510
2845
18506
48644
8730
Grand Total
310762
95689
406452
258879
41816 300694
569641
LU
Total Age Wise
Source: Tables 4.4 and 3.2.
.. ,
___
56452
137505 707146
I
TA B LE 5.1
Pulmonary I B importance in mortality in rural India
Rank of pulmonary
Year
% of Total Reported
Death due to
Pulmonary TB
1989
5.2%
4th
1990
5.0%
4th
1991
5.3%
3rd
1992
5.9%
2nd
1993
5.7%
2nd
TB Among the
Top Killers
Source: India: Vital Statistics Division: Survey of Causes of Death
(Rural) India: Annual Report 1993, Series 3, No.26; p.49.
of workers and hence these estimates provide the basis for
further estimates of benefits of DO TS in India.
z
0
<
tn
z
<
□
cc
O
z
<
ui
I
V. Deaths due to
pulmonaryTB in India
ulmonary TB is among the top killer diseases in the
I country. According to the official statistics on the sur
vey of causes of death in rural India, the relative importance
of pulmonary TB, even among the top killer diseases, is
gradually rising in the country. (See Table 5.1). In 1993, Pul
monary TB causing about 5.7 percent of the total reported
deaths in the country is the second most important cause
of death. It is generally stated and believed that TB is wide
spread and that it is almost equally prevalent across regions
in the country as per the one time survey carried out in
1955-58. The death pattern across the regions, however,
tells us a different story, particularly in the recent years. The
relative importance of TB in the five zones of the country,
in the two years 1992 and 1993, in the reported deaths in
the rural areas are given in Table 5.2. As it can be seen, in
all the five zones in the two years, TB is among the top five
killer diseases. However, in the eastern zone, its relative
importance is considerably lower as compared to the rest of
the zones. On the other hand, in the central and northern
zones, TB is considerably more important as a cause of
death. Thus, if mortality due to TB is considered an indi
cator, the disease is not necessarily prevalent equally among
different regions of the country. The two tables, however,
clearly reveal the magnitude of the problem of Pulmonary
TB in the country. In the rural areas it is responsible for five
to six percent of the total deaths.
The percentage distribution by age groups for males
and females of the reported deaths due to pulmonary TB
in rural India is also available (See Table 5.3). As it can t
seen from the table, TB deaths as a proportion of total
deaths occur relatively more among males than among
females. Similarly, the TB deaths are more common
among the adults than the children. Even within the adult
deaths, it is more common among older adults than
the younger adults. Assuming the same percentage distri
bution by age groups for the deaths due to TB among
urban males and females respectively it is possible to
derive the estimate of deaths due to TB in India by age
sex and residence. These estimates are reported in Table
5.4. According to this estimate, the TB deaths in the coun
try in 1993-94 were 0.452 million out of the total deaths
of 8.090 million, (i.e., about 5.6%). The age pattern of the
TB deaths also clearly brings out that children under 15
Q
a
O
$
TABLE 5.2
Pulmonary I B: Relative importance in mortality by regions in (rural) India, 1992 and 1993
1993
1992
% of Reported
Death
Rank Among
% of Reported
Death
Rank Among
Top Killers
Northern
6.6%
3rd
5.6%
3rd
Central
6.9%
3rd
7.4%
2nd
Western
5.3%
3rd
5.5%
3rd
Southern
5.4%
4th
5.3%
3rd
Eastern
4.0%
5th
4.0%
4th
All India
5.9%
2nd
5.7%
2nd
Region
I
■
II
I
I
Top Killers
Source: The same as Table 5.1; p.64.
fe ■
'W'
<1-
years account for only 3.8%, the young adults (15-44
years) account for 42% and old adults above the age of 45
years account for 54.1% of total TB deaths in the country.
The other set of estimates for TB deaths in India is
reported by Murray and Lopez (1996) in the context of
Global Health Statistics for the year 1990. Based on their
rates and our projected population in the year 1993-94,
the total TB deaths by sex and age groups are given in
Table 5.5. According to the Murray and Lopez (1996) esti
mates, the TB deaths in India in 1993-94 are 0.76 million
out of the total deaths of 8.090 million (i.e., 9.04%). The
age pattern of their estimate shows that children below 15
years of age account for 5.5%, young adults (15 to 44
years) account for 28.5%, and old adults above the age of
45 years account for 66% of the deaths due to TB in India.
Thus, the tw'o estimates of deaths due to TB in India do
differ considerably not only in the magnitude but also in
terms of the age patterns. However, according to both the
sets of estimates, it is clear that TB death is largely a phe
nomenon among adults and more so among the old
adults who are most likely to be productive and also sup
porting their respective families (World Bank, 1995, p.14).
TA B LE 5.3
Age-sex distribution of reported deaths due
to pulmonaryTB, rural India, 1993
Proportion of Deaths Due
to pulmonaryTB
Age Groups
Males
Females
1
0.79%
0.55%
1 -4
1.14%
0.91%
5 - 14
1.06%
4.01%
15 - 24
5.73%
10.56%
25 - 34
11.72%
17.67%
35-44
19.12%
23.86%
45 - 59
32.60%
21.86%
60 +
27.84%
20.58%
Total
100.00%
(6.96%)
100.00%
(4.13%)
Note: Figures in the parentheses are proportions of TH deaths to total
deaths in the respective category.
VI.The prevalence of
pulmonaryTB in India
<
(X
U
0
Source: The same as Table 5.1; pp.72-77.
U egarding the prevalence of diseases in the population,
Iw there have been very few comprehensive studies car
ried out in India. There have been several piecemeal and
district/city/town specific studies carried out on the sub
ject in recent years. The only reasonable comprehensive
study on the subject was carried out in India by the 1CMR
in 1955 to 1958. Prior to this data the First Five Year Plan
Z
Z
CE
in India (1952, p.502) estimated the economic loss of 900
to 1,000 million persons days on account of active TB
among 2.5 million persons in the country. The draft out
line of the First Five Year Plan (July 1951, p.198) estimated
that TB accounts for about 0.5 million deaths in the coun
try (as quoted by Visaria et al 1994). Thus, the prevalence
<
co
0
□
TABLE 5.4
UJ
I
Estimates of deaths due to TB in India by age-sex and residence, 1993-94 (in '000)
LH
Rural Areas
Age Groups
Urban Areas
Males
Females
Males
Females
Total Persons
0-4
4.5
1.9
1.1
0.4
7.9
5 - 14
2.5
5.3
0.6
1.1
9.5
15-44
85.6
68.8
21.2
14.6
190.2
45-59
76.3
28.8
18.9
6.1
130.1
60 +
65.1
27.2
16.2
5.8
114.3
Total TB Deaths
234
132
58
28
452
Total Deaths
3363
3208
835
684
8090
Source: Table 5.3 above and our estimates ofpopulation for 1993-94.
rate estimated by the Planning Commission was about
694 per 100,()()() population and death due to TB was esti
mated to be of the order of 1.39 per 1,000 population
which is about 20% of the prevalence of TB. It can be seen
from various surveys of the prevalence ol I B in the coun
try, that several experts in the field are of the opinion that
the ICMR National Sample Survey of 1955-58 remains
valid in terms of some epidemiological characteristics
regarding TB in the country. (See for instance, Chakraborty 1996, p.38; Murray and Lopez 1996, p.142;
Uplekar and Rangan 1995, A 71-72; ASCI 1996, p.5(); Datta
1995, p.l; etc.). The National Tuberculosis Institute Lon
gitudinal Surveys from 1961 to 1977 (Chakraborty 1996)
have shown that the proportion of outflow of cases on
account of death (20%) and cure (18%) is almost balanced
by the inflow of about 36% to 38% annually. The fre
quency of TB thus remains the same with about two-thirds
of it being the continuing or the left-over cases. It thus
represents a steady state. The same data sources suggest
Z
0
that about 10% of the crude mortality in the society is due
to TB which agrees with the Murray and Lopez (1996) esti
mate. However, the Sample Registration System (SRS) data
<
i/i
z
<
o
a:
0
I
estimates around 0.4 million annual deaths from TB in
India which is very close to the Survey of Causes of Death
estimates. (Sec Tables 5.4 and 5.5).
Regarding firm estimates of the prevalence of Pul
monary TB in India, there are a few recent estimates with
fairly detailed age-sex and sometimes urban-rural classifi
cation of the prevalence of TB. We have come across five
sets of such estimates. They are:
<
IF
LU
■
Murray and Lopez (1996) estimates for the year 1990,
I
■
National Family Health Survey (NITIS) 1992-93
Q
a:
0
$
TA B LE 5.5
Alternative estimates of deaths due to I B in India hy
age and sex, 1993-94 (in '000)
Age Groups
Males
Females
Persons
0-4
13.6
10.0
23.6
5 - 14
11.0
7.7
18.7
15-44
140.5
77.0
217.5
45 - 59
164.1
90.5
254.6
60 +
177.5
71.4
248.9
Total TB Deaths
506.7
256.6
763.3
Total Deaths
4198
3892
8090
Source: Murray ami Lopez. (1996), p. 142 Our esl 'unales of population
for 1993-94.
r
■
conducted by International Institute for Population
Sciences (UPS) (1995),
■ The Andhra Pradesh estimates made by Dr.Ramana
et al of Administrative Staff College of India (ASCI)
(1996),
■ The estimates obtained through a Household Survey
of Health Care Utilization conducted by Sundar
Ramamani at the National Council of Applied
Economic Research (NCAER) (1995), and
> Visaria et-al (1994) estimates based on analysis of
data from five states obtained from the National
Sample Survey 42nd Round for the year 1986-87.
We have considered the first three estimates for this study
because they have the fewest limitations. The NCAER
study (Sundar, 1995) considers a group of diseases which
includes Mumps, Measles, Chickenpox and TB, but inter
prets without justification the prevalence as if it were only
for TB (See p.17 and pp.54-55 of the Report). This makes
the estimates non-usable for our purposes. Visaria et
(1994) covered five states of Gujarat, Maharashtra, Tamil
Nadu, Uttar Pradesh and West Bengal accounting for
about 383 million or about 45% of India's population. The
survey in the chosen five states covered 11,378 rural
households and 7,912 urban households; and provided
information on 9,086 cases of illness treated in hospitals
during the preceding year of the survey and 18,954 cases
treated without hospital admission during the preceding
30 days of the survey. Out of all these cases, only 414 (or
4.6%) in hospital treatment and 360 (or 1.9%) in non-hospital treatment were the TB cases. Recall errors could not
be excluded.
Tables 6.1, 6.2, 6.3 and 6.4 presents estimates of the
prevalence rates by age, sex and rural-urban areas wher
ever available. Applying these rates to the common
population estimates by age-sex-residence for the year
1993-94 reported in Table 3.1 above, we get the corre
sponding estimates of the prevalence of TB (in terms c
number of patients) in India which is also reported in the
respective tables. From the tables, it is clear that although
there are some differences in the age distribution of the
TB cases across the studies, the overall extent of prevalence
is very close in three out of the four studies. The implied
prevalence of TB in India in 1993-94 according to the ASCI
(1996) study of Andhra Pradesh gives an estimate of 4.1
million, whereas NFHS implies an estimate of 4.0 million
and Murray and Lopez (1996) study implies an estimate
of 3.9 million of prevalence of TB in India. We take the
most conservative estimate1 of Murray and Lopez (1996)
out of the three sets of estimates. Moreover, since these
three sets of estimates are very close to each other, we esti
mate the rural-urban break up of the Murray and Lopez
TABLE 6.1
Prevalence of pulmonary TB in India 1993-94 - Murray and Lopez (1996) estimates
Prevalence Rate
(Per 100,000)
Age Groups
Prevalence (in ’000)
Males
Females
Males
Females
Persons
0-4
83
66
46.07
33.69
79.76
5 - 14
152
123
183.59
125.88
309.47
15 - 44
513
482
1042.77
935.76
1978.53
45 - 59
983
452
505.31
225.11
730.42
60 +
2247
672
632.42
184.32
816.74
All Ages
539
342
2410.16
1504.76
3914.92
Source: Murray and Lopez (1996) and Table 3.1.
TABLE 6.2
Prevalence of pulmonary TB in India 1993-94 - NFHS estimates
Prevalence Rate
(Per 100,000)
Age Groups
Prevalence (in ’000)
Males
Females
Males
Females
Persons
0-4
81
140
64.80
37.16
101.96
5- 14
117
181
197.17
98.84
296.01
15 - 59
617
368
2221.71
509.82
2731.53
X
E
<
IX
U
0
ex
0.
60 +
1771
1019
746.32
136.87
883.19
All Ages
512
344
3230.00
782.696
4012.69
co
<
co
o
Source: UPS (1995) p.202 and Table 3.1.
□
TABLE 6.3
LU
I
Prevalence of pulmonary I B in India 1993-94 - ASCI (1996) estimates
Prevalence Rate (per 100,000)
Rural Areas
Prevalence (in ’000)
Urban Areas
Rural Areas
Urban Areas
Total
Males
Females
Males
Females
Males
Females
Males
Females
Persons
0-4
15.2
13.6
12.2
11.1
6.37
5.18
1.66
1.44
14.65
5 - 14
28.0
28.9
20.7
21.7
25.71
22.17
6.00
5.56
59.44
15-44
617.8
45.7
470.3
233.1
883.92
64.24
283.09
124.90
1356.15
45-59
1846.8
1298.5
1301.3
616.9
696.98
502.61
177.82
68.46
1445.87
60 +
2918.2
2078.4
2683.0
211.5
633.45
424.70
172.73
14.79
1245.67
All Ages
714.7
532.3
498.6
301.7
2246.43
1018.90
641.30
215.15
4121.78
Age Groups
Sources: ASCI (1996) pp.58-59 and Table 3.1.
b-
I
(1996) estimates by age and sex using the proportions of
the number of I B cases implied by the ASCI (1996) esti
mates. I llis is partly because the Ni l IS estimates made by
the Ill’S (1995) do not have the necessary break up of the
rural-urban by sex and age group corresponding to Murray
and Lopez (1996). Thus, our estimates of the prevalence of
TB using both the Murray and Lopez (1996) estimates and
ASCI (1996) estimates are presented in Table 6.5.
VII. Estimates of workers
withTB in India
[ii aving estimated the prevalence of pulmonary TB in
India, the next step is to estimate the number of
workers actively engaged in the economically productive
activities among those patients. There are hardly any sur
veys with reasonably large samples providing useful
information on this aspect. A recent book, Uplekar
and Rangan (1996) provides some bi-variate tables on
z
o
occupational status, age, literacy, income groups, etc., of
TB patients in rural and urban areas of Pune district
of Maharashtra State. Their sample size, however, is very
limited —103 for rural areas and 196 for urban areas.
Moreover, bi-variate information is not very useful for our
purpose here. Similarly, the NCAER study (Sundar, 1995)
provides estimates of prevalence rate by broad occupations
and rural — urban residence of the household heads for
serious communicable diseases which include TB. It is also
not considered adequate for our purpose here. The study
by Nayyar et al (1989) which is an unpublished study
provides estimates of culture positive TB by sex, residence
and specific occupations based on the study of the Wardha
District in Maharashtra State. However, the occupational
classification does not match with our all-India sectoral
classifications for productivity calculations. It is, therefore,
difficult to use these estimates meaningfully. Moreover,
the sample size, concepts used and the methodology
are not readily available.
TABLE 6.4
Prevalence of pulmonary I B in India 1993-94 - I RC estimates (based on culture test)
<
</)
Prevalence Rate
(Per 100,000)
z
<
□
a:
0
Age Groups
I
<
LU
Prevalence (in ’000)
Males
Females
Males
Females
Total
10 - 24
226
124
334
164
498
25 -44 ,
1934
546
2236
601
2837
45 +
3613
867
2874
670
3544
5444
1435
6879
778
I
All Ages
a
Source: P.R. Narayanan (1996) and our estimates ofpopulation for 1993-94 by the corresponding age groups based on NSS 42nd Round.
or
0
£
00
TABLE 6.5
Prevalence of pulmonary I B in India by rural-urban residence, sex and age, 1993-94 (in '000)
■
I
Rural Areas
All Areas
Age Groups
Males
Females
Males
Females
Males
Females
0-4
36.55
26.36
9.52
7.33
46.07
33.69
5 - 14
148.85
100.64
34.74
25.24
183.59
125.88
15 - 44
789.82
3 1 7.82
252.95
617.94
1042.77
935.76
45 - 59
402.6
198.12
102.71
26.99
505.31
225.11
60 +
496.92
178.12
135.5
6.2
632.42
184.32
All Ages
1874.73
821.07
535.43
683.69
2410.16
1504.76
Source: Tables 6.1 and 6.3, see the text, Section VI.
....... ...
Urban Areas
j,
Nevertheless, the estimates from all the three studies indi
cate higher prevalence of TB among the workers than
among the total population. This is obvious, because TB is
more prevalent among males than females and among
adults than the children. When we consider the age struc
ture, sex and rural-urban residence of the TB patients,
however, we have no evidence to assume differential
prevalence of TB among workers and non-workers. Thus
we assume that within an age-sex-residence specific
category of population, pulmonary TB is equally preva
lent among workers and non-workers. In other words, we
can assume that for each of the age-sex-residence specific
category, the worker-population-ratio (WPR) for the pop
ulation and the TB patients is identical. Table 7.1 presents
the worker population ratio by age-sex and residence in
India for the base year 1993-94. We may, however, exclude
the category of child labourers from this because if a child
has pulmonary TB he is most unlikely to be employed
for long enough to be called a worker. Thus, among the
children aged 5-14 years, the WPR among the TB patients
is taken as zero. This makes our eventual estimate of the
benefits of DOTS even more conservative.
With these assumptions the workers among the TB
patients can be derived from the estimates of the preva
lence of TB presented in Table 6.5 above. The estimates of
workers with TB in the base year 1993-94 are presented in
Table 7.2.
VIII. Benefits of DOTS Reduction inTB prevalence
he Revised National TB Control Programme targets
the cure rate with DOTS to increase substantially
from the current level of about 25-30% to 85-90%. Thus,
the net improvement in the cure rate is likely to be of
the order of 55-65%. We may take 6O‘><> as the average
improvement in the cure rate when DOTS strategy is suc
cessfully implemented. TB kills and also disables. Workers
with TB are less productive over the year than the workers
without TB. It is estimated by Dr. Ramana of ASCI through
several case studies of the TB patients in Andhra Pradesh
“that even in urban areas one to two months time is taken
for the diagnosis of the disease from the day symptoms
start. In case of rural areas this could be as long as six
months to one year. Most of the patients stated that
they could not perform their routine work for a period of
cc
O
0
a.
TABLE 7. I
Estimates of worker population ratio in India, 1993-94
Rural Areas
Urban Areas
CD
Total of All Areas
Males
Females
Persons
Males
Females
Persons
Males
Females
Persons
0-4
85
11
96
44
3
47
129
14
143
15+
0.8477
0.4313
0.641
0.7583
0.204
0.4969
0.8223
0.3713
0.6015
45+
0.8728
0.3806
0.6273
0.7876
0.2051
0.5117
0.8513
0.3395
0.5992
60+
0.725
0.193
0.4671
0.4481
0.1031
0.2685
0.6617
0.1701
0.4191
Age Groups
z
z
<
<
TABLE 7.2
Estimates of workers with pulmonary TB in India, 1993-94 (in '000)
Urban Areas
Age Groups
Males
Females
Males
Females
15-44
661.3
143.865
189.337
125.818
45 - 59
385.613
95.016
97.325
7.271
60 +
360.276
34.379
60.721
0.639
Source: Tables 7.1 and 6.5.
0
LU
I
Source: Tables 3.1 and 3.2.
Rural Areas
CD
three months (urban) to six months (rural)." (Dr. G.N.V.
Ramana, personal communication). These estimates are
not likely to differ considerably across the country. Our
preliminary inquiry with some medical practitioners in
rural and urban Gujarat confirms this belief. Thus, one of
the major economic benefits of DOIS is through the
reduction of prevalence of TB among workers which averts
the loss in output. Workers with TB are unable to do their
routine economic activity for some part of the year. As per
Dr. Ramana's estimate, workers with TB lose about l/4th
of the year in the urban areas and almost half of the year
in the rural areas. Thus, on the whole, the workers with TB
have no more than 75% of the productivity of the other
workers in the urban areas, and 50% of the productivity of
the other workers in the rural areas. When the prevalence
of TB in the population and thereby among the workers
□
x
0
<
UJ
reduces, the overall average productivity of the working
force would increase. Since this is a purely short run phe
nomenon, the reduction in the disability induced forced
absenteeism does not require any further investment or
new capital equipment for its productive use. In fact, such
forced absenteeism involves underutilization and wastage
of the existing capital stock. Thus, the improvement in
production can be directly measured through increased
average productivity of labour. Symbolically, the method
ology can be presented as follows:
Let National Output = Z a, .Wj
(1)
Where a; and Wj represent respectively the average
productivity per worker and the total workers in i-th
category; and the subscript i denotes the age-sex-area
specific category. Moreover,
I
aiWi = biWTi + ciOWi
a
O
$
(2)
Where WTj and OWj denote the workers with TB and
other workers in the i-th category respectively; and bj and
Cj are their respective average productivities. Then,
(3)
Letoci = WTj/Wi (4)
bj<Cj for all i
Thus,
represents prevalence of TB among workers
in the i-th category. It can be seen from the above equa
tions (2) and (4) that
aj = (l-Sj«:i)Cj
(5)
Where sj is the proportion of the forced absenteeism
due to the disease in the i-th category. It can be seen
from equation (5) that other things being given, as DOTS
succeeds and
declines, a, tends to Cj.
In order to estimate the change in the average pro
ductivity, a, when
declines, we again use equation (2)
and introduce the change in <*j. Thus,
A aj = - bj A oc j + Cj A oc j; (A ocj being positive) = A «j (q - b,)
But bj = (1 -spCj by definition.
.-. 00 Aaj =
(sj Cj) = [(Sj Aocj)/(1 -sj ocj)]*aj
(6)
The estimates of Sj,
and a, are all derived above for
different age-sex-area categories. The A^j representing the
decline in the prevalence of TB among workers on account
of DO TS can be taken to be 60% (i.c., 0.60) as stated before.
Equation (6), thus, makes it possible to estimate the eco
nomic impact of DOTS on labour productivity. Table 8.1
presents our estimates of the possible increase in the aver
age productivity of labour in the Indian economy on
account of the DOTS strategy. By multiplying these aver
age productivity increases by the total number of workers
in respective age-sex-area categories, we can derive the
total increase in output on account of reduction in the
prevalence of TB due to DOTS. Table 8.2 presents these
estimates for the year 1993-94 at current prices.
It is important to recognise that these are the bene
fits of DOTS in terms of annual additions to the flow o'
national income during the year when DOTS succeeds in
TABLE 8.1
Increase in API. in India due to DOIS (In Rs.)
Rural Areas
Urban Areas
Sectors
Males
Females
Males
Females
15 - 44
25.32762
6.364698
22.49732
43.04052
45 - 59
81.12279
23.37125
70.79941
13.51884
60 +
146.2642
39.18964
170.6225
5.250896
Source: See the text, Section VIII.
y'
■
reducing the prevalence of TB. However, these additions
once achieved, would continue in future since the relapse
rate with DOTS is almost negligible. If the DOTS strategy
continues to be successfully implemented, the percentage
addition to the GDP of the country becomes permanent.
It almost amounts to shifting the time path of GDP
upwards by the same percentage. The present value of
these future additions at constant (1993-94) prices should
be considered as the benefits of DOTS through reduction
of the prevalence of TB in the country. This is because in
the scenario without DOTS, the prevalence of TB is likely
to be almost stagnant at the present level. Thus, between
the two scenarios "with DOTS" and "without DOTS", the
percentage increase in GDP due to reduction in the preva
lence of TB by DOTS is a permanent annual increase
ascribable to DOTS. The question of appropriate rate of dis
count to be used for the purpose of estimating the present
value of these additions to the national income will be
considered in the Section X below. We turn to the esti
mation of another important economic benefit of DOTS,
arising from deaths averted.
situation currently resembles a steady state (See Chakraborty, 1996, P.13), the case "without DOTS" would have
the same amount of deaths occurring every year. Sustained
successful implementation of DOTS would prevent these
additional deaths every year. Moreover, "with DOTS" the
prevalence of TB would be substantially reduced and
hence the minimum 2% case fatality would also reduce in
absolute number.
In order to estimate the economic benefits from the
deaths averted by DOTS, we have to estimate the future
workers among the deaths averted. These estimates have
to be carefully derived. There are no ready made surveys
or any empirical findings to go by. It all depends on
dynamics of worker participation rates by age and the age
pattern of the mortality due to other causes over a fairly
long time period. It is difficult to envisage the exact behav
iour of these two important parameters. However, the way
the Indian economy is shaping particularly with rapid eco
nomic reforms introduced in the system, it can be argued
that demand for labour is going to increase considerably
in future inducing the WPR to rise. The economy is all set
to achieve a fairly rapid growth in national income at
about 7’Xi p.a. Such a high rate of growth is known to put
excessive pressure on the labour market wherever it has
occurred. WPR across the age groups in such economies
has a tendency to rise. This is clearly borne out by the
experience of China, Malaysia, Singapore, Mauritius, etc.
On the other hand, age-specific mortality has a depressing
effect on the future workers out of the deaths averted by
DOTS. The net effect of both these factors would, thus, be
largely offsetting. We may, therefore, apply the existing
appropriate worker participation rates to the current
deaths averted in the particular age-sex-group.
In order to determine the appropriate worker popula
tion ratio to apply to the current deaths averted in a
particular age group, we need an estimate of the average
age of death due to TB in different age-sex groups. Here
IX. Benefits of DOTSReduction inTB deaths
s stated in Section I, the DOTS strategy is likely to
A^have a very substantial impact on deaths due to TB.
The targets of the Revised National TB Control Programme
in India (Datta 1995), state that the case fatality rate forTB
is expected to be reduced to less than 2% from the current
14%. As we have seen in Section V above, the estimates of
the current mortality from pulmonary TB are not con
firmed. The Survey of Causes of Death implies a mortality
due to TB around 0.45 million per year whereas Murray
and Lopez (1996) provide an estimate of around 0.76 mil
lion per year. DOTS can save the deaths which would occur
in the "without DOTS" case. Moreover, since the Indian
TABLE 8.2
Increase in GDP in India due to reduction in prevalence by DOI S in the first year (in Rs. Crores)
Rural Areas
Urban Areas
All Areas
Sectors
Male
Female
Male
Female
Male
Female
Persons
15-44
303
40
101
47
405
87
492
45-59
293
43
92
4
385
47
432
60 +
230
15
49
0.4
279
16
295
Total
827
99
242
51
1069
151
1220
Source: See the text, Section VIII.
RSiiWiWSSl
: A,;/,.
__ ___
z
z
<
cc
o
o
cn
w
m
<
cn
0
□
LU
I
TA B LE 9.1
Average age al death due to I B in India, 1993-94
Average Duration
(in years)
Average Age at Onset
(in years)
Average Age at Death
(in years)
Males
Females
Males
Females
Males
Females
0-4
3.0
3.0
2.0
2.4
5
5
5- 14
10.0
10.0
2.7
2.4
13
12
15-44
29.7
29.8
2.5
2.5
32
32
45
52.2
52.3
2.4
2.2
55
55
60 +
70.0
72.6
2.2
1.8
72
74
All Ages
43.0
37.0
2.4
2.3
45
39
Age Groups
59
Source: Murray and Lopez (1996), p. 142 and Section IX of the text.
TABLE 9.2
z
Worker population ratio for aggregative age groups by sex and area in India, 1993-94
0
I 5+ years
45+ years
60+ years
Males
0.8477
0.8728
0.7250
females
0.4313
0.3806
0.1930
Persons
0.6410
0.6273
0.4671
Males
0.7583
0.7876
0.4481
Females
0.2040
0.2051
Persons
0.4969
0.5117
0.2685
Males
0.8223
0.8513
0.6617
Females
0.3713
0.3395
0.1701
Persons
0.6015
0.5992
0.4191
Males
Females
Persons
0-4
13
9
22
5-14
7
5
12
15-44
120
58
178
45-59
s
I... .......
154
86
240
60+
165
68
233
Total
459
226
685
Isi
H
Sex and Area
<
(/)
Rural
Z
<
u
a:
O
Urban
I
<
UJ
I
Total
Q
a:
O
£
0.1031
Source: Table S.2.
TA B LE 9.3
Deaths averted by DO IS in India, 1993-94 - set A (in '000)
Age Groups
Source: Set A is based on Murray and Lopez (1996) estimates of deaths due to TB and our estimates (See Section IX of the text).
-------------------------------------------------------------------------------------------------------------------------------------------r
'■......................................................................................................... ..............................................................................................................
UH
so
again, Murray and Lopez (1996) provide estimates of the
average age of the onset of the disease and average dura
tion by each of the age-sex group. We may assume that
the summation of the two is a reasonably close approxi
mation2 of the average age of death due to TB for our
purposes to determine:
■ the appropriate WPR to be used; and
■ the duration of economically active life of the
worker whose life is saved by DOTS in the current
year.
We further assume that the worker on an average works up
to the age of 65 years. Similarly, we assume that the earli
est he/she starts working is 15 years. Table 9.1 provides
these estimates for India.
The estimates given in Table 9.1 are for the population
— i.e., for workers and non-workers. In order to obtain the
future workers from the deaths averted due to DOTS, we
need to apply the average WPR which would cover the rel
evant age groups and the working life. Table 9.2 provides
the estimates for the WPR for these three aggregative age
groups by sex in India for the years 1993-94.
At this stage, it is important to note that we have two
distinct sets of estimates of deaths due to TB in India with
the same population base of 1993-94. We, therefore, pre
pare two alternative sets of the estimates of benefits due to
deaths averted by DOTS. We call them:
1. Set A based on Murray and Lopez (1996) estimates
of deaths due to TB; and
2. Set B based on SCD (survey of Causes of Death)
estimates of deaths due to TB in 1993-94.
These two sets of estimates of deaths averted by DOTS are
presented in Tables 9.3 and 9.4. By applying the WPR's
given in Table 9.2 to the estimates of deaths averted by
DOTS (given in Tables 9.3 and 9.4) we can generate the
two alternative sets of the future workers among those
whose lives are saved. These estimates are presented in
Tables 9.5 and 9.6.
The marginal productivity of labour is the most
appropriate concept to determine the contribution of
additional workers in the long run in the economy. The
contribution of the additional work force in terms of
additional potential output is ideally measured through
the marginal value product of labour (Solow, 1958).
The marginal productivity of labour is the most
appropriate concept to determine the contribution of
additional workers to the economy in the long run. This
is very well recognised (see for instance, Dornbusch and
Fischer, 1994). When a worker dies, he/she gets substituted
by some other person from the labour market. Therefore,
when the death of a worker is averted, additional employ-
..
ment is generated in the economy to the same extent. This
follows from our basic assumption of the economy in the
macroeconomic dynamic long-run equilibrium where the
natural rate of unemployment (or long-run or structural
unemployment rate) remains constant. The steady state
growth of output is then determined by the growth of
labour supply as per the widely used neo-classical growth
model developed by Solow (1958) which is also exten
sively used for empirical investigations. Accordingly, the
contribution of the additional work force in terms of addi
tional potential output is ideally measured through the
marginal value product of labour.
A recent study on the growth accounting by Dr. B.H.
Dholakia (1995) estimates the relative share of labour for
the entire economy for the period 1991 to 1994. Its aver
age value is estimated to be 0.5842 which is also the
estimate for the labour elasticity of output in the long run.
The labour elasticity of output is defined to be the ratio of
the marginal product of labour and the average product of
labour. Assuming that the labour elasticity of output
remains the same for different age-sex-area categories of
workers, it is possible for us to estimate the marginal
productivity of labour for different categories of workers in
India. These estimates are presented in Table 9.7. It may
be noted here that these represent the estimates of the
contribution of additional workers on an average in the
respective categories in one year. When the death is
averted, the person contributes for several years in future.
The average life expectancy is going to increase well
beyond 65 years in India for both males and females.
Thus, the present discounted value of the contribu
tions of the future workers among the deaths averted in
one year due to DOTS for the remaining part of their eco
nomically active life needs to be considered as the
economic benefits of deaths averted by DOTS. Once the
appropriate discount rate is chosen, we can generate these
estimates.
It may also be noted that if DOTS continues to be suc
cessfully implemented, it will save the deaths at the same
rate per annum in future also as compared to the "without
DOTS" scenario. The contribution to the GDP of the addi
tional work force arising out of the deaths averted in
future would also have to be considered for estimating
the benefits of DOTS. As noted in the beginning of this
section, in the "with DOTS" scenario there would be an
increasing number of deaths averted in future. These
future benefits will however have to be discounted at the
appropriate discount rate. We turn to this question in the
next section.
■
LU
Z
z
<
a:
U
0
or
Cfl
<
co
0
□
LU
I
CH
te.
TABLE 9.4
Deaths averted by DOIS in India, 1993-94 - set B (in '()()())
All Areas
Urban Areas
Rural Areas
Males
Females
Persons
Males
Females
Persons
Males
Females
Persons
0-4
3.7
1.6
5.3
0.9
0.3
1.2
4.6
1.9
6.5
5 - 14
2.1
4.4
6.5
0.5
0.9
1.4
2.6
5.3
7.9
15-44
70.8
56.9
127.8
17.5
12.1
29.6
88.4
69.0
157.4
45 - 59
63.1
23.8
87.0
15.6
5.0
20.7
78.8
28.9
107.6
60 +
53.9
22.5
76.4
13.4
4.8
18.2
67.3
27.3
94.6
Total
193.6
109.2
302.8
48.0
23.2
71.2
241.6
132.4
374.0
Age Groups
Source: Set II is lMse</ OH Survey of Causes of Death 1993-94 estimates of deaths due to T3 and our estimates (See Section IX of the text).
TABLE 9.5
z
Future workers among the deaths averted by DOIS in India, 1993-94 - set A (in '000)
0
Males
Females
Persons
0-4
10
3
14
5 - 14
6
2
8
15-44
98
22
120
45 - 59
131
29
160
60 +
109
12
121
Total
355
68
423
Age Groups
<
z
<
V
0
z
<
LU
I
Source: Tables 9.2 aud 9.3.
Q
a:
O
TABLE 9.6
£
Future workers among the deaths averted by DOTS in India, 1995-94 - set B (in '000)
All Areas
Urban Areas
Rural Areas
Males
Females
Persons
Males
Female .>
Persons
Males
Females
Persons
0-4
3.2
0.7
3.8
0.7
0.1
0.8
3.8
0.7
4.6
5 - 14
1.8
1.9
3.6
0.4
0.2
0.6
2.1
2.1
4.2
15 - 44
60.0
24.6
84.6
13.3
2.5
15.8
73.3
27.0
100.4
45 - 59
55.1
9.1
64.2
12.3
1.0
13.3
67.4
10.1
77.5
60 +
39.1
4.3
43.4
6.0
0.5
6.5
45.1
4.8
49.9
Total
159.1
40.5
199.6
32.7
4.2
36.9
191.8
44.8
236.6
Age Groups
Source: Tables 9.2 and 9.4.
..... ..■.-..JM.JI——
J.kL
X.The rate of discount
and future benefits
I
he benefits in future need to be discounted to bring
them to the base year. Since the benefits of DOTS
over the existing standard chemotherapy to cure TB in
India are largely in terms of deaths averted and increased
efficiency of work force due to reduction in the prevalence
of TB, the rate of interest at which the future benefits
should be discounted must be the consumption rate of
interest. It is also called the social time preference rate
(STPR). It shows the extra amount of future consumption
which the society considers necessary in order to forego a
unit of present consumption without becoming worse-off
or better-off. Thus, if the society sacrifices one unit of con
sumption today, it needs (1 + STPR) units of consumption
in future to yield the same amount of welfare. Fellner
(1967) has provided a framework to estimate STPR for any
economy. Tiwari and Pandey (1993) made an attempt to
estimate the S TPR for India by estimating the fundamen
tal relationships suggested by Fellner (1967). Dholakia and
Oza (1996) have considered their estimates removing cer
tain flaws in the estimation procedure. The estimate of the
STPR for the Indian economy turns out to be around 5%.
On the other side, the labour productivity in Indian
economy is likely to be growing almost at 3-5% p.a. This
is because the real GDP in India is expected to grow at the
rate of about 5-7% p.a. at least during the 9th Plan period
and in future too according to the revised Perspective Plan
targets. The population (and working force) is growing at
the rate of 2% p.a. at present and is most likely to show a
decline in the annual growth rate in near future. Hence
the working force may grow at around 2% p.a. in India in
future. Thus, the labour productivity growing at 3-5% p.a.
is a reasonable assumption. When the real income addi
tions in future are growing at 3-5% p.a. considering only
the effect of labour productivity growth, the rate of dis
count has to be reduced by 3-5% to get the effective rate
of discount. If STPR is estimated to be 5% in India, and if
labour productivity in India is likely to grow at 3-5% p.a.,
the effective discount rate in this case would turn out to
be zero to 2%.
However, the World Bank, Asian Development Bank
and several other financial institutions, donors and
investors expect a much higher rate of return on the
investments. For international investors, it is the return
on capital that matters. These institutions, therefore, often
evaluate projects at the discount rates (in real terms) of
between 9% to 15%. Given that the labour productivity
in the country is likely to grow in real terms at 3% to 5%
in future, we may also, therefore, consider the range of
effective discount rates of 4% to 12%. We have, therefore,
considered five effective rates of discounts, viz. 2%,
4%, 7%, 10% and 13%.' We present our estimates by
the category-wise disaggregation for both the types of
benefits of DOTS viz. deaths averted and reduction in
prevalence of TB.
It is important to recognise that we should carefully
avoid double counting of benefits. For instance, let us con
sider that the prevalence of TB is 100 during the given year
without DOTS. About 14 will die during the year and
about 20 to 25 will be cured during the year. On the other
hand, about 35 to 37 will be the new cases of TB added
during the year. Thus, the situation is more or less repeti
tive every year "without DOTS". The situation changes
considerably with successful implementation of DOTS.
Only 2% out of the prevalence will die during the year
and the cure rate will be 85 to 90%. As a conservative esti
mate, we have taken the improvement due to DOTS in the
cure rate to be 60% of prevalence. Now the deaths averted
by DO FS are largely included in those who are additionally
cured during the year. While calculating the economic
benefits of DOTS, we have to be careful in avoiding this
double counting. We have assumed that the patients who
would have died "without DOTS" remained patients
LU
Z
z
<
cr
O
0
a:
m
<
CO
0
0
LU
I
LA
CM
TABLE 9.7
;
Estimates of marginal product of labour by age-sex-residence in India, 1993-94 at current prices (in Rupees)
Rural Areas
Urban Areas
All Areas
Age Groups
Males
Females
Persons
Males
Females
Persons
Males
Females
Persons
15 +
10446
6355
90796
24687
16377
23078
14174
7809
12250
45 +
13993
8842
12434
35666
21913
33055
19060
10692
16725
60 +
12300
8717
11263
31407
23054
29981
15260
10933
14162
Source: Tables 4.5 and 9.2 above.
‘" T '
\
_
TABLE
I 0. I
Discounted present value of gains out of deaths averted in the first year due to DOIS - set A* (in Rs. Crores)
D) Discount Rate of 13%
A) Discount Rate of 5%
Age
Male
Female
Persons
Age
Male
Female
Persons
0-4
380.8922
69.35341
450.2456
0-4
56.48156
10.28424
66.7658
5 - 14
257.7056
44.28677
301.9924
5 - 14
69.91482
11.14094
81.05576
15-44
3344.215
405.8955
3750.1 1 1
15 - 44
1334.056
161.9176
1495.973
45 - 59
2244.916
280.3681
2525.284
45 - 59
1535.648
191.7874
1727.435
60 +
323.2578
24.43525
347.693
60 +
288.9441
21.84146
310.7856
Total
6550.986
824.3391
7375.325
Total
3285.044
396.9717
3682.016
E) Discount Rate of 16%
B) Discount Rate of 7%
z
Age
Male
Female
Persons
Age
Male
Female
Persons
0-4
214.4337
39.0444
253.4781
0-4
33.40784
6.082948
39.49079
5 - 14
169.465
28.56254
198.0275
5 - 14
51.28617
7.955592
59.24176
15 - 44
2529.93
307.0638
2836.994
15 - 44
1053.371
127.8502
1181.221
45 - 59
2027.062
253.1603
2280.222
45-59
1356.106
169.3645
1525.471
60 +
314.0176
23.73678
337.7543
60 +
277.7227
20.99322
298.7159
Total
5254.908
651.5678
5906.476
Total
2771.894
332.2464
3104.14
0
<
I/)
Z
<
o
(X
0
<
★Set A is based on the Murray and Lopez (1996) estimates of TB
death rates.
C) Discount Rate of 10%
LU
Age
Male
Female
Persons
0-4
103.6603
18.87463
122.535
a:
O
5 - 14
102.8496
16.84878
1 19.6984
£
15 - 44
1777.988
215.7988
1993.787
45 - 59
1755.326
219.2231
1974.549
60 +
301.0147
22.75388
323.7685
Total
4040.839
493.4991
4534.338
I
Source: See the text, Sections IX and X. We have assumed the growth
of labour productivity to be only 3% and not 5% for being conserva
tive. If we consider higher labour productivity growth or growth in the
number of TB deaths "without DOTS", the discount rates have to be
accordingly increased with the calculated numbers remaining the
same.
TABLE 10.2
Discounted present value of gains out of deaths averted in the second and subsequent years due to DOTS - set A*
(in Rs. Crores)
A) Discount Rate of 5%
D) Discount Rate of I 3%
Age
Male
Female
Persons
Age
Male
Female
Persons
0-4
19553.31
3560.139
23113.45
0-4
537.7277
97.90593
635.6336
5- 14
16751.35
2859.618
19610.97
5 - 14
842.8161
133.4115
976.2276
15-44
182512.4
*24044.33
206556.7
15 - 44
13502.36
1778.812
15281.17
45-59
114738.1
14211.25
128949.3
45 - 59
14555.82
1802.857
16358.67
60 +
16636.05
1240.213
17876.26
60 +
2757.735
205.5884
2963.324
Total
350191.1
45915.55
396106.7
Total
32196.45
4018.574
36215.03
B) Discount Rate of 7%
E) Discount Rate of I 6%
Age
Male
Female
Persons
Age
Male
Female
Persons
0-4
5398.19
982.8669
6381.057
0-4
238.1634
43.36323
281.5266
5 - 14
5401.856
904.4149
6306.27
5 - 14
462.9507
71.33702
534.2877
15-44
67708.54
8919.979
76628.52
15 - 44
7983.397
1051.739
9035.136
45 - 59
50805.57
6292.685
57098.25
45-59
9625.196
1192.159
10817.36
60 +
7924.868
590.7966
8515.664
60 +
1984.819
147.9677
2132.787
Total
137239
17690.74
154929.8
Total
20294.53
2506.567
22801.09
*Set A is based on the Murray and Lopez (1996) estimates of TB
death rates.
C) Discount Rate of 10%
Age
Male
Female
Persons
0-4
1449.37
263.8918
1713.262
5 - 14
1820.863
296.3131
2117.176
15-44
26428.67
3481.735
29910.41
45-59
24435.07
3026.483
27461.55
60 +
4219.269
314.5453
4533.815
Total
58353.24
7382.969
65736.21
Source: Same as Table 10.1.
LU
z
z
<
x
u
o
x
03
<
x
0
U
LU
I
TABLE
10.3
Discounted present value ot gains out of deaths averted in the first year due to DOISset B* (In Rs. Crores)
Total of All Areas
Urban Areas
Rural Areas
Male
Female
Persons
Male
Female
Persons
Male
Female
Persons
0-4
85
1I
96
44
3
47
129
14
143
5-14
55
36
91
28
9
37
83
45
128
15-44
1505
374
1879
788
97
885
2292
471
2763
45 - 59
693
72
765
395
20
415
1087
92
1180
60 +
93
7
101
37
2
39
130
10
139
Total
2431
500
2931
1291
131
1422
3722
632
4353
0-4
49
6
54
24
2
26
73
8
80
5 - 14
36
23
59
18
6
24
55
29
84
15 - 44
1 138
283
1421
596
73
669
1734
356
2091
45 - 59
625
65
690
356
18
375
982
83
1065
60 +
91
7
98
36
2
38
126
9
135
Total
1938
385
2323
1031
101
1132
2969
486
3455
Age
A) Discount Rate of 5%
B) Discount Rate of 7%
z
0
<
i/>
z
<
u
a:
0
z
<
C) Discount Rate of 10%
LU
0-4
23
3
26
12
1
13
35
4
39
I
Q
5 - 14
22
14
36
11
3
15
33
17
50
a:
0
15 - 44
800
199
999
419
51
470
1219
250
1469
$
45 - 59
542
56
598
309
16
324
850
72
922
60 +
88
7
94
34
2
36
121
9
130
Total
1474
28
1752
785
74
858
2258
352
2611
co
CM
*
i
Rural Areas
Age
Urban Areas
Total of All Areas
Male
Female
Persons
Male
Female
Persons
Male
Female
Persons
0-4
13
2
14
7
0.4
7
19
2
21
5 - 14
15
9
24
8
2
10
23
11
34
15-44
600
149
750
314
39
353
914
188
1102
45-59
474
49
523
270
14
285
744
63
807
60 +
83
7
90
33
2
35
116
9
125
Total
1185
216
1401
631
57
688
1816
273
2089
0-4
7
1
8
4
0.2
4
11
1
13
5 - 14
11
6
17
6
2
7
17
8
25
Z
D) Discount Rate of I 3%
E) Discount Rate of 16%
LU
15 - 44
474
118
592
248
30
279
722
148
870
z
<
45 - 59
418
44
462
238
12
251
657
56
713
60 +
80
6
86
31
2
33
a:
0
0
112
8
120
(X
Total
991
175
1166
527
47
574
1518
222
1740
co
* Set B is based on Survey of Causes of Death Estimates ofTB deaths.
I
<
Source: Same as Table 10.1.
m
0
0
LU
I
' ;-L.
i
TABLE
10.4
Discounted present value of gains out of deaths averted in the second and subsequent years due to DOTS set B* (in Rs. Crores)
All Areas
Urban Areas
Rural Areas
Male
Female
Persons
Male
Female
Persons
Male
Female
Persons
0-4
4734.6
618.7
5353.4
2446.6
158.7
2605.3
7181.2
777.5
7958.7
5 - 14
3081.8
1982.6
5064.5
1563.6
501.5
2065.1
4645.4
2484.2
7129.1
15-44
83810.4 20850.4 104660.9
43879.4
5392.8
49272.2
127689.8 26243.3 153933.2
45 - 59
38580.2
4012.3
42592.6
21980.8
1135.2
23116.0
60561.1
5147.5
65708.7
60 +
5195.2
409.5
5604.7
2040.3
123.3
2163.7
7235.6
532.8
7768.5
Total
135402.5
27873.8 163276.3
71910.8
7311.7
79222.6
Age
A) Discount Rate of 5%
207313.3 35185.5 242498.9
B) Discount Rate of 7%
z
o
<
in
0-4
1307.1
170.8
1477.9
675.4
43.8
719.2
1982.5
214.6
2197.2
5 - 14
993.8
627.0
1620.8
504.2
158.6
662.8
1498.0
785.6
2283.7
15-44
31092.0
7735.1
38827.1
16278.4
2000.6
18279.0
47370.4
9735.7
57106.2
z
<
c
45 - 59
17083.2
1776.6
18859.8
9733.0
502.6
10235.7
26816.2
2279.3
29095.5
cc
60 +
2474.8
195.0
2669.9
971.9
58.7
1030.7
3446.8
253.8
3700.6
Total
52951.0
10504.7
63455.7
28163.0
2764.5
30927.6
81114.1
13269.3
94383.4
o
i
<
C) Discount Rate of 10%
LU
I
0-4
350.9
45.8
396.8
181.3
11.7
193.1
532.3
57.6
589.9
□
5 - 14
334.9
205.4
540.4
169.9
51.9
221.9
504.9
257.4
762.3
15-44
12136.1
3019.2
15155.4
6353.9
780.9
7134.8
18490.1
3800.1
22290.2
45 - 59
8216.2
854.4
9070.7
4681.1
241.7
4922.8
12897.3
1096.2
13993.5
60 +
1317.6
103.8
1421.4
517.4
31.2
548.7
1835.1
135.1
1970.2
Total
22355.9
4228.9
26584.8
11903.8
1117.6
13021.5
34259.8
5346.6
39606.4
al
0
$
o
I
$
i
... ' "'nr
Rural Areas
Urban Areas
All Areas
Male
Female
Persons
Male
Female
Persons
Male
Female
Persons
0-4
130.2
17.0
147.2
67.2
4.3
71.6
197.4
21.3
218.8
5- 14
155.0
92.4
247.5
78.6
23.3
102.0
233.7
115.8
349.6
15-44
6200.3
'1542.5
7742.8
3246.2
398.9
3645.1
9446.5
1941.4
11388.0
45-59
4894.3
509.0
5403.3
2788.5
144.0
2932.5
7682.8
653.0
8335.8
60 +
861.2
67.8
929.0
338.2
20.4
358.6
1199.4
88.3
1287.7
Total
12241.1
2228.9
14470.1
6518.9
591.1
7110.1
18760.0
2820.1
21580.2
Age
D) Discount Rate of 13%
E) Discount Rate of 16%
0-4
57.6
7.5
65.2
29.8
1.9
31.7
87.4
9.4
96.9
5 - 14
85.1
49.4
134.6
43.2
12.5
55.7
128.3
61.9
190.3
15-44
3666.0
912.0
4578.0
1919.3
235.8
2155.2
5585.3
1147.9
6733.2
45 - 59
3236.4
336.5
3573.0
1843.9
95.2
1939.1
5080.3
431.8
5512.2
60 +
619.8
48.8
668.6
243.4
a:
U
0
14.7
258.1
863.2
63.5
926.8
(X
Total
7665.1
1354.4
9019.6
4079.7
360.2
4440.0
11744.8
1714.7
13459.6
S3
LU
z
z
<
* Set B is based on Survey of Causes of Death estimates ofTB deaths.
Source: Same as Table 10.1.
<
03
o
LU
I
co
i
__________________________________
1
throughout the year with reduced efficiency if they were
also workers. Thus, the economic benefits of deaths
averted by DOTS during the particular year when the
patient is put on DOTS would be the same as any other
patient getting cured by DOTS. The benefits of deaths
averted arc thus only the additional benefits accruing in
future and therefore appropriately discounted.
Secondly, we must also consider the future flow of
benefits of DOTS due to future deaths averted. As we have
already discussed, "without DOTS", the situation is repet
itive and therefore the deaths remain the same. On the
other hand, with successful DOTS, the prevalence sharply
declines to about 33 to 35% of the present level. The
number of deaths occurring "with DOTS", therefore,
would be 0.7% of initial prevalence as compared to 2% as
in the initial year of DOTS. The number of deaths averted
during the second year of DOTS is thus 13.3% of initial
prevalence as compared to 12% in the initial year of DO TS.
After 15 years or so, the annual incidence is also likely to
fall and hence the deaths averted by DOTS would further
increase. However:
z
o
■ the rate of decline in the annual incidence is not
very predictable;
■ the actual further gain is only marginal (because
at best it can reach 14% from 13.3% of initial
prevalence); and
■ the benefits lie at least 15 years or more in future
(which implies very low present value).
<
</>
z
<
0
a:
0
I
<
Considering all these, we have preferred to ignore the fall
in annual incidence rate in future (after 15 years) on
account of DOTS while estimating the economic benefits
of DOTS. To the extent the annual incidence declines in
future, our estimates represents an underestimate of the
true benefits of DO TS. This is in the spirit of conservatism
often practised in the field of social cost benefit exercises.
The estimates of present value of economic benefits of
DOTS due to deaths averted in the first year and due to
deaths averted in the subsequent years are presented in
Tables 10.1 and 10.2 according to the Murray and Lopez
(1996) estimates of TB deaths and in Tables 10.3 and 10.4
according to the Survey of Causes of Death estimates of
TB deaths. Similarly Table 10.5 provides the present dis
counted value of the future economic benefits due to
reduction in prevalence of TB on account of DO TS in India
at different discount rates.
We have so far considered the estimates of the tangi
ble economic benefits of DOTS given in Tables 8.2 and
LU
I
o
a:
0
$
■
■a
K
’
T'’"'
10.1 to 10.5, from reduced prevalence and deaths averted
by DOTS. It is stated that when the prevalence is signifi
cantly reduced, the transmission cycle of the infectious TB
gets effectively interrupted and the incidence of new TB
patients in the distant future also gets reduced. However,
these effects usually lake a long time because as such about
40-50% of the country's total population is believed to be
already infected by the TB bacilli. The disease can become
active even years after the initial infection. Thus, even
when the annual risk of infection which is currently esti
mated for India to be around 1.5% as per the World Bank
(1995, p.5), starts declining at a rate of 10% as against the
current rate of 2-2.5%, it would take more than 25 years to
reach the level of 0.1% of the annual risk of the disease.
Significant reduction in the annual incidence rate of TB
due to intervention through DOTS can, therefore, be
expected only after about 15 years. Until then, the annual
incidence rate is likely to be about one-third of the prev
lence rate in the initial period given the epidemiological
situation of TB in India. Under these circumstances, if the
prevalence (stock) of TB were rapidly lowered with suc
cessful DOTS therapy the cost of tackling TB would fall by
two-thirds and remain at that level for about 15 years after
which it would again start declining. This feature of the
DOTS strategy has implications on the cost "with DOTS" as
compared to "without DOTS". As we have already seen,
India has reached a steady state which has a tendency to
repeat itself in an epidemiological sense with respect to
TB. Thus, if things do not change, the present cost (both
private and public) would have to be incurred annually
just in order to keep the situation from worsening.
XI. Saving of hospital beds due to DOTS
| n 1993-94 hardly 1.2 million TB cases out of the probI able 3.9 million were detected and put on treatmen
(See, Datta, 1995). Moreover, most of these cases receive
palliation and not cure. Therefore, it is believed that
almost 75% to 80% of the existing TB patients in India
have received some treatment for TB at one time or
another. The treatment does not result in cure because it
is neither complete nor of proper quality. The unit cost
incurred for such treatment — both by the patients and
the provider institutions — are possibly lower than what
would be needed if the treatment was complete and of
proper quality. DOTS on the other hand, cures the patients
and could cost more particularly because we have to con
sider all the social costs necessary to ensure that the DOTS
strategy succeeds in India.
In the scenario "with DOTS" as compared to "without
’ S??
■’<’.-r., *wrvs^XMfT'y jj
■ S : ’"i;<f'^w^" Hi
■
•ji'
..X
-
^L
iWOOn*
*
i J
j W
■*
te &
-
’f ■L’1,
A ;
= ' :
■
4 *
£
•X I
V
■ J ■ .*
.
*
<• ''<4
a
TABLE 10.5
Discounted present value of future increase in GDI’ in India due to reduction in prevalence due to DOIS
(in Its.(.rores)
All Areas
Urban Areas
Rural Areas
Males
Females
Males
Females
Males
Females
Persons
15 - 44
15170.61
2024.77
5068.083
2347.861
20238.7
4372.63
24611.33
45 - 59
14662.13
2169.203
4583.554
202.1067
19245.69
2371.31
21617
60 +
1 1509.53
772.8197
2461.229
18.92948
13970.76
791.7491
14762.51
Total
41342.27
4966.792
121 12.87
2568.897
53455.14
7535.689
60990.83
15-44
7585.306
1012.385
2534.041
1173.93
10119.35
2186.315
12305.66
45 - 59
7331.066
1084.601
2291.777
101.0533
9622.843
1185.655
10808.5
60 +
5754.765
386.4098
1230.615
9.464739
6985.379
395.8746
7381.254
Total
20671.14
2483.396
6056.433
1284.448
26727.57
3767.844
30495.41
Ages
A) Discount Rate of 5%
B) Discount Rate of 7%
z
o
<
</)
z
<
□
C) Discount Rate of 10%
15-44
4334.461
578.5056
1448.024
670.8173
5782.484
1249.323
7031.807
45 - 59
4189.181
619.7723
1309.587
57.74476
5498.768
677.517
6176.285
60 +
3288.437
220.8056
703.2084
5.408422
3991.645
226.214
4217.859
Total
1 1812.08
1419.083
3460.819
733.9705
15272.9
2153.054
17425.95
t£.
o
I
<
LU
I
Q
D) Discount Rate of 13%
<x
15-44
3034.123
404.9539
1013.617
469.5721
4047.739
874.5261
4922.265
o
$
45 - 59
2932.427
433.8406
916.7108
40.42133
3849.137
474.2619
4323.399
60 +
2301.906
154.5639
492.2459
3.785896
2794.152
158.3498
2952.501
Total
8268.455
993.3584
2422.573
513.7794
10691.03
1507.138
12198.17
E) Discount Rate of 16%
15-44
2333.94
31 1.503
779.705
361.2093
3113.645
672.7123
3786.358
45 - 59
2255.713
333.7235
705.1621
31.09333
2960.875
364.8169
3325.692
60 +
1770.697
1 18.8953
378.6507
2.912227
2149.347
121.8076
2271.155
Total
6360.35
764.1219
1863.518
395.2149
8223.868
1159.337
9383.205
■
Source: See the text, Sections VIII anil X and also the note in Table 10.1.
.....................
........
•........
DOTS" the costs to the society4 are, therefore, not likely to
be saved in spite of the declining costs of the DOTS in the
distant future. If there is any net saving of cost to society
in the "with DOTS" over "without DOTS" scenario, it can
be considered as a net benefit of DOTS. However, when we
are using a high rate to discount the future, there may be
negligible net saving in terms of social costs "with DOTS"
over the situation "without DOTS". This is because suc
cessful DOTS might well cost more in the short run.
There is some obvious saving of resources due to DOTS
which we have not considered so far. DOTS strategy to cure
TB averts hospitalization of the TB patients. If the strategy
is properly implemented, it can save the economy the cost
of hospital beds currently used for TB patients. This again
is not a one time benefit but is a permanent benefit to the
society. In order to estimate this benefit of DOTS, we need
to know the number of hospital beds and the duration for
TA B LE
which they are used by the TB patients in the base year
1993-94 in India. Secondly, we need to estimate the cost of
providing a hospital bed per day on an average in India.
We are not interested in estimating how much a TB
patient has to pay for the hospitalized treatment in the
government hospital and the private hospital or how
much subsidy he receives from the government or non
government organisation. Our interest is to estimate the
amount the society has to spend in order to create the
infrastructural facility equivalent to the number of TB beds
released by DOTS. In this context, a set of some relevant
estimates are derivable from the Gujarat Institute of Devel
opment Research, Ahmedabad study about TB from the
NSS 42nd round data on five states (see, Visaria et al. 1994).
Table 11.1 presents the proportion of public and
private hospital treatment among the selected sample of
TB patients in the rural and urban areas of the five states.
I I . I
Proportion of public and private hospitalization by TH patients, 1986-87 (in 'K>)
LU
Rural Areas
E
E
Urban Areas
States
Public
Private
All
Public
Private
All
Gujarat
75.7
4.3
100
67.2
32.8
100
Maharashtra
76.9
23.1
100
62.0
38.0
100
Tamil Nadu
63.9
36.1
100
93.5
6.5
100
Uttar Pradesh
70.7
29.3
100
70.7
29.3
100
West Bengal
95.7
4.1
100
95.5
4.5
100
<
tn
0
0
a:
<
03
O
Source: Visaria etui. (1994), pp.34-35.
in
TABLE
I
11.2
Average amount per day paid to the private hospital by the TB patient for hospitalization, 1986-87 (in Rs.)
States
Rural Areas
Urban Areas
Gujarat
19.75
94.44
Maharashtra
65.82
61.55*
Tamil Nadu
58.33
100.67
Uttar Pradesh
22.82
11.20*
West Bengal
22.61
241.22*
38
102
Average
* Some error is suspected but Visaria et al. (1994) are silent about it.
Source: Calculated from Visaria et al. (1994) pp.38 and 40.
Based on these figures, we may lake the average propor
tion of the government to non-government hospital beds
used by the TB patients in India to be 75:25. The total I B
beds in the government hospitals is reported to be 47,326
by the end of 1991. Assuming the same number of beds
in the year 1993-94, and applying the proportion of 75:25
to obtain the beds in the non-government hospitals, the
total number of hospital beds in 1993-94 used by the I B
patients turns out to be 63,101 or say, 63,()()().
In order to estimate the cost of a hospital bed to the
provider — whether government or non-government, it
is most relevant to consider the market value of the bed.
It is, therefore, the private hospital's charges which should
provide some guidance. However, in the light of non
availability of precise data, we use whatever rough and
ready estimates one can derive from Visaria el al. (1994).
Table 11.2 presents the average amount per day spent by
TB patient for hospitalized treatment in the five states. Tak
ing a simple average in the rural and urban areas, the
z
overall weighted average amount works out to be Rs.57 per
0
day per bed in 1986-87/ Taking 30% of this as the cost of
<
dental service charges, the cost of the hospital bed for I B
I/)
patient per day would work out at Rs.40 per day in 1986-
medicine, the profits of the private sector and other inci
z
<
u
cc.
87. Considering the overall inflation rate of 9.4% per
annum (based on GDP deflator), the cost ol a hospital bed
per day in the economy works out to about Rs.75 per day
o
in 1993-94. Considering the utilization of the bed by the
I
TB patients on an average for 275 days out of 365 days (i.e.,
at about 75%), the cost saved by DOTS per bed released by
<
LU
I
the TB patients would be Rs.20.6 thousands per year.
The estimate of the benefit of DOTS in terms of releas
ing the hospital beds currently used by the TB patients,
Q
thus, works out to 63,()()() beds * Rs.2(),600 per bed =
Ct
Rs. 129.8 crores per annum. Since this is an annuity, its
O
present discounted values at different discount rates are
reported in Table 1 1.3. It may be noted here that the dis
count rate in this case is not reduced by the labour
productivity growth since that is not a factor in the
numerator. But the discount rate will get reduced by the
growth rate of the hospital beds used by the TB patients in
future in the scenario "without DOTS".
XII. Potential economic
benefits of DOTS in India
■^he DOIS strategy is an effective way of tackling TB.
I The strategy has worked elsewhere and is expected to
work in India too. Regular treatment is a major factor in
curing I B. DOIS aims to tackle that factor directly. It is
important to consider the various aspects of the problem
of TB in India to ensure that DO TS succeeds in India. How
ever, it is important to have some dimensional idea about
the potential benefits of DOI’S in India so that any extra
or additional resources required to make the strategy work
effectively in the country can be considered in the light of
the likely benefits of those interventions. In this context,
we have to consider the potential benefits of DOTS and
not its actual performance in the pilot projects or any
operational constraints on the implementation of DOTS
in the country. Identification of such constraints, factors
to improve the effectiveness of DOTS, and finding oi
management solutions to make DOTS succeed to the
desired extent are important studies, the justification and
feasibility of which depends critically on some idea about
the potential economic benefits the country may derive
if DOTS succeeds. In our exercise, therefore, we have
assumed that DOTS can and will succeed to the desired
extent in India. Another crucial assumption we make to
begin with is that of full and instantaneous coverage of
the whole population (100%) by the DOTS strategy in
India. This assumption is made initially for two reasons:
1)11 gives us an idea of the potential benefits of the DOTS
strategy in India; and 2) It would serve as a good reference
and the base estimate from which we can easily derive the
flow of benefits according to the desired pattern of the
coverage of the population "with DOTS" in India. Thus,
although this assumption may sound unrealistic, it has
great utility for considering more realistic scenarios.
Having made these basic assumptions, we have
derived the most conservative estimates of the economic
benefits of DOTS to the country's economy. Here again we
have not considered the pure social welfare increasing
effects which do not generate direct tangible economic
benefits. Thus, we have not considered here the benefits
arising from reduced suffering of TB patients, quicker and
surer cure from the disease, increased welfare on account
TAB LE 11.3
Present discounted value of the benefit ol DOIS in terms of hospital beds released (in Rs. Crores)
Discount Rates
5%
7%
10%
13%
16%
1’DV in Rs.Crores
2596
1854
1298
998
811
Soiuc c: See the text, Section XI.
BO
of lives saved and disability reduced for the dependents
and non-workers suffering from TB, the income distribu
tion gains and poverty alleviation effects because TB is
known to be more prevalent among the poor than the
rich, the psychic benefits of living in a society where the
risk of the infection and the disease is substantially
reduced, etc. We have considered here only the obvious
and direct potential economic benefits of DOIS succeed
ing in India. These include mainly the following three
benefits:
1. Reduction in the prevalence of TB due to DO TS
which improves the efficiency and productivity of
workers by reducing their forced absenteeism on
account of ill-health;
2. TB deaths averted among the current and the future
workers which add to the productive work force in
the country;
3. Release of the hospital beds currently occupied by
the TB patients since the DOTS strategy averts
hospitalization of patients.
I
I hcse benefits arc to be evaluated within the framework of
comparing two scenarios — "with DOTS" and "without
DO I S". The benefits at 1) and 2) are largely in terms of
additions to the national income over the future years.
While calculating the present discounted value, therefore,
we have to adjust for the expected growth in labour pro
ductivity. Although the current growth rate of labour
productivity in India is around 5’X> which is also targeted
in the ensuing 9th Plan, we have effectively assumed the
growth rate in labour productivity to be only 3% which is
more realistic in a very long term perspective. Similarly,
we have assumed constant absolute prevalence and inci
dence rates of TB in the "without DOTS” scenario. Given
this, the population growth rate would also apply to the
annual benefit flows such as the real labour productivity
growth. Thus, if real labour productivity growth is more
than 3% p.a. or the number of TB patients without DOTS
grow at some positive rate, our calculated figures for
potential benefits remaining the same, the corresponding
discount rates would be higher to that extent.
All the benefits are estimated considering five alter
native discount rates, viz. 5%, 7%, 10%, 13% and 16%?
This range should cover any realistic expectations of
return on capital since all these calculations are in real
terms or at constant base year (1993-94) prices. These dis
count rates are therefore real rates of interest. If the
benefits exceed the costs despite a 16% discount rate, the
nominal rate of return on the investment would be (16%
+ inflation rate). This is likely to exceed 20% to 22% if
inflation runs at 4% to 6% per annum. A discount rate as
low as 5% is considered here because ideally, these bene
fits from DOTS should be discounted at the social time
preference rate (STPR) which is estimated at 5% for India.
The second parameter where we have preferred to
consider alternative sets of estimates is the mortality due
to TB. There are two usable sets of estimates of the deaths
due to TB in the country — having dimensionally verydifferent estimates. Murray and Lopez (1996) estimates of
death rates due to TB provide a very high estimate of TB
deaths consistent with the old 1955-58 NSS Survey. As
against this, the Survey of Causes of Death in 1993 gives
a substantially lower mortality due to TB. Since deaths
averted at present and in future are very important com
ponents of economic benefits of DOTS, we have
considered both the sets of estimates as alternatives. We
summarise the potential economic benefits of DOTS in
India in Table 12.1.
It can be seen from the table that the DOTS strategy to
cureTB in India is beneficial even at higher discount rates.
As the discount rates increase, the present value of all
future economic benefits falls dramatically from 66'M> of
GDP in 1993-94 at a 5% discount rate to only 5% of GDP
in 1993-94 at a 16% discount rate with Murray and Lopez
estimates of mortality due to TB. More conservative esti
mates are obtained when we use the Survey of Causes of
Deaths estimates of TB mortality. Even with these most
conservative estimates of TB mortality, the present value of
all future potential economic benefits of DOTS turns out to
be about 4% of GDP in 1993-94 at a 16% discount rate.
DOTS is potentially highly beneficial even when we
consider extremely high discount rates such as 16%. Even
then and with the most conservative set of estimates, the
present value of all future potential economic benefits
of DOTS to the Indian economy turns out to be at least
3.8% of its GDP in 1993-94 or about Rs.266 billion or USD
8.3 billion in 1993-94. If the present value of the stream of
future costs in successfully implementing DOTS works out
to anything less than 3.8% of the GDP at factor cost in the
country, the effective rate of return from DOTS would be
at least 16% in real terms. Since the budget and other
managerial inputs required to successfully implement
DOTS in India are most likely to be less than 3.8% of GDP,
DOTS represents an opportunity to step up India's eco
nomic growth in future. (Rough projected costs for
successful DOTS implementation throughout India are of
the order of 200 million US dollars per year, lower than
the benefits of at least USD 750 million per year — Editor's
note). Moreover, there can be few better examples of a pro
ject which offers accelerated growth with significant social
justice because its poverty alleviating and equity promot
ing effects are known to be substantial.
Z
Z
<
(X
O
0
(X
X
<
m
0
i
*
It can be readily seen that the second one is an extreme,
assumption primarily made to get an idea about the
potential benefits DOTS can offer in India. In a geograph
ically large and relatively densely populated country like
India, instantaneous coverage of 100% population by any
I B cure programme like DO IS may appear to be almost
infeasible. I his is not only because trained manpower,
organisational and management inputs required for such
a task must first be generated, but also because such large
investments might exceed readily available finances.
XIII. Benefits of DOTS with
gradual coverage of population
s mentioned in the beginning of the Section XII, the
estimates of the potential benefits of DO TS presented
so far have been derived on the basis of the following two
assumptions:
■ DO I S can and will succeed in effectively tackling
TB in India; and
■ Coverage of the population with DOTS is lull and
instantaneous.
TABLE 12.1
Potential economic benefits of DO IS in India (in Its. Billion)* at 1993-94 prices
Discount Rates
5%
7%
10%
13%
16%
Reduction in Prevalence of TB
in First Year of DOTS
12.30
12.20
12.20
12.20
12.20
Reduction in Prevalence of TB
in Subsequent Years
609.91
304.95
174.26
121.98
93.83
622.11
317.15
186.46
134.18
106.03
Deaths Averted in the First
Year of DOTS - Set A
73.75
59.06
45.34
36.82
31.04
Deaths Averted in the
Subsequent Years - Set A
3961.07
1549.30
657.36
362.15
228.01
4034.82
1608.36
702.70
398.97
259.05
Deaths Averted in the
First Year of DOTS-Set B
43.53
34.55
26.11
20.89
17.40
Deaths Averted in the
Subsequent years - Set B
2424.99
943.83
396.06
215.80
134.60
2468.52
978.38
422.17
236.69
152.00
25.96
18.54
12.98
9.98
8.11
4682.89
(66.2%)
1944.05
(27.5%)
902.14
(12.8%)
543.13
(7.7%)
373.19
(5.3%)
3116.59
(44.1%)
1314.07
(18.6%)
621.61
(8.8%)
380.85
(5.4%)
266.14
(3.8%)
Economic Benefits
Z
0
<
1-A
1-B
z
Sub-Total (1A + Hi)
<
o
2-A
(Z
O
z
2-B
<
Sub-Total (2A +2H)
LU
I
2-C
o
O
2-D
$
00
Sub-Total (2C+2D)
3
Release of Hospital Beds
Total with Set A
(1+2 + 3)
Total with Set li
(1+2 + 3)
*Rs. I billion = Rs. 100 Crores.
i
1
I
3
Notes:
1. Figures in parentheses are percentages to the GDI’ in the base year 1993-94 at current prices.
2. Set A is based on Murray and Lopez (1996) Mortality Rates.
3. Set B is based on Survey of Causes of Death Mortality estimates.
Source: See the text, Tables 8.2, 10.1 to 10.5 ami 11.3.
TABLE
13.1
Economic benefits of DOTS (TB Cure) in India with alternative patterns of coverage (Rs. in billion at
1993-94 prices)
Discount Rates
Alternative Phasing Patterns for DOTS
5%
7%
10%
13%
16%
1. Instantaneous Coverage
2805
(39.7%)
1183
(16.7%)
559
(7.9%)
343
(4.9%)
240
(3.4%)
2. 5 Year Linear Coverage
2697
(38.1%)
1095
(15.5%)
490
(6.9%)
286
(4.0%)
191
(2.7%)
3. 10 Year Linear Coverage
2507
(35.5%)
998
(14.1%)
420
(5.9%)
232
(3.3%)
14
(2.1%)
4. 15 Year Linear Coverage
2451
(34.7%)
912
(12.9%)
363
(5.1%)
191
(2.7%)
11
(1.7%)
5. 10 Year Non-Linear Coverage*
2603
(36.8%)
1022
(14.5%)
436
(6.2%)
243
(3.4%)
156
(2.2%)
1. Instantaneous Coverage
140
(2%)
83
(1.2%)
56
(0.8%)
46
(0.6%)
38
(0.5(M>)
2. 5 Year Linear Coverage
135
(1.9%)
77
(1.1%)
49
(0.7%)
37
(0.5%)
31
(0.4%)
3. 10 Year Linear Coverage
125
(1.8%)
70
(1%)
42
(0.6%)
30
(0.4%)
24
(0.3%)
123
(1.7%)
64
(0.9%)
36
(0.5%)
25
(0.4%)
19
(0.3%)
130
(1.8%)
72
(1%)
44
(0.6%)
32
(0.4%)
25
(0.4%)
A) Total Present Discounted Value of Benefits
B) Annualized Benefits
LU
z
z
<
cn
□
o
CH
I
4. 15 Year Linear Coverage
5. 10 Year Non-Linear Coverage*
Q.
03
<
cn
O
★Effective coverage for successive years are 5%, 10%, 15%, 15%, 15%, 10%, 5%, 5%, 5% and 5%.
LU
I
I-
Notes:
1. All these calculations are based on the assumption of effective total coverage of 90% of population by DOTS.
2. The benefits are based on more conservative survey of causes of deaths estimates of TB deaths.
3. Figures in parentheses are percentage of Gross Domestic Product in 1993-94 at current prices.
4. The discounting of benefits are done by assuming real growth of 3% p.a. in the labour productivity in the Indian economy over
time, and with no growth of TB patients in the "without DOTS" scenario. These are most conservative assumptions.
Source: Calculated by taking Table 12.1 as the base.
4
SO
In order to guard even more carefully against any
possible overstatement of the economic benefits of DOTS,
the following steps arc taken. Assume that the DOI’S
services may be able to reach effectively 90% of the
population in any unit area unless special efforts are made
to reach the last 10%. The hard-to-reach (last) 10% in each
area unit is likely to be covered by special augmentation of
DO TS efforts to overcome hurdles of varying and often
unknown difficulty. Therefore, for all practical purposes,
I he most conservative estimate of the benefits of DOTS
should consider no more than 90<X» effective coverage in
any area unit serviced by DOI’S.
We may now consider a few alternative phasing in
patterns for DO TS implementation eventually to cover the
whole population of India. The important considerations
in phasing in of coverage by DOTS are:
Z
o
<
z
<
u
a:
O
I
<
LU
I
Q
a:
O
$
o
1
■
■
■
■
■
■
training of the personnel;
organisational and management inputs needed;
supply of medicines;
budget allocation for the programme.
All these concerns get finally translated into the number
of years required and the exact distribution of the cover
age of the total population. We may consider the
following options assuming that 90% of a "covered" pop
ulation gets effective DOTS services.
■ Instantaneous full coverage, i.e., 90% effective
coverage in the first year.
■ 5 years with 18% effective coverage every year.
■ 10 years with 9% effective coverage every year.
■ 15 years with 6% effective coverage every year.
■ 10 years with effective coverage of 5%, 10%, 15%,
15%, 15%, 10%, 5%, 5%, 5%, and 5% respectively
in successive years.
The results are presented at the same five alternative dis
count rates for these five alternative patterns of coverage
of DOTS in India in Table 13.1.
It can be readily observed from the table that phasing
in reduces the present discounted value of the benefits at
any given discount rate. Similarly, the economic benefits
also decline for the given type of phasing in of DOTS
implementation as the discount rate rises. ■
References
’
1. ASCI (1995): Preliminary Results of Andhra Pradesh
Disease Burden & Cost Effectiveness - Annexure VII- Tubercu
losis, Unpublished Study, October 9; pp.44-59.
2. Central Bureau of Health Intelligence (1994): Health
Information of India - 1993, Ministry of Health and Family
Welfare, GOI, New Delhi, December.
3. Central Statistical Organisation (CSO) (1994): National
Accounts Statistics 1994, Ministry of Planning, GOI
(Regular Publication).
4. Centre for Monitoring Indian Economy (CMIE) (1996):
India's Social Sectors, Bombay, February.
5. Chakraborty, A.K. (1996): Prevalence & Incidence of
Tuberculous Infection & Disease in India - A Comprehensive
Review (Draft dt. Aug. 1996), Unpublished project report
sent to WHO, New Delhi.
6. Chakraborty, A.K., Rangan, S., and Uplekar, M. (Eds.,
(1995): Urban Tuberculosis Control - Problems and Prospects,
The Foundation for Research in Community Health
(FRCH).
7. Datta, K.K. (1995): "National Tuberculosis Control
Programme", in FRHS (1995), pp.1-13.
8. Dholakia, Bakul H. (1974): The Sources of Economic
Growth in India, Baroda: Good Companions.
9. Dholakia, Bakul H. (1995): "Sources of India's Eco
nomic Growth", IIMA Working Paper No. 1288, December.
10. Dholakia, Bakul H. (1996): "Functional Distribution of
National Income in India", in Economic and Political
Weekly, Vol.31, No.4, Jan. 27, pp.229-236.
11. Dholakia, Ravindra H. (1993): "Sectoral Targets of
the Eighth Plan: Some Implications", in Economic and
Political Weekly, Vol.28, Nos.32 and 33, August 7-K
pp. 1685-1687.
12. Dholakia, Ravindra H. (1993): "Sectoral Targets of
the Eighth Plan: Some Implications", in Economic
and Political Weekly, Vol.28, Nos.32 & 33, August 7-14;
pp.1685-1687.
13. Dholakia, Ravindra H., and Oza Ajay N. (1996):
Microeconomics for Management Students, Delhi: Oxford
University Press.
1
14. Dornbusch R. and Fischer S. (1994): Macroeconomics,
Sixth Edition, McGraw-Hill Inc.
15. Fellner W. (1967): "Operational Utility: The Theoreti
cal Background and Measurement" in W. Fellner (ed.),
Ten Economic Studies in the Traditions oflrwing Fisher, New
York: J.Wiley.
16. Foundation for Research in Health Systems (1995):
Health Monitor 1995, Ahmedabad.
17. Indian Council of Medical Research (ICMR): Tuber
culosis in India - A Sample Survey, 1955-58, Special Series
Report No.34, ICMR, New Delhi.
18. International Institute for Population Sciences (UPS):
National Family Health Survey, 1992-93; August.
19. Murray, C.J.L. and Lopez, A.D. (eds.) (1994): Global
Comparative Assessments in the Health Sector - Disease
Burden, Expenditures and Intervention Packages, collected
Reprints from Bulletin of the WHO, WHO Geneva.
20. Murray, C.J. and Lopez, A.D. (1996): Global Health
Statistics, Boston: Harvard University Press.
21. Murray, C., Styblo, K. and Rouillon, A. (1993): "Tuber
culosis", in Disease Control Priorities in Developing Countries,
edited by D.T. Jamison, Oxford Medical Publication,
Ch.ll, pp.233-259.
22. Narayanan, P.R. (1996): Epidemiological Study of
Thiruvallur District, unpublished study undertaken at
Tuberculosis Research Centre (TRC), Madras. Some pre
liminary estimates were made available through e-mail by
Dr. S. Radhakrishna, ORC-TB-India, WHO.
23. National Sample Survey Organisation (NSSO) (1994):
"Results on the 4th Annual Survey on Consumer Expen
diture & Employment - Unemployment (46th Round),
July 1990 - June 1991", in Sarvekshana, January-March,
1994.
24. National Tuberculosis Control Programme (1996):
"A Summary Statement", Cyclostyled Hand-out pp.1-7.
25. Nayyar, S., Narayang, P., Tyagi, N.K. et al. (1989):
Field Trial of Short Term Intermittent Chemotherapy Against
Tuberculosis, an ICMR project (unpublished) Department
of Community Medicine & Department of Microbiology,
M.G. Institute of Medical Sciences, Sevaram Wardha,
pp. 1-325.
27. Ramana, G.N.V. (1996): "Model Scenario: Tuber
culosis", A part of Unpublished Study on Technology
Forecast sponsored by TIFAC, Department of Science &
Technology.
28. Ramana, G.N.V. (1996): "Reply to Querries by Fax",
Administrative Staff College of India (ASCI) Fax of Sept. 12.
29. Rangan, Sheela (1995): "User Perspective in Urban
Tuberculosis Control", in Chakraborty et al. (1995);
pp.97-106.
30. Registrar General: Census of India 1971 Series - India
Part VII (i): Degree Holders and Technical Personnel Special
Tables G-I to G-IV, GO1, New Delhi.
31. Registrar General of India (1991): Vital Statistics of India
1987, Ministry of Home Affairs, New Delhi.
32. Solow, R.W. (1958): "Technical Change and the Aggre
gate Production Function", Review of Economics & Statistics,
August.
33. Sundar, R. (1995): Household Survey of Health Care
Utilization and Expenditure, National Council of Applied
Economic Research, Working Paper No.53, March.
111
z
z
34. Tiwari, D.D. and Pandey, I.M. (1993): "An Estimation
of Social Time Preference Rate for India and Its Public Pol
icy Implications", Indian Journal of Economics, Vol. LXX1V,
pt.l, No.292, July pp.61-75.
<
or
U
0
35. Uplekar, M. and Rangan, S. (1996): Tackling TB - The
Search for Solutions, FRCH.
cn
36. Visaria, P, Cumber A. and Jacob, P. (1994): Tuberculosis
in India, 1986-87 - An Analysis of Data for Five States,
Unpublished Monograph, Gujarat Institute of Develop
ment Research, Ahmedabad, pp.1-57.
<
37. Vital Statistics Division (1994): Survey of Causes of
Death (Rural) India - Annual Report 1993, Series 3, No. 26,
Ministry of Home Affairs.
LU
€
I
*
Cfl
0
38. World Bank (1993): World Development Report 1993 Investing in Health, Oxford University Press.
39.World Bank (1995): India - Policy and Finance Strategies
for Strengthening Primary Health Care Services, Report
No. 13042-IN, May 15.
26. Planning Commission (1952): First Five Year Plan,
New Delhi.
i
■
......J.
L1a.
i
t
Appendix I:
Appendix 2:
The methodology can be described through symbols as
The methodology for estimating the average labour pro
ductivity for child and adult workers by sector and area is
as follows: (see Table 4.2).
follows:
’
Let I’j, Uj and Rj be the average labour productivity
in the i-th sector in the whole economy, urban area and
rural area respectively; and iq and r, be the proportion
of workers in the i-th sector in urban and rural areas
respectively. Then,
I’i = Uj Uj + ij Rj and if Uj /Rj =®cj then,
Rj = Pj/(ocj Uj + ij) and Uj=ocj Pj/(«jUj + rj)
Estimates of Pj, ^j, uj and q arc available as described in
the text. Hence, estimates of Uj and Rj are obtained.
Multiplying these productivities with respective workers,
we can get the respective income estimates.
«
Let Pj, Cj and Aj be the average productivities of all
workers, child workers and adult workers in the i-th
sector of the given area respectively; and q and aj be the
proportion of workers in the i-th sector of the given area
belonging to the age groups 5-14 years and 15+ years
respectively. Then,
Pi = CjCi + ai Aj and Cj = (l/3) Pj by assumption.
.-.00 Aj = Pj (3-ci)/3ai
Estimates of Pj, c, and aj are available from Table 4.1 and
Table 3.2.
Appendix 3:
z
o
<
<Z)
Z
<
□
a:
O
I
<
LU
The methodology is for calculating the productivity of
young and old adult workers (see Table 4.3) as follows:
Let Aj, Yj and Oj be the average productivities of
respectively the adult (15+ age) workers, young adult
(15-44 age) workers and old adults (45+ age) workers in
the i-th sector of the given area and yj and Oj be the pro
portion of workers respectively in the young and old
adult workers in the i-th sector of the given area. Then,
Aj = yjYj + OjOj and Oj= 1.76Yj;
as described in the text.
.-.00 0j = Aj/(yj + Oj * 1.76) and Oj = l.76 Aj/(yj + Oj* 1.76)
I
o
Estimates of Aj, yj and Oj are available from Table 4.2 and
Table 3.2.
a:
O
£
■
I
I
i
W
___ _____________________
I
Hi
r
Appendix 4:
Endnotes
The methodology used to calculate the productivities
by sex, sector, age group and rural/urban residence is as
follows:
Let YPj, YMj and YFj be the average productivities of
respectively the young adult (15-44 age) workers, young
adult male workers and young adult female workers in
the i-th sector of the given area; and ymj and yfj be the
proportion of young male and female workers in the i-th
sector of the given area. Then,
I. Since the higher the prevalence of TB the greater
the predicted benefits of the DOTS strategy, the lowest
estimate of prevalence of TB is used for the most conser
vative estimate.
YPj ymj YMj + yfj YFj and YMj = 1.28 * YFj
as described in the text.
.•.60 vF'<T>j = YPj/(1.28ymj + yfj) and YMj = 1.28 YPj/
(1.28 ymj +yfj)
Similarly, we get,
OPj = omjOMj + ofjOFj and OMj= 1.41 *OFj
as described in the text.
.•.00 OOJj = OPj /(1.41 * ornj + ofj) and OMj = 1.41 * OPj /
(1.41*OMj + ofj)
Estimates of YPj, ymj, yfj, OPj, omj and ofj are available
from Table 4.3 and Table 3.2.
2. Actually the summation of the two would provide
an upper limit to the average age of death occurring
currently. Thus, this is a conservative assumption to esti
mate the benefits of DOTS due to deaths averted.
3. We have made calculations at these effective rates of
discount. The advantage is that the calculations and the
numbers do not change if we change our assumptions
about the growth of labour productivity and/or the
growth in the TB cases and TB deaths in future. Thus, if
it is assumed that labour productivity would grow at 3%
p.a. and TB deaths at 1% p.a., the rates of discount corre
sponding to our effective rates of discount would be 6%,
8'X), 11%, 14% and 17%, and so on.
4. The costs of TB cure to the society would include the
expenditures incurred by the patients and the expendi
tures with subsidies by the government and non-government sectors on TB cure. The consistent costing exercise
would consider only additional costs "with DOTS" over
"without DOTS" scenario just as the benefits of DOTS are
estimated in the present study in terms of additional ben
efits "with DOTS" over "without DOTS".
5. The weights for rural areas and urban areas are taken as
0.7 and 0.3 respectively as per the cases of hospitalization
reported by Visaria et al. (1994) pp.4.
6. A discount rate of 16% is taken here because the
implied economic rate of return in the VIII Plan estimates
for achieving the growth rate of 5.6% during the Plan
period was 16%. For details of calculations and implica
tions, see Dholakia, Ravindra H. (1993).
)
This is essentially the estimate of the "expected" social
rate of return on capital in India. Thus, the discount rates
considered here are in the range of social time preference
rates and social rate of return on capital in India.
LU
E
E
<
a:
0
0
a:
co
<
Cfl
O
0
LU
I
i'z
--
Medicinskij Fakul'tel
Uzgorodski) Universitel
Uhca Gor'kogg 40
■294000 Uzgorod
f
Zaporozski; Medicmski) Universitel
Prospekt Majakovskogo 26
330074 Zaporoz'e
-..ay
. -.JC- ...............................
H <jund Table
Vinmckij Medicmski) Universitel
Uhca Pirogova 56
280028 Vinnica
Tuberculosis control - is DOTS the health
breakthrough of the 1990s?
■VTa Kochi
c
-esurgence of tuberculosis in recent years has made an
DOTh SnateS7 ")T'SPenSable- The stra!e3y exists and
C
■ , d DTT
,S -Directly Observed Treatment. Short-course. It
oroved its efiectiveness and now needs to be used
■ dwioe on a much larger scale.
r.
4
-
I
1 -
Gender as a determinant of health
-a
a
The gender concept was first used in the 1970s to describe those
characteristics of men and women which are socially constructed, in
contrast to those which are biologically determined. Essentially, the
distinction between sex and gender aims to emphasize that
everything women and men do. and everything expected of them,
with the exception of their distinct biological functions (for women,
pregnancy, childbirth and breast-feeding) can and does change over
time, and according to changing and varied social and cultural
factors. But in practically all cultures the role of women is subordinate
to that of men. They are taught what the appropriate behaviour and
attitudes, roles and activities are for them, and how they should relate
to other people. This learned behaviour is what makes up gender
identity and determines gender roles.
A gender approach to health moves beyond describing women and
women's health in isolation, but rather brings into the analysis how the
different social roles, decision-making power and access to resources
between women and men affect their health status and their access to
health care. It examines how these differences determine, for
example, differential exposure to risk, access to the benefits of
technology, information and services, and the ability to protect on.es^..
from disease and ill-health.
■ The w rid health report 1997 - Conquering suffer*?
______ „ _
.
.
. .y
....
. . “
•. the five years since the Directly Obci vcd Treatment, Short course (DOI’S)
•is adopted by WHO as a strategy to
-mbat tuberculosis worldwide, more than
2 million people have received this
< ment. Most of them arc voting and
- ile-aged adults, and more than 900000
cm had the infectious, smear-positive
•nil of the disease. If they had access
ah to the treatment previously available
their countries, many of them would
nost certainly have died, and many more
’it d have become chronic cases, spreadthe disease in their communities. It is,
Het, these chronic cases resulting from’
”h- or interrupted treatment, tha? be"tne the main source of the deadly drug?s’oant strains of tuberculosis.
^oven effectiveness
(ois wide variety of infected
/’relations, the DOTS strategy achieved
' , IS the Dy-’-uor
the Gloi:-- •Tuher--.iiosis
z
an overall cure rate of nearly 80%, with i
range from 70% to 95%. Most of these *
cases were found and treated within the
past two years, as the mobilization of the
1)0!S. s[rategy began in earnest. Measured
in adult lives already saved as well as the
potential to save millions more in the
f
It .
I
o
Chronic cases, resulting from poor or
interrupted treatment, become the main
source of the deadly drug-resistant strains
of tuberculosis.
years immediately ahead of us, no other
new health intervention of this decade has
achieved such significant results or been of
sueh thoroughly proven effectiveness in
the held. If backed bv the modest invest
ment needed to expand the DOTS stratevy
and make it available to the millions now
infected with tuberculosis, this break
through can begin to have a major impact
on the global tuberculosis epidemic.' ’
-4
0^
I
f .
7
Tuberculosis control
Round Table
DOTS, especially in the 15 countries
hardest hit by endemic tuberculosis, could
cut the incidence rate of the disease in half
in 10-15 years. An estimated 10 million
deaths from tuberculosis could be averted
iirthat span of time. In practteerdTOTS is
still a strategy waiting to be used. In 1993,
when the system was first fully defined,
no more than 2% of the active tuberculo
sis cases worldwide were treated by this
method. Today, the estimated figure is
nearly 12%, which reflects a remarkable
rate of expansion, but is far from enough.
For millions of people with tuberculosis
the system is still inaccessible.
H
fe
M
5
.■■■
»
^3
V
, '4-
In 1993, when the system was first fully
defined, no more than 2% of the active
tuberculosis cases worldwide were
treated by this method. Today, the
estimated figure is nearly 12%.
______________________________ —
Preliminary WHO epidemiological studies
suggest that, after rising for decades, the
rate of increase in the burden of new
tuberculosis cases may begin to decline as
DOTS expands. Today, the global tuber
culosis epidemic remains a leading de
stroyer of lives. This year, 1997, its death
toll will still be between two and three
million. But it now appears possible,
although not yet certain, that the global
epidemic may be peaking.
Deploying DOTS more widely to take
advantage of the opportunity it offers in
curing patients and preventing the spread
of infection is going to require substantial
resources and a sustained public policy
commitment, particularly 2n the“15 coun
tries that are host to some 75% of all
active cases of tuberculosis (see table). 1 he
Countries suffering the highest incidence of
^rcss could be carefully monitored. It
tubercuiosis in 1935
Countries
India
China
a. •> this kind of care, coupled with im-
Estimated
number of new
cases
(000s)
Estimated
incidence rate
(cases per 10000;
population)
2059
220
1038
85
Indonesia
436
220
Philippines
270
400
Bangladesh
265
220
Nigeria
248
222
Pakistan
211
150
Russian Federation
146
99
Zaire
146
333
Brazil
129
80
Viet Nam
124
166
South Africa
104
250
Thailand
102
173
Myanmar
88
189
Ethiopia
85
155
ened immune systems of people with HIV
helps tuberculosis to spread more rapidly
in the population; in many places, 30%50% of people with HIV infection also
develop tuberculosis.
?u>ved methods of case-finding, that
jiiabled western Europe and North
\merica to succeed in minimizing and
urgcly c o n ta i n ingjuibere u lo s is. as n p ub 1 ic
health threat during the last 30 years.
3ui hospitalizing a majority of tuberculo
us patients is not an option for the coun!i<s in which this disease is now most
.in emic. Nor is it necessary. The DOTS
•'it egy makes it possible to carry out
..is, -finding, chemotherapy and patient
monitoring effectively without hospital
ire. The 6-8-month course of treatment
units further transmission of the tubercle
.icillus by making each case uninfectious,
uially within the first two to four weeks
•I treatment. It is an approach that can be
wd anywhere. Where there is precise
.issification of each patient’s treatment
•.story, uninterrupted and observed
\ b cry of treatment to each patient, and
'•:> ul monitoring of each patient’s
ress, a very high cure rate can be
diicved.
- many developing countries the health
i vices have tried to stem the tide of
hcrculosis by simply giving patients
vdication to take at home, without
!pervision and without determining
Unlike some major breakthroughs in
• het her they are dealing with a new case
health care, DOTS is not the direct outL
r one that 1X<1J
has u/wn
been treated
before. This
come of recent basic or clinical researcK-I-?pr. c}t usually fails> to cure the patients
but of subsequent operational research.
to check the spread of the epidemic,
The drugs used for treatment in the D®
n fact, actually often makes matters
system are not new. They have been
‘ »isc. Where cure rates are low, there is a
available for three decades and have been
’ol of chronic cases which continue to
almost 100% effective in curing tuberc# ?read infection. Furthermore, a consesis when used correctly. Prior to the -™: T-cnce of repeated ineffective treatment is
DOTS strategy, the proper use of these
’,ug resistance, which spreads strains of
drut’s was often limited to hospitals,
"'■’erculosis that are today virtually im-
T he DC) PS system was designed primarily
for use with large, usually poor rural and
urban populations. It involves careful
definition and application of each compo
nent of the treatment regimen and delivery
methodology^ and close-moniroring-of
each patient’s progress. When systemati
cally applied, it results in permanent cures.
The strategy was field tested and refined in
countries as diverse as Bangladesh, Benin,
China, Guinea, Malawi, Morocco, Nicara
gua, Peru, the United Republic of Tanza
nia, the United States of America (New
d ork City) and Viet Nam, and has now
been adopted as the national TB control
policy in over 70 countries.
Using standardized dosages of a combina•tion of drugs, permanent cure rates in
large populations average 85%. In some
provinces of China proven cure rates
among new cases have been as high as
94%, where methods previously in use
had success rates of 30%-40%. In Peru,
where DOTS has now been used exten
sively for three years, the treatment com
pletion rate is 88% and the overall rate.of)
new cases has begun to decline.
3
□
The DOTS strategy makes it possible to
carry out case-finding, chemotherapy and
patient monitoring effectively without
hospital care.
The low cost per patient of the DOTS
strategy and its effectiveness without
hospitalization makes the treatment af
fordable and accessible in developing
countries where the majority of cases
-occur.Hdie Ttcrual cost of curing a patieiTt
varies, of course, from country to country,
but US$ 100-200 is a fairly reliablq bene])-
c
case. I he treatment can be administered
by health workers and communitv volun
teers after adequate training. This keeps
the cost to a minimum, and enables the
health system to concentrate on supervis
ing workers, monitoring the progress of
patients, keeping accurate records, and
ensuring reliable laboratorv services. In
doiiig-ihis-they mot-only control tubercu
losis but may well improve the health
service as a whole.
>• .
tt
—
> ■A y
!
Another important advantage of the
DOIS system is that it makes it possible
to set precise and attainable goals for
public health services. WHO’s worldwide
goal is to treat successfully 85% of all new
active;vmcar-poskive) TB cases and to
detect /0% of such cases by the year 2000.
\Vc cak-Jate that, with adequate support,
this would he possible for the majoritv of
countries in which tuberculosis is endemic,
with some large countries still reluctant to
WHO s worldwide goal is to treat
successfully 85% of all new active
(smeer-positive) TB cases and to detect
70% of such cases by the year 2000.
--
rows-__
----
depi'.y
DOIS strategy widely, such as
Jd*7--- -f^stan and the Russian
rjquinng another decade to
reavn
zozi. Ir this is achieved and
sustained
nsks of contracting tubercu
losis w:!; zecime drastically, falling by half
everv 1 -—i 5 years. Thus it would become
possiblein very^ specific terms
about a
tor eliminating this dis
ease as s
c -health threat in the next
cenrurc.
Of
DQTS-s
defence l
5-ar^ce is the fact that the
provides the best known
in ui-c development of
multidrug-resistant strains of Mycobdcte- I
of India s gross domestic product
Of tuberculosis, the laboratories are
nit di titbercidosis. The incidence of such I
Pivota in monitoring patients’ pro-res'
cases, which are the result of repeated
:
towards cure bv examining sputum1
incomplete or unsuccessful drug therapy,
^tuples collected at scheduled mtervals
is still largely undocumented. It is a cause u1 components of the DOTS strategy
NO one is assumed to be cured after
for serious concern in countries with poor o launch a successful DOTS
programme,
completing
the course of treatmem.
control services, and is too much of a
v following kev components must be
danger to ignore in any circumstances, _
ji in place.
since it is extremely difheuit and expensnt
8
!
regions in Bangladesh are
to treat. In the United States and Western 1 5 net^ork of trained workers able to administer
achieving consistent cure rates of 85% in
directly observed therapy at least for the first two
Europe, mortality rates of 30%-50% have
months. I hey must be supported bv
rural areas with little infrastructure by
been the norm. In developing countries
delivering directly observed therapy
health supervisors who can monitor
the chances of being cured of it are ven’through village women.
•md report patient progress in locations
small indeed.
!
___
iat arc readily accessible to those
uder treatment. With effective superviAlthough the effectiveness of the DOTS
Each patient must be proved bv laborailn, directly observed treatment prostrategy is unquestionable, we must recog
tory
test to be cured.
>ders do not need to be trained health
nize its limitations. \\ ith the diagnostic
professionals and can even be volun
B A dependable supply of high-quality drugs The
and treatment tools currently available,
teers. However, if the programme is to
drugs required are isoniazid, nfampiem
tuberculosis cannot be eradicated globally
■mcceed, the patients must not be faced
pviazmamide, and streptomvein or
as smallpox was, although elimination nw
with too much difficulty in the form of
. ethambutol. 1’he primary cause of failed
be conceivable in some rich countries.
distance, cost, inconvenient times or
treatment is interruption, which can be
Lv cn in the most optimistic epidemiologi
"i her obstacles to access. Today, re
causeu as easdv bv a supply failure as
cal scenarios, a significant proportion of
gions in Bangladesh arc achieving
tn patient non-eonipliance. Poorqutlthe global burden of tuberculosis (perhaps
consistent cure rates of <85% in rural
'tv is also a r.sk factor. The use of
more than 20%) will survive even the
eas with little infrastructure bv dclivsubstandard drugs manufactured with
most rigorous and complete application o'
ing directly observed therapv through
out proper quality control or dating, or
the DOTS strategy. This is partly because
llage women. Most of the women
with dehoent bioavailabilitv, can also
sputum microscopy docs not detect smeai
•• 'ing this work are illiterate, but thev
lesult m treatment failure and dru<>
T
negative cases and no currently available
•ire trained, given incentives' and closely
resistance.
°
2
’
method of screening can reliably detect al
supervised. Perhaps most importantly '
H ^JCCUrfatG record'keePin9 and cohort analysis
FB cases. In addition, infection with
' wv are - unlike the majoritv of trained
system for monitoring case-finding, treatmem and
mutidrug-resistant strains of the bacillus r
health professionals - living near their
outcomes \\ orking case by case and
becoming more widespread.
patients and readily accessible to them
crstiict
distnct, record-keeping is of
yd are thus ideally placed to ensure ’
central
importance
in providing the
While better tools for the strategy are—iliat the drugs are taken without fail
nCcded
to managc'"the
being developed, the current DOTS
and on schedule, and that treatment is
018
system
m
local
and national TB
package needs to be deployed aggressive!'
completed.
control
programmes.
Cohort
analysis
and globally. Each dollar invested in it
* torninnr'es,wi!h persorlnel quipped and trained
Hacks
the
outcome
of
every
TB
patient
i
■.
d a.hi^jh return both in human— I
Io recognize tubercle bacilli in sputum smear
registered
for
treatment
each
quarter.
health and in increased economic activity
samples. I here should be one such
I his provides an ongoing performance
A recent study estimates that phasing in
‘•moiatoiv, capable of returning sputum
measurement
by indicating how many
comprehensive coverage of India with
cst results within one day, for every
are
cured,
discontinued
treatment, died,
the DOTS strategy7 over the next two___
000-150000 people in the populaetc.
It
can
also
raise
warning
flams. An
decades would yield a net benefit to the
ll(m. In addition to detecting new cases
unexpectedly
low
number
of
new TB ''T
economy of US$ 8300 million, equivalent
eases in a new cohort, for instance, O
ii-.; is t> ar,-s j
would signal the possibility of a failure
in the case detection process. Bv closelv
monitoring ease and cure rates, pro
gramme managers can allocate re
sources, personnel, training and
medication for maximum results at
minimum costs. Good records and
cohort analyses also show where com-
f
The patient’s ability to pay should never
influence the decision to provide
treatment.
1
!■
-
f’ ■
1
»
‘
E3 Sustained political commitment and funding.
^iF
I
i
F|||
.
munities and districts are failing to
achieve target cure rates, so that manag
ers can intervene quickly with the
necessary support.
'l
1 his is required to support each key
component of the DOTS strategy.
Because the benefits of effective treat
ment accrue not only to the patient but
to the local community and society as a
whole, it makes no sense to attach
conditions to the availability of treat
ment. The patient’s ability to pav
should never influence the decision to
provide treatment.
The importance of directly observed
therapy in the DOTS strategy
- --
:
M
Directly obsen’ed therapy is only one part
of the DOTS strategy, but it is a pivotal
part. Curing tuberculosis requires the
scrupulous adherence by patients and
doctors to a precise-schedule of medica
tion for at least the first two months of
treatment, and ideally for the complete six
to eight month course of therapy. Volun
tary compliance by unsupervised patients
is, not surprisingly, very often poor.
Symptoms usually disappear within the
first two to four weeks of treatment, and
crcle bacillus, was discovered in 1S'S2.
ued expansion and improvement of
when patients no longer feel sick they fee; V lough the technique and cq u ip me nt
is expected to reduce the global bu
c been refined since then, it is still a
no pressure on them to continue treat
tuberculosis by a quarter/and to c<
ur-intensive and time consuming
ment. The schedule of medication is daily
this progess at a rate which makes i
or every other day, and each dose consists •_k . hod, both for health wor kers and for
of being-ncwlv infected with tuben
of a combination of drugs. The temptatio patients.
decline by half cverv 13-15 vears.
to stop taking the pills is powerful, partrcularlv for those in developing countries xpulum mici oscopy can only detect cases
Expecting the unexpected
for whom the treatment may be costly^ ■ijr arc acnvely disseminating germs at the
cither directly in charges for medication'
•me of examination, and not always even
Nonetheless, we also need to be aw
acn. And in many cases it cannot reliably
or indirectly in time and travel costs to
that unforeseeable events can make
:cicct the presence of tuberculosis in
a public health facility or a private
projections invalid. In the past deca
vi’plc with HIV/A1DS. The WHO
practitioner.
have witnessed the emergence of H
.crculosis Diagnostics Initiative is
an
accelerator of new tuberculosis ii
king with researchers in industry to
7 hough non-compliance is highly under~
tion,
as well as the increasing occuri
the development of a new, simpler
standable it must not be tolerated because
of multidrug-resistant strains. The I
•h more user-friendly diagnostic tool.
it can build up multidrug resistance and
down of health and other services it
spread infection to others. Therefore,
■ De promising area of enquiry focuses on
former Soviet Union has also led to
clinical specimen test.(such as blood or
health workers who administer directly
of
mciease in both the incidence am.
one)
that
would
reveal
the
presence
of
observed therapy also have the responsD
case
fatality rate of tuberculosis that
B bacilli by the generation of antibodies,
bility of contacting and convincing any
•»
not
have
been predicted less than a <.
•id the presence of disease by the quantipatients who miss an appointment to
ago.
With
mounting concerns about
cation of specific antigens.
resume their treatment. Good rapport
between the treatment provider and the
patient can be an important factor in the
Orugs
At this stage, a major difficulty is the
success of the treatment.
sheer physical quantity of medication
its to combine the different drugs
needed to destroy the TB bacilli.
' in the DOTS regimen into single
Strategic questions
• : -is of consistent quality mav succeed
the near future. This will simplify the
DOTS promises to lead us a long way
antibiotic resistance, emerging discas
dcring, stocking and management of
towards defeating the TB epidemic, but
economic instability, nothing can be
!-igs and eliminate the risk of patients
not the whole way. Defeating the tubera
for granted.
'ling to take all of the drugs required. It
losis epidemic demands sustained comnfr
al Id also make for further improvement
ment to operational, basic and clinical
reducing the cost of treatment.
research.
"UI at this stage, a major difficulty is the
diecr jphysical quantity of medication
J to destroy the TB bacilli. The ideal
The most immediate need is for diagno^ ceded
•c native would be a vaccine to prevent
tools that are more sensitive, produce
'titbrcak of disease among the 2000
results more quickly and are easier to U£
hll/on people already infected with TB
This would help to make DOTS availabk
•^illi. However, this is still only
a remote
more widely. The diagnostic method in
y _______
current use, of examining a sputunrsme^ : ''-’?Pccb whh
a timeline for
research
..............
' -J____andJ
-"ting that could easily extend to 20 or 25
by microscope for the presence of the
•cars or more. In that period, the contin-
Diagnostic tools
Making the DOTS strategy work effi
tively worldwide to reduce the morb
and mortality caused bv tuberculosis
combat the emergence of deadly
multidrug-resistant strains is ambitioi
but certainly feasible. It is a pragmati
approach which does not depend on
potential development of a new “mag
bullet drug or vaccine.TTvervonc wo
be glad to see DOTS enhanced-or sup
seded by a quicker and more nowerfi
<-
t
f
II—.
t
i
.
?r■
-
B
a
_
done about it. Io correct these dangeroui.
misconceptions, two facts must be kept
clcarlv in mind, hirst, tuberculosis is a
disease to which tew people arc immune,and which spreads quickly, causes great
suffering and tends to kill people in their Don't let's wait another 40 years
most productive \ ears. Second, it can be
'-n Crofton
brought under control effectively if the
Although 1)0 I’S has w on recognition as
necessarv steps are taken to implement-tli?
one of me most cost-effective interven
DOI’S strategy. il
tions available lor protecting and enhanc
\lv mam qualification for commenting is
ing human health, resistance to it on the
mat I am old enough to have participated
part of national health authorities is still
Reference
•i the first British Medical Research
common. Sometimes this is because TB
Dholakia R. The pote^a
c b neG's of tte . otincil (BMRC) trials of streptomycin in
patients arc seen as a low pnoritv in an
DOTS strategy agamsl TB in India. World Health
■9-:^-8 and in our subsequent demonstra
Orga-, zabon. 1996 (unpublished document WHQg|environment where resources are desper
te
in Edinburgh in the 1950s that 100%
96 218 available on request from the Globa! TB gg
ately scarce. Sometimes, even where the
.tn of pulmonary tuberculosis, with no
Programme. World Health Organization. 1211
gravity of the problem is recognized, there
Geneva 27 Switzerland)
.L.psc, could be a reasonable aim (even
is the fatalistic feeling that nothing can be
Aiih the drugs then available: streptomv. m. isoniazid and para-aminosalicvlic
. id). 1 have had subsequent experience of
iberculosis problems in most parts of the
-orld. The BMRC in India demonstrated
the late 1950s that hospital or sanatomn treatment was unnecessary and
ilwequently in Africa that relapse could
c revented by six to eight months of
V ment if it included rifampicin and
i zinamidc. But for many vears no
monal
service in a developing country
Adoption of the DOTS strategy
weeded in achieving anything like the
Over 80 WHO Member States have adopted, or are starting to use.
ic rates demonstrated in research
the DOTS strategy, with an increase in cure rates to 90% In some ~
•ojccts.
countries. WHO continues to identify ways to facilitate DOTS adopti#in different environments. An operational research project in Malawi
improved the efficiency of diagnosis and treatment. Studies are und^ . ic answer to this sad failure came prima‘ h- from the leadership of Dr Karel
way to show the potential economic benefits of DOTS in India and,
bio, Annik Rouillon and their colhow good-quality care might be delivered through a network of pnv^
yigues at the International Union Against
providers. Advocacy workshops help translate programme review
findings into action, and WHO's new training modules. "Managing - Hib ‘rculosis and Lung Disease
tuberculosis at national level", and guidelines aim to reinforce nation ‘L’ \TLD). They showed that it was
technical expertise (e.g.. tuberculosis control among refugees, and,s ble to persuade governments of poor
the management of drug-resistant tuberculosis). A new WHO
•tintrics that tuberculosis was a major
newsletter, the "TB treatment observer", highlights the success of
DOTS in many countries.
1 he success of these early programmes
supported by IUATLD, and the demon
stration of their high cost-effectiveness bv
the World Bank, has led to the outstand
ing work being done by Dr Kochi and his
team, in cooperation with the World
Bank, in progressively extending the
DOTS method globally in high-prevalencc
cou ntries.
John Crofton is Professor EmeritUs. Respiratory
• jses and Tuberculosis. University of Edinburgh.
•es at 13 Spylaw Bank Road. Colmton, EH 13 OJW
•': ygh. Scotland. United Kingdom.
Dr Kochi in his article outlines some of.
the initial successes and the potential foi]''"
advance towards global control it rite
drug therapy or a vaccine. But even if such
a “new generation" product were now in
development, it could take at least 15-25
vears to reach the market. \\ hat we can
anticipate, however, are new tools for the
DO I S strategy.
V
[ iscussion
S3 The world health report 1997 - Conquering suffe^f
enrich'ng humanity. Geneva. World Health Orgaf^’
tion. 1997 88.
problem for their own countries, and that
by good organization, good supervision,
training and retraining, it could be cffectivel\’ controlled thrdugiTttieir rout1 ne
health services, using the DOTS method
which the IUATLD had pioneered. Such
success, of course, depended on good
leadership in the country itself. Tubercuk
sis had often been neglected bv the health
services and sometimes failed to attract
able physicians. But with national govern
ment support, international interest, and
the ongoing success of pioneer projects,
this has started to change, and it has been
We demonstrated in Edinburgh in the
1950s that 100% cure of pulmonary
tuberculosis, with no relapse, could be a
reasonable aim (even with the drugs then
available: streptomycin, isoniazid and
para-aminocalicylic acid).
heartwarming to sec the emergence of so
many able national leaders who have <
achieved so much even in the poorest 'J
cou ntries.
ajss*-
method can be universally applied. Under
standably, the initial successes have rdstiltcd in a certain amount of euphoria. It
is tempting to extrapolate, to prophesy the
relatively quick reversal of the present still
escalating global tuberculosis problems
resulting from both the explosion of the
1 IIV epidemic and increases in population
m poorer countries. 1 anrglad to see tlvt
Dr Kochi docs emphasize the many diffi
culties still to be overcome.
i
On the supply” side, these difficulties for
the main international bodies concerned,
'X HO and IUAI LD, include the shortage
of financial resources and the shortage of
the skilled international staff needed to
support the initiation of national pro
grammes. Fortunately the situation is
improving, though still much too slowly.
‘ational side, there is the
difficulty of persuading some governments
of the importance and feasibility of con
trol. There can be the difficulty of finding
Obstinate individualism is the enemy of
cooperative success.
md supporting outstanding national
--kiers. There are the problems of chaotic
-•atment by ignorant or unscrupulous
- .’Ctors, responsible for causing so much
multidrug resistance. In some cases such
joctors” may not be qualified in Western
medicine although they abuse Western
ugs. Unfortunately in some countries
medical schools may be using and teaching
-"dated methods and may fail to cooper--- effectively in implementing a national
programme instituted along WHO lines.
4 rreakthrough in Peru
iccognizcd as a social investment and a
In some countries, certain sections of the
commercial drug industry may also be '
iovernment responsibility for the well
' -J Guillermo Suarez A.
being of individuals and society as a
unscrupulous. They may provide unreli
whole.
able drugs, or their commercial representa
m tuberculosis situation can be seen as
tives may persuade doctors to use
I;or these reasons the DOTS strategy was
u n re 11 a b I e t rea t m ent s.
: indicator of national development. I he
adopted by Peru in 1991. Adapting it to '
■ighcr the prevalence of tuberculosis the
It is often more difficult to implement
•>>orc evident are the shortcomings of the —conailions in this country involves Tnkirp’
DO IS in cities, where private practitioncahh care system, which in its turn is a
mto account the particular cultural and
behavioural characteristics of the patients
. ilcction of the cultural and socioecocis arc numerous and there arc many
and introducing a continuous process of '
vested interests within the government,
mmic situation of the country. This
change and improvement in the health
cw point is needed for an understanding
nongovernmental and academic institu
facilities. To carry out the necessary case
tions concerned. It is particularly difficult
■ ic introduction and use of the DOTS
. detection activities and provide supervised
to coordinate all these into the single
■
egy in Peru.
treatment free of charge, it was necessary
organizational plan which is so essential.’”k
s lubciculosis Control Programme is
Obstinate individualism is the enemy of
to ensure a continuing supply of labora
d on the following strategic principles:
cooperative success.
tory equipment and drugs, train and
motivate
health workers, form
sustained political, technical and
multidisciplinary teams, and establish
1 hese are some of the great challenges
financial commitment to ensure the
which remain. But I am deeply encouragcc
viability of the programme;
by the challenges which have already been
combining the approaches of public
Each patient who obtains timely and
overcome. It gives me hope that these
health and individual care;
effective treatment saves up to 15 others
others will in due course be dealt with
from infection. Put negatively, each
enhanced management capacity at all
effectively. I am also immensely encour
untreated case produces up to 15 others.
aged by the quality (but not yet the quan
i- veis of responsibility;
tity!) of international expertise now
egrared activities at all health faciliavailable through WHO and IUATLD,
fiom health outposts to hospitals;
^ood iclations with the community.
,
and by the ongoing support of tuberculo
O
Differences
of
language,
culture
and.
Q
<
scientifically
sound
and
effective
sis control by the World Bank.
leehnology which is also affordable and
behaviour have presented difficulties.in
•ivccp
•
^vcptable
table
to
the
population
in
which
it
some
parts of the country, often it) th<P
Finally, I do congratulate Dr Kochi on hi*
i'*
used;
form
of
patient resistance to diagnosis and
balanced, yet hopeful, article on progress
ticatment.
This obstacle is gradually beitk’
community participation in disease
in attempting to control one of the world
overcome
in
the process of establishing
mi \ cillance and control activities.
outstanding medical challenges. For the
and
expanding
the programme.
last 40 years the problem has been theo
1 important consideration for the Proretically soluble. Now at last there is sonw
The achievements of implementing the
hope that in the next 40 it might actually
! ime is that each patient who obtains
stratcgy can be summarized as
be solved, or at least be on the way to
■r \ and effective treatment saves up to
follows.
being solved. How much misery and
lets fiom infection. Put negatively,
death, and how much unneccssaarv ex
- untreated case produces up to 15
a During 1996, diagnosis and treatment
’JR • 1 he control of this disease is thus
penditure, could be avoided! £3
were provided free of charge to 47438
IB patients. In the same year, the TB
morbidity rate was 198.1 leases per
^ez A. is the D.rector of the National Communica100 000 people, which represents a^op
l-ease Control Programme. Ministry of Health Av
of 22.6% since 1992. Of the cases£J
•■•'ry. Cda 8 s.m . Lima. Peru
IS^
detected in 1996, 26 800 were smear
positive, winch means a rate of 1 1 1.9
per 100000, which is 30.5% lower than
in 1993.
E In 1990, only 25% of the public health
facilities carried out TB control activi
ties, whereas by last vear 97% offered
public access free of charge to dLigiiQsis
and treatment.
A .
I
•
I
□ The number of laboratories in the
country with personnel equipped and
trained to recognize tubercle bacilli in
sputum smear samples increased by
132%, from 425 in 1991 to 987 in '1996.
The number of intermediate laborato
ries, in which the smear culture is made,
more than tripled during the same
period. The number of smear samples
analysed rose from 211 000 in 1990 to
1 164198 in 1996.
S In the 1980s, only 50% of the cases
detected completed treatment success
fully. In 1996 the average cure rate
nationalIv w-as over 90%.
In conclusion, despite the increased case
finding that has taken place during the last
six years, prevalence and incidence rates
have declined. The results achieved in Peru
show the epidemiological impact that can
be achieved with DOTS when it is cor
rectly carried out with sustained political
commitment, adequate financing and good
management. G
te
w
7
In Nepal it is the breakthrough
of the decade
Dirgh Singh Bam
^4£S^UJum^
- my opinion that D<)TS is die major
th breakthrough this decade in Nepal.
994. WHO and I lis Majesty’s Govnent conducted a joint review of the
\, \il National 1 ubcrculosis Programme.
\: hat time we had been using unsuper^d short-course chemotherapv for
.'out four years, covering 25 of the 75
~~ricts of Nepal. ATurrh-cr40 districts
>e<l standard 12-month chemotherapy,
xi K remote mountain districts had no
B treatment services. Although some
districts were achieving good results
v nl) with the assistance of international
governmental organizations), the
‘Hty had poor cure rates or could not
•
v any results of treatment. The na• al cure rate was only 40%, and \vc
-castcred only 30% of the patients estiated to be suffering from tuberculosis.
.
•
The question of whether DOTS is truly
the major health breakthrough of the
1990s has generated much discussiofTanr
comment. The first question that must be
answered is: “Is it a breakthrough?”,
presumably meaning a recent and signifi
cant advance. Dr Kochi’s summary of the
DOTS strategy is very useful, and shows
that DOTS is a strong management system
which combines two relatively weak
technologies - smear microscopy and
short-course chemotherapy - in one
disease control package. These tech nolo-~
gies are not new; it is the management^
package that is the main advance. Perhaps
the reason for the suggestion of a breaks her the next two years we worked hard
revise our National Tuberculosis Prothrough arousing such controversy is that
:
.imine.
\\ e adopted the policy of using
a managerial advance is less attractive ani
h
I
S,
established
national guidelines for
newsworthv than a technical one.
•< I logiammc. introduced a national
rung and recording svstem, developed
The second question is: “Does any otherg
‘giamine of training and supervision
intervention introduced during this decad:
afferent
levels of health workers, and
bring with it a greater potential benefit fo;
'''•■'.tdished
four
model demonstration sites
health than DOTS?” It is difficult to t®
>r
DOTS.
of either a managerial or a technical toolof comparable potential benefit in termsT'
numbers of lives saved, or of money sav^ moults have been spectacular: 86% of the
ewly diagnosed smear-positive patients
But, as Dr Kochi points out, so far these
gistcrcd in the DOTS centres were
are only potential gains. The actual ben
^car-negative after two months of treat
efits of DOTS have yet to be realized bin. We have just seen the first treatment
because few countries have adopted the:
strategy widely enough. Perhaps this is> ■•ukome results: 87% cured! This is a very
second reason for scepticism - that peopf -ci imaging result and one we are all
want to see more evidence of the benefit '?n cnsely proud of. This for me is one of
a cat benefits of DOTS that is perhaps
of DOTS.
i mentioned often enough: implement% DOTS, especially at the beginning,
:fkes a lot of effort and hard work, but
Dr Bam is Director of the National Tuberculosis CeFF
Results> are so encouraging. Health
New Thimi Bhaklapur. GPO Box 9517. Kathmandu^
Anrkers sec that they can make a differNepal.
cnee, that (heir work is of value, and that
lhev can be justifiably proud. I;or people
who arc used to working in developing
countries, talk of government health
workers being proud of their work may
sound a little farfetched but it is true.
F rom a situ a t io n_c h a rac t e r iz ed t w <) jr <?a rs
ago by scepticism and opposition to
DOTS,
DOIS, we have moved to one m which
For people who are used to working in
developing countries, talk of government
health workers being proud of their work
may sound a little farfetched but it is true.
everyone wants to do DOTS but we do
not have the capacity to train and supcr\ ise health workers fast enough to meet
the demand. Even so, we have now man
aged to expand the number of DOTS
centres to cover a population of 2.6 mil
lion, which is about 12% of the popula
tion of Nepal. Overall our national cure
rate has risen to 58% with an additional
16% of patients completing treatment.
W e are now diagnosing about 50T> of
the estimated new cases occurring each
vear.
We do face significant challenges though.
In our experience the DOTS model is best
suited to rural populations of relatively
high density with reasonable access to
centralized health services provided mainly
by the government. We have difficulties in
adapting the strategy to urban areas in
which the majority of TB patients are
treated in the private sector, and to hilly
districts w here the nearest health service is
as least four hours walk awav - sometimes
even several days — and there are no other
means of transport.
i
*
■9
I'■
■
In summary, DOTS is the health break
through of the 1990s in Nepal. There has
been no other single health-related inter
vention with the potential to produce such
an impact on health status so far this
decade. However, we are a long way from
realizing the full potential benefits of
DOTS and there are several significant
obstacles to be overcome m the future.
There has been no other single healthrelated intervention with the potential to
produce such an impact on health status
so far this decade.
Over the next few years we will need to
find ways of adapting this important
strategy to some of the more difficult local
conditions in Nepal. 0
The view from World Vision
Milton B. Amayun
World Vision recognizes that tuberculosis
today is an old scourge with a known
cure. Health workers have known for
years that, apart from its being curable, its
spread can be contained through a combi
nation of preventive and curative meas
ures. Yet tuberculosis continues to
contribute significantly to the disease
burden of several countries. Why? Because
there are poor people who have no access
to the drugs that could cure them, and
there are countries whose health systems
do not have adequate resources to support
a comprehensive TB control programme.
P_r_Afnayun.is Co-Director, International Health Pro
grams, World Vision Relief'and Development. 220 "I"
Street NE 270, Washington. DC 20002. USA.
fhe most important battle related to
DOI'S will not be between the drug and
the disease, but over resources. Govern
ments must recognize the long-term
economic benefits of investing m control
ling this disease. 1 nternational donors mu$
maintain and perhaps expand their current
funding of TB control. The political and
financial support of the public must be
mobilized. Ministries of health must
designate and train human resources to
pursue case-finding and observe the treat
ment of individual cases up till the corner
pletion of the recommended regimen.
isc of the rising prevalence of tubcrcu.•'■s among the poor and the excluded in
\\ stern societies, and the danger this
k resents for other groups in the form of
J: g resistance resulting from unsupcr.ixud care. DGIS has been effectively
■marketed” and the media have been
csponsivc. We must not miss the oppor-uniiy this has given us to strike a decisive
'low against this killer of children and
,
large-scale implementation in some coun
tries. DOTS offers a means of bypassing
conventional hospital-based treatment
which entails high individual and public
costs. Furthermore, DOTS tackles the
risks of low cure rates, continuing spread
of the disease from infectious cases, and
the drug resistance associated with the
yardier experimental
—----avoided extended confinement of patients.
’.JllltS.
\\ orld Vision has invested in TB control
• many parts of the world. In Haiti we
'■a"ded the Crusade against Tuberculosis, a
The fact is, to cure tuberculosis is not
onwide control programme. Our
cheap. A conservative estimate tor cnsuig Ci Id Survival programmes around the
ing that a patient receives the full directly
rid target the newborn for immunizaobserved treatment short course is .
non with BCG. We are currently explorUS$200, an amount beyond the reach of
:ig a multicountry strategy in Asia to
the many countries that allocate less than •mplement DOTS as part of our area
S3 per capita for all health services perfiZ ic\ clopment programmes. As an organizayear. In this era of budget cuts the alloca*
on we arc committed to making the
tion of scarce resources has to be weigher CO 1 S strategy a long-term effort rather
against other development priorities, ofc man a passing fad. We join ministries of
cven equally deserving health programme- ■’■ualth, international funding agencies, our
mi ate donors, communities and WHO in
The effective control of tuberculosis will ■ih current big push to promote it. We
also not take place within the time frame 'la i to be there until the disease can no
for which most donors normally provide
'i ger be called a deadly scourge.
funding. The impact of AIDS, the preva
lence of chronic cases and the existences
resistant TB bacilli indicate that it will uv
a whole generation, maybe more, to
4 good start
achieve worldwide control. Enough do
nors must be convinced that they need g Mmuel Lieberman
support DOTS over the long term perhaps for as long as tuberculosis confL
tinucs to be a disease of public health—gz
Kochi’s article provides a good I account
significance.
hy DOIS has generated intert
interest
:|h> ng those concerned with TB control
The DOTS strategy is not new. Directly •nc prevention, and why this approach has
'Vii adopted for additional trials and even
observed treatment was the norm when
the hospitalization of patients was still
seen as an essential part of TB controUt :
••H ;eberman is Country Sector Coordinator (Human
has been given new life now partly be^ : -■••opment). World Bank. Jakarta. Indonesia.
At the same time. Dr Kochi’s article hints
at how formidable an effort mav be re
quired to put in place and sustain DOTS
programmes, and what other policy steps
may be needed to complement DOTS. His
article acknowledges that assembling the
key elements of DOTS - namely a net
work of well-trained and carefully super
vised workers in the field, fully equipped
laboratories with trained staff, good
record-keeping and monitoring, and a
dependable and ample supply of highquality drugs - requires substantial re
sources and long-term policy
commitment. Clearly, a major effort is
entailed, which may have to go well
beyond the “modest investment’’ Dr
Kochi refers to.
What are some of the obstacles which
:
DOTS programmes must contend with,
and what can be done about them? First,
there may be problems in fitting DOTSrelatcd activities into existing primary
health care programmes, assuming that
such delivery “platforms” are available to
be used. DOFS may become another
unprioritized task added to the burdens of
multipurpose workers who were already
over-extended. These field staff, and their
laboratory-based colleagues, mav either
resist such additional burdens or divert
attention from other key activities; they
may also dcmancEincentive or service
payments to carry out their assignments.
I
r
E
i
5
\Hi5Mna«5a5SSS5KiI?5MM(SSlB®»i^^
s-T.TTjtwiy.T.
ULLuytyiuaiyuc research is needed
to sec how DO I S is being accommodated
in actual situations, what problems and
trade-oils arc arising, and how these arc
being resolved. In short, detailed informa-
Clearly, a major effort is entailed, which
may have to go well beyond the “modest
investment'' Dr Kochi refers to.
tion is needed on how DOTS is actually
working in different settings, and the
mechanisms which must be established to
make this approach effective.
T
A different set of concerns arises where
functioning and well-used primary health
caie systems arc not in place. In these not
unusual circumstances drugs may not be
widely available, the pay, skills and morale
of staff in public facilities may be low, and
the quality of care offered by private
pioyidcrs may be substandard. Here the
feasibility and affordability of DOTS
would be likely to depend on the charac
teristics of the broad health system reform
which may be under wav or resorted to
c\ entually. Reform programmes usually
involve:
- greater decentralization of health deci
sion-making, financing and delivery;
- rethinking of the roles of public and
private providers in health;
- and greater reliance on regulatory
mechanisms.
It would be useful to look at the implica
tions for DOTS strategies of the different
paths to health system reform being
chosen.
A related set of challenges for DOTS
-jxises-ou-t-of-the need to involve prrvrrte
providers. As noted, t. iunctionmg
publicly run care s\sicni that is taken for
granted in many presentations of the
DOIS strategy ma\ be an unreachable
ideal. In many if not most developing
country settings, patients with tuberculosis
typically visit private providers, who also
need the skills and incentives to deliver
high quality care. I'ortunatciv. Dr Kochi
a,lcUns colleagues in the Global Tuberctnhosts Programme have launched ingenious
efforts to train and mobilize private pro\ idci s, including schemes to franchise
delivery of DOTS and to license private
micioscopy laboratories. 1 hesc initiatives
should be pursued and widened becauseof
the likelihood, in \ icw of the health re
forms cited above, that the “normal"
context for DO I S strategies will be pri
vate services with some opportunities for
regulation and guidance.
counts in the medium term is
;k extent to which subnational dccisionn. xcrs are authorized and assisted to
’gnizc and respond to local health
v. ritics. In short, what will make DOTS
AC k is awareness locally that tuberculosis
' ‘l ’1.L!KC Pr°bKm and the conviction that
JO 1 S is an adaptable and sustainable
/spouse to it.
a i at icallx
Ji Kochi acknowledges the limitations of
:KUS and the need to develop better
strategies and tools. While large-scale trials
‘f the feasibility and affordability of
.H IS go ahead in different countries, it is
v utant that work should continue that
\i cad to new diagnostic tools, cheaper
h less risky drugs, and eventuallv a
.kcine. ■
Another issue with DOTS is neglect of
demand-side considerations. DOTS has
4 great deal more is needed
compiised a classic supplx -side response
: 'riony Harries
to a public health concern, with little
attention to how tuberculosis is perceived
and conceptualized or to the \arious
DOTS strategy for tuberculosis
determinants of patient compliance. Thisi'
i
ol is one of the most important
changing as the Programme is testing way?
ih
breakthroughs in the last 30 rears,
of involving communities in providing
■D
from
the perspective of sub-Saharan’
DOTS. Initiatives, including a World"
'Inca
it
might
well be the most important
bank-assisted project in India, arc under
icakthrough of the 1990s. As the main
way to assess stakeholders' views on
tuberculosis and on DOTS itself.
’ ■’iicle explains, DOTS is a strategy which
'corporates targets, a control policy
ickage and key operations which should
Finally, Dr Kochi stresses the importance
'
undertaken bv a national tuberculosis
of political commitment to implementing
'"gramme.
DOTS is a catchv name, and
DOTS. 1 his is a key point. But it is won!
npy
health
care workers in sub-Saharan
noting that such commitment must be
1
w,
ll
be
familiar with it. However
strong not only at the senior levels among
'"I
12%
of
global
TB cases arc treated5
policy-makers and others concerned with
'
•
>OTS,
which
implies
that there must
health outcomes, but also at the district
level and below’. In fact, given the multi
plicity of priorities and legitimate needs
that health officials have to grapple with?
- Harries is the ODA-Malawi TB Project Adviser. British
• • Commission. PO Box 30042. Lilongwe 3. Malawi.
240
,-
T
R|
f
be some inherent difhcultie.s preventing its
widespread and rapid adoption bv all TH
programmes in the world. 1 will discuss
some of the difhcultie.s which are encoun
tered m countries .with a high prevalence
of HIX infeetton in sub-Saharan Africa.
■ 1 he targets lor cure rates and detection
fat cs a re dil ficu 11 t o - h-iVC u. c ra t cs of
SD% in smear-positive TB cases arc
almost impossible to achieve because of
high HIV-related mortality. The detec
tion target of 70% of smear-positive TB
cases is also impossible to achieve
because-a method of estimating the
total of such cases has not vet been
found.
i
I
!}
|v
EI
1 he DO I S strategy is vitally dependent
on countrywide laboratory services
with accurate sputum smear
microscopy. In poor countries, labora
tories •may be deficient in both human
and material resources, supervision mav
be almost non-existent and there is
often no systematic form of quality
control. Clinicians entrusted with ’
patient care tend to believe anv sputum
smear result, positive or negative, that
appears on the sputum test request
form, and order treatment accordingly,
if laboratory accuracy is low the TB
control programme can be compro
mised, not least because smear-positive
B cases wrongly diagnosed as smear
negative paucibacillary tuberculosis
may receive insufficient treatment.
H A kev component of DOTS is the use
of short-course chemotherapy, for at
least all smear-positive TB cases. Ini
tially it was widely perceived that the
high costs of nnti-tuberculosis drugs
such as rifampicin and pyrazinamidc
precluded their use in poor countries,
unless donor support was available.
However, since 1994, the prices of anti.tubcrculo:
tuberculosis drugs (particularly
" Ji
I
I
o
w. O' J : .
! 0C
3
O
■.:
f £
flBBOBRVfa
_
. •
rifampicin and pyrazinamidc) on the
international market have fallen consul
crably, and short-course chemotherapy
is now cheaper than some standard
treatment regimens which use strepto
mycin, isoniazid and ethambutol.
If laboratory accuracy is low the TB
control programme can be compromised,
not least because smear-positive TB
cases wrongly diagnosed as smear
negative paucibacillary tuberculosis may
receive insufficient treatment.
: f
fe—
SRC.-;.
Ministries of Health could therefore
take on more responsibility for pur
chasing these effective drugs, relying
less on donor support. However, in
many countries there is still the percep
tion that some anti-tuberculosis drugs
are too expensive and there is little
appreciation of what cost-effective
treatment actually means.
Q With DOTS, all doses of rifampicin
should be directly observed. In the pre
HIV era, TB case-holding was often
carried out in hospital wards, and this
had the advantage that it was easy to
administer rifampicin directly to a large
group of patients and to monitor treat
ment response. With the huge upsurge
of TB cases in areas of high HIV preva
lence, case-holding in hospital wards is
becoming impossible because of over
crowding, and there are moves to
decentralize treatment to peripheral
health centres and the community. This
is a patient-friendly approach. How
ever, the logistics of observed drug
administration, supervision, monitoring
and recording in the community arc
daunting (although not impossible), and
anv scheme of decentralisation needs to
....
....
......
.uix good quality control must be devised.
\i mpts must be made to reduce the high
r of mortality during treatment. Above
LI One of lhe stated benefits of DOTS is
the Global Tuberculosis Programme
the number of adult lives saved. How
•mst continue to lead the way in calling
ever, HIV-related illness undoubtedly
more resources for ITS control.
has a negative impact on this benefit. In ; rained and motivated manpower, equip
HIV-positive smear-positive 'TB pa-~^ ment for diagnosis, uninterrupted drug
tients, high death rates mean that
.-applies and transport for supervision do
treatment is less cost-effective in terms, •io! come cheap, and governments need to
of years of life saved than previously
>e persuaded that these measures arc
calculated. Before the advent of HIV,
a o: thwhile.
smear-negative paucibacillary tubercu-y
losis was a disease whose treatment had < k d breakthroughs come as a result of
a good outcome, even without chemo*- :n vation, hard work and commitment.
therapy. Experience is slowly accumu ;!ioe must be maintained from the top to
lating in sub-Saharan Africa to show
iic bottom, from WHO headquarters to
that HIV-positive smear-negative TB "
ic district health centre and’ commumtvpatients have a much worse prognosis7- ised guardian entrusted with drug supcrthan those who have smear-positive
^ion, if DOTS wishes to keep its high
tuberculosis. Yet these patients arc
.'sition in the hierarchy of effective
ignored in the DOTS strategy despite
cal th care interventions. S
the fact that their numbers arc high,in
some countries exceeding the numbers
of smear-positive TB cases. Smear
negative TB cases are not followed up
Sue ;ess is possible but it has to be
and are often given treatment inferior
'oik ht for
to that given to smear-positive TB
carefully monitored in case there is loss
of control.
cases.
HIV-related tuberculosis is a major prob
lem in sub-Saharan Africa, and in the next
few years will assume similar importance
in India and South-East Asia. The DOTS
strategy, undoubtedly very effective in
predominately HIV-negative environ
ments, must adapt to the challenges posei!
by the HIV epidemic if it is to maintain^
credibility in these areas. Ways of deter
mining the TB case rate must be found,p
that the 70% detection rate target has
some meaning. The issue of smear
negative paucibacillary tuberculosis must
be tackled. Community care schemes nWbe rigorously piloted and evaluated. Way*
of cnsurinti accurate smear microscopy
F. Broekmans
ibcrculosis remains one of the world’s
ajor public health challenges with more
'.an two million (mostly young) adult
<aths a year. The scale of the problem is
-ch that in 1993 WHO was forced to
•vclare tuberculosis a “global emergency”,
a t.’ie public health community this acted
■' a : eve-opener regarding the magnitude
' H e problem but did not yet result in
c political and professional response
'vded to deal with the problem.
-■ e-xmans is Director of the Royal Netherlands
.. osis Association (KNCV). Riouwstraat 7.
.....
After die Second World War most indus
trialized countries successlullv moved
from high to low tuberculosis prevalence
in little more than a generation bv effec
tively treating infectious cases in wellestablished tuberculosis networks. Most
countries m Africa, Asia and Latin
America, however, were unable to follow
suit. Numerous field studies have shown
that the failure to cure infectious cases
under the insufficient programme condi
tions prevailing in most of the world is the
mo$t important reason tor tuberculosis
still being endemic worldwide. In most
countries overall treatment success rates
do not exceed 30%-50% of detected cases.
Lhe world now has to pay a high price for
its negligence in controlling the disease
over the past decades. In the wake of HIV
transmission tuberculosis becomes increas
ingly epidemic. Poor programme perform
ance has increased drug resistance, and
increased migration from countries where
prevalence is high has a substantial impact
on case rates m those where it is low.
A rigorous application ol the DOTS
strategy, focusing available manpower and
resources on successful treatment delivery
makes it possible to cure eight out of 10 3
detected cases in Africa and nine out of 10
detected cases in Asia. We present evidence
from national tuberculosis programmes in
three countries in Asia and five countries in
Africa that have received support from the
Royal Netherlands Tuberculosis Associa
tion and other sources over the past decade
(see Tables 1 and 2). Table 3 demonstrates
that the DOTS strategy is not a dogmatic
“one way only” approach, but a flexible
system, which is highly adaptable to the
health environment of a particular country.
Tables 1 and 2 also show that effective
programmes are possible despite the lo\y>
per capita income of the countries
'
..................... .1
' )
.
i
X
i
u
4
o
»Alui >» niXlf
nnnrwri
Txcrrai.iuTi ex a
•n/c^/5 control
'"UufU.
fable /
Successful national programmes in Africa up to 1994
<//, sssful national programmes in Asia up to 1994
Case management (new infectious cases)
Tanzania
(since 1982)
5
r
T2
Malawi
(since 1984)
Benin
(since 1984)
Gambia
(since 1988)
Kenya
(nomads since 1986)
(NTP since 1993)
Case
Toll
Number evaluated
Success (%T
Died (%)
Failure (%)
Absconded (%)
Tianslerred out (%)
97450
79
8
1
7
4
35893
78
12_
1
4
4
11016
79
5
2
12
1
4087
71
5
1
15
8
11 146
86
5
0
6
2
Total(°o)
79
8
1
7
4
100
100
100
100
100
1®
_■
China
(since 1991)
Viet Nam
(since 1988)
103686
94
2
49407
89
3
2
2
uvamated
>S (%)
• :. ,>)
■
(%)
idea (%)
i md out (%)
1
0
100
Case management (retreatment cases)
Tanzania
(since 1982)
V ;
Tl"v
Benin
(since 1984)
Gambia
(since 1988)
Kenya
(since 1986)
Toll
364
77
8
2
6
7
128H
74
10
3T
3
7874
73
10
3
11
4
3262
78
13
1
5
3
1277
73
7
4
14
3
39
59
15
0
10
15
Total (%)
wo
100
100
100
100
3
Our experience, however,Indicates that
success is never guaranteed. It has to be
Total
2
2010
93
2
1
1
3
100
100
100
Sulawesi (Indonesia)
(since 1993)
: ■' evaluated
Total
■m%)
.
«)
China
(since 1991)
Viet Nam
(since 1988)
93992
87
4
6941
79
5
10
3
4
100
• 1%)
.led (%)
••ed out (%)
IOC
ciiirtrirfi t
Source. National tuberculosis programmes
In these countries the DOTS strategy
c
is a
major health breakthrough. Ini our opinion
it could become so in most countries,
piovided DOIS is accepted as the strategy
of the national programme. For its effeetive implementation, directly observed
treatment for all infectious cases should be
ensured, especially in the initial phase of
tieatment, and monitored closely by
bacteriological examination. Curing infec
tious cases reduces mortality and at the
same time curbs transmission. Few other
health interventions possess such a formi
dable double-edged weapon.
Sulawesi (Indonesia)
(since 1993)
155103
93
n
2
2
1
X
Case management (retreatment cases)
Malawi
(since 1984)
Number evaluated
Success (%)
Died (%)
Failure (%)
Absconded (%)
Transferred out (%)
management (new infectious cases)
2
0
100
46
85
4
4
100979
87
4
0
100
2
1
100
•'Ciilc.'-'S progiar:■•■;>•>
‘ I
c-
o
fought for in the context of the national
programme itself. Weak political commit
ment, poor programme management and
insufficient capability to carry out directl’
observed treatment are important limiting
factors. Under such conditions, treatment
success remains unsatisfactory, and infec
tious cases become chronic with the
danger of systematically introducing dru£
resistant tuberculosis on a wide scale. In
one country this sobering experience
it necessary for us to withdraw our long*
term commitment to strengthening the
national programme. The poor treatment
success rates underlying this decision-arc—
presented in Table 4. At a recent technics
ad\ isory committee an outside observer
■Ul “\X’h . arc some societies apparent^procedures, is of
ill ng to ttolerate a high burden of disease
great importance. It mav)
that "ben HIX
• ,be expected
* T."...........
•m tuberculosis?” It i
prevalence
is a question that
levels off, tuberculosis incidence will stop
’vn has to be dealt w ith before effectivc
’loii can be taken.
omntries with well-established pro’•nmes two developments pose a par'll|4rly tough challenge to maintaining
ss. 1 list, HIX transmission pushes
culosis incidence upwards, leading, in
• countries in Africa, to doubling (or
' > of the case rates. This severely
etches the capacities of these pro■•’nnies to deal with the increased case11 s- Inci eased staff and resources, to
strict adherence to the bacteriologi-
,
0<
□ ■
I
Our experience indicates that success is
never guaranteed. It has to be fought for
C°nteXt 0/ lhe national Programme
I toe II,
increasing and then decrease if
an effective
control programme remains in
place.
Second, health sector reforms
are sometimes dogmatically focused on
decent ralization and integration. In such cases "t'h.w
Table 3
Case management of infectious patients in different countries
Africa
-‘AS-" -
Country
Treatment regimen
Supervised intensive phase*
Continuation phase**
Tanzar;:<
2SHRZ/6HT(E)
Rural' hospitalization
Urban supervised ambulatory treatment
Sell-administered treatment
-Maiaw;
2SHRZ/6HT(E)
Rural, hospitalization
Urban: supervised ambulatory treatment
Hospitalization
Sett-administered treatment
Self-administered treatment
Supervised ambulatory treatment at village
level
Supervised ambulatory treatment g
village level
Seit-care unit with extended intensive
phase of treatment
Self-administered treatment
Benm
2SHRZ/6HT(E)
Gamt^
2S.H.R.Z74R.H;
2SHRZ/2HRZ/3TH
Asia
i
•r: -
7 ‘ '
Country
Treatment regimen
Supervised intensive phase*
Continuation phase**
c^->
2SHRZ/4HR
ievery other day)
Supervised ambulatory treatment at village
level
Supervised ambulatory treatmentf
village level
2SHRZ/6HE
Urban: supervised ambulatory treatment
Rural- supervised ambulatory treatment or
hospitalization
Self-admimstered treatment
2EHRZ/4R.H.
Weekly supervised ambulatory treatment
at village level
Self-administered treatment,
bi-weekly supervised
,'ir.
S-
> of an effective and coherent national
lamme, such as regular supervision
errupted supply of drugs and a strict
.■ itoring of programme performance. A
.. established control and surveillance
•.:i at the Ministry of Health, as well as
, ntihable and accountable staff at intervdiatc and district leVcl are indispensable
; effective application of the DOTS
i.uegy.
k
.
have witnessed the dire state of tubercu< control in Kenya and the United
-.ui bhc of Tanzania in the late 1970s, in
. Nam in the mid-1980s, in Indonesia
i c late 1980s, and in China in the early
before the modern tuberculosis
■mrol policy was introduced. I was
A lleged to witness the way in which the
'CIS strategy subsequently rcvolution-
ized tuberculosis control by successfully
curing the great majority of infectious ’
cases in these countries. In China an old
pioverb about tuberculosis says “ten get it.
The old proverb “ten get it. nine die" has
been replaced by "ten detected, nine
cured".
nine die . I he DOTS strategy reversed
thi> truth: now it can he “ten detected,
nine cured”. In view of the more than two
million deaths occurring yearly worldwide, wider application'of this strategy
won d constitute a major public heart’ll
breakthrough, towards solving one of the
most devastating infectious disease probivms that remain in the world today. S
■" ng al 2 months
.'ing at 4 and 6. or at 5 and 8 months
0
Example
e poor national programme
Case management (new infectious cases)
w
Rfi I
Year
Total
Success
Died
Failure
Absconded
19o2---r?
1963
915
(47%)
122
(6%)
5
(0%)
753
(38%)
•779
168
(9%) ~
790
(44%)
92
(5%)
17
(1%)
763
(43%)
117
(7%)
i'42
1705
(46%)
214
(6%)
22
(1%)
1516
(41%)
285
(8%) -
Transferred ft-
DOTS in the Western Pacific
PaC’llC1 ^l0n has
control is being strictly implemented itmughttteWHO^obc^ack^
by 30%
" T'^
pealth report 1997 Conquering suffer,n/T
(■ uninc] iijrriamty Geneva. World Hr-.-uth nrXo,-,.
r
ass
The State ot World Health
The World Health Report 1997 Conquering suffering, enriching humanity
;i7/ es of death, developed and developing world. 1996
Developed world
(including economies in tronsition)
(151) 1.2 |
i
Diseases of the
cifculatory system
MBs*
Cancers
(2 544) 21.0
Perinotol ond
neonotol couses
(119) 1.0
Moternol
couses
(3)0
I
I i
i I I : 1
I
50 45 40 35 30 25 20 15 10 5
Percentage
r
0
4.8 (1 909)
9.1 (3 626)
1.5 (582)
Other ond
unknown couses
(2 798) 23.1
24.5 (9 778)
9.5 (3 802)
Diseoses of the
respiratory system
(979) 8.1
This self-contained, concise and analytical publication is the
third in a series of annual reports. It provides an assessment of
world health status and needs, and recommends relevant
priorities for international health action to meet those needs, as
well as reporting on WHO s contribution towards improving the
world health situation. The world health report 1997 focuses
on chronic diseases and gives an overview of WHO's work
during 1996 (1).
Infectious and
parasitic diseases
Developing world
(including least developed countries)
~
ggp 7J (3063)
I
i I I I
I I
! I I f
0 5 10 IS 20 25 30 35 40 45 50
Percentage
0 Figures in brockets refer to the number of deaths in thousands.
-.4
Dramatic increases in life expectancy,
combined with profound changes in
lifestyles, will lead to global epidemics of
cancer and other chronic diseases in the
next two decades. The main result will
be a huge increase in human suffering
and disability. There is an urgent need
to find wavs to reduce that coming
burden.
Health expectancy can be defined as life
expectancy in good health, or the average
number of years an individual can expect
to live without major health problems.
Such a concept is needed since longer life
in itself can be viewed as a penalty rather
than a prize if it is likely to involve a
longer time of suffering from a chronic
disease.
Half a century ago, most people died
before the age of 50. Now, the great
majority live well beyond that age. Global
average life expectancy at birth reached 65
years in 1996. However, while extending
our life span is a desirable goal in itself, it
is much more so if it can be accompanied
by freedom from additional years of
suffering poverty, pain or disability.
Unfortunately, for many millions of
people, there is as yet no such freedom.
The quality of human life is at least as
-important as its quantity. Individuals__are_
entitled to be concerned not so much
about their life expectancy as their health
The health transition
As shown in The leovld health report
-fighting disease, fostering development,
infectious diseases kill about 17 million
people a year and afflict hundreds of
millions of others, particularly in the
developing world. In the industrialized
world, infectious diseases arc well under
control. It is noninfectious diseases particular^’ cancer, circulatory diseases,
mental disorders including dementia,
chronic respiratory conditions and j;;musculoskeletal diseases - that now po*
the greatest threat to health in develop^
Fi.’.iy These are cssentid-
. diseases that strike later in life and
\ h, as life expectancy increases, will
> me more prevalent.
nic diseases arc responsible for more
24 million deaths a \ car, or almost
: of the global total. The leading causes
circulatory diseases, including heart
. ase and stroke, cancer and chronic
'iructivc pulmonary disease.
' hie expectancy in developing countries
1 increases, so docs the prevalence of
■a.’ses that are more common among
‘' Ci age groups. Already, the outlook for
individuals in the developing world
h i if they do manage to survive the
<" infections of infancy, childhood and
■Uiritv, they will become exposed in
'’-<t life to noncommunicable diseases.
This situation is known as the “epidemiological transition” thc changing pattern
of health in which poor countries inherit
the problems of the rich, including not
merely illness but also the harmful effects
of tobacco, alcohol and drug use, and of
accidents, suicide and violence. It is also '
referred to as the “double burden”, beT
cause of the continuing weight of endemic
infectious diseases. Increasingly, health is
influenced by social and economic circum
stances over which the individual has little
As life expectancy increases, so does the
prevalence of diseases that are more
common among older age groups.
control, and over which the conventional
health sector also has little sway. As a
result, iriaiiyT3untries are now experienc
ing a widening gap in health terms ,
between rich and poor.
z x
'pi a-
■
Thorax Online dick here
The Journal of the British Thoracic Society
BMJ 1997;315:1407-1411 (29 November)
l-mail this article io al;
Papers
Respond to this article
Comparison of cost effectiveness of
directly observed treatment (DOT) and
conventionally delivered treatment for
tuberculosis: experience from rural South
Africa
Rrkited articles in_PubMcd
Pub Med citation
Download to Citation Manacci
Search Medline for articles by:
Floyd, K. || < iiIks. (
Alert me when:
New articles cite this article
Katherine Floyd, lecturer in health economics^ David Wilkinson, specialist scientist^ Charles
Gilks, senior clinical lecturer in tropical medicine a
a Division of Tropical Medicine, Liveipool School of Tropical Medicine, Liverpool L3 5QA, b Centre for
Epidemiological Research, South Africa (Hlabisa), Medical Research Council. PO Box 187, Mtubatuba 3935, South
Africa
Correspondence to: Dr Gilks gilks@liveipool.ac.uk
lop
Introduction
Subjects a 11 d met hod: s
Results
Discussion
Ret ere nces
Abstract
Objective: To conduct an economic evaluation of directly observed treatment (DOT) and
conventionally delivered treatment for the management of new cases of tuberculosis in adults.
Design: Community based directly observed treatment, which has been implemented in the
Hlabisa district of South Africa since 1991, was compared with a conventional approach to
tuberculosis treatment widely used in Africa. Each was assessed in terms of cost, cost
effectiveness, and feasibility of implementation within existing resource constraints.
Setting: Hlabisa Health District, South Africa.
Subjects: Adult patients with new cases of tuberculosis on smear testing; the number of cases
increased from 20 per month to over 100 from 1991 to 1996.
Main outcome measures: Cost of case management in 1996, cost effectiveness in terms of the
cost per case cured, and bed requirements in comparison with bed availability for the 1990, 1993,
and 1996 caseload. Costs are expressed in US dollars at values for 1996.
Results: Directly observed treatment was 2.8 times cheaper overall than conventional treatment
($740.90 compared with $2047.70) to deliver. Directly observed treatment worked out 2.4-4.2
times more cost effective, costing $890.50 per patient cured compared with either $2095.60 (best
case) or $3700.40 (worst case) for conventional treatment. The 1996 caseload of tuberculosis
required 47 beds to be dedicated to tuberculosis to implement directly observed treatment,
whereas conventionally delivered treatment would have required 160 beds; the current number of
beds for tuberculosis treatment in Hlabisa is fixed at 56.
Conclusions: Because of the reduced stay in hospital, directly observed treatment is cheaper,
more cost effective, and more feasible than conventional treatment in managing tuberculosis in
Hlabisa, given the existing hospital bed capacity and the escalating caseload due to the
HIV/AIDS epidemic. Such results may hold elsewhere, and wherever conventional tuberculosis
management is practised a switch to directly observed treatment will increase hospital capacity to
cope with a growing caseload.
Key messages
•
•
•
•
•
Tuberculosis is a problem of global importance, and the number of cases is rising as
a consequence of population growth, worsening poverty, and the HIV/AIDS
epidemic
Conventional approaches to management are increasingly difficult to implement,
especially when caseloads are rapidly increasing
This study found that community based directly observed treatment, a novel
approach to treating tuberculosis, was considerably cheaper and more cost effective
than a conventional approach entailing prolonged admission to hospital
Because directly observed treatment considerably reduces hospital stay, its
implementation will increase the capacity of hospitals to cope with a rising
tuberculosis caseload wherever the conventional approach is currently used
This South African model of directly observed treatment for tuberculosis is worthy
of serious consideration by policymakers and programme managers elsewhere
Introduction
Tuberculosis is a problem of global importance,1 and population growth,
Top
increasing poverty, and the AIDS epidemic mean that the number of
Abstract
reported cases continues to grow.2 ? Coping with this rising caseload is
Subjccis and met hod's
difficult: delivery of treatment is not straightforward, and successful
Results
programmes in Africa have typically relied on lengthy admissions to
Discussion
ensure patient compliance.- Given that already constrained resources
References
preclude either the construction of new wards or the hiring of additional
staff and that hospitals are already operating at or beyond capacity,?'' this approach seems to be
increasingly unviable. Other approaches to case management are urgently needed that can
achieve high patient compliance while being cheaper per patient and less dependent on hospital
care.
Community based directly observed treatment (DOT) is currently the standard approach to care
in the United States. Though expensive,7 it is probably less costly than admission, and high cure
rates have been achieved To evaluate whether directly observed treatment could be an attractive
economic option in a resource poor setting, we studied such a programme in Hlabisa district,
South Africa—one of the few sites in a developing country where it has been implemented. We
have previously reported the costs, cost effectiveness, and feasibility of implementing several
strategies within existing resource constraints/ In this paper we compared directly observed
treatment with the conventional approach that has been widely used elsewhere in Africa.
—---------------Top
Abstract
Introduction
Resiills
Discussion
References
Subjects and methods
Hlabisa is a rural district where the tuberculosis caseload has increased from 25 to over 100 per
month during 1991-6, largely because of the emergence of the HIV epidemic. In 1993, 35% of
adult patients with tuberculosis tested positive for HIV infection9; in 1997 the figure was 70%
(unpublished data). There are seven clinics and a district hospital, and the yearly income per head
is $1730 (£1081).—
Strategies
The two strategies were compared after diagnosis of new cases of tuberculosis in patients with
positive results on smear testing. Before diagnosis the strategies were similar.
Directly observed treatment has been described in detail elsewhere.'' After diagnosis, the time
patients spend in hospital is determined by their clinical condition and the time taken to arrange
community care. In 1996 the average length of stay was 17.5 days. While in hospital, patients
receive daily treatment with four drugs (isoniazid, rifampicin, pyrazinamide, and ethambutol)
and, with the help of field workers, identify someone who can supervise treatment after
discharge. The emphasis is on choosing a supervisor who makes accessing directly observed
treatment convenient for the patient. In 1995, 56% of patients were supervised by unpaid non
healthworkers, most of whom were storekeepers; 21% were supervised by health clinic staff;
21% by community health workers; and 2% by staff in tuberculosis wards. On discharge, field
workers transport patients to their supervision point in a hospital vehicle. Supervisors are given
the prepacked drugs required for completion of the six month treatment course. The drugs used
after discharge are the same as those given in hospital, except that they are given at higher dose
and are taken on an intermittent basis twice weekly. Patients therefore visit their supervisor twice
a week to take their drugs under direct observation, visiting on average 48 times. Field workers
visit supervisors monthly to check compliance, collect patient outcome data, and trace
absconders. A hospital doctor manages the programme.
Conventional approach—Patients stay in hospital for the first two months of treatment under the
conventional management strategy for tuberculosis. This lengthy stay is designed to ensure
compliance with treatment during the intensive phase (at least), when patients are most
infectious, and with some drug regimens is necessitated by the use of streptomycin. At discharge,
patients are given a one month supply of drugs, and they subsequently collect their drugs once a
month from their nearest clinic. Drug regimens vary, but we assumed that the six month course
recommended by the World Health Organisation would be used. This consists of two months of
isoniazid, ethambutol, pyrazinamide, and rifampicin, followed by four months of rifampicin and
isoniazid, with exact dosages dependent on body weight. Two sputum smears are examined at 2,
4, and 6 months.
Costing
' We assessed both average and marginal costs.13 We report average costs because they are a better
reflection of true variable costs and therefore of greater use for planners ^and^policymakers
concerned with national policy for a large number of facilities, such as a country's tuberculosis
control strategy.13 Costs were assessed from a societal perspective in United States dollars al
values for 1996.
Health system costs
For each strategy component except drugs, total annual recurrent health system costs for the
financial year 1995-6 were calculated using one or more of the following: expenditure files
which provided a breakdown for inpatient, outpatient, and health clinic care; the hospital payroll;
the rate paid by the ministry of health for vehicle usage; vehicle logbooks; and interviews with
staff. Gross salaries were used to calculate staff costs. Average drug costs per patient were
established by combining a costing of each regimen by weight category (using the hospital
pharmacy price list) with data from the tuberculosis register on the weight of patients.
Total annual capital costs were calculated using quoted 1996 purchase prices, reasonable
assumptions concerning expected useful life (5 years for a vehicle, 10 years for equipment, and
30 years for buildings), and a discount rate of 8% (the difference-betwcen the interest rare paid
on government treasury bonHsTand themflafion rate).
For hospital costs, 92.5% of the costs of administrative and support staff and of capital costs
were allocated to inpatient care and 7.5% to outpatient care, since staff involved in direct
outpatient care accounted for 7.5% of the total costs of staffinvolved in direct patient care. We
allocated 4.1% of laboratory costs (staff and equipment not used solely for tuberculosis work) to
sputum smear testing since smears comprised 4.1% of the total number of laboratory tests in
1995.
'y
Annual output data were for 1995—that is, the number of days in hospital; the number of visits
to outpatient departments, health clinics, and community health workers; the number of patients
receiving directly observed treatment for tuberculosis; the total number of patients with
tuberculosis; and the number of laboratory tests done. Sources included hospital admission
records, the medical superintendent, programme reports, and the regional laboratory manager.
For average cost calculations we assumed that visits to outpatient departments, health clinics, and
community health workers by a patient with tuberculosis would cost the same as visits for other
health problems. For spending a day as an inpatient we assumed that all costs (except those
associated with staff allocated to the tuberculosis ward, drugs, laboratory investigations, and x
ray examinations) would be the same for a patient with tuberculosis as for any other inpatient.
The cost of a visit for directly observed treatment was calculated by combining the cost per visit
with the pattern of supervision in 1995 as costs vary according to the site chosen for supervision
of treatment.
Patient costs
A questionnaire was administered to all patients eligible for treatment under the directly observed
treatment programme at the outset of the study (48 in total). The time and travel costs associated
with visits to hospital and health clinics were recorded. When different sites were chosen for
directly observed treatment, the time and travel costs incurred to visit them were also noted.
Time costs were translated into monetary costs using monthly incomes reported in a second
questionnaire (designed one week into the study and administered to the 35 original respondents
in the tuberculosis ward at this time). Calculations assumed patients would work 25 days a month
and 8 hours a day. Travel and time costs were then summed and average costs associated with
visits to hospital and health clinics and for directly observed treatment by specific type of
supervisory site calculated. The average costs of directly observed treatment by supervisory site
in 1995 were combined to calculate the average cost incurred by a patient per directly observed
treatment visit.
Community costs
Time constraints meant that the only data collected on community costs were those incurred
when patients were accompanied on hospital visits. These were comparatively small and were
included in the patient cost per hospital visit. Costs incurred by non-health worker supervisors
were considered to be nil because the time commitment was negligible and supervision creates
no additional costs for supervisors (unpublished data).
1
Effectiveness measure
We chose cure as the measure of effectiveness—the WHO’s criterion for measuring a
programme’s success.1' To estimate a best and worst case scenario for the likely effectiveness of
the conventional strategy, we analysed data on the outcomes of a six month cohort of patients
with positive results on smear testing in Tanzania in 199O10 and annual reports with detailed
outcome data from Malawi 1989-93 ' because these programmes used a similar case management
approach. For directly observed treatment we used data from the 1991-4 audits of the Hlabisa
programme.12 Cure is not routinely assessed bacteriologically in Hlabisa, but a retrospective
analysis of 109 patients found that 95% were cured.1' In this analysis, the rate of completion of
treatment was therefore multiplied by 95% to give an estimated cure rate. For consistency, the
same assumption was applied to the data from Malawi and Tanzania for the small number of
patients who completed treatment but for whom cure was not confirmed.
Patients who died or left the district during treatment were excluded from the analysis.
Differences in the death rate may reflect the varying impact of the AIDS epidemic. The
proportion of patients leaving the district during treatment is related to population transience.
Neither of these is a direct function of the tuberculosis programme itself, so omitting these
categories prevented unnecessary distortion of the analysis.
Calculation of cost effectiveness
Cost effectiveness was calculated in three steps. First, the proportion of patients who completed
treatment was multiplied by the cost of managing a patient up to the completion of treatment.
Second, the cost of a patient not completing treatment (calculated by assuming that default would 1 )
occur at hospital discharge) was multiplied by the proportion of patients not completing
.
treatment. Third, the resulting two costs were summed and divided by the cure rate.
c ,
Ij)]!
Abstract
Introduction
Subjects and methods
Discussion
References
Results
Directly observed treatment was considerably cheaper than the conventional strategy (table I). It
was 2.7 times cheaper for the health system, 3 times cheaper for the patient, and 2.8 times
cheaper overall. In both cases, health system costs accounted for 87% of total costs. Admission
to hospital was the most costly item. For directly observed treatment it accounted for 75% of
health system costs, 76% of patient costs, and 75% of costs overall; for the conventional
approach it accounted for 94% of health system costs, 88% of patient costs, and 93% of costs
overall. The only other important cost items were visits for directly observed treatment (14% of
the total cost of the directly observed treatment strategy) and organisation of supervision and
supervision of supervisors (5% of the total cost of the directly observed treatment strategy). No
other item—including drugs—accounted for more than 5% of total costs. ?')
View this
table:
[in this
window]
| in a new
window |
Table 1 Average health system, patient, and total costs in 1996 $
(percentages of total) for curing one patient of tuberculosis according to
management strategy
The data for individual strategy components (tables 2 and 3) showed that a day in hospital was
costly ($27.80 per day for the health system and $4 for the patient), as was an outpatient visit
($16.70 for the health system and $9.70 for the patient). In terms of time, a hospital visit cost a
patient five hours. Visits to health clinics and community health workers cost less. The different
drug regimens cost about the same, and sputum smear examination was a minor cost.
Table 2 Average health system costs (in 1996 $)
View this table:
[in th is window]
[in a new window]
Table 3 Average patient costs (in 1996 $)
View this table:
| in this w indow]
| in a new window]
The organisation of supervision and the supervision of supervisors were less expensive than
expected, at $38.90 per patient. Visits for directly observed treatment were also notable for their
low cost. Visits to non-health workers were cheapest, costing the health system nothing and the
patient just 35 minutes, estimated to equate to $0.30. On average, each visit for directly observed
treatment cost the health system $1.70 and the patient $0.45. Overall, the input of non-health
workers reduced the total cost of directly observed treatment by 26% from the health system's
perspective, by 53% from the patient's perspective, and by 31% overall in comparison with what
costs would be if health clinics alone were used for supervision.
Directly observed treatment based in the community was therefore inexpensive. In combination,
arrangements for supervision, supervision of supervisors, and 48 visits cost the health system
$120.50 per patient (equivalent to 4.3 days spent in hospital receiving treatment for tuberculosis)
and the patient $21.60 (equivalent to five days in hospital).
Directly observed treatment also seemed to use resources efficiently (table 4). At $890.50 per
patient cured, it was between 2.4 and 4.2 times more cost effective than the conventional
approach. Moreover, directly observed treatment was feasible within existing resource constraints
(table 5). Both strategies were possible in 1990, but in 1996 the increased caseload meant that
directly observed treatment was the only strategy that could be implemented without displacing
patients from other wards, reducing the quality of care provided, and needing extra investments
in infrastructure (and, probably, staff).
Table 4 Cost effectiveness of different case management strategies
View this table:
[in this window]
| in a new window]
View this
table:
[in this
window]
| in a new
indow]
Table 5 Numbers of beds available and required to manage patients with
tuberculosis in Hlabisa hospital according to management strategy
Discussion
Directly observed treatment is an attractive economical option in Hlabisa.
It is cheap, cost effective, and implementable within existing resource
constraints.
\bs trad
I n t rod net ion
Subjects and met hods
Results
This strategy is cheap because treatment based in the community that is
supervised by field workers is cheaper than lengthy hospital supervision of Relerences
care (all other cost items were insignificant in terms of impact on total
costs). This is also likely to be true elsewhere in South Africa because the costs of the major
inputs—staff, vehicles, and fuel—do not vary much; population densities in most districts are
unlikely to fall to the point where the costs of vehicles and fuel would become inordinately
expensive; and non-health worker input is considered acceptable by the Department of Health.
Even in very poor African countries, the cost of hospital care is unlikely to fall enough to make
directly observed treatment comparatively expensive. In Malawi in 1995, a day in hospital cost
$2.09 (13.3 times less than in Hlabisa), so 60 days in hospital would cost the health system
$125.40. On the assumption that health clinic and community health worker visits and field
worker and driver costs would also be 13.3 times less but that vehicle and fuel costs would be the
same as those in Hlabisa, 17.5 days in hospital, 48 visits for directly observed treatment, and field
worker supervision would cost $64.30 (36.60+6.10+21.60). Since the population density is
higher in Malawi than Hlabisa (93 v67 per square kilometre), 19
' " the cost of field worker
supervision might be cheaper still. Furthermore, the low cost of visits for directly observed
treatment suggests that if input by non-health workers were unacceptable and the costs of directly
observed treatment more than doubled, this strategy would still be cheap from the perspective of
the health system.
For the patient, in contrast, the acceptability of non-health worker input is critical. When this is
feasible, 48 visits for directly observed treatment will always be cheaper than 42.5 days in
hospital because the patient can choose a supervisor who makes access to treatment convenient.
Moreover, recent observation in Hlabisa indicates that the increased caseload secondary to the
HIV epidemic may be best absorbed through supervision by volunteers. (' When using non-health
workers is not acceptable and access to health facilities is limited, however, 48 visits for directly
observed treatment will incur large costs and treatment in hospital could be preferable.
The likely effectiveness of directly observed treatment elsewhere is harder to assess.
Nevertheless, a nearby district has found early success in implementing a similar programme (G
Dean, personal communication); and the programme in Hlabisa has continued to prove highly
effective even after management was no longer the responsibility of the programme innovator.
Evidence also suggests that contacts of patients with tuberculosis treated in the community are
not at increased risk of infection compared with those managed in hospital.
Wherever the conventional approach is currently relied on, a switch to directly observed
treatment will help to decongest hospitals and increase the capacity to cope with a growing
tuberculosis caseload and a more widespread increase in demand for hospital care. Indeed, with
the HIV related tuberculosis epidemic across Africa and limited extra resources for tuberculosis
control programmes, it may become programme managers' only option.
Acknowledgements
We thank the staff at Hlabisa District Hospital for their helpfulness and Xoli Mfeka (research
intern at the Centre for Health and Social Studies, University of Natal, Durban) for her help.
Funding: This research was done in partnership with and with support from the South African
Medical Research Council and the KwaZulu-Natal Provincial Health Department. It was
undertaken as part of the work of the HIV/AIDS research work programme at the Liverpool
School of Tropical Medicine, Liverpool, which is funded by the Department for International
Development. The department cannot accept responsibility for any information provided or views
expressed.
Conflict of interest: None.
Top
\bs tract
Introduction
Subjects and methods
Results
Discussion
References
1. Kochi A. The global tuberculosis situation and the new control strategy of the World
Health Organisation. Tubercle 1991;72:1-6.
2. Harries AD. The association between HIV and tuberculosis in the developing world. In:
Davies PDO, ed. Clinical tuberculosis. London: Chapman and Hall, 1994:241-64.
3. Harries AD, Mbewe LN, Salaniponi FM, Nyangulu D, Veen J, Ringdal T, et al.
Tuberculosis programme changes and treatment outcomes in patients with smear-positive
tuberculosis in Blantyre, Malawi. Lancet 1996;347:807-9. [Medline|
4. Murray CJL, DeJonghe E, Chum HJ, Nyangulu DS, Salomao A, Styblo K. Cost
effectiveness of chemotherapy for pulmonary tuberculosis in three sub-Saharan African
countries. Lancet 1991;338:1305-8.
5. Hassig SE, Perriens J, Baende E, Kahotwa M, Bishagara K, Kinkela N, et al. An analysis
of the economic impact of HIV infection among patients at Mama Yemo Hospital,
Kinshasa, Zaire. AIDS 1990;4:883-7.
6. Sawert H. Cost analysis and cost containment in tubercidosis control programmes: the
case ofMalawi. Geneva: WHO Task Force on Health Economics, 1996.
7,
Frieden TR, Fujiwara PI, Washko RM, Hamburg MA. Tuberculosis in New York City
turning the tide. N Engl J Med 1995;333:229-33.
8. -Wilkinson D, Floyd K, Gilks CF. Costs and cost-effectiveness of alternative tuberculosis
management strategies in South Africa: implications for policy. 5 A Med J 1997;87:451 5.
9. Wilkinson D, Moore DAJ. HIV-related tuberculosis in South Africa: clinical features and
outcome. S A Med J 1996;86:64-7.
10. Whiteside A, Wilkins N, Mason B, Wood G. The impact ofHIV/AIDS on planning issues
in KwaZulu/Natal. Pietermaritzburg: Town and Regional Planning Commission, 1995.
11. Wilkinson D. High compliance tuberculosis treatment programme in a rural community.
Lancet 1994;343:647-8.
12. Wilkinson D, Davies G, Connolly C. Directly observed therapy for tuberculosis in rural
South Africa, 1991 through 1994. Am J Public Health 1996;86:1094-7.
13. Floyd K, Wilkinson D, Gilks CF. Community-based, directly observed therapy for
tuberculosis: an economic analysis. Cape Town: Corporate Communications Division,
South African Medical Research Council, 1997.
14. Drummond MF, Jefferson TO. Guidelines for authors and peer reviewers of economic
submissions to the BMJ. BMJ 1996;313:275-83.
15. World Health Organisation. Treatment of tuberculosis: guidelines for national
programmes. Geneva: WHO, 1993.
16. Graf P. Tuberculosis control in high-prevalence countries. In: Davies PDO, ed. Clinical
tuberculosis. London: Chapman and Hall, 1994:325-40.
17. Wilkinson D, Anderson E, Davies GR, Sturm AW, McAdam KPWJ. Efficacy of twiceweekly treatment for tuberculosis given under direct observation in Africa. Trans R Soc
Trop Med Hyg 1997;91:87-9.
18. World Bank. World development report 1993: investing in health. Oxford: Oxford
University Press, 1993.
7
('ill 0
J> '/’O
■4))^ dimj
.f,^
^aAi ax^)
si
r
4>^JOct/
Cxjc^)
(iJa l)
l~^^J
C^h
(7^<yUL^/
L^jVU^i
I
y^bi
\As\^/) C*-')
JLt^
H
ji /Li^ve^i
(J or/ c''(^(-i.
zJah^i/
V’S- sr
A Cost-effectiveness Analysis of
Directly Observed Therapy vs
Self-administered Therapy for
Treatment of Tuberculosis*
William J. Burman, MD; Craig B. Dalton, B Med; David L. Cohn MD
James R. G. Buller, PhD; and Randall R. Reves, MD
Study objectives: To compare the costs and effectiveness of directly observed therapy (DOT) vs
self-administered therapy (SAT) for the treatment of active tuberculosis.
Design; Decision analysis.
Setting: We used published rates for failure of therapy, relapse, and acquired multidrutf
resistance during the initial treatment of drug-susceptible tuberculosis cases using DOT or SAT.
We estimated costs of tuberculosis treatment at an urban tuberculosis control program, a
municipal hospital, and a hospital specializing in treating drug-resistant tuberculosis.
Outcome meawree: Hie average cost per patient to cure drug-susceptible tuberculosis, including
the cost of treating failures of initial treatment
Results: The direct costs of initial therapy with DOT and SAT were similar ($1,206 vs $1,221 per
patient, respectively), although DOT was more expensive when patient time costs were included.
Wlrcn the costs of relapse and failure were included in the model, DOT was less expensive than
SAT, whether considering outpatient costs only ($1,405 vs $2,314 per patient treated), outpatient
plus inpatient costs ($2,785 vs $10,529 per patient treated), or outpatient, inpatient, and patients*
tame costs ($3,999 vs $12,167 per patient treated). Threshold analysis demonstrated that DOT was
less expensive than SAT through a wide range of cost estimates and clinical event rates.
Conclusion: Despite its greater initial cost, DOT is a more cost-effective strategy than SAT
because it achieves a higher cure rate after initial therapy, and thereby decreases treatment costs
associated with failure of therapy and acquired drug resistance. This cost-effectiveness analysis
supports the widespread implementation of DOT.
(CHEST 1997; 112:63-70)
Key words: cost-effectiveness; decision analysis; directly observed therapy; tuberculosis
Abbreviations: AST=aspartate aminotransferase; CDC=Centers for Disease Control and Prevention; DOT»directly
observed therapy; SAT=self-administered therapy
rIp he world is in die midst of a remarkable resurgence
-®- of tuberculosis. In the United States, approximately
63,000 excess cases have occurred since 1985;1 in some
developing countries, rates of active tuberculosis have
doubled.2 Factors associated with die increased num
ber of cases of tuberculosis in die United States include
die effect of HIV coinfection,3-4 immigration from
‘From the Denver Disease Control Service, Denver Health and
Hospitals, and the Department of Medicine (Division of Infec
tious Diseases), University of Colorado Health Sciences Center,
Denver (Drs. Burman, Cohn, and Reves); the Division of Field
Epidemiology, Epidemiology Program Office, Centers for Dis
ease Control and Prevention, Atlanta (Mr. Dalton); and the
National Centro for Epidemiology and Population Health, the
Australian National University, Canberra, Australia (Dr Butler)
Manuscript received October 29, 1996; revision accepted March'
11, 1997.
Rejyrint requests: WiUtam J. Burman, MD, Denver Public Health
605 Bannock St, Denver, CO 80204
areas of endemic tuberculosis,5-6 and homelessness.7'9
Another key factor lias been die failure to complete
tuberculosis tiierapy, resulting in relapse and ongoing
transmission.8-10 Equally alarming are increases in
drug-resistant tuberculosis. Resistance to isoniazid in
isolates from previously untreated patients increased
from 4% in die late 1970s and early 1980s’1 to 8.2% in
1991.12 Primary resistance to both isoniazid and ri
fampin, wliich markedly decreases die response to
treatment, increased from <1%11 to 3.2% over tliis
time period.12
The resurgence of tuberculosis and the rising
prevalence of drug resistance have occurred despite
the development of higlily efficacious regimens for
the treatment of active tuberculosis. In clinical trials,
short-course (6-month) regimens that include isoni
azid, rifampin, and pyrazinamide have cure rates
CHEST/112/1/JULY, 1997
©3
/
exceeding 95% for drug-susceptible tuberculo
sis.1315 In clinical practice, however, short-course
chemotherapy has been much less successful than
the clinical trials had predicted.16 This discrepancy
hets shifted the focus from the efficacy of treatment
regimens to the mode of their administration. There
is increasing evidence that treatment protocols that
use direct observation of each dose of therapy are
more effective than those that rely on self-adminis
tration. Although there have been no randomized
trials (to our knowledge) comparing directly ob
served therapy (DOT) with self-administered ther
apy (SAT) in the United States, the recent experi
ence from Tarrant County, Texas16 and New York
City17-18 strongly suggest that the use of DOT pro
vides a higher cure rate and markedly decreases the
emergence of drug resistance.
Based on this evidence, the Centers for Disease
Control and Prevention (CDC) has recommended
the use of DOT whenever possible.19 One of die
barriers to the widespread adoption of DOT is die
perception that it is an expensive form of therapy,20
beyond die limited financial resources of many
tuberculosis control programs. However, because
the therapy of treatment failures, particularly drug
resistant treatment failures, is very expensive,21-22
DOT could be a less expensive form of treatment if
the savings from the occurrence of fewer treatment
failures offset die higher initial costs of DOT. We
performed a cost-effectiveness analysis of DOT com
pared with SAT for the treatment of active tubercu
losis.
Materials and Methods
Decision Analysis Model
The analysis uses a decision analysis model to compare the
event rates and costs of DOT and SAT. The model begins with
the outpatient treatment of drug-susceptible tuberculosis (Fig 1).
The cost of the initial diagnosis of active tuberculosis, which
might include hospitalization, is not included in this analysis; this
cost was assumed to lx- equivalent with DOT or SAT. The DOT
treatment arm uses the “Denver regimen," a 62-dose, largely
intermittent regimen of isoniazid, rifampin, pyrazinamide, and
streptomycin.The SAT arm uses the currently recommended
regimen for self-administered short-course therapy: daily isonia
zid, rifampin, pyrazinamide, and ethambutol for 2 months fol
lowed by daily isoniazid and rifampin for 4 months.15
Failure to cure tuberculosis can be due to the failure to initially
control the disease or to relapse after completion of initial
therapy. For this analysis, we combined these two events into an
overall failure rate. Failure or relapse can occur with drugsusceptible, single drug-resistant, or multidnig-resistant organ
isms. Because the treatment of single drug-resistant tuberculosis
is generally successful, even with short-course retreatment regi
mens, 13.23.24 wc assumed t|iat Sjngjc drug-resistant treatment
failures could be treated as successfully and inexpensively as
drug-susceptible treatment failures, and wc combined these two
64
cure
0.79
drug-susceptible
SAT
failure
071
0.21
multidrug-reslslant
----------- ■■
active
tuberculosis
cure
0.945
DOT
failure
0.055
drug-susceptible
~(T84———
multidrug-resistant
0J6
'
Figure 1. Estimated clinical event rates for treatment of drugsusceptible tuberculosis using DOT or SAT, from reference 16.
Drug-susceptible failure of initial therapy includes patients
whose isolates are resistant to one drug; multidrug-resistant
includes all patients whose isolates are resistant to two or more of
the first-line antituberculous drugs (isoniazid, rifampin, pyrazinamide, ethambutol, and streptomycin).
rates. Therefore, failures are categorized as either drug suscep
tible or multidrug resistant (Fig 1). Although some patients with
tuberculosis, particularly those with drug-resistant strains, have
multiple failures,25 this analysis considers only tlie costs associ
ated with first episode of treatment failure. All treatment failures
were assumed to lx* successfully treated with a chemotherapy
regimen given as DOT.26
We assumed that treatment failures would occur during treat
ment or within 6 months following the completion of treatment,
since most relapses occur within 6 months of the completion of
initial therapy.27 The identification of treatment failures within 12
months of diagnosis obviates the need for discounting of future
events for drug-susceptible failures.28 29 I lowever, treatment of
multidnig-resistant tuberculosis continues for 2 years after the
failure of initial therapy, so the relevant costs of therapy in later
years were discounted.
The model includes lx>th the costs of initial therapy and the
costs of treating disease that arises as a result of failure of initial
therapy. Although tuberculosis may be trans milted to contacts of
a patient who is failing to respond to initial therapy or suffering
a relapse,10 30 it is difficult to estimate the frequency with wliich
this occurs. Therefore, this model does not include the costs of
contact investigation, preventive therapy, or treatment of second
ary cases of active disease due to transmission from patients who
fail to respond to therapy.
We used software programs (Excel 5.0; Microsoft; Renton,
Wash; and Data 2.6; TreeAge; Williamstown, Mass) for this
analysis.
Event Rates
The event rates for DOT and SAT in Figure 1 were those
published from the Tarrant County tuberculosis control pro
gram.16 Because of high rates of failure and acquired drug
resistance with the use of SAT, the tuberculosis control program
in Tarrant County changed to “near-universal DOT" in November 1986. During the SAT era (January 1980 through October
1986), the use of DOT was limited to treatment failures and cases
with acquired dnig resistance. In the DOT era (Novemljer 1986
through December 1992), 90% of patients were treated with
Clinical Investigations
/
DOT from the beginning of therapy; 10% received SAT through
physicians outside the health department. The event rates user! in
this analysis were based on the Tarrant Count}’ tuberculosis
program’s “intenlion-to-treal,” meaning llmt the event rates for
DOT were based on all patients treated during the DOT era,
including the 10% troated with SAT.
I able 2—Estimated Costs for Diagnosis and Treatment
of a Drug-Susceptihle or Multidnig-Resistant
Treatment Failure (Undiscounted)
DrugSusceptible
1'nllnrr
I,'xp(,n<llh)m
Costs
Estimated Cost of Initial Treatment: The estimated costs
incurred for initial treatment with DOT and SAT are given in
Table 1. The cost of the initial diagnosis of active tuberculosis,
which might include hospitalization, is not included in this
analysis, but costs for the treatment of treatment failures (Table
2) include the cost of diagnosis and hospitalization, since the
occurrence of these events is directly related to the effectiveness
of initial therapy.
Drug costs were calculated by using prices for the Denver
Metro Tuberculosis Clinic in September 1994. To estimate the
cost of streptomycin (currently available only cost free through
the manufacturer), we updated the cost when the drug was last
available on the commercial market to 1994 dollars using the
Medical Consumer Price Index?1 Personnel costs were estimated
by using the current costs at the Denver Metro Tuberculosis
Clinic. Hourly figures include the cost of employee benefits, but
not the estimated cost of overhead (eg, facility costs, administra
tive support) as this cost is likely to be equivzient in a DOT and
SAT program. To estimate the nursing time necessary to admin
ister DOT. we monitored 107 successive DOT visits at die
Denver Metro Tuberculosis Clinic. The average time
(mean±SD) ol 10.7±6.5 min (range, 3 to 40 min) was increased
to 15 min in the model to account for time spent waiting for
patients. A 6-month course of SAT was estimated to require eight
visits of 20 min each.15 To account for differences in the amount
of nursing time required to administer DOT or the personnel
cost for nurses, we included nursing time as a variable in the cost
analysis. The cost of physician time was estimated using the salary
and benefits for a physician in the Denver Health and Hospitals
system ($125,000 for salary and benefits=$60/11).
DOT programs must deliver doses of medications to patients to
ensure compliance. We estimated that the delivery of one dose
requires 1 h of an outreach worker’s time ($13.25), plus the cost
of leasing a car ($220/mo apportioned over 4 h use a day, 20
d/mo=$2.75 per dose delivered) and driving it 10 miles ($0.23/
Diagnosis
Hospitalization
Duration, d
Estimated cost per day, $
Percentage of patients hospitalized
DOT drugs (In hospital), $
Estimated cost of hospitalization, $
Outpatient DOT*
Drug cost, $
Nursing cost, $
Monitoring tlierapy," $
Delivery of doses,1 $
Cost of outpatient DOT, $
Total diagnosis and treatment cost, $
Hours of patient's time
I lospitalization/respiratory
isolation, h
Outpatient DOT, h
Total hours of patient’s time
Total cost of parent’s time at
354*
3
Multidrug-/
Resistant
Fnlhim
$
14
693
80
.58
7,820
687'
90
1,286
100
115,740
135*
1,317
9,491
7,834
2,654
1,901
1,537
13,926
130,353
244 (3.5 wk)
1,0-10 (6 mo)
44
288
3,384
1,440
16,920
12,875
147,273
322*
619
211
400
$11.75/11, $
Total cost (including putient's tune, $)
♦Includes three mycolmcterial cultures, a <chest radiograph, CBC
count, serum chemistry panel, 1 h of a physician s time ($60/h), and
2 h of nurse’s time ($25.28/11).
'includes the costs outlined above plus susceptibility testing for
second-line agents ($87.75) on two cultures and an additional 1.5 h
of nursing time and 2 h of physician time.
‘In this HKMlel, all relapses are assumed to l>e treated with DOT.
*These costs are less than the corresponding entries in Table 1
l>eeause 80% of the patients are assumed to have received their first
2 weeks of therapy while hospitalized.
"Includes monthly serum bilirubin and AST for all patients; monthly
CBC counts, and monthly audiometry while receiving a parenteral
aminoglycoside for patients being treated for multidrug-resistant
tul>erculo.sls.
Assumes that 20% of DOT doses are delivered.
Table 1—Evtimaled Coutu of Initial Treatment for Drug-S\usceptible Tuberculosis Using DOT or SAT
DOT
Expenditure (Cost/Unit)
Antituberculous drugs
Nursing cost ($25.28/11)
Sputum culture ($58.50)
Chest radiograph ($40)
Scrum bilirubin and AST ($16)
Deliver)' of DOT dose ($ 18.30)1
Total treatment cost
Patient’s time costs (1.25 hours per
clinic visit. SI 1.75/liour
Total cost (including patient time costs)
No. of Units
0.25 h/doseX62
4
2
5
0.20X62 doses
62 doses, 77.5 h
SAT
------------ 1
Cost, $
No. of Units
193*
392
234
80
80
227
1.206
911
0.33 li/visitX8
7
2
5
Not applicable
Cost, $
8 visits, 10 h
2,117
•Sixty-two-dose. largely intermittent regimen of isoniazid, rifampin, pyrazinamide, and streptomycin for 2 months, rnllowed l,v
Konia'/in
isoniazid onH
and nlnmmo
rifampin Ore.
for 4A months.1.11'’
’Daily isoniazid, rifampin, pyrazinamide, and ethambutol for 2 moi.d.o,
months, followed uy
by u^y
daily isoniazid and rifampin for 4 months.1,5
Twenty percent of all DOT doses given through the Denver Metro
----- Tuberculosis
------ -—,— Clinic are delivered to patients.
CHEST/112/1 / JULY, 1997
584'
67
410
80
80
1,221
118
1,339
65
system, costs included the cost of initial therapy plus
all subsequent costs for treatment failures. In ana
lyzing costs from the health-care system perspective,
results both excluding and including patient time
costs were obtained.
The results of the cost-eflectiveness analysis for a
cohort of 100 patients with active tuberculosis are
presented in Table 4. Considering first die results from
the perspective of a tuberculosis control program,
DOT is less expensive, $1,405 vs $2,314 per patient
treated, and results in cost savings of $90,900 for a
cohort of 100 patients. DOT is therefore a dominant
strategy in diat it leads to Ixidi lower treatment costs
and better health outcomes dian SAT.
We dien analyzed costs from the perspective of die
health-care system, but initially excluded patient time
costs. The inclusion of hospitalization costs for treat
ment failures gready increases die cost advantage of
DOT over SAT, $2,785 vs $10,529 per patient treated,
for a net savings of $774,400 for a cohort of 100
patients. When patients’ time costs are included, die
cost of initial therapy with DOT becomes considerably
greater than with SAT, $2,117 vs $1,339 per patient
treated, reflecting the greater time costs required of
patients on DOT regimens (Table 1). However, when
die patient time costs of treatment failures are in
cluded, DOT has an even greater cost advantage over
SAT, $3,999 vs $12,167 per patient treated, resulting in
a savings of $816,800 for a cohort of 100 patients. This
is attributable to die “downstream” time savings for
patients diat arise from the lower numlier of treatment
failures with DOT.
Sensitivity Analysis
We examined die sensitivity of these results to
changes in the values of a number of parameters in
the model using threshold analysis. Since DOT is a
dominant strategy in comparison with SAT, thresh
old analysis is an appropriate technique as it indi
cates the changes in the values of various model
parameters that would be necessary to offset die cost/
advantage of DOT. The threshold analyses con
ducted in our study are all one-way analyses, ie, each
parameter value is varied separately while maintain
ing all other parameters at their model values.
The threshold analysis demonstrates that substan
tial changes in cost estimates would be necessary to
reverse the cost advantage of DOT (Table 5). For
example, a fivefold increase in nursing time (0.25 vs
1.25 h) would be necessary to make SAT less expen
sive than DOT from the tuberculosis control pro
gram (or a 35-fold increase, 0.25 vs 8.75 h, from the
health-care system perspective). Since the net cost
advantage of DOT arises Largely from the lower costs
of hospitalization of drug-susceptible or multidnigresistant treatment failures, a reduction in these
costs would reduce this net cost advantage. How
ever, die direshold analysis demonstrates that DOT
retains a cost advantage even if the costs of hospital
ization for eidier drug-susceptible or multidrug
resistant treatment failure are eliminated.
The cost advantage of DOT is also stable through
a wide range of event rates. For example, the failure
rate of DOT would have to increase fivefold over the
Table 4—Cost-effectiveness of DOT vs SAT for a Cohort of 100 Patients With Initial Drug-Susceptible
Tuberculosis*
Cost of Initial
Therapy, S
(1)
Cost of Therapy
for Treatment
Failures, $
(2)
Total Cost,
$
(3)°(l)+(2)
No. of Patients
Cured Aller Initial
Therapy’
(4)
Net Cost per
Additional Patient
Cured With
DOT, $’
(5)-(3)/(4)
Conclusion of the
Cost-effectiveness
Analysis*
Tuberculosis control program perspective (outpatient costs only)
DOT
120,60019,900
140,.500
94.5
SAT
122,100
109,300
231,400
79.0
DOT-SAT
“1.500
-89,400
- 90,900
15.5
-5,865
JX)T dominates
Ilealtb-care system perspective (excluding patient time costs)
DOT
120,600
157,900
278,500
94.5
SAT
122,100
930,800
1,052,900
79.0
DOT-SAT
-1,500
-772,900
- 774,400
15.5
-49,961
DOT dominates
Health-care system perspective (including patient time costs)
DOT
r
------211,700
188,200
399,900
9-1.5
SAT
1,082.800
133,900
1,216,700
79.0
DOT-SAT
77,800_________ -894,600
-816,800
15.5
-52,697
DOT dominates
*This analysis uses> discounted costs at 5%/yr.
^CCHminrf
Assuming the event rates in reference 16.
!A negative
net cost means that the use of DOT results in a savings per additional patient cured.
DOT dominates if both the cost per patient is lower and the number of patients cured after initial therapy is greater.
CHEST/112/1 / JULY, 1997
67
mile), for a total estimated cost of $18.30 for each dose delivered.
The percentage of doses delivered to patients was included as a
variable in the cost analysis.
We used the “institutional rate” at a commercial laboratory in
Denver to estimate laboratory costs. We assumed that all patients
would have monthly serum aspartate aminotransferase (AST) and
bilirubin tests ($15.92) while receiving therapy and that those
receiving second-line agents for multidrug-resistant tulrerculosls
would have a CBC count and scrum electrolytes ($12.08) as well.
Follow-up sputum cultures ($58.50) were assumed to be done
more frequently for those receiving SAT or those being treated
for a relapse (ever)' 2 weeks until negativeX3, then at 6 months,
average of seven cultures) than for those receiving initial DOT
(monthlyX3, then at 6 months, total of four cultures). The Blue
Cross/Blue Shield reimbursement rate ($40) was used to estimate
the cost of follow-up chest radiographs (2 and 6 months).
Because DOT requires patients to attend a clinic much more
frequently for supervised administration of therapy, there are
differences in the amounts of lime required of patients receiving
DOT and SAT. Including travel time to and from the clinic, one
clinic visit for either DOT and SAT was assumed to require
1.25 h of a patient’s time. The cost of a patient’s time was
estimated at $11.75/11, based on mean earnings per day worked of
$94 and assuming an 8-h work day.2”
In summary, the direct treatment costs of initial therapy are
estimated to be 31,206 for DOT and $1,221 for SAT, while a
patient’s time costs are estimated to be $911 for DOT and $118
for SAT. This gives overall costs for initial therapy of $2,117 for
DOT and $1,339 for SAT (Table 1).
Estimated Costs for Treatment Failures
We estimated the cost of hospitalization for a drug-susceptible
treatment failure by determining the cost for patients hospital
ized between 1988 and 1993 al Denver General Hospital for the
purpose of respiratory isolation and initiation of tuberculosis
therapy. The charges for all services (laboratory, radiology,
pharmacy, room charge, and physician fees) for these hospital
izations were obtained from computerized billing records. The
figures were updated to 1994 dollars31 and adjusted for the
charge/cost ratio at Denver General Hospital (0.66, unpublished
data; Chief Financial Officer; Denver General Hospital). With
these adjustments, the average cost per day of hospitalization for
tuberculosis at Denver General Hospital was $693. We assumed
that 80% of patients with drug-susceptible failure of initial
therapy would be hospitalized for an average of 14 days and
included the cost of treating drug-susceptible treatment failures
as a variable in the cost analysis.
We used the estimate from Mahmoudi and Iseman2’ of
$180,000 for the average charge for hospitalization for multidrug
resistant tuberculosis and assumed that all such patients would
require hospitalization. We updated this estimate to 1994 dollars
and adjuster! for (he puymenl/charge ratio for such patients (0.50)
at the National Jewish Center for Respiratory Medicine and
Immunology (J. Cook, MD; personal communication; April,
1995). With these adjustments, the estimated cost for hospital
ization for treatment of multidrug-resistant tuberculosis is
$115,740.
Patients with multidrug-resistant tuberculosis were assumed to
require 24 months of chemotherapy, 21 months of which would
be administered after a 3-month hospitalization. Drug regimens
for multidnig-resistant tuberculosis are not standardized, but for
the cost analysis, we assumed a regimen of ofloxacin, cycloserine,
ethionamide, and capreomycin32 for 6 months followed by 18
months of therapy With the oral drugs (drug cost, $7,834).
Outpatient therapy for multidrug-resistant tuberculosis was as
sumed to be given as DOT, 5 d/wk, and SAT on weekends.
66
Monitoring during therapy included audiograms while receiving
capreomvein (386.75, cost at Denver General Hospital) and
frequent sputum cultures (average of 13) with drug-susceptibility
determinations for second-line agents (387.75, charge at National
Jewish Center for Immunology and Respirator}- Medicine) on
initial cultures.
Considering a patient’s lime costs, it was assumed that a patient
with a drug-susceptible failure would lx? unable to work for 3.5
weeks after diagnosis, because of the illness itself and the need to
isolate those with pulmonary disease. For multidrug-resistant
treatment failures, we estimated that a patient would be unable to
work for 6 months after the diagnosis, because of prolonged
hospitalization and the need for intensive therapy, including
parenteral medications, during the first 3 months after hospital
ization.
For multidrug-resistant disease, treatment extends beyond 12
months from initial diagnosis of active tuberculosis. Treatment
costs and patient time costs incurred in the second and third
years were discounted to reflect the lower present value of costs
to be incurred in the future.2” All hospitalization costs arc
expected to arise during the first year of therapy. The effects of
discounting future costs of treatment of multidnig-resistant
failures using discount rates of 5% and 8% are shown in Table 3.
Since most of the costs of treating these patients are incurred in
the first year of therapy, discounting and the choice of discount
rate have little effect on the overall treatrnent and patient time
costs.
Results
Cost-effectiveness Analysis
In comparing the costs and effectiveness of DOT
and SAT, we analyzed costs from the perspectives of
a tuberculosis control program and health-care sys
tem. From the perspective of a tuberculosis control
program, costs include the cost of initial therapy plus
the cost of diagnosis and outpatient treatment for
those who fail to respond to treatment or suITer a
relapse. From the perspective of the health-care
Table 3—Undincounted and Dificounted Cofttft of
Diagnonis and Treatment of Multidrug-Reiihtant
Treatment Failures
r=5%
Undiscounted
Year 1
Treatment costs
Diagnosis and Ixispitilization
Outpatient DOT
Patient time costs
Total—year 1
Year 2
Treatment costs, outpatient DOT
Patient time costs
Total—year 2
Year 3
Treatment costs, outpatient DOT
Patient time cost1:
Total—year 3
Total
r=8%
3116,427
3 1,989
$ 12,891
$131,307
$116,427 $116,427
$ 1,989 $ 1,989
$ 12,891 3 12.891
$131,307 $131,307
$ 7,958
$ 2,686
$ 10,644
$ 7,579 $ 7,369
$ 2,5.58 $ 2,487
$ 10,137 $ 9,856
3
3,979
$
1.343
3 5,322
$147,273
8
3,609 $
$
$
1,218 $
3,411
1.151
4,827 $ 4 ,.562
$146,271 $145,725
Clinical Investigations
Tabic 5—Threshold Analysis for the Comparison of Costs of Tuberculosis Treatment Using DOT cs SAT From the
Perspecfires of a Tuberculosis Control Program and the Health-Care System*
Threshold Value
Variable
Model Value
Tuberculosis Control
Program
Cost of medications used for initial treatment using DOT, $
Cost of medications used for initial treatment using SAT, $
Nursing time to administer one DOT dose, h
Cost of hospitalization for a dnig-susceptihle treatment failure, $
Cost of hospitalization for a multidrug-resistant treatment failure, $
Failure rate of initial therapy using DOT
Proportion of DOT treatment failures acquiring multidrug
resistance
Failure rate of initial therapy using SAT
Proportion of SAT treatment failures acquiring multidrug
resistance
I lourly cost of a patient’s time, $
193
584
0.25
7,662
15,740
0.055
0.16
1,102
Not found*
1.25
Not applicable
Not applicable
0.306
Not found
8.75
Not found
Not found
0.325
Not found
0.210
0.29
0.035
Not found
0.035
Not found
11.75
Not applicable
Not round
lieHltli-C.Hre System
7,937
Not found
The tuberculosis control program perspective includes tlie cost of outpatient treatment, including outpatient therapy for treatment failures. The
health-care system perspective includes inpatient and outpatient costs of treatment. Costs for this threshold analysis are discounted at 5%/yn
patient time costs are excluded except for the analysts of the hourly cost of a patient’s time.
’Not found—the cost advantage of DOT remained through all relevant values of the variable.
model value, or the failure rate of SAT would have to
fall to one sixth of the value in the model to reverse
the cost advantage of DOT.
Discussion
Using cost estimates and event rates from two
urban tuberculosis control programs,16 this decision
analysis predicts that the use of near-universal DOT
would substantially decrease the overall cost of treat
ing tuberculosis. Although the cost of initial therapy
with DOT is greater than that with SAT when
patient time costs are included, DOT is less expen
sive because of its greater effectiveness in preventing
failure and acquired drug resistance.16 Previous cost
comparisons of DOT and SAT have focused on the
costs of initial therapy,33-34 but our analysis suggests
that the cost of initial therapy is only a small part of
the overall cost of treating tuberculosis. Although
our model does not include the costs of initial
diagnosis (which may include hospitalization), it is
sobering that approximately 90% ($9,308/$ 10,529) of
the estimated direct cost of treating tuberculosis with
an SAT program may be due to treatment failures.
It is important to recognize that an additional
investment in tuberculosis control programs may be
required to achieve this reduction in overall costs.
This is particularly true if the tuberculosis control
program has been inadequately funded in the past.
The increase in funding required to institute wide
spread DOT in New York City17 was the result of a
long history of inadequate public funding for tuber
culosis in that city.8 Reports from areas with ade
68
quate public health infrastructure for tuberculosis
control indicate that the conversion from SAT to
near-universal DOT was not associated with in
creases in overall costs.16 Depending on personnel
costs and the amount of outreach necessary to
ensure ingestion of doses, the cost of initial treat
ment with DOT may be substantially higher than
initial therapy with SAT. Finally, the fiscal benefit of
a switch to DOT may not become evident for several
years, as the incidence of failure and relapse de
crease. However, this analysis strongly suggests that
an investment in a DOT program is a cost-effective
use of limited public health funds.
The validity of a cost-effectiveness analysts model
is determined by the accuracy of the assumptions
regarding event rates and costs. In this analysis, we
used the comparison of event rates with DOT and
SAT from the Tarrant County study.16 Although this
study is a retrospective review of the application of
SAT and DOT during two different time periods, to
our knowledge, it is the only such comparison that
has been published. Results from our clinic, which
has practiced near-universal DOT with similar regi
mens for 15 years, corroborate the event rates from
Tarrant County during the DOT era.13 Reported
rates of completion of tuberculosis treatment suggest
tliat the results of SAT from the Tarrant County
study are representative of other tulx?rculosis control
programs; only 77% of US tuberculosis cases re
ported to the CDC in 1994 were documented to
have been in patients who completed therapy within
12 months of its initiation.35 The sensitivity analysis
demonstrates that the event rates can vary substanClinical Investigations
daily from those seen in Tarrant County without
changing (he conclusion that DOT is a less (‘xpensive
method of administering tuberculosis therapy.
There may be considerable local differences in the
use of hospitalization for the treatment of patients
who fail to respond to the initial course of therapy.
However, a recent report suggests that hospitaliza
tions are common in the treatment of tuberculosis.36
An analysis of hospital discharges in 16 states found
that the number of hospitalizations for tuberculosis
was approximately equal to the number of incident
cases of tuberculosis and that the average length of
hospitalization was nearly 20 days. In that many
patients with tuberculosis are treated entirely as
outpatients, this study suggests that a substantial
percentage of tuberculosis patients are hospitalized
multiple times and that extended hospitalizations are
common. Other brief reports suggest that hospital
izations for multidrug-resistant tuberculosis are fre
quently long37 and expensive.22 We also used two
techniques to analyze the effects of differential use
of hospitalization on the overall cost analysis. First,
we analyzed outpatient costs separately from the
costs of therapy, including hospitalization (the tuber
culosis control program perspective vs the health
care system perspective). Second, we included the
costs of treating drug-susceptible and multidrugrcsistant treatment failures, which are driven by
costs of hospitalization, as variables in the sensitivity
analysis. These analyses demonstrate that our as
sumptions about tlie use of hospitalization were not
decisive factors in concluding that tlie use of DOT is
less expensive than the use of SAT. While tlie exact
cost-benefit from the use of DOT will vary substan
tially based on local conditions and practices, our
analysis suggests that DOT will be cost-effective
under the conditions likely to be found in most US
urban tuberculosis control programs.
The cost estimate for treatment of multidrug
resistant tuberculosis in this analysis was based on
tlie published data fiom a tertiary referral center.21
Although the cost for initial therapy for rnultidnigresistant tuberculosis might be lower in other set
tings, it should be noted that we included only tlie
costs associated with a single relapse, though multi
ple courses of therapy and hospitalizations are com
mon in patients with drug-resistant strains.21 This
analysis assumes that secondary drug resistance
would be promptly recognized and appropriately
managed, yet such patients are often treated for
years prior to referral for definitive care 21 Finally,
the sensitivity analysis demonstrates that DOT is less
expensive than SAT regardless of tlie cost of treat
ment for multidrug-resistant tuberculosis.
To strengthen the conclusion that DOT is costeffective, we used a number of estimates that may
bias the analysis against DOT. We assumed that the
costs of initial diagnosis and hospitalization for tu
berculosis would lx? the same in a DOT and SAT
program. It is quite possible, though, that the knowl
edge that a patient will be followed up very closely in
a DOT program may shorten, if not obviate, hospi
talization for some patients at the time of the initial
diagnosis of tuberculosis.38 Our estimate for the cost
per day of hospitalization for drug-susceptible tul>erculosis ($693) appears to be conservative; in a recent
study, die average cost per day for inpatient tuber
culosis treatment ranged from $740 to $l,210.39 We
used a rate for acquired multidrug resistance with
DOT that came from an intention-to-treat analysis,
yet in that study, no patient who received DOT from
the initiation of antituberculosis therapy developed
drug resistance.16
Due to the complexity it would entail, we did not
include in this cost analysis other outcomes of treat
ment that are likely to make DOT more costeffective than SAT. We did not include an analysis of
the costs of a fatal relapse of tuberculosis, yet the/
mortality of recurrent tuberculosis may lx? apprecia
ble, particularly in an HIV-infected patient.40 Fi
nally, we did not include any costs that result from
transmission during the period of infectiousness
related to treatment failure. One of the major ben
efits of efiective treatment of active tulx?rculosis is
the prevention of further transmission. The decrease
in primary drug resistance in Tarrant County16 and
the recent report of decreasing case rates in New
York City17 after the widespread application of DOT
support the assertion that DOT decreases secondary
cases.
The resurgence of tuberculosis in the United
States is due to a number of factors and the effec
tiveness of DOT offers an important measure to
reverse this trend. This analysis shows that, far from
discouraging tlie use of DOT, economic consider
ations are an additional powerful argument for the
widespread implementation of DOT. Furthermore,
the effectiveness and cost-effectiveness of DOT
should be studied in developing countries, where the
burden of tuberculosis is greatest.2
ACKNOWLEDGMENT: The authors thank Maribeth O’Neil
Darla Blackburn, Tan Tapy, Patty Calixto, and Barbara Catlin, the
nurse-clinicians who helped in the survey of the time necessary to
administer DOT (and who make DOT work in our program). We
also are grateful for the assistance of James Cook for providing
cost estimates for hospitalization at National Jewish Center for
Respiratory Medicine and Immunology', Comelis Reitmeijer for
estimating costs of hospitalization at Denver General Hospital,
Amy Puh'cr for providing cost estimates for nursing time and the
cost to deliver a dose of DOT, and FranklyJudson of Denver
Public Health anil Anne Haddix of the Prevention Effectiveness
Activity Epidemiology Program Office, CDC, for reviewing the
manuscript.
CHEST / 112/ 1 / JULY, 1997
69
References
1 Centers for Disease Control and Prevention. Expanded tu
berculosis surveillance and tuberculosis morbidity—United
States, 1993. MMWR 1994; 43:361-66
2 Raviglione MC, Snider DE Jr, Kochi A. Global epidemiology
of tuberculosis: morbidity and mortality of a worldwide
epidemic. JAMA 1995; 273:220-26
3 Selwyn PA, Kartell D, Lewis VA, et al. A prospective study of
the risk of tuberculosis among intravenous drug users with
human immunodeficiency virus infection. N Engl J Med
1989; 320:54.5-50
4 Burwen DR, Bloch AB, Griffin LD, et al. National trends in
the concurrence of tuberculosis and acquired immunodefi
ciency syndrome. Arch Intern Med 1995; 155:1281-86
5 Cantwell MF, Snider DE Jr, Cauthen GM, et al. Epidemiol
ogy of tuberculosis in the United States, 1985 through 1992.
JAMA 1994; 272:535-39
6 McKenna MT, McCray E, Onorato I. The epidemiology of
tuberculosis among foreign-bom persons in the United
States, 1986 to 1993. N Engl J Med 1995; 332:1071-76
7 Torres RA, Mani S, Altholtz J, et al. Human immunodefi
ciency vims infection among homeless men in a New York
City shelter: association with Mycobacterium tuberculosis
infection. Arch Intern Med 1990; 150:2030-36
8 Brudney K, Dobkin J. Resurgent tuberculosis in New York
City: human immunodeficiency vims, homelessness, and the
decline of tuberculosis control programs. Am Rev Respir Dis
1991; 144:745-49
9 Nolan CM, Elarth AM, Barr II, et al. An outbreak of
tuberculosis in a shelter for homeless men: a description of its
evolution and control. Am Rev Respir Dis 1991; 143:257-61
10 Small PM, Hopewell PC, Singh SP, et al. The epidemiology
of tuberculosis in San Francisco: a population-based study
using conventional and molecular methods. N Engl J Med
1994;330:1703-09
11 Centers for Disease Control. Primary' resistance to antituber
culosis drugs—United States. MMWR 1983; 32:521-23
12 Bloch AB, Cauthen GM, Onorato IM, et al. Nationwide
survey of drug-resistant tuberculosis in the United States
JAMA 1994; 271:665-71
13 Cohn DL, Catlin BJ, Peterson KL, et al. A 62-dose, 6-month
therapy for pulmonary and extrapuhnonary tuberculosis: a
bvice-weekly, directly observed, and cost-effective regimen.
Ann Intern Med 1990; 112:407-15
14 Hong Kong Chest Service/British Medical Research Council.
Controlled trial of 4 three-times-weckly regimens and a daily
regimen all given for 6 months for pulmonary tulrerculosis;
second report: the results up to 24 months. Tubercle 198263:89-98
15 Combs DL, O’Brien RJ, Geiter LJ. USPHS tuberculosis
short-course chemotherapy trial 21: effectiveness, toxicity,
and acceptability. Ann Intern Med 1990; 112:397-406
16 vVeis SE, Slocum PC, Blais EX, et al. The effect of directly
observed therapy on the rates of drug resistance and relapse
in tuberculosis. N Engl J Med 1994; 330:1179-84
11 Frieden TR, Fujiwara PI, Washko RM, et al. Tuberculosis in
New York City—turning the tide. N Engl J Med 1995333:229-33
18 Fujiwara PI, Crawford PT, Woodley CL, et al. Drug-resistant
tuberculosis in New York City, 1991-1994 [alrstract]. Tuber
cle Lung Dis 1995; 76:897
19 Centers for Disease Control and Prevention. Initial therapy
for tuberculosis in the era of multidrug-resistance: recom
mendations of the Advisory Council for the Elimination of
Tuberculosis. MMM 1993; 42:1-8
20 Annas GJ. Control of tuberculosis—the law and the public’s
health. N Engl J Med 1993; 328:585-88
21 Mahmoudi A, Iseman MD, Pitfalls in the care of
of patients
patients with
with
tuberculosis: common errors and their association with the
acquisition of drug resistance. JAMA 1993; 270:65-68
22 Centers for Disease Control. Outbreak of multidnig-resistant
tuberculosis—Texas, California, and Pennsylvania. MMWR
1990; 39:369-72
23 Swai OB, Aluoch JA, Githul WA, et al. Controlled clinical trial
of a regimen of two durations for the treatment of isoniazid
resistant pulmonary tuberculosis. Tubercle 1988; 69:5-14
24 Mitchison DA, Nunn AJ. Influence of initial drug resistance
on the response to short-course chemotherapy of pulmonary
tuberculosis. Am Rev Respir Dis 1986; 133:423-30
25 Goble M, Iseman MD, Madsen I^A, et al. Treatment of 171
patients with pulmonary tuberculosis resistant to isoniazid
and rifampin. N Engl J Med 1993; 328:527-32
26 Bass JB Jr, Farer LS, Hopewell PC, et al. Treatment of
tuberculosis and tul>erculosis infection in adults and children.
Am J Respir Grit Care Med 1994; 149:1359-74
2/ East and Central African/British Medical Research Council
Fifth Collaborative Study. Controlled clinical trial of 4 short
course regimens of chemotherapy (three 6-month and one
8-month) for pulmonary tuberculosis: final report. Tubercle
1986; 67:5-15
28 Haddix AC, Teutsch SM, Shafter PA, et al. A guide to
prevention effectiveness: decision and economic analysis.
Atlanta: Centers for Disease Control, 1994
29 Dmmmond MF, Stoddart GL, Torrance GW. Methods for
the economic evaluation of health care programmes. Oxford:
Oxford University Press, 1987
30 Nardell E, McInnis B, Thomas B, et al. Exogenous reinfec
tion with tuberculosis in a shelter for the homeless. N Engl
J Med 1986; 315:1570-75
31 Statistical abstract of the US Table No. XXX; consumer price
indexes. Washington, DC: Bureau of Labor Statistics, 1994
32 Iseman MD. Treatment of multidnig-resistant tuberculosis.
N Engl J Med 1993; 329:784-91
33 Iseman MD, Cohn DL, Sbarbaro JA. Directly observed
treatment of tulierculosis: we can t afiTord not to try it. N Engl
J Med 1993; 328:576-78
34 Fox W, Nunn AJ. The cast of antituberculosis drug regimens.
Am Rev Respir Dis 1979; 120:503-09
35 Bloch AB, Brown ED, Hayden CH, et al. Completion of
tuberculosis therapy in the US [abstractI. Am J Respir Grit
Care Med 1995; 151:A555
36 Brown RE, Miller B, Taylor WR, et al. Health-care expendi
tures for tulx’rculosis in the United States. Arch Intern Med
1995; 155:1595-1600
37 Weidhass S, Nardell E, Ford J. The economic consequences
of a single, uncontrolled case of
of drug
drug resistant
resistant tuberculosis
tuberculosis
among the homeless [abstract]. Am Rev Respir Dis 1988137:A23
38 Adler JJ, Smirnoff M, Selcker B. Evaluation of hospital stay
for TB patients referred for directly observed therapy [ab
stract], Am J Respir Grit Care Med 1995; 151 :A514
39 Rosenblum US, Castro KG, Dooley S, et al. Effect of HIV
infection and tuberculosis on hospitalizations and cost of care
for young adults in the United States, 1985 to 1990. Ann
Intern Med 1994; 121:786-92
40 Alwood K, Keruly J, Moore-Rice K, et al. Effectiveness of
supervised, intermittent therapy for tuberculosis in HIVinfected patients. AIDS 1994; 8:110.3-08
70
Clinical Investigations
(
o
I
-J
INT J TUBERC LUNG DIS 2(3):252-254
© 193'8 IUATLD
"pisNOTES FROM THE FIELD
Expenditure and loss of income incurred by tuberculosis
patients before reaching effective treatment in Bangladesh
R. A. Croft, R. P. Croft
Danish Bangladesh Leprosy Mission, Nilphamari, Bangladesh
SUMMARY
1I
This small study undertook to assess the economic con
sequences of developing tuberculosis (TB) among pa
tients presenting to the TB clinic run by the Danish Ban-,
gladesh Leprosy Mission in NW Bangladesh. T he loss
of income resulting from the illness, and the actual ex
penditure incurred by medicines and doctor’s fees before
registration for treatment, were estimated and totalled
for 21 patients serially registered at the clinic. The re
sults showed a mean financial loss to the patient of USS
245 —an exorbitant sum for a village Bangladeshi. Per
haps economic deprivation suffered by I B patients
could be used as a measure of success of the programme.
KEY WORDS: tuberculosis; Bangladesh; treatment;
expenditure
THE DANISH-BANGLADESH LEPROSY MISSION
(DBLM), a large leprosy control programme in NW
Bangladesh, introduced a pilot tuberculosis (TB) con
trol programme into part of its project area in 1994.
There are many similarities between the case finding
and case holding activities of both TB and leprosy,
but one aspect that came to our attention which is to
tally different is the financial cost incurred by patients
before they ever reach our clinics. WE decided to con
duct a small study to investigate the economic conse
quences of TB.
Since then there has been a weekly diagnostic and
treatment clinic at Thakurgaon Centre and monthly
diagnostic clinics operating at another four periph
eral clinics. After completing their initial intensive
phase of treatment patients can collect their medicines
monthly from their nearest Leprosy (now Leprosy/
TB) (,'Iinic. A Government TB Clinic has existed for
many years in Thakurgaon town, but treatment has
not been free and outreach very limited. The DBLM
TB control programme is the first serious attempt
at TB control in these two districts offering free
treatment.
Diagnosis is by sputum examination, and treat
ment follows the Bangladesh National TB Control
Programme's guidelines. All TB medicines arc ob
tained quarterly from the government. All new spu
tum positive patients receive an 8-month treatment
regimen consisting of a 2-month intensive phase of
daily rifampicin, pyrazinamide, ethamDutol and iso
niazid, followed by a 6-month continuation phase of
isoniazid and thiacetazonc.
Table 1 shows how TB case finding has grown
since the programme started.
I
I
PROJECT BACKGROUND
i
i
!
I
DBLM is a large leprosy control project operating in
four northern districts of Bangladesh, an area esti
mated to have the highest prevalence of leprosy in the
country (5/1000).1 In two of these districts, Thakur
gaon and Panchagar, the control programme has now
been operating since 1978, and multidrug treatment
was introduced in 1984. The area covers 3214 km2
and has a population of 1 723 ()()(). It is supported by
a small hospital of 16 beds in the district town of
Thakurgaon.
TB is a major public health problem in Bangla
desh. The prevalence rate is reckoned to be 2-3/1000
across the country (Dr I.iisa Parkkali, personal com
munication), and our impression is th.it the level of
TB in northern Bangladesh is of that order. T hus in
1 hakurgaon and Panchagar districts there is a preva
lence of roughly 4 500 cases.
The T B programme was started in June 1994 fol
lowing a short training course for the staff involved.
1
METHOD
Twcnty-onc TB patients registered serially in March
1996 were interviewed after completing 1 month of
treatment to assess the cost of their illness before at
tending our clinic. The interviewer visited patients in
their own homes in order to visually confirm the in
formation given. The patients were treated in their
own homes, and were not hospitalised.
Correspondence to: R Croft, Danish Bangladesh Irprosy Mission, PO Box 3, PO and Dt Nilphamari 5300, Bangladesh.
Fax: +8X0 2 8X1075. e-mail: croft@pradeshta.net
[A version in French of this article is available from the IUATLD Secretariat in Paris.]
(
<
c
s
ildi tyiciu tin
Table 1 New T? case finding, Thakurgaon and Panchagar
districts 1994-1996
Year
1994
1995
1996
New TB cases
204
635
798
RESULTS
1 he results of the interview arc summarised in Table 2.
Money needed for treatment was raised in eight
cases by selling land or livestock and in three cases
by taking out a loan. It is emphasised that these costs
were incurred before the patients began receiving
short-course chemotherapy at the DBLM clinic.
The DBLM clinic provides all services and medi
cines free of charge (drugs are given free by the Gov
ernment of Bangladesh to the DBLM), and the only
expenditure on the part of the patient is transport
costs to and from the local clinic. Six of the 21 pa
tients lived near enough to the clinic to walk. Of the
remaining 15, five felt that the transportation costs
necessary (USS 0.25-1.25) were a relatively large
amount of money for their family.
Lhc average annual income for a Bangladeshi fam
ily is USS 780.“ The average total loss of income and
expenditure (USS 245) thus represents nearly 4 months
of family income. Two patients actually suffered a
loss of USS 1000.
Uganda, included the costs to the patients and their
families; 32 patients were interviewed in detail, and
of these 21/22 subsistence farmers had lost production
because of their disease, 8/10 employees had stopped
or closed their businesses^ two wives had been di
vorced since their illness and five of the children had
been withdrawn from school because of their parents’
inability to pay school fees.3
I his small study undertaken in Bangladesh con
firms Saunderson’s general findings in another, very
different Asian context. The total expenditure and
loss of income caused by a family member developing
FB in northern Bangladesh is of a very high level,
higher than either we or our national staff expected
to find. It is an interesting contrast to the social stig
matisation faced by the project’s leprosy patients. A
local Bangladeshi synonym for TB is ‘Rajer rog —
King’s disease-since it is a disease that only kings
can afford to suffer.
At present the success of a TB control programme
is assessed by looking at case finding rates compared
to estimated incidence and prevalence rates, sputum
conversion rates, relapse rates and other statistical in
dicators. Little attention is paid to the economic im
pact of the disease on rhe individual or his family and
community. As TB programmes and access to free
treatment become more widespread, it ieems logical
that sufferers will seek treatment earlier and from free
■
DISCUSSION
Saunderson, evaluating the economic costs of alter
native programme designs for TB control in rural
Table 2
A
Results of patient survey
General data
Sex
Mean age
Mean duration of illness
Patients unable to work
Mean loss of work time
Male = 15, Female = 6 (Total 21)
38 years (range 16-60)
16 months (range 2-60 months)
12/21
14 months (range 5 days-60 months)
treatment sources, thus diminishing the economic im
pact of the disease. It is worthy of note that the
DBLM I B programme is the first organised TB pro
gramme operating in the districts of Thakurgaon and
Panchagar which offers completely free treatment. Per
haps the level of economic deprivation suffered by TB
patients could be used as a measure of success of the
programme.
Ackno wledgem ents
\Xe arc grateful t<> Dr I usa I’arkkali, WHO Expatriate Consultant
in tuberculosis to the (Government of Bangladesh, for her encour
agement and help in conducting this study. We thank Mr Samsujjoha, Senior Rehabilitation Officer in DBLM, for his help in con
ducting the survey.
4
B Loss of income/extra expenditure before reaching
DBIM clinic
• j,
Loss of income (estimated)
Doctor's fees
Medicine costs
Laboratory costs
Mean loss of mcome/expenditure
Mean/USS
Range/USS
115
9
112
8.5
245
(0-500)
(0-25)
(0-475)
(0-25)
(0-1000)
References
1 Richardus JII, Croft R I’. I.stimating the size of the leprosy prob
lem: the Bangladesh experience. Lcpr Rev 1995; 66: 158-164.
2 1994 Statistical Yearbook of Bangladesh, Bangladesh Bureau of
Statistics, August I99S.
} Saunderson P R I he Kelletbcrger memorial lecturer 1994 } •opun Med I 1994-.
----------------------------------------------------------- ------- RESUME
■ Cette petite etude a cherche a apprccier, dans le nordouest du Bangladesh, les consequences economiques du
developpement d’une tuberculose parmi les patients con
sultant a la Clinique de Tuberculose assuree par la Mis
sion Danoise contre la Lepre au Bangladesh. La perte de
revcnus resultant de la maladie et les depenses effectives
pour les medicaments et les honoraires medicaux avant
lenregistrement pour traitement furent estimees et addi-
I
j
■
■9
’?
4
■JXi
a^j oUa^
IP •ch'^n^P
J?
jx^h
T/l
A
urzw
^dd<-
■ft
UJ (^
L
(zh*
A^/i-xd
Z di^z
1
Z^dV^e
<3 d«>7
60^.
|
V^SjOA Ldo-
\\JLi-^d
Ce^V
5G>
Ayi/kA^
,
J
\
\
'
7
(X
7)3
7
HEALTH POLICY AND PLANNING; 17(2): 178-186
© Oxford University Press 2002
Costs and cost-effectiveness of different DOT strategies for the
treatment of tuberculosis in Pakistan
MA KHAN,1 JD WALLEY,2 SN WITTER,3 A IMRAN4 AND N SAFDAR1
7Association for Social Development, Islamabad, Pakistan, 2Nuffield Institute for Health, University of Leeds, UK,
3Centre for Health Economics, University of York, UK and 4USAID office, Islamabad, Pakistan
An economic study was conducted alongside a clinical trial at three sites in Pakistan to establish the costs
and effectiveness of different strategies for implementing directly observed treatment (DOT) for tuberculosis.
Patients were randomly allocated to one of three arms: DOTS with direct observation by health workers (at
health centres or by community health workers); DOTS with direct observation by family members; and
DOTS without direct observation. The clinical trial found no statistically significant difference in cure rate for
the different arms.
The economic study collected data on the full range of health service costs and patient costs of the different
treatment arms. Data were also disaggregated by gender, rural and urban patients, by treatment site and by
economic categories, to investigate the costs of the different strategies, their cost-effectiveness and the
impact that they might have on patient compliance with treatment.
The study found that direct observation by health centre-based health workers was the least cost-effective
of the strategies tested (US$310 per case cured). This is an interesting result, as this is the model recom
mended by the World Health Organization and International Union against Tuberculosis and Lung Disease.
Attending health centres daily during the first 2 months generated high patient costs (direct and in terms of
time lost), yet cure rates for this group fell below those of the non-observed group (58%, compared with
62%). One factor suggested by this study is that the high costs of attending may be deterring patients, and
in particular, economically active patients who have most to lose from the time taken by direct observation.
Without stronger evidence of benefits, it is hard to justify the costs to health services and patients that this
type of direct observation imposes. The self-administered group came out as most cost-effective ($164 per
case cured). The community health worker sub-group achieved the highest cure rates (67%), with a cost per
case only slightly higher than the self-administered group ($172 per case cured). This approach should be
investigated further, along with other approaches to improving patient compliance.
Key words: DOT, tuberculosis, direct observation, patient compliance, costing study, cost-effectiveness analysis, Pakistan
Introduction
Tuberculosis (TB) remains the most common cause of adult
deaths in developing countries. Numbers of cases are con
tinuing to grow, due to population growth. HIV and, in some
circumstances, inadequate treatment. There is therefore
considerable interest in improving the performance of health
services in treating TB, and in particular in increasing patient
compliance. Non-compliance rates are often high, and can
lead to relapse and the development of drug-resistant strains,
which are harder and more expensive to treat.
The current model of treatment recommended by the World
Health Organization (WHO) and the International Union
against Tuberculosis and Lung Disease (IUATLD) is the
DOTS (directly observed treatment, short-course) strat
egy. The DOTS model includes strengthening diagnosis,
treatment, outcome monitoring, drug supplies and direct
observation of treatment. There has been little evidence to
date, however, of the additional benefit provided by the direct
observation of treatment (DOT) component. A study in
South Africa (Zwarenstein et al. 2000) found some benefit
from DOT using lay health workers, but the result was not
statistically significant. A Thai study (Kamolratanakul et al.
1999) found DOT to be effective, but they had adapted the
model, using DOT by family members, supported by a onceweekly home visit from health workers.
A recent review of DOT and treatment adherence (Volminck
et al. 2000) emphasizes the importance of a wide array
interventions to promote adherence - such as reminder
letters, financial incentives and increased supervision by staff
They observe that factors such as the quality of interaction
between patients and supervisors may be more relevant than
I
I
I
Cost and effectiveness of DOT strategies for TB
the DOT itself, and recommend that WHO make explicit
both the mixture of inputs which are required to improve
adherence and the additional resources which successful
implementation of DOT usually requires.
The details of the clinical trial in Pakistan are published else
where (see Walley et al. 2001). However, the overall con
clusion - which is surprising - is that the directly observed
element made little difference to cure rates. Cure rates rose
from 26 to 60% in the trial group as a whole, with no statisti
cally significant difference between the different arms and
with similar results from the three sites. This raises some
important questions for the implementation of the DOT
. strategy in this and other countries.
This paper takes a social perspective, focusing on the costs to
the health service and to patients of the different treatment
strategies. These can be used to shed light on a number of
important questions:
What are the costs to patients of the different treatment
strategies? What proportion can be attributed to the
directly observed element? To what extent may these
costs account for (poor) compliance levels?
(2) What are the total (patient and health service) costs of
the different treatment strategies?
(3) What is the overall cost-effectiveness of the different
strategies, looking at total costs and cure rates?
Methods
Strategies compared
In order to assess the effectiveness of different DOT
strategies, a randomized controlled trial was carried out in
three trial sites (Rawalpindi, Gujranwala and Sahiwal) in the
Punjab, Pakistan, with three arms. All three received a
strengthened service (i.e. the other components of DOTS), but
one group had their treatment supervised by health workers,
a second by family members and a third were unsupervised.
,vithin the arm supervised by health workers, patients were
^ided into two sub-groups: those living within 2 km of the
nearest health centre were supervised by health workers based
in those centres, while more distant patients visited their local
community health worker (CHW), commonly a Lady Health
Worker (LHW). The health worker DOT followed the WHO
guidelines, adapted to the Pakistan context. In contrast, family
member DOT is not recommended by WHO, but was
included as a possible alternative when access to health
workers is poor. The self-administered group is the current
practice in Pakistan and was included as a control.
The treatment takes 8 months. The ‘intensive phase’, during
which observation of treatment is recommended, covers the
first 2 months. Three visits to a diagnostic centre are required
during the first 2 months, for initial diagnosis, sputum smears
and follow-up. During the remaining 6 months, a further two
visits should be made for sputum examination and clinical
assessment. During this second phase, all treatment groups
visit their local health facility every 2 weeks to collect their
drugs.
179
The main difference between the arms is the number of daily
visits required for direct observation of treatment during the
first 2 months. Patients allocated to the health facility group
made an additional 40 visits during this period to their local
health facility to be watched taking their drugs, while the
CHW group visited their village health worker an additional
53 times, and family member patients had 53 meetings with
the family member chosen to supervise their drug taking.
Costing
Patients
From the total of 497 patients in the trial (all adult), 337
(68%) were found and interviewed after the completion of
the trial. Of these, 194 were from rural areas and 143 from
urban. Forty-six belonged to the health facility group, 73 to
the CHW group, 107 to the family member group and 111
were unsupervised. The proportion found and interviewed
from each of the three trial sites ranged from 66-69%. Forty
eight per cent were male and 52% female.
Patient costs were collected using a standardized question
naire. Data collected included travel and transportation costs,
service charges, miscellaneous out-of-pocket expenses and
the opportunity costs of travelling to health facilities and
receiving treatment. Service charges (though at a subsidized
rate) were levied at two of the three diagnostic centres run by
NGOs; treatment was free at the government-run TB Centre.
Fees are added in to the totals for patient costs, in order to
illustrate the real costs to patients. They are omitted from
the final cost-effectiveness ratios in order to avoid double
counting with health service costs (the fees are contributing
to the service costs of the NGOs). Data on the cost of family
escorts were also collected (these are particularly relevant for
women).
In order to value the time lost during travel and treatment,
focus group discussions were held among patients arriving at
the TB Centre, Rawalpindi, and for different occupational
groups. Average losses (in Pakistan Rupees) were calculated
for each of the six main occupation groups: unskilled daily
labourers; skilled daily labourers; farmers; household
women; self-employed traders; and the unemployed. An
average opportunity cost of Rs.11 per hour was used to value
time lost for travel, waiting, treatment, observation of drug
taking, etc. This was a conservative estimate, based on the
assumption that a full day’s labour would not be lost. If
attending treatment meant losing the opportunity to work for
the full day (e.g. for day labourers), the opportunity costs
would be much higher (estimated average daily cost of
Rs.100).
Escorts often accompany the TB patients on their visit to the
diagnostic and treatment centres. This is more commonly the
case with female patients. Based on the interviews with
patients, gender-specific data were collected on the fre
quency of use of escorts. This was then used to calculate the
direct and opportunity costs that they incur. It was assumed
that the time and transport costs they face are the same as for
patients.
180
MA Khan et al.
Health service costs
Data on health service costs were collected from the three
trial sites (Rawalpindi, Gujranwala and Sahiwal). These
included:
• the costs of clinical assessment at the diagnostic centres
(including laboratory investigations and diagnostic pro
cedures, health education, record keeping, etc.);
• contacts at the treatment centre for drug collection (for
urban patients);
• cost of outpatient visits to basic health units and rural
health centres (for rural patients to collect drugs);
• the TB drug regimen;
• supervision of patients by their designated supervisors;
• costs of strengthening the programme (a one-off start-up
cost of setting up the TB DOTS programme).
For the diagnostic centres, expenditure data for 1997-8 were
used to estimate costs. To derive unit costs, cost centres were
set up for the various components of the programme (such as
clinical assessment, radiological investigations, laboratory
investigations, health education, record keeping and TB
drugs). Administrative or overhead costs were allocated to
them on the basis of the payroll costs of the service centres.
Two other allocation methods were tested: one using the
proportion of the budget allocated to the cost centre; the
other using number of persons employed in that department.
The first method was found to be weighted in favour of
departments with high expenditure (e.g. with large drugs
budgets); the second was found to favour departments with a
large number of support staff (such as clinical assessment).
The payroll method was found to be the most proportionate.
Annual building rent (based on the size of facility and market
rental values) was added to reflect the capital costs of the
programme. Similarly, a depreciation charge of 10% of the
value of fixed assets was added to reflect the economic costs
of equipment (using an estimated useful lifetime of 10 years
for most equipment, such as X-ray machines). Drugs and
supplies budgets were linked to number of patient visits to
produce average costs per TB patient.
At the district level, budget data for 1997-8 were used as the
basis for calculating average costs per outpatient visit to
peripheral units - the basic health units (BHU) and rural
health centres (RHC). Budgets are usually consumed, so this
was thought to be a good proxy for expenditure. Costs of
administration and supervision at the district level were
included, as well as funds allocated directly to the peripheral
centres. Based on interviews with officials, it was understood
that on average RHCs consumed three times the budget of a
BHU. This ratio was therefore used to allocate supervision
and administrative costs. Drugs costs were taken from the
annual budget for medicines. These costs were then linked to
numbers of patients visiting the health centres (taken from
the health management information system) to produce unit
costs.
Drugs costs were estimated at Rs.2000 per patient in the
provincial plan (PC-1). This was cross-checked against a retail
market survey, which came out with the figure of Rs.1915 for
a complete course of adult patients. As this was close, the
figure of Rs.2000 was used.
To calculate the costs of community health workers, two
sources were used: (1) the PC-1, issued by the government,
which details the costs of LHWs; and (2) interviews with
government officials to establish overall costs of employing
LHWs, and what proportion might be attributed to this
programme. A monthly cost for work on the programme was
calculated, including salary, supervision costs, driver costs
and petrol for travel. Interviews were carried out to assess the
time taken by CHWs and LHWs for patient visits and the
average number of patient visits per day (1997-8). From this,
a daily rate for LHW services was calculated, as well as a cost
per patient visit.
The costs of strengthening the programme were taken from
provincial plans for implementation of community-based
DOTS TB care in three of the four provinces (Northwest
Frontier, Punjab and Sindh; figures not available for
Balochistan). They include programme management, super
vision and monitoring costs; health education; training; and
investments in laboratory materials and salaries. Although
these are start-up costs for the programme (i.e. non-recurrent
in theory), it was decided to include them as they will be
necessary in most cases and should contribute to the higher
cure rate achieved. Overall costs were divided by the number
of patients treated, to gain an average cost per patient across
the different sites.
Although from a decision-maker’s point of view, marginal cost
information is preferable, this information was not available in
this study, and so average cost figures are used throughout. As
programme size, organization and/or utilization changes,
these unit cost figures will of course be altered.
The smaller items are reported in Pakistan Rupees (Rs),
while the main results are reported in US dollars ($). They
are converted from Pakistan Rupees at the exchange rate
prevailing at the time of the trial, which was roughly Rs.50.
US$1 (1997-8), and rounded up or down to the nearest
dollar.
Using the cure rates data from the clinical trial (which used
the WHO/IUATLD definition of cure - sputum negative at
7 or 8 months, and on at least one previous occasion), we
have calculated a cost per patient cured for the different
arms.
Results
Patient and family costs
Patient costs varied by site and rural/urban status. Generally,
costs increased with distance, as you would expect, so that
visits to diagnostic centres were more costly than treatment
centres, etc. Average figures for distance, time and direct
costs incurred per visit are presented in Table 1. Note that the
service charges are based on two sites only, as there were no
charges made at the government centre at Rawalpindi.
181
Cost and effectiveness of DOT strategies for TB
Table 1. Average distances, times and costs per visit for TB trial patients
pistances - average distance from home to the:
Diagnostic centre
Treatment centre
CHW/LHW
Family supervisor
Time - average time spent in travel to and from.
Diagnostic centre
Treatment centre
CHW/LHW
Family supervisor
Costs - travel, to and from:
Diagnostic centre
Treatment centre
CHW/LHW
Family supervisor
Costs - misc. out of pocket expenses:
Diagnostic centre
Treatment centre
' ’’W/LHW/Family supervisor
Cg
- service charges at diagnostic centre
(apply in two sites only; averaged over three):
Clinical assessment
Lab. Investigation: ESR
Lab. Investigation: Sputum microscopy
Lab. Investigation: X-ray/MMR
Pharmacy
An urban patient incurred direct costs of Rs.32 per visit to the
diagnostic centre (either for diagnosis/treatment, or drug
collection). Added to this was Rs.38 in opportunity costs for
diagnosis/treatment (based on the valuation of Rs. 11 per
hour), and Rs. 18 in opportunity costs of drug collection. A
rural patient incurred direct costs of Rs.63 per visit to the
diagnostic centre and Rs.13 per visit to the treatment centre.
Their average opportunity costs were Rs.59 for visits to the
diagnostic centre and Rs.17 for visits to the treatment centre.
/ >atients make five visits to the diagnostic centres, and 17
tc _ catment centres to collect drugs. The health centre group
had an additional 40 visits to their treatment centre for DOT;
Mean
Median
15 km
6 km
2 km
0 km
12 km
4 km
1 km
0 km
136 minutes
76 minutes
19 minutes
0 minutes
120 minutes
60 minutes
20 minutes
0 minutes
18 Rs.
8 Rs.
2 Rs.
0 Rs.
16 Rs.
6 Rs.
IRs.
0 Rs.
33 Rs.
13 Rs.
0 Rs.
10 Rs.
0 Rs.
0 Rs.
29 Rs.
12 Rs.
35 Rs.
90 Rs.
21 Rs.
20 Rs.
0 Rs.
0 Rs.
0 Rs.
0 Rs.
while CHW and family supervision patients had 53 additional
visits for DOT. The average costs of visiting the CHW for an
urban patient was Rs.5 (i.e. Rs.265 total), while rural patients
incurred Rs.2 per visit (Rs.106 total). These reflected oppor
tunity costs only: no direct costs were incurred. For family
member patients, no additional costs (direct or opportunity)
were thought to have been incurred. Table 2 shows total
patient costs, by treatment arm. The differences in total
patient costs are attributable to the DOT element.
A patient follow-up survey (with a 67% response rate)
carried out as part of this trial sheds some light on compliance
issues (see Table 3).
Table 2. Total patient costs, by treatment arms
Patient direct costs of visits to diagnostic centre
Patient direct costs of fortnightly drug collection from
local health facility
Direct costs of additional DOT visits
Opportunity costs of visits to diagnostic centre
Opportunity costs of fortnightly drug collection
Opportunity costs of additional DOT visits
Total patient costs
Unsupervised/family
member DOT
(US$)
Health facility DOT
(US$)
Community health
worker DOT
(US$)
5 (3 urban; 6 rural)
8 (11 urban; 4 rural)
5
8
5
8
n.a.
5 (4 urban; 6 rural)
6
n.a.
23
18 (26 urban; 10 rural)
5
6
14
55
2
5
6
5
31
MA Khan et al.
182
Table 3. Constraints to treatment - patients’ responses
Barriers to treatment
Intensive phase (%)
Continuation phase (%)
Health-related problems
Time for round trip
Cost of travel/visit
Excessive waiting time at treatment centre
Unavailability of person to accompany
Social events - birth, death, marriages, etc.
Job/occupational reasons
Unfriendly attitude of staff
Lack of support by ‘significant people’
Other
36
31
29
16
14
11
9
4
1
2
19
21
17
7
6
9
10
1
0
1
Table 4 shows the total escort costs, by treatment arm, gender
and place of residence. These costs are not included in the
total cost and cost-effectiveness results as their influence on
compliance is not established and they may be less applicable
in other contexts.
Health service costs
An average visit to the diagnostic centre cost the health
service Rs.24 for clinical assessment. Adding in the costs of
other inputs, such as pharmacy costs, record-keeping, etc. the
costs of treating one patient were estimated at Rs.1364 in the
intensive phase (for three visits) and Rs. 1149 in the continu
ing phase (for two visits). This comes to a total of Rs.2513 per
patient.
The cost of a visit to the treatment centre for drug collection
came to Rs.93 per patient (including the cost of drugs). The
total for rural patients was therefore Rs. 1581 for 17 visits. The
urban patients collected their drugs from the diagnostic centre,
at a cost of Rs.40 per visit, or Rs.680 in total for 17 visits.
The additional costs to the health service of DOT depend
on the treatment arm. Rural patients in the health centre
sub-group made 40 additional visits for DOT to the treatment
centre, at a cost of Rs.93 per visit (Rs.3720 in total). Urban
patients visited the diagnostic centre 40 additional times, at a
cost of Rs.24 per visit (Rs.960 in total). CHW-supervised
patients had an extra 53 visits from CHW/LHW, at a cost of
Rs.6 per visit (Rs.106 in total).
Programme strengthening costs averaged Rs.425 per person
for all treatment arms.
Table 5 presents the total health service costs, by treatment
arms. As with the total patient costs, the differences between
the final figures are entirely due to the DOT element of the
package.
Table 4. Costs of escorts (by treatment arm and by gender)
Unsupervised treatment
Health facility
Community health worker
Family member
Urban, male (US$)
Urban, female (US$)
Rural, male (US$)
Rural, female (US$)
10
26
9
10
18
46
19
18
8
12
7
8
16
33
19
16
Unsupervised/family
member DOT (US$)
Health facility DOT
(US$)
Community health
worker DOT (US$)
8.5
50
8.5
50
8.5
50
23 (14 urban; 32 rural)
23
23
n.a.
81.5
47 (19 urban; 74 rural)
128.5
6
87.5
Table 5. Average health service costs for DOT per patient (by treatment arm)
Programme strengthening cost
Costs of clinical contacts at diagnostic centre for diagnosis
and follow up
Costs of clinical contacts at local health facility for
fortnightly drug collection
Health service costs of additional DOT visits
Total health service costs
Cost and effectiveness of DOT strategies for TB
■
■
entre,
-pen^1
:ent.
tment
Jrban
s, ata
vised
ost of
183
jn Table 6, patient and health service costs are added to give
(he overall cost of each treatment arm. Total costs are
oresented for rural and urban areas, within each treatment
arm- The cost of the health facility and CHW DOT arms are
presented in relation to the benchmark of self-administered
or family DOT approaches, in order to illustrate the magni
tude of increase in total costs for these arms.
of practice within the current WHO DOTS package. Accord
ing to these results, self-administered treatment is the most
cost-effective. However, the preferred option might be treat
ment supervised by CHWs, which is slightly more costly but
has a higher cure rate. The incremental cost of shifting from
self-administered to CHW supervision is $239 per extra case
cured.
The results (in Table 7) suggest that self-administered treat
ment has been the most cost-effective approach in this case
($164 per case cured), though CHW supervision is only
slightly more costly ($172 per case cured) and achieves a
higher cure rate. Least cost-effective is health centre DOT
($310 per case cured).
The sensitivity analysis supports these conclusions. At every
level of likely cure rates, the health centre option comes out
as the least cost-effective, and the self-administered group as
most cost-effective. The only exception is when the CHW
group cure rates are at the top of their range; this option then
becomes the most cost-effective approach.
A sensitivity analysis was done on the final cost per case
cured, to see how it was affected by changes in the cure rates.
The upper and lower limits of confidence intervals for differ
ences between the different DOT arms and the control group
cure rates were taken from the original clinical trial. The
results are shown in Table 8.
Discussion
Cure rates for the CHW group have to be treated with some
caution though, as this group was not fully randomized in the
clinical trial (patients were randomized to the health worker
arm as a whole, but within that were divided into health
centre and CHW sub-groups according to how far they lived
from the health centres). It is therefore possible that there is
some bias in the allocation of patients between these two
sub-groups.
In terms of cost-effectiveness, from this analysis health
centre DOT comes out as least cost-effective, which is an
interesting result as this has been the recommended model
For the health worker group as a whole, there is no statisti
cally significant improvement in cure rates compared with
the other two arms. As the cure rates are broadly the same
erson
Table 6. Total cost to health service and patients of different treatment arms
ment
ween
)f the
Total cost
Total cost as % of benchmark
(unsupervised arm)
•S$)
Health facility
DOT
Community health
worker DOT
$102
($93 urban; $110 rural)
100%
$180
$115
($153 urban; $208 rural)
176%
($107 urban; $124 rural)
(164% urban; 189% rural)
114%
(115% urban; 113% rural)
Table 7. Cost-effectiveness of the different treatment strategies
Cure rate
Cost per patient treated
Cost per case cured
th
S$)
Unsupervised/family
member DOT
Health centre DOT
Community health
worker DOT
Family member DOT
Unsupervised
58%
$180
$310
67%
$115
$172
55%
$102
$185
62%
$102
$164
Table 8. Sensitivity analysis of cure rates and their effect on cost per case cured
Treatment arms (or sub-groups)
Lowest estimate of cure rate (95% CI)
Highest estimate of cure rate (95% CI)
Family member group
38% cure rate
$276 per case cured
50% cure rate
$360 per case cured
59% cure rate
$195 per case cured
59% cure rate
$178 per case cured
70% cure rate
$257 per case cured
79% cure rate
$146 per case cured
Health centre group
Community health worker group
184
MA Khan et al.
across the different treatment arms, it is possible to speculate
that some of the positive motivational effects of DOT were
cancelled out by the increased costs which patients faced,
leaving the results roughly the same as if no DOT had taken
place.
have reinforced existing conclusions, as the highest costs are
incurred by the health centre group. Similarly, a less
conservative valuation of the opportunity costs of patient
time would have increased the strength of the current
conclusions.
What the cost data highlights is the degree of additional finan
cial burden that direct observation imposes, especially in the
case of the health centre patients. This approach increases the
health services costs by 126% for urban patients and 182 /o for
rural. At the same time, patient costs rise by even more: 267%
for urban patients and 207% for rural patients. During the
intensive phase of treatment, DOT at health facilities
accounts for 62% of patient costs in urban areas and 52% in
rural areas. For the CHW group, DOT accounts for roughly
25% of rural and urban patient costs.
Another debatable item is the inclusion of programme
strengthening costs. It might be argued that these are a oneoff investment that would not form part of the on-going costs
of running the programme. However, we have included them
for three reasons: first, because they are a necessary part of
implementing DOTS in most regions; secondly, because they
may contribute to higher effectiveness and utilization rates,
and may therefore lower unit costs in the medium to long
term; and thirdly, because they contributed to the cure
rates achieved here, and so it would be false to report cost
effectiveness results without including them.
The high costs to the patient of direct observation by health
workers (especially in the health centres) are likely to have an
influence on compliance levels. Within the trial, 18 /o of
patients randomized to the health worker DOT (either health
centre or CHW) were unable to persevere and were given
self-administered treatment (Walley et al. 2001). For family
member DOT, the figure is 2%, reflecting perhaps the lower
patient costs incurred by this arm.
How typical are the costs included here - how likely are they
to be valid for other settings? One issue is whether patients
are charged for drugs and treatment. In some situations these
are free; at other times (especially in the private for-profit
sector) patients have to pay. This picture is reflected in this
study, with two centres charging (at a subsidized rate) and the
third providing treatment free of charge.
One issue is whether the patients who responded (68%) are
representative of the total sample in the trial. The break
down by trial site, by gender and by location suggests that
they should be fairly representative. The proportion
responding by trial site has a narrow range of 66-69%. Fiftytwo per cent of respondents were female and 48% male
(compared with 49% female and 51% male in the full trial
sample). In terms of location, 58% were rural and 42% urban
(not very different from the trial sample of 56% rural and
44% urban).
Consistent with other results, the escorts' costs show the
health facility approach to be most costly. For all treatment
arms, women are likely to incur about twice the cost of men
in terms of escorts’ time and expenses. Another interesting
feature is that the costs of access, for escorts, to urban health
facilities appears to be higher than for rural patients, which is
contrary to what we might have expected.
The reason why CHW patients’ escorts incur lower costs in
some categories than family member escorts is that family
member patients have to visit their local health facility fort
nightly to collect drugs, whereas this function is performed by
the CHW on behalf of their patients.
This study provides a very comprehensive view of the costs to
the health service and to patients of the different DOT
strategies. The decision to include patient costs can be
justified by the nature of the programme itself, which imposes
considerable inconvenience on patients (daily visits to receive
drugs), and on their family members where escorts are
required. The decision to list escort costs separately is de
batable; arguably if the study takes a societal perspective
these should have been included. Had we done so, it would
The costs reported here do of course reflect utilization levels.
How typical are they of other regions? In Pakistan, generally,
utilization is high for diagnostic centres, but lower for periph
eral treatment centres. As many of the programme costs are
stable over large ranges of output, an increase in utilization
would result in lower costs per case treated or cured.
One of the main questions of interest is how to increase utiliz
ation and compliance rates for TB programmes worldwide.
This study suggests that there may be a link with the costs to
patients, although this conclusion needs to be examinee
further in in-depth interviews with patients and relatives. One
of the striking differences in the trial was between drop-out
rates for men and women: 15% of women dropped out in the
intensive phase, compared with 25% for men (a statistical y
significant difference). One possible explanation for this is
that men face higher opportunity costs of treatment an
direct observation because they are more likely to be econ
omically active (the focus group discussion suggested that
housewives were likely to be able to rearrange and share
activities to fit in with treatment). This may have contributed
to a dramatic difference in overall cure rates: 71% for women,
compared with 50% for men. (In Walley et al. 2001. sex was
the only factor tested which was found to have a statistica y
significant impact on treatment outcome. The relationship
with income was not investigated.) Another factor may
that the social consequences of the disease (e.g. on marriag
ability) are more significant for women than for men ( a
et al. 2000).
Analysis of default rates by treatment arm provides a
more complex picture. Default rates are highest for the se
administered arm (33%) and lowest for the health
arm (27%). However, within the health worker arm, cn
Cost and effectiveness of DOT strategies for TB
patients had a lower rate (25%) compared with health centre
patients (30%). There may be a number of factors at play
here, including positive motivation of health workers and the
disincentive effects of distance and time.
In the survey of constraints to treatment, from a patient
perspective, time, costs and poor health come out as the top
three factors. In addition, there are probably social costs to
being identified as having TB. Two-thirds (63%) stated that
they keep their disease secret from most of their relatives,
while a similar proportion (64%) felt that their relationship
with ‘significant people’ was affected by the disease. Inas
much as direct observation makes their condition more
public, it is likely to generate additional non-monetary social
costs, such as stigma effects. When asked why they agreed to
direct observation in this trial, the largest response was ‘to get
short, free and quality treatment’ (68%). It seems likely that
from a patient’s perspective, it is the non-DOT components
of DOTS that are attractive.
C. jlusion
This study highlights the costs - both direct (fees, transport
costs, etc.) and indirect (the cost of time lost from work as a
result of treatment) - for patients as well as for health services
of the DOT. If this model results in improved outcomes, then
the costs may be justified. However, the clinical trial found no
significant improvement in cure rates attributable to the
element of direct observation within the DOTS model. In this
context, there is little justification for imposing a high burden
of inconvenience and economic costs on patients - costs that
may constitute a major barrier to utilization and compliance
with treatment.
Some of the correlations found between drop-out rates and
different patient groups (by sex, economic occupation and
treatment arm) merit further investigation in a social study to
establish more clearly the factors that influence health
seeking behaviour.
O" ffie basis of the analysis here, a provisional recommend
n might be made to broaden the range of strategies
employed to enhance patient compliance, beyond the
element of direct observation (e.g. blister packs of drugs and
patient education). Using CHWs for DOT also looks promis
ing. This conclusion is consistent with the results of other
related studies carried out to date (for example, Floyd et al.
1997 and Wilkinson and Davies 1997), and also with trends in
WHO. WHO/StopTB is now using the DOTS label to refer to
the broad TB strategy, and putting less emphasis on the direct
observation component.
Cure rates for health centre observation were lower than
self-administered patients, and this category generated the
highest costs, both to patients and the health service ($310 per
case cured). The standard type of observation recommended
by the WHO DOTS model therefore came out as having the
highest cost per case cured, while the CHW arm achieved the
best cure rates and at a cost only slightly above the self
administered group ($172 per case cured, compared with
185
$164). While the cost figures will vary from place to place, the
underlying conclusion is likely to remain the same: that DOT
(especially at health facilities) imposes considerable patient
and health service costs, which can only be justified by proven
benefits.
References
Floyd K. Wilkinson D. Gilks C. 1997. Comparison of cost
effectiveness of directly observed treatment (DOT) and con
ventionally delivered treatment for tuberculosis: experience
from rural South Africa. British Medical Journal 315: 1407-11.
Kamolratanakul P, Sawert H. Lertmaharit S et al. 1999. Randomized
controlled trial of directly observed treatment (DOT) for
patients with pulmonary tuberculosis in Thailand. Transactions
ofthe Royal Society of Tropical Medicine and Hygiene 93:552-7.
Khan A, Walley J, Newell J, Imdad N. 2000. Tuberculosis in Pakistan:
socio-cultural constraints and opportunities in treatment. Social
Science and Medicine 50: 247-54.
Volminck J, Matchaba P, Garner P. 2000. Directly observed therapy
and treatment adherence. The Lancet 355: 1345-50.
Walley J, Amir Khan M, Newell J, Hussain Khan M. 2001. Effective
ness of the direct observation component of DOTS for tuber
culosis: a randomised controlled trial in Pakistan. The Lancet
357: 664-9.
Wilkinson D, Davies G. 1997. Coping with Africa’s increasing tuber
culosis burden: are community supervisors an essential
component of the DOT strategy? Tropical Medicine and Inter
national Health 2: 700-4.
Zwarenstein M, Schoeman J, Vundule C, Lombard C, Tatley M.
2000. A randomised controlled trial of lay health workers as
direct observers for treatment of tuberculosis. International
Journal of Tuberculosis and Lung Disease 550-4.
Acknowledgements
We would like to acknowledge the support of the National TB
Programme Manager in Pakistan. Dr Hussain Khan, and subse
quently Dr Karim Shah, in developing the project, and also the
inputs in the design stage of Katherine Floyd. Lorna Guinness and
Lilani Kumaranayake.
Biographies
Amir Khan, MPH. DHA, MBBS, is chairman of the Association for
Social Development (ASD) in Islamabad, Pakistan, and Senior
Research Fellow on the DFID-funded Tuberculosis Research Pro
gramme, managed jointly by the London School of Hygiene and
Tropical Medicine and the Nuffield Institute of Leeds. He has written
a number of articles on tuberculosis control and DOTS in Pakistan.
John Walley, MBBS, DRCOG. MRCGP, DTM&H, MCOMH,
MFPHM, is a public health specialist and senior lecturer at the
Nuffield Institute for Health, University of Leeds. He is Director of
the Leeds TB research and development programme. He has been
the principal investigator on the TB trial and social studies and
ongoing support to the national TB programme in Pakistan. The pro
gramme has similar work ongoing in Nepal, Swaziland and else
where. Previously he worked as regional advisor in Ethiopia and
provincial medical officer of health in Zimbabwe, implementing TB,
MCH and other PHC programmes.
Sophie Witter, MA Econ., is a Research Fellow at the Centre for
Health Economics, University of York, UK. She is co-author of
Health economics in developing countries: a practical guide (Mac
millan, 2000) and An introduction to health economics for Eastern
Europe and the former Soviet Union (Wiley, 1997).
186
MA Khan et al.
Imran Amjad, MBA, is a financial analyst with experience in
Pakistan’s health management projects. He recently participated in
the development of Pakistan Women’s Health Project for the Asian
Development Bank. During his employment with USAID, he helped
to develop and monitor projects such as primary health care, popu
lation welfare planning, malaria control, child survival project and
social marketing of contraceptives. He has recently conducted a
financial management review of autonomous hospitals in the Punjab,
Pakistan.
Nauman Safdar, MBBS, MBA, is Executive Research and Develop
ment officer for ASD. Pakistan. He is a joint author on papers
looking at the process and outcome of TB treatment in Pakistan and
at the syndromic management of STIs in Pakistan.
Correspondence: Sophie Witter, Research Fellow, Centre for Health
Economics, University of York, York YO1 5DD, UK.
1
1
-
n.
if
o
ORIGINAL articles
SB ■
J*
TClBER CQL OSIS
Sector Priori^a number ofcollaborators
of major clusters of diseases in the developinyy^d^ °S°n ‘he public
s
available technologiesfor their prevention and r
°n
COS‘S and effectiveness o
one of these studies has proven to beoneof^emana8emen‘- This ana‘y^ oftuberculoses
^erculosis and lhe existence of intentions pTovenT^
The Presemd°nalhea,,h ar^entarium
are Some of'^ ^st co.
our readers who spt
tUby^Sis-‘^ure^nconn^^^
!
I
t uberculosis in l
__,
developing
countries :
burden, intervention
"-J and cost
r
■K.
th
r
U1
■Ci™ “URRAY*' K' STYBL0" «"1 A. ROU1LLON
8
**
r 1 '
I
68 b°U’eV-rd S^t.Mlchei, 750W Parla> Frjlnct
! |l: S I
I
Introduction
■M=
"»»
Room S-6141, the The World sink Wd h UtrillOn Dlvlsi'on,
The conclusions of these
, nglon DC 20433r
wSS:40
8
Major
J>"S b“" 1
I
i
tabs in Europe (P^p'» « » »»
I '
ii
H
evidence that irrcsDccove nr iic. ’ 72^; There is reliable
problem in developed countries ?lag/’ltudc’
'“bcrculosis
for the last 40 years tfle?r he , T bCCn dccreasing al least
crease in mo^lhyfrom iXSe
3 Stead> de-
apy era was observed from the turn of df prc'chcmothcrbefore (Frost. 1937 ; SwTlT 1980)
"CnlUry if "ot
. tuberculosis in mostdevelonej
■’ Th c,lm,nation of
dally influenced by AIDS tecau^ oTm 7" nO‘ Sljbstan1 tuberculous infection insub^cXd on msn PrCValCnCC °f
•nfect.ou is most frequZt (S®Wh°m
con^nucs to^a'rn^'or'Dr0^0^0^
W==iS
sOlps
Tuberculosis incidence and mortality
Tuberculosis incidence
4«Ssste5
been virtually no ttidcnc^f"1 “'’Il,,crc aPPcars to have
y ° tCndcncy for tuberculosis to eliminate
iil I
6
’? !k
iuii ‘ ^^‘WSRiRWi*'
h , x, 1.
■
-
-
J1
fe
o
o
o
o
w
tuberculous infection and the incidence of smear-positive
pulmonary tuberculosis, the proportion of all cases of tuber
culosis that arc smear-positive and case-fatality rates for
$mear-positivc tuberculosis and other tuberculosis.
I
I
F
b
If
if
>?5
i
Annual average risk of tuberculous infection
Tuberculosis epidemiologists have used the ability to
detect the presence of infection using skin tests to measure
! the prevalence of infection in communities. A technique has
been developed for converting this information on.prevalence of tuberculous infection into a series-of annual risks of
tuberculous infection (Styblo el al., 1969a ; Sutherland, •
1976). If several tuberculin surveys of the same population
have been made al different times (using similar techniques
and testing a representative sample of non-BCG-vaccinated
subjects of the same age) the level of and percentage decrease
in the risk of infection can be estimated. The annual risk of
infection Tells us the probability that any individual will be
infected or reinfected with M. tuberculosis in one year. This
measure has become the standard indicator of the tuberculo
sis burden in a community (Lcowski, 1988).
Since the 1950’s a variety of tuberculin sensitivity surveys
in developing countries provide us with an approximate
picture of the annual risk of infection in different regions of
the developing world. Table 1 presents our best estimates
based on a recent review of survey data on the annual risk of
infection (Cauthen et al., 1988). The annual risk of tubercu
lous infection is probably highest in sub-Saharan Africa,
followed closely by South and East Asia. For comparison the
annual risk of infection in the Netherlands _in_ 1985 was
\ 0.012 %JStyblo, 1989)7
■ Incidence of smear-positive tuberculosis
The natural history of tuberculosis illustrates that the main,
I source of infection are patients suffering from smear-posi-i
in live pulmonary tuberculosis. For the rest of this paper,
-r- therefore, tuberculosis will be divided into two categories: i)
m- I sputum smear-positive tuberculosis, which will be referred
by the shorthand smear-positive tuberculosis, and ii) other
tuberculosis, which includes those cases of pulmonary tuber
4 t0
i to
Incidonce Smear • TB Per 100.000
nus
600
jiin
bns
500
;>1S,
400
300
3
200
fjl to
100
or r
w
5:rns |:
O
8
2
10
Annual Risk of Infection
7in'! jCU- '
jource: Styblo. unpubll»h>d.________________________
hate j
;,ni' I figure
, I. The relationship between the annual risk of infection
(
Jkof
snd the incidence of smear-positive tuberculosis.
Table 1. Estimated risks oftuberculous infection and their trends
in developing countries, 1985-90
Area
Estimated risk
of tuberculous
infection (%)
Estimated annual
decrease In risk
of infection (%)
Sub-Saharan Africa
North Africa and
Western Asia
Asia
South America
Central America and
Caribbean
1.50-2.50
1-2
0.50 -1.50
1.00-2.00
5-6
1 -3
0.50 - 1.50
1-3
-
■■■
.1
i>' i
la
:i
I
h
1
II
Source : Based on data presented in Cauthen et al. (1988).
li..'
culosis that are sputum smear-negative and extra-pulmonary
tuberculosis. As children rarely suffer from sputum smear
positive tuberculosis, most cases of tuberculosis in children
will be included in the category other tuberculosis. (If chil
dren arc smear-positive, they are, as adult patients, highly
infectious sources of infection. If they are smear-negative/ i
culture-positive or smear-negative/cullure-negative they are
much less infectious.) The above two categories arc some
times labelled infectious tuberculosis and non-infectious
tuberculosis, respectively (e.g. Ministry of Health and Fam
ily Welfare, India 1986). The distinction between sputum
smear-positive tuberculosis and other tuberculosis is particu
larly important when considering the policy options for
tuberculosis control and prevention (Rouillon el al., 1976).
Lack of data on smear-positive tuberculosis cases in
developing countries makes it difficult to convey the enor
mity of the tuberculosis problem to the public health commu
nity. It is not possible to readily obtain reliable information
on incidence of smear-positive tuberculosis in developing i
countries because case-detection rates can be only a fraction 1
of the respective true incidence rates.
The relationship between the annual risk of infection and
the incidence of smear-positive tuberculosis can provide one
of the only means of estimating the incidence of smear- ‘
positive tuberculosis (Styblo, 1985,1988). Styblo examined
the relationship between the annual risk of infection and the
incidence of smear-positive pulmonary tuberculosis using a
variety of data sources from the developing and developed
world. [We have recomputed this relationship using only the
results of a scries of WHO sponsored surveys in developing
countries and data from the Netherlands before chemother
apy was widely available. We must note that for some of
these surveys data are available on the prevalence of smear
positive tuberculosis, not the incidence. In such cases, the
incidence rales were derived using the historical observation
that the prevalence of smear-positive tuberculosis was usu
ally twice the incidence in the communities without wide
spread institution of chcmotherapylHolm, 1970). In these
developing countries, the relationship beween the annual
risk of infection and incidence of pulmonary smear-positive
tuberculosis was linear. A least squared regression line
(Figure I) gives an estimate of 49 cases of smear^pqsitive tuberculosis per100,000 for every 1 % annual risk of infection.
The 95 % confidence interval for the coefficient is 39 to 59.
7
-
i
li
II
.1
I
ii
hi
■I
{I
i
II ■!
I
I I
ii
||
I
I
1! ‘S'
i
.'I.'...,..
o °
O'
1
o
I
!
Table 2. Estimated incidence of smear-positive tuberculosis in
developing countries, 1990
Area
Estimated number of cases Incidence
Low
Midpoint
High
rate
Sub-Saharan
Africa
296,000
521,000
North Africa and
53,000
146,000
Western Asia
1,142,000 * 2.298.000
Asia
57,000
160,000
South America
Central America
83,000
and Caribbean 30,000
Total
h
E
!0
i
t
■-
ill
I If
Ilf
I
Ir
1,578,000
3,208,000
745,000
103
239,000
3,455,000
263,000
54
79
54
136,000
54
4,838,000
77
Note : Based on the annual risk of infection for each region
presented in Table 1, the 1990 population and an incidence of
39 to 59 cases per 100,000 for each one percent annual risk of
infection.
I
I
:
o
Using the estimates of the risk of infection for different
regions in Table 1 and the confidence interval for the rela
tionship between incidence of pulmonary smear-positive
tuberculosis and the risk of infection, the low and high
estimates of the incidence of smear-positive tuberculosis for
different regions in Table 2 have been calculated. The
midpoint of the confidence interval of the estimates of
smear-positive incidence is 3,208,000 cases or an incidence
of 77 per 100,000 in the developing world. These must be
viewed as only crude estimates, which nevertheless illustrate
the continuing magnitude of the tuberculosis problem.
Age distribution of smear-positive tuberculosis
The age-distribution of incidence is important in deter
mining the public health impact of smear-positive tuberculo
sis and the most appropriate means of preventing or control
ling tuberculosis. From the historical record of developed
countries and epidemiological models, the age and sex
distribution of incidence appears to change as the annual risk
of infection declines. As the majority of developing countries j
have an annual risk of tuberculous infection between 1.0 %
and 2.0 %, we propose to use the age-distribution of the
incidence of smear-positive tuberculosis from a developing
country with an annual risk of infection in this range (Tanza
nia). There is no reason to believe that the epidemiology and
thus the age distribution of incidence for a given annual risk
of infection will vary substantially between communities.
Because *he tuberculosis control programme in Tanzania is
well organized and captures the majority of tuberculosis
cases, the age-distribution from Tanzania will be used as
representative of the developing world where the risk of
tuberculous infection is between 1 and 2 %. Figure II shows
the age-distribution of smear-positive tuberculosis in Tanza
nia for 1985-87 (Chum et al., 1987 ; Chum, 1989). The
pattern is similar to other developing countries such as
Mozambique, Malawi and Benin that have good reporting
systems (IUATLD 1988). It is important to note that BCG
coverage in Tanzania was roughly 50 % in 1983-87 (Bleiker
el al., 1987) - based on scar examination in the National
8
Tuberculin Survey in Tanzania carried out from 1983 to 19J
on 80,000 schoolchildren from 20 regions selected at randcs
which is below the officially reported average for the devt
oping world (UNICEF, 1988). Thus, any effect such BCt
coverage may have on preventing tuberculosis in children;
partially represented in the age-distribution; as world BQ
coverage is probably higher than in Tanzania, the estimi
for the incidence of smear-positive tuberculosis in childr*
based on this age-distribution may be slightly high. ClearE
smear-positive cases are relatively rare in children ; smea
positive tuberculosis is concentrated in adults 4- more m.
80 % of cases occur between the ages of 15 and 54, accordit
to the data from Tanzania.
Incidence of other forms of tuberculosis
Estimates of the incidence of smear-negative pulmonaand extra-pulmonary tuberculosis are also needed. The
forms of tuberculosis are particularly difficult to quantify;
the major diagnostic tool used in developing countriej
sputum microscopy, does not detect these cases. Because l
diagnosis of extra-pulmonary tuberculosis is often based/
clinical criteria, no survey data are available to estimate i
relationship between the risk of infection and other tuberc
losis. In the past, estimates of smear-positive tuberculoshave simply been doubled to provide a figure for oil/
tuberculosis (Styblo and Rouilion, 1981 ; Leowski, 198§
The distribution of total cases between the categories sputc
smear-positive and other tuberculosis cannot be accurau;
established. Whereas smear-positive tuberculosis and tube
culosis positive by culture only can be objectively detd
mined, the number of culture-negative cases delected 4
pends on various factors, such as active case-finding by Mf
Miniature Radiography (MMR) extensively used in Euro|
in the 1950’s, 1960’s and 1970’s, criteria for activity,
asymptomatic cases detected by active case-finding,
groups, etc. However, we will assume that within each ac
group using the same diagnostic approach the percentage
cases that are sputum smear-positive and other should be d
same relatively independent of the overall annual risk:
Percent of Caaee
301---------------------------
26
20
16
10
6
0
0-14
16-24
26-34
36-44
46-64
66-64
66*
Age-Group
Figure IL The age distribution of smear-positive tubercuL
detected in Tanzania, 1985-1987.
■_, • < \ library
i
)
infection. Using data for the United States and Norway,
P»rc»nt Smear Positive
Figure III illustrates the proportion of all tuberculosis cases
that arc smear-positive by age (Galtung, 1955;CDC, 1989).
60
Because the data set for the US is larger and no MMR was
60
used on a large scale, we will use the ratio of cases of other
40
tuberculosis to smear-positive tuberculosis within each agegroup in the United States. Using the age-distribution of the
S
30incidence of smear-positive tuberculosis in Tanzania and the
20
age-specific ratios of other to smear-positive in the United
10
States, we have derived a rough estimate of the age-distribu
tion of other tuberculosis shown in Figure IV. While the
0-14
16-24
26-34
36-44
46-64
66-64
65«
assumptions underlying these estimates of other tuberculosis
Age-Groups
may be challenged on many grounds, we feel it is preferable
to make some objective attempt to estimate the age-distribu
tion of smear-negative and extra-pulmonary tuberculosis in
developing countries because it is an important input to
policy decisions.
Figure III.The percent ofall cases oftuberculosis that are smearOur estimations imply that there are 1.22 cases of smear- )
positive, USA 1985-19W and Norway, 1951-1972.
negative and extra-pulmonary tuberculosis for every case of |
smear-positive tuberculosis in developing countries with an ;
annual risk of infection between 1 and 2 % and an overall_____
'
______________
age-distribution similar to Tanzania. Table 3 provides low
Percent of Caaea
and high eslimales of the number of new cases of smear
30 |--------------------------negative and extra-pulmonary tuberculosis for each region in
26
the developing world. For all types of tuberculosis combined,
Table 4 indicates that the incidence of tuberculosis exceeds
20
220 per 100,000 in sub-Saharan Africa.
.1
i
H
!
!
I
li..........
16
Tuberculosis mortality
J
I
to
Case-fatality rates, untreated
In order to calculate tuberculosis mortality from the
estimates of incidence derived above, we need to estimate
the case-fatality rate. Without appropriate chemotherapy,
tuberculosis is highly fatal. The results of several studies in
developed countries before chemotherapy became available
demonstrated mortality rates consistently in the 50 % to 60 %
range (Drolct, 1938 ; Lindhart,......
1939 ; Galtung
,.w Hansen,
___ ,
1955). These observations were confirmed in the five-year
study of tiie natural histoty of tuberculosis in Bangalore,
Table 3. Estimated incidence of other tuberculosis in developing
countries, 1990
I
B
Area
I
- Hl
iI
Estimated number of cases Incidence
Low
Midpoint
High per 100,000
Sub-Saharan
Africa
361,000
635,000 909,000
North Africa and
Western Asia
64,000
178,000 291,000
Asia
1,393,000 2,804,000 4,215,000
South America
71,000
196,000 321,000
Central America
and Caribbean
37,000
101,000
166,000
Total
1,926,000
3.914,000 5.902,000
6
0
0-14
66
94
Note : The incidence of other tuberculosis has been based on
USA data showing the relationship between smear-positive
tuberculosis and other tuberculosis by age combined with the
age-distribution of smear-positive tuberculosis in Tanzania.
25-34
36-44
46-64
8-EB Smear Positive
illI ■
! Ml
■
if
1 Ml
til I
I I
.1
““ B i
1 I
'll' I
nB
1
■ III
M
66*
Age-Groups
■I fffc I
Other
IH I
l
Figure IV. / he estimated incidence of smear-positive and other
tuberculosis by age for the developing world in 1990.
India: 49 % ofbactcriologically confirmed cases (smear- and
culture-positive cases or smear-negative and culture-posi
tive) died within five years (National Tuberculosis Institute,
Table 4. Estimated incidence of all forms of tuberculosis in
developing countries, 1990
Area
126
66
96
66
16-24
f
Ml
1
i
■
hi
Estimated number
Incidence
of cases
per 100,000
Low
Midpoint
High
Sub-Saharan
Africa
656,000 1,156,000
North Africa and
Western Asia
117,000
323.000
Asia
2,535,000 5,102,000
South America
129,000
356.000
Central America
and Caribbean
66,000
185,000
Total
>
1,655,000 229
530.000
7.670,000
584.000
120
174
12?)
302,000
120
3,503,000 7.122,000 10,741,000
171
iW
f
I It
if
HL
I "fl
9
BkIWX
I
TH
o
II
O
!
O'
o
I
0
i| ■'
I
1
a
■
Ii■
I
I’ I
1
Id
t'
?!
-
Tuberculosis death rates in developing countries
The tuberculosis death rates in developing countries can
not be as high as implied by the incidence rates and a case
fatality rate of 50-60 % because a significant proportion of
cases are detected and treated, which lowers the tuberculosis
death rate. Accordingly, we adjusted our estimates for this
effect by using estimates of the number of cases that receive
treatment to derive the likely range of tuberculosis death
rates in developing countries. For all those cases that are
detected and receive treatment, we assume the case-fatality
rate is reduced to 20 % after 5 years. For example, in the East
African and British Medical Research Council surveys in
Tanzania and Kenya the case-fatality rates for patients re
ceiving standard chemotherapy were 12 % and 16 % respec
tively after 12 months (EAMRC 1977,1979). In many coun
tries, however, the case-fatality rate may be over 20 % for
those receiving chemotherapy, after five years of follow-up,
making 'he following estimates of mortality conservative.
Estimates of the percentage of new cases that arc detected
and treated are based on the number of cases of tuberculosis
delected that are reported by countries to the World Health
Organization (Table 5) (WHO, 1988). Because reporting is
extremely variable, these estimates arc based on the highest
number of cases reported by each country for any year in the
last decade. This is justified by the assumption that year to
year variation in the number of cases reported, which can be
greater than an order of magnitude, is due more to incomplete
reporting of health service activities than to change in the
epidemiology of tuberculosis. In addition, the highest num
ber of cases reported in the last ten years has been adjusted
Table 5. Estimated tuberculosis cases detected and case fatality
rates in developing countries, 1990
Area
i ■
II
■
Bangalore, 1974). As expected, the case-fatality rate for
smear-positive tuberculosis is even higher; Rutledge and
Crouch (1919) and Lindhart (1939) reported 66 % mortality
in these cases (no information is available from the Banga
lore study). For the rest of this paper, we will assume that the
case fatality rate for smear-positive tuberculosis is 60 % to
70 %, for other tuberculosis as a whole it is 40 % to 50 % and
' for all forms combined it is 50 % to 60 °/o.
pi 'I ■
I
Estimated
cases
detected
Percent Estimated case
all cases fatality rates (%)
detected
Low
High
Sub-Saharan Africa 325,000
North Africa and
223,000
Western Asia
3,087,000
Asia
222,000
South America
Central America
50,000
and Caribbean
28
41
48
69
62
28
30
32
31
34
36
27
41
49
3,907.000
55
32
37
Total
61
Note : The calculations of effective case-fatality rates are
based on the assumption that 15 % of those patients receiving
standard chemotherapy die. As discussed in detail in the
section on chemotherapy this is a conservative assumption.
L cases
i that
. ;IB
upwards by 20 % to try and account .for those
detected in the private sector that do not report to
government; in Asia where data for some large count
may include a large number of retreatment cases we havelj
adjusted the figures by 20 %.
Separate estimates for the percent of smear-positive? :
other cases are needed. As the primary means of detcc.
tuberculosis in developing countries is sputum micros^ £
the detection rate of smear-positive tuberculosis is hig >
than for smear-negative or extra-pulmonary’ tuberculc. ;
Based on data from the National Tuberculosis and Lep
Programme in Tanzania, we will assume that 60 i
detected cases are smear-positive and 40 % are other uhip
culosis. The detection rale of the various forms of tubcrcj $
sis and the likely range of case fatality rates discussed a!
can be combined to estimate the tuberculosis death
from smear-positive tuberculosis and other tubercu!
Because the detection rate for smear-positive tuberculo'.<
higher despite a higher case fatality rate, the overall
rate from smear-positive tuberculosis is similar to the
rate from other tuberculosis.
'■
I
Table 6. Estimated deaths from all forms of tubercular
developing countries, 1990
Area
—f
Estimated number of cases Dei
IXLow
Midpoint
High ]
100.: .
528,000
Sub-Saharan Africa 266,000
North Africa and
33,000
Western Asia
771,000
Asia
41,000
South America
Central America
28.000
and Caribbean
Total
99,000
1,709,000
125,000
88,000
1,139,000 2,549,000
790,000 ]Q
166,000
2,646,000
211,000
<?■
148,000 ‘R
3,961,000
------------k-
Table 6 shows estimated deaths each year from all f
of tuberculosis for regions based on the calculations c
tuberculosis death rates discussed above. The wide c
dcnce intervals reflect the cumulative uncertainty J
parcmetcrs of the estimation procedure. Using the midp
of the confidence intervals, the total number of deaths
tuberculosis in the developing world comes to 2,54$
Tuberculosis, therefore, accounts for approximately
of all deaths in the developing world in 1990 (l^
Nations, 1989).
Age-distribution of tuberculosis deaths
3
To estimate the age-distribution of tuberculosis ^4
we must take into consideration the age-distribution of
cases and the relationship between casc-fatality rateg'
age. Clearly, the relationship is complex ; for examp|| |
death rates may also vary by age because certain age-g |
may be more likely to seek treatment and be cured.LL
hesitation, we will apply the age-specific case-fataliif
from London 1933-1934 to the age-distribution ofb L
tuberculosis incidence derived above (Stybio, 1984). w
culosis case-fatality rales tend to increase steadily ai
i
10
'•L
XR' ^3
ii’* t-
IF
o
f
o
.?
r
’8
Table 7. Distribution of tuberculosis deaths by age
■
Agegroup
Czechoslovakia
1940
0-14
15-24
25-34
35-44
45-54
55-64
65+
11.7
22.0
18.7
14.0
12.5
11.4
9.7
Risk of infection
1931
11.8
30.6
25.9
14.5
7.7
5.0
4.5 ‘
Norway
1941
10.3
25.4
25.4
16.1
9.6
6.6
6.5
1951
1931
Netherlands
1941
1951
8.0
10.8
24.0
22.4
20.8
11.7
7.7
6.3
7.1
19.4
203
20.7
13.1
9.6
8.2
8.7
13.6
12.8
16.9
12.8
11.6
13.4
18.9
3.7
1.8
0.5
24.4
19.5
13.2
10.7
13.4
5.5
(1938)
I I
si
■R I
i; I
■1;
Age-distribution of death; have been adjusted using the population age-structure of the developing world in 1990.
ages. Figure V provides the crude estimates of the agepattem of tuberculosis deaths in a country with an annual risk
of infection of 1 % to 2 % where the probability of detection
is equal for smear-positive tuberculosis across all agc-groups
and equal for other tuberculosis across all agc-groups.
This estimated pattern can be compared to the age-distri
bution of tuberculosis deaths in Western countries when the
annual risk of infection was similar to that now seen in the
developing world. Table 7 illustrates the age-distribution of
tuberculosis deaths adjusted to the age-structure of the devel
oping world in Czechoslovakia, Norway and the Netherlands
(TSRU, 1966). The percentage of deaths in children under 15
ranged from approximately 10 % to 20 %. In the Netherlands,
the tuberculosis death rates in children were considerably
higher than in Czechoslovakia even at lower risks of infccuon. Clearly , there are other variables that are major determi
nants of the reported age-distribution of tuberculosis death
rates. One explanation may be the high rates of M. bovis
infection in the Netherlands at the time. According to our
estimates for Tanzania, less than 8 % of tuberculosis deaths
v occur in children underage 15, which is less than in the three
i
?
ri
»' !
Percent of Deathe
• Is
m
; <)•
.4
I ed i
70
60
60
40 1
I
I hs,
3020-
0 ------ 1
1937
fnd
i-------1942
------- r
196
J
1947
1957
Year
ISS 0-14
ggl 16-24
025-44
SSSS 45‘
Percent of Cases
25 r----------
li
R
20
16
10
I
6
0
0-14
15-24
26-34
35-44
46-64
56-64
65*
Age-Groups
Ml
Figure V. Estimated age-distribution oftuberculosis deaths in the
developing world in 1990.
developed countries in Table 7. This may be due to the higher
BCG coverage in Tanzania now than in these countries at the
time. Variation in the age pattern of tuberculosis deaths
highlights the tentative nature of the estimates presented
here. The basic conclusion, however, that tuberculosis is
concentrated in the adult agc-groups, appears to be robust
As the discussion above implies, the age pattern of tuber
culosis deaths shifts towards higher ages as the annual risk of
infection declines. Using data from the US which has been
adjusted to the 1990 age-structure of the developing world,
Figure VI demonstrates how the mean age of death increases
as the risk of infection declines. The number of deaths in
children declines faster than the annual risk of infection; this
relationship will become important in considering the costeffectiveness of BCG.
■
i
■
M sited for Chengee In Age - Btruc lure
pul
figure VI- The shifting age-structure of tuberculosis deaths as
■.je annual risk of infection declines, USA 1937-1957.
j >cr.
jlder 1
'l
li
' i
I
Trends in incidence and mortality
Using the midpoints of the ranges of the annual risk of
infection in Table 1, population projections, and the rates of
decline in the annual risk of infection also reported in Table
11
J
‘
-
■
1
t
I
i
ItF
T
p
I
o
.1 -I
o
o
■C3
rr
o
I
$
1
j
3
:
I
■
1, cases and rates of tuberculosis in 2015 have been estimated
(Table 8). These estimates are based on the assumption that
the rates of decline in the annual risk of infection observed
between 1970 and 1985 will continue into the future. In other
words, the projections are based on the assumption that the
socio-economic changes and tuberculosis control activities
that caused the decline in the risk of infection in the last two
decades will continue at the same rate. Such projections
suffer from all the same limitations that any projection of
current trends docs.
According to these assumptions, tuberculosis will remain
a major problem in all developing world regions referred
to in Table 8. In Africa, population growth will probably
exceed the projected decline in the annual risk of infection,
so that the absolute number of cases will increase. These
projections for Africa have not taken into consideration
the interactions between HIV infection and tuberculosis.
As discussed below, the annual risk of infection in Central
and East Africa may stop declining or even increase in the
next decades. The figures in Table 8, therefore, may be
significant underestimates for Africa. The relationship be
tween HIV infection and tuberculosis will be explored more
fully below.
Social and economic costs
There are few if any studies of the actual costs or consequenccs of tuberculosis on the family, community or economy in developing countries. The special burden of ill-health
and death caused by tuberculosis, however, follows from the
age-distribution of its incidence. While morbidity and mor
tality in any age-groups has significant social and economic
costs, deaths in prime aged adults who arc the parents,
community leaders and producers in most societies have a
particularly onerous burden. The incidence of tuberculosis is
concentrated in adults 15-64. For example, while the overall
incidence of tuberculosis in Africa is estimated to be 230, in
adults it is approximately 360 per 100,000.
One of the greatest costs to society and the economy from
tuberculosis is mortality. It has been estimated that there are
just under 10.6 million deaths in adults 15-59 in the develop
ing world (Murray and Feachem, 1990). Of these, our figures
suggest approximately 18.5 % are due to tuberculosis. Nolall
these deaths are preventable. Of avoidable adult deaths,
r
26 % are probably due to tuberculosis.
The consequences of adult death from tuberculosis on
children and other dependents can also be great Studies have
shown that when a mother dies her children suffer higher
rates of mortality (Greenwood et al„ 1987). One can specu
late that similar relationships may exist for paternal death.
Several studies from developed countries have shown that
tuberculosis is concentrated in lower socio-economic groups,
those households least able to cope with the burden of
tuberculosis. Fryer (1989) found that children in households
where one parent suffers from a serious debilitating disease
. such as tuberculosis, are two and half times more likely to be
severely malnourished. As tuberculosis deaths are concen
trated in the segment of the population that is economi
cally most productive, the economic cost of tuberculosis,
in terms of lost production, must be greater than a disease
that affects exclusively children or the elderly.
Prevention
There are three major strategies for preventing tuberculo
sis : BCG vaccination, chemoprophylaxis and decreasing
sources of infection through case-finding-treatment. Each
will be discussed in turn.
BCG
The bacillus of Calmette and Guerin (BCG) was devel
devel-
oped in 1921. Since that time, it has become one of the most
v/»t r,r»nlrrvi//»rcia1
widely used yet»»cnrt
controversial
vaccines. XA/hilz*
While BCG z-rkirA*
coverage has been up to now on average quite high compared to
other immunizations, the effectiveness of BCG in preventing tuberculosis in adults remains controversial. Clinical
trials in the United Kingdom and in the USA found that BCG
was up to 80 % effective (Aronson et al., 1958 ; Medical Research Council of Great Britain, 1972). Major vaccine trials
in South India, however, found no effectiveness of BCG (Tuberculosis Prevention Trial, 1979). A variety of prospective
trials in the developed world and more recent case-control
studies in developing countries have reported effectiveness
ranging from Oto 80% (Smith, 1987 ; Clemens et al., 1983).
Many explanations and theories have been advanced to
explain this variance including differences in strains of BCG,
infections with other mycobacteria and differences in sus-
Table 8. Cases and deaths from allforms of tuberculosis, 2015
Smear +
Estimated number of cases
Other
Total
766,000
934.000
1,701,000
777,000
98.000
1,871,000
98,000
120,000
2,283,000
120,000
218,000
4,154.000
218,000
66,000
1,391,000
77,000
80,000
97.000
177,000
84,000
2.913,000
3,554,000
6,468,000
2,395,000
Area
Sub-Saharan Africa
North Africa and
Western Asia
Asia
South America
Central America and
Caribbean
Total
Deaths
Cost-effec
: For two
cost-effect
6c substar
margins ’ c
gramme cc
is inverse!.
When n
Note: These projections are based on the following assumptions: 1) the current rate of decline in the annual risk of infection will continue
over the ncx 125 years; 2) the percent of cases detected will remain the same in each region; and 3) the cure rate and implicitly the percent
of cases treated with standard chemotherapy will remain the same for those cases that arc detected and treated.
I
12
J
ceptibiliv
1989). W
BCG, we
effective
given at I
may prole
of this es[
BCG i
birth, in t.
lion, one c
(re)vaccir
older age*
the feasib
riven to c
women al
of the pop
toxoid is r
nent of pr
lime for c
jffect of
thorough 1
>e harm fi
I We mu
|ith BCG
here is a 1
The WHO
responsibl
selected cl
BCG-vacc
when the r
infected. /
elusive re,
re.
immuniza
als. BCG j
malic HIV
dations on
fall of 199
The ,rr,T
imj
ThA
ogical situ
mid-1970’
tuberculos
cases of pi
of smear-f
coverage c
Total cow
impact on
to70%cfl
lions discu
tuberculos
likely hav
percent of
of BCG ci
means emj
I
1
i
o
o
. ..
I
1
ceptibility due to factors such as nutritional status (Fine,
1989;. While there is no consensus on the effectiveness of
Js on
BCG, we will assume that BCG is between 40 % and 70 %
fliave
effective in preventing tuberculosis in children 0-14 when
^hcr
jccugiven at birth. Some would argue that BCG given at birth
p Lh. ,; may protect beyond 15 years; there is, however, no evidence
: that
of this especially in developing countries.
BCG is given as early as possible in life, preferably at
pips,
birth, in the vast majority of developing countries. In addiIn of
olds i tion, one could give serious consideration to “indiscriminate
(rc)vaccination (re. without prio^ tuberculin testing) at
foase
robe
older ages, irrespective of vaccination at birth. Dependingpn
the feasibility of coverage, BCG (re)vaccination could be
feenjinigiven to children entering school, leaving school, pregnant
women attending for prenatal care of other routine contacts
josis,
of the population with health workers. For example, tetanus
ease
toxoid is now considered by many to be an integral compo
nent of prenatal caije ; BCG could be delivered at the same
time for only a small increase in the total cost. The actual
Bj
effect of BCG (re)vaccination at older ages has. not been
uiMtwugKij
mat it
_____
thoroughly oiuuivu
studied uut
but uicrv
there seems uiue
little reason that
it would
using
be harmful and it may have some beneficial impact
We must realize, however, that vaccination of newboms
Lach
with BCG is a problem in those developing countries where
there is a high prevalence of HIV infection among mothers.
The WHO Expanded Programme on Immunization, which is
responsible for the programme of vaccination against six
veljnosl
selected childhood diseases in the world, has been continuing
BCG-vaccination of newboms and small children including
. ver. <i to
when the mother is known to be or suspected of being HI Vinfcctcd. As of the time of writing, evidence remains incon
entclusive regarding die rate of adverse reactions after BCG
nical
immunization among symptomatic HIV-infected individu
BCG
als. BCG should be withheld from individuals with sympto
Rcmatic HIV infection (WHO, 1987). The current recommen
■ ials
dations on HIV and BCG-vaccination will be reviewed in the
|(Tufall of 1990.
The impact of mass BCG-vaccination on the epidemiol
nlrol
ogical situation of tuberculosis was overestimated until the
;ness
mid-1970’s (Styblo and Meijer, 1976). As mentioned earlier,
p83).
tuberculosis is largely transmitted by sputum smear-positive
0
cases of pulmonary tuberculosis. From the age-distribution
of smear-positive cases, it is clear that even complete BCG
•Si coverage can have little effect on the annual risk of infection.
Total coverage witi BCG, however, will have a major
impact on tuberculosis mortality in children, if BCG is 40 %
to 70 % effective as we have assumed. Based on the assump
tions discussed above, complete coverage could reduce total
tuberculosis mortality by approximately 6 %. BCG will most
likely have very limited effect on the remaining 90 plus
percent of tuberculosis mortality. Evidently, the expansion
of BCG coverage alone cannot or should not be the sole
means employed to control tuberculosis in any community.
J
k1
3-
1-fue
r
Cost-effectiveness of BCG
For two principal reasons, generalizable estimates of the
cost-effectiveness of BCG cannot be made. First, there may
be substantial differences in the computed average and
marginal costs of BCG programmes depending on the pro| gramme considered. Second, the cost-effectiveness of BCG
I is inversely proportional to the annual risk of infection.
When more than one vaccine is given at the same time.
N
niitiniTilliinTn; is;; ;r,rt ir nnr aau lx
•.■•is
average costs for delivering each particular immunization
are often calculated by dividing the cost per client contact by
the number of vaccinations received. Thus the difference
between marginal costs and average costs for a BCG pro
gramme will depend on whether BCG is delivered in an
independent campaign or contact with mother and child or
along with other immunizations such as the first DPT. The
Expanded Programme on Immunization was, unfortunately
unable to indicate how BCG is delivered in each country. We
conclude that the marginal cost-effectiveness of expanding
BCG will necessarily depend on the location and timing of
vaccination in a particular country.
As the annual risk of infection declines, ceterusparibus,
the cost of vaccinating all newboms does not change. The
benefits of BCG vaccination in terms of cases or deaths
averted, however, will decline inversely to the risk of infec
tion. For example, as the risk of infection declines from 2 %
to 1 %, the cost per death averted will more than double. The
increase in the cost per death averted is greater than the
decline in the risk of infection because the age-distribution of
deaths also shifts away from children as the risk of infection
declines - see Figure VI. The expected relationship between
the risk of infection and the cost per death averted by BCG is
illustrated in Figure VII.
3500
Coat Par Death Avar tad
3000
2500
2000
I
1600
1000
500
p
0
0.5
1
1.5
2
2.6
Risk of Infection
BCG
3
3.6
-0- Case Treatment
Figure VII. A hypothetical comparison of the cost-effectiveness
of BCG immunization and case-treatment.
Only one study has attempted to cost a BCG programme
and estimate its effect in a developing country. Barnum et al
(1980) estimated the cost of operating a BCG programme
alone and also the marginal cost of adding a BCG pro
gramme to an existing DPT programme. His estimates of
deaths averted were based on local incidence and case
fatality rates of tuberculosis and an assumed effectiveness for
BCG of 50 %. We have recalculated using his original data
the cost per discounted death averted in 1986 dollars. Deaths
prevented by BCG vaccination now occur over the next 14
years, these are discounted to present value for comparison
with interventions that avert deaths in the current lime
period. The cost per death discounted at 3 % was $ 644 for the
BCG programme alone and $ 144 for the marginal BCG
13
I
u
o
jI
o
o
o
I
1 I
j
I
I’
i
programme - both prices are in 1986 US dollars. At the time
in Indonesia survey data suggest the risk of infection was
approximately 3 % ; regional surveys report annual risks of
infection between 2 % and 4 % (Cauthen et al., 1987). It must
be stressed that these estimates of cost-effectiveness do not
take into consideration the potential benefits of BCG in
reducing leprosy (Fine et al., 1986).
Chemoprophylaxis
Clinical tuberculosis can be secondarily prevented by
treating patients with tuberculous infection. Chemoprophy
laxis is applied either to freshly infected so-called tubercylin
converters or to those who have been infected with virulent
tubercle bacilli in the more distant past The latter either do
or do not have abnormalities in the lungs on X-ray.
Tuberculin converters undoubtedly represent a very re
warding group in terms of chemoprophylaxis results and thus
chemoprophylaxis policy has been adopted as a routine
procedure in a number of low prevalence countries. How
ever, mass chemoproplylaxis of converters is impossible,
since their identification depends on repeated tuberculin
tests of the population. On the other hand, a selective search
for converters in high risk groups, such as close family
contacts of smear-positive sources, is a feasible alternative.
As discussed below 6-8 % of recent infections evolve into
clinical tuberculosis. In developing countries, where large
percentages of the population have been infected, the IUATLD
recommends chemoprophylaxis (in HIV low prevalence
countries) only for all non-BCG-vaccinated children aged 5
years or under, with no symptoms suspicious of tuberculosis.
In children with symptoms chemotherapy should, of course,
be given.
Chcmoprophy axis in tuberculin-positive subjects but who
have not developed clinical tuberculosis would reduce the
number of sources of infection, if given for 6 to 12 months.
In most developing countries, this group is very large and
resources would be far belter directed to case-detection and
treatment. However, chemoprophylaxis might play a very
important role both in developed and developing countries in
subjects with the dual HIV and tuberculous infections with
out clinical and bacteriological signs of tuberculosis. Re
search in this field is urgently needed.
Studies in developed countries have found cost-effective
ness rates per case averted on a 24 week regimen to be greater
than $ 17,000 (Snider et al., 1986).
Without accurate data to review the cost-effectiveness of
chemoprophylaxis in developing countries, we can only
make some comparisons to the costs per case treated. Since
only 6-8 % of recent converters evolve into clinical tubercu
losis, 12.5-16.7 recent luberculin positive patients must be
given chemoprophylaxis to prevent one case of tuberculosis
assuming prophylaxis is 100 % effective. In luberculin
positive subjects as opposed to new converters, the ratio
would be one or two orders of magnitude higher. The drug
cosis for chemoprophylaxis are lower than for treatment, but
the costs of administration, screening, transport, delivery and
monitoring would be similar. Thus, chemoprophylaxis is
unlikely to be more cost-effective in developing countries
than case-finding/treatment of patients presenting with
symptoms suspicious of tuberculosis as discussed below.
One exception may be in children under 5 exposed lo an adult
with active smear-positive pulmonary tuberculosis.
14
Decreasing sources of infection
It has already been suggested that the best way to reduce
transmission of tuberculous infection and thus the number of
tuberculosis cases is to cure patients with smear-positive
tuberculosis. This was stated by Crofton (1962) already in the
mid 1950's. A variety of epidemiological studies can be used
to quantify this transmission effect. The number of new in
fections caused each year by a case of smear-positive tuber
culosis can be estimated from survey data on the number of
new infectionsand the prevalence of smear-positive tubercu
losis. It has been estimated using data from developing and
developed countries, that an undiagnosed and untreated
smear-positive source of tuberculous infection would infect
on average between 10 and 14 persons per year (Styblo,
1984 ; Sutherland and Payers, 1975). Breakdown of primary
infection with tubercle bacilli to clinical tuberculosis is the
next link in the chain of transmission. Reference is made to
three reports of newly infected subjects to determine the per
centage that developed clinical tuberculosis: the MRC study
(Sutherland, 1968) found 8.1 % of converters developed
clinical tuberculosis within 15 years ; in Saskatchewan of
recently infected individuals, 6.4 % developed clinical tuber
culosis within a few years after primary infection (Barnet et
al., 1971); and aTSRU study of European data found 6.0 %
of converters developed bacillary tuberculosis in five years
(Sutherland, 1976). For the purposes of modelling transmis
sion, we will assume that from 6 % to 8 % of new infections
will eventually develop some form of clinical tuberculosis.
The studies cited above refer to the risk of developing
clinical tuberculosis soon after primary infection. What about
the risk of developing clinical tuberculosis in cases previ
ously infected with tubercle bacilli, without or with a fresh
reinfection ? As it is not possible to delect reinfection with
tubercle bacilli by tuberculin testing, it cannot be discovered
directly whether or not exogenous reinfection is important in
the development of tuberculosis in an adult. It is evident that
in countries with low annual risks of infection, tuberculosis
in elderly and old persons is predominantly due to en
dogenous exacerbation among those remotely infected with
tubercle bacilli. In developing countries, exogenous reinfec
tion seems to play an important role in developing active
tuberculosis in the adult population, since 0.5 %to 2.5 % or
more of previously infected individuals are annually rein
fected with tubercle bacilli as was the case in developed
countries some 2 to 4 decades ago (Canetti, 1972; Jancik and
Styblo,1976). Strong evidence forthelatteris the rapid decline
in tuberculosis incidence in Eskimos over the space of 20
years, not only in children and young adults but also in elderly
and old people, when aggressive case detection and adequate
chemotherapy was introduced (Graybowski et al., 1976).
We will assume, therefore, that each undiagnosed and
untreated smear-positive case will cause 10 to 14 infections
per year of infectivity. These 10 lo 14 infections will subse
quently cause over the next few years 0.6 to 1.2 cases of
tuberculosis. These cases will be approximately equally dis
tributed between smear-positive and other tuberculosis. The
mean period from infection to onset can be estimated more
precisely from data reported by Sutherland (1968) as 1.4
years. These parameters highlight the importance of case
treatment in preventing further cases and will be used in
estimating the cost-effectiveness of treating smear-positive
tuberculosis in the pages that follow.
(
t
i
I
c
t
t
d
Li
c
n
U
in
m
to
th
Fc
in
1C
mt
ide
W
O'
?
o
o
Curative care
; reduce
iberof
ositive
rinthe
c used
ew in1 tubcr|ibcr of
Ibcrcuj ng and
i treated
H infect
i Styblo,
primary
] s is the
jnade to
Iheper-
fc study
'jped
. ..an of
ptuberi amet et
Jd60%
■ e years
jansmisj ections
'kulosis.
' eloping
tat about
fs previa fresh
|on with
^covered
tortant in
JJentthat
pculosis
to cnted with
infecictive I
: z.5 % or
ply reinveloped
ncik and
•Ll decline
i ce of 20
a elderly
• idequate
11976).
:: )sed and
:j .Sections
]ill subsecases of
jually dis: osis. The
Hied more
j8) as 1.4
ie of case
$e used in
r-positive
The subject of curative care can naturally be divided into
tuberculosis detection and chemotherapy. Each of these will
be addressed in turn, highlighting the policy options.
Case detection
There arc two major issues in detecting cases of clinically
significant tuberculosis : active versus passive detection
strategics and die choice of diagnostic technology. Active
detection means attempts to screen the population at large, or
target populations such as military recruits, for evidence of
tuberculosis. Passive case detection means screening and
diagnosing only those patients who present to a health
sen ice provider because of symptoms suspicious of tubercu
losis. In the 1950s and 1960’s, the choice between active and
passive detection in developed and developing countries was
a controversial topic (Styblo et al., 1967 ; Meijer el al.,
1971 ; WHO Expert Committee on Tuberculosis, 1974 ;
Styblo and Meijer, 1980 ; Toman, 1979). In the last two
decades, a consensus for passive case detection of tuberculo
sis in all countries has developed, and both the WHO and
IUATLD advocate this policy.
There are three assumptions that underlie the wide accep
tance of passive case detection as the primary strategy in
tuberculosis control. First, 90 % of patients with smear
positive pulmonary tuberculosis have objective symptoms,
such as cough (with or without sputum), fever, loss of weight
or hemoptysis. These symptoms develop quite soon after the
onset of the disease prompting the patient to seek medical
advice. Second, the great majority of sputum smear-positive
tuberculosis cases develop in a shorter period of time than the
shortest feasible interval between two mass radiography
survey rounds. That is why smear-positive tuberculosis cases
were detected outside (usually earlier than) the periodic case
finding campaigns by the regular health services that the
patient can consult whenever he feels ill. Third, appropriate
diagnostic and curative care ought to be physically, socially
and economically available. Most infections, before chemothcrapy is instituted, would therefore occur within the fam
ily. Whereas in developed countries, it is estimated that 2-3
persons would be infected by a smear-positive case before its
detection, this number may be 4-5 in developing countries,
because of higher number of close contacts. No contacts will
be infected after the start and completion of adequate chemo
therapy.
The validity of these assumptions depends on local condi
tions, cultural perception of disease, access to care and the
efficacy of health services.
Regardless of the technology used, active case detection is
more expensive per case detected because the yield of
tuberculosis per patient screened is lower. For example, if the
incidence of smear-positive tuberculosis is 100/100,000 then
more than 1,000 people’s sputum would have to be screened
to delect one case of smear-positive tuberculosis provided
that tire general population is screened. If specific high risk
groups can be identified, the yield would clearly be higher.
For comparison, screening patients who present with cough
in Tanzania using sputum microscopy yields one patient in
10 cases with smear-positive tuberculosis. The second argu
ment against active case detection is that cases actively
identified may be less likely to comply with long drug
1.0
regimens. Clearly, they did not yet consider their health to be
impaired enough to seek treatment to start with. Moreover, a
proportion of smear-negative cases with few or no clinical
symptoms cure spontaneously and in a number of cases the
disease is in regression (National Tuberculosis Institute in
Bangalore 1974 ; Meijer ct al.t 1971, Styblo et al., 1967). In
developing countries, active case-finding was studied by the
Kenyan and British Research Councils in the late 1970’s and
early 1980’s. There are seven reports on these studies and the
conclusion in the last study is that a patient suffering from
symptoms suggestive of pulmonary tuberculosis nearly always
attends, usually several times, a health unit seeking medical
advice (EAMRC, 1987). However, health workers at the
peripheral level do not think in many instances of tuberculo
sis and do not send the sputum or do not refer the patient to
the nearest microscopy centre for sputum examination for
tubercle bacilli. In many developing countries, public trans
port is very rudimentary; even if available, it is not always
affordable to poor people. Moreover, the Kenyan studies
have shown that active case-finding, except in health units, is
not feasible.
The second issue in case-detection is the choice of tech
nology. At present, the major options are sputum micros
copy, sputum culture and radiology. To illustrate the yield
and likely cost of case-detection using microscopy (ZiehlNeeisen), we shall examine data from the National Tubercu
losis and Leprosy Programme in Tanzania. In that cou-.try,
one in ten tuberculosis suspects screened by smear examina
tion is identified as a smear-positive case. Normally, tiiree
smears are conducted on each patient The costs of supplies
and reagents alone for these thirty smears is $ 4.05. A
microscopist can examine about 20 sputa per day and is paid
US$ 45 per month. The effective cost per case detected in
Tanzania is US$ 7.30. This is a high estimate since each case
has three sputa examined to increase sensitivity ; the in
creased sensitivity achieved with the third smear is in fact
small and could be sacrificed to reduce the cost
Sputum culture is used to diagnose pulmonary tuberculo
sis in those patients that produced too few bacilli to be
detected on a smear, to confirm sputum microscopy, and to
characterize the type of mycobacterium. (Finally, culture is
a prerequisite to sensitivity test examination.) As culture
takes several weeks to yield results, it is not useful as a
primary diagnostic tool in developing countries.
The third diagnostic tool is radiography. While it can be an
effective tool particularly for diagnosing smear-negative
pulmonary tuberculosis, the capital cost of an X-ray machine
limits its use to those facilities with a high case load. In
Tanzania, we can estimate that the cost per case detected for
both smear-positive and smear-negative pulmonary tubercu
losis combined to be around US$ 10. This calculation,
however, attributes only one sixth of the depreciated capital
cost of an X-ray machine to diagnosing tuberculosis, because
we assume an X-ray machine in a district hospital would be
used for many other purposes. An X-ray facility exclusively
for diagnosing tuberculosis would be much more expensive.
The calculation also assumes a case-load of at least 1,000
patients per year. The optimal use of radiography in passive
case-detection clearly depends on the health system infra
structure, population distribution, and possibilities for refer
ral. Usually, in 25-30 % of all pulmonary cases detected in a
developing country, the diagnosis of smear-negative tuber15
VJ
O'
o
I1'
o
\r
culosis is based on X-ray of the chest with a pathology
suspicious of active tuberculosis and on clinical examina
tion.
New diagnostic technologies based on the enzyme linked
immunoabsorbant assay or DNA probes for mycobacterial
DNA or RNA are currently being investigated (Daniel,
1989 ; Bloom, 1989). If these approaches yield new tools
that can be cheaply applied in developing countries, passive
case detection may be improved especially for smear-nega
tive and extra-pulmonary tuberculosis which are not diag
nosed using sputum microscopy. Active, case detection in
some high risk groups would perhaps become feasible.
A limited number of interventions are available to im
prove the effectiveness of passive case detection. The most
effective factor for improvement in case-finding is a high
cure rate of diagnosed cases and a friendly relationship
between the treating health staff and the patient. Public
education can increase general awareness of the symptoms of
tuberculosis and encourage suspects to seek medical advice
resulting in diagnosis of tuberculosis and its treatment.
Improved d iagnostic skills of primary health care providers,
transport of sputum or a patient to a microscopy center, and
X-ray facilities, if available, can also improve the detection
of both smear-positive tuberculosis and other tuberculosis.
Finally, if diagnosis and adequate treatment are free, as
recommended by WHC and IUATLD, more patients will
seek care earlier.
Table 9. Examples of tuberculosis chemotherapy regimens used
in developing countries
Regimen.
!
!
I
New smear-positive cases
Long-ccurse (12 months)
2SH/10TH
2SH/10EH
2SH/10S2H2
Short-course
2SHRZ/6TH
2SHRZ/4HR or 2EHRZ/4HR
2HR274HR
2HRZ/4H3R,
New smear-negative cases
2STH/10TH
2SHR/76TH
Relreatment cases
2SHRZE/1HRZE/5H3R3E3
2SHRZE/1HRZE/5TH
Duration
12
12
12
8
6
6
6
12
8
8
8
S : streptomycin ; H : isoniazid ; R : rifampicin;
Z : pyrazinamide ; E : cthambutol ; T : thiacetazone.
Subscripts refer to intermittent therapy where drugs are given
a limited number of times each week.
effective antitubcrculosis drugs, tuberculosis treatment pro- . pcrcer?
percer
grammes in most developing countries have not been very ! positiv
successful. Overall cure rates for most national programmes ■
(with 1
in poor developing countries are below 50 %. Evidently, the
chemo
«
...
.•
..
...
||
“standard” 12-month chemotherapy (isoniazid, streptomy
refer tc
cin and thiacetazone) recommended by the WHO Expert
smearCommittee on Tuberculosis (1974) for use in developing
also be
countries is presently, and probably will be in the future,
VIII at
beyond the organizational resources of many of them.
1 therap;
While there are many interesting issues in tuberculosis
2mont
treatment, this discussion will stress the choice between
pared v
standard 12-month chemotherapy regimens that use fewer
of shot
and cheaper drugs (isoniazid, streptomycin and thiaceta
chemot
zone), and short-course chemotherapy that lasts from 6 to 8
tients v
months and uses multiple and more expensive drugs (ri
and in
fampicin and pyrazinamide). To compare these two ap
mately
proaches to chemotherapy, we must examine the relative
candyc
effectiveness of each and the relative costs of each. Because
treatme
of the great diversity in effectiveness and costs between
100 %c
countries, the emphasis will be on the key determinants of the
will b<x
effectiveness and costs of the two regimens. It should be
Sine*
stressed that the regimen with a higher cure rate leads to a
both gh
more rapid reduction in the risk of tuberculosis infection and
lance ii
the incidence of active tuberculosis.
importa
sis prog
Effectiveness of chemotherapy
complis
The effectiveness of standard and short-course chemo
(Hayncj
therapy depends on three major factors: (i) the cure rate; (ii)
Tubercu
acquired drug resistance; and (iii) the impact on the trend of
Many o
the risk of tuberculous infection. Without question, the most
patients
important of these factors today in nearly all contexts is the
such as t
cure rate which decisively influences the remaining two
obscrvc<
factors.
duration
The first determinant of the cure rate is the biological
1979). I
effectiveness of standard 12-month and short-course chemo
Kong fo
therapy given under ideal conditions of 100 % compliance.
three wt
With short-course chemotherapy after 2 months of treatment
drop ou
85-95 % of smear-positive pulmonary cases will have con
complia
verted to sputum negative status. Under standard 12-month
short-co
therapy after 2 months 50 % will remain smear-positive. The
Given th
“permanent” cure rate is a more important aspect of the
discussc
treatment regimens. The schematic (Figure VIII) shows the
drop out
higher tc
The s<
Percent Failures
100%i------------------------apy com
spcctruiT
80%
months t
duration
60%
ety of st
visits to
the home
hospitali
20%
increasec
ij
o% L
0
i'
Treatment
The six drugs recommended by WHO and the IUATLD
and most commonly used in developing countries for tuber
culosis are isoniazid, streptomycin, thiacetazone, ethambutol, rifampicin and pyrazinamide. These drugs are used in a
host of combinations for different durations. See Table 9.
However, despite the availability of powerful and potentially
16
2
4
6
8
10
12
(Haynes,
i cost The
institutio
For exan
tion has r
care has t
Figure VIII. The percent ofpatientsfailing therapy after 2 yean
Madras 1
offolio w-upasafunction ofthe number ofmonths ofchemother
many par
apy completed hypothetical values.
guarantee
Months of Treatment Received
o
percent of patients who will remain or become smearositivc, say, 2 years after the start of the (first) treatment
.with no retreatnient during the first 2 years) provided that
Chemotherapy is discontinued at each point in lime. We shall
: dcr to diem as “failures”. (If a patient remained or became
‘ near-positive and died during the first 2 years, he/she will
;,lso be referred io as a “failure”) (the upper part of Figure
III above the interrupted lines). Under short-course chemo; icrapy (e g. 2SHRZ/6TH), about 40 % may be “failures” at
months if they discontinue chemotherapy at that time com.ired with approximately 8-10 % if they complete 6 months
T short-course chemotherapy. Under standard 12-month
lemotherapy (e g. 2STH/10TH), the “failure” rate in pamts who discontinue after 2 months may reach 65-70 %,
‘ id in those who complete 6 months it might be approxiately 50 %. The “failure” rate only begins to drop signifi-intly on standard 12-month chemotherapy after 6 months. If
raiment is stopped at 12 months, under ideal conditions of
?X) % compliance approximately 10-15 % including deaths
fill become failures at two years.
nee standard 12-month and short-course chemotherapy ,
ui give high cure rates and do not lead to secondary resisice in controlled clinical trials compliance is the most
.npertant determinant of the cure rate in national tuberculoprogrammes. There is a vast and detailed literature on
mpliance in general and on tuberculosis in particular
•ayneser al., 1979; Fox, 1983,1985; Chaulet, 1987; WHO
ibercuiosis Chemotherapy Centre, 1963 ; Reichmann, 1987).
any of the factors that one might expect would influence
tients compliance with antituberculosis drugs regimens,
h as the severity of side effects, have not been empirically
served. There is a clear consensus, however, that the
ration of treatment adversely affects compliance (Haynes,
79). Moodie (1967) in unusual circumstances in Hong
•png found that most non-complicrs dropped out in the first
ee weeks ; but all other studies have observed a steady
: >p out over time (EAMRC 1977, 1979). Improved net
■ npliancc due to a shorter regimen is a major advantage of
■prt-course chemotherapy over standard chemotherapy.
; ven the relapse rate as a function of months of treatment
■■ ’ussed above, in a situation where patients continue to
out over time, short-course chemotherapy will have a
J her total cure rate.
The second major determinant of tuberculosis chemothcr/ compliance is the degree of supervision of treatment. A
ftetrum exists from giving supplies of drugs for multiple
- nths to patients all die way to hospitalization for the entire
I ation of treatment. Between these extremes, a wide variof supervision strategies aije possible, including daily
? its to health centres, health visitors contacting patients in
e home, periodic urine tests to monitor compliance and
pitalizations for the first 2 months of treatment. While
eased supervision increases compliance in most settings
j iyncs, 1979); increased supervision also means increased
t. The balance of this trade-off will depend on the specific
. Litutional and cultural characteristics of each community.
| example, in Madras, in areas where most of the popula; i has ready access to health centres, entirely ambulatory
has been successful (Tuberculosis Chemotherapy Centre,
dras 1959, Dau son et al., 1966). On the other hand, in
parts of rural sub-Saharan Africa, the only way to
rantee daily supervision of chemotherapy may be to
r)
hospitalize patients for the first 2 months of chemotherapy;
this has been the experience in 7 African countries (Tanza
nia, Kenya, Mozambique, Malawi, Benin, Senegal and Mali)
(Styblo and Chum, 1987).
The rationale for hospitalizing patients to ensure close
supervision of the initial intensive phase is much greater in
short-course chemotherapy than in standard 12-month che
motherapy because 2 months of short-course chemotherapy
will convert smear-positive sputum into smear-negative in
about 90 % of patients and in the remaining 10 % in a further
2-4 weeks. Even if they stop taking drugs one or 2 months
after they leave hospital many will not relapse. In Tanzania,
approximately 50 % of smear-positive patients enrolled on
standard 12-month chemotherapy remain smear and culture
positive at 2 months. For standard 12-month chemotherapy,
it is crucial to continue to take regularly daily isoniazid and
thiacetazone combined tablets for at least another 2-3 months
to achieve 90 % sputum conversion.
In all probability, the patient’s perception of the effective
ness of treatment and the balance between discounted future
costs and benefits of treatment are also important determi
nants of compliance. In Tanzania and other lUATLD-assisted National Tuberculosis Programmes, it has been ob
served that both the perceived effectiveness of treatment and
individual and group education of patients during the initial
intensive phase of short-course chemotherapy positively
affected compliance during the continuation phase.
Other possible determinants of compliance include the
number of medications taken at each time, the number of
doses per week and the costs to the patients of therapy.
Combination tablets of isoniazid and thiacetazone and isoniazid
and rifampicin have been in use in National Tuberculosis
Programmes of many developing countries for several years.
On the other hand, intermittent standard chemotherapy (strep
tomycin and isoniazid) has never been used on a large scale
in developing countries. In India, it has been shown that
intermittancy leads to increased irregularity (Pamra and
Mathur, 1973). Also Blackwell (1979) could not validate the
expected relationship between reduced number of doses and
improved compliance. The advantages and disadvantages of
intermittent standard chemotherapy will not be addressed
further here. The common sense notion that increasing costs
both in terms of time and money will decrease compliance
has been confirmed in most studies (Haynes, 1979). To
maximize compliance, tuberculosis chemotherapy should be
free and the spatial and temporal ease of access to treatment
should be improved. When alternative treatments are avail
able in the private and public sector, patients may initially
prefer to pay for therapy perceived as better, but when funds
run out they may switch to the public sector (Uplekar,
personal communication). This mixing of different drug
regimens will tend to increase the failure rate and the
probability of secondary resistance.
The second factor determining the effectiveness is the
development of resistance. Under ideal conditions, such as in
many clinical trials in patients with sensitive bacilli, the cure
rates for both standard and short-course chemotherapy are
over 95 %. In patients infected with tubercle bacilli that are
isoniazid resistant, the cure rate with total compliance is
greatly reduced (Shimao, 1987). Isoniazid resistance is al
ready a major problem in many developing countries (Kleebcrg
€t al., 1980). A systematic application of short-course che17
■iW
< RS«
O
®a
f
B
Wl
if
’
h i
i!
rti I'
■ 1
■• IM
I!I,
rii
11i
K
I
fi
S-
t II
fi
»■
RIB ■
&
■
® ■-
i
aB’
hi
»-
Lil
HI1 H
i
I
I
mIb
■Is|B l
'mothcrapy referred to above (2SHRZ/6TH) in new smear, , positive cases makes it virtually impossible to select for a
bacillus resistant to all four drugs, provided that the 2-month
initial intensive phase is closely supervised. Decreased de
velopment of resistance means that short-course chemother
apy is a substantially more effective long-term strategy for
tuberculosis control than standard 12-month chemotherapy.
It has to be stressed that acquired (and in contacts of the index
cases, primary) resistance to both isoniazid and rifampicin
results in incurability of the majority of such cases in devel
oping countries with serious consequences for elimination of
tuberculosis.
j
I
Costs oir chemotherapy
The costs of any tuberculosis control programme com
prise many components including drugs, staff costs, trans
port, training and the cost of hospitalization. While drugs
form a considerable portion of the budget, probably from
20 % to 40 %, they are not die only cost. Cost differences
between short-course and standard 12-month chemotherapy,
however, center on drug costs and hospitalization costs.
Table 10 shows prices for the five major drugs from three
sources : the UNICEF (UNIPAC), and bulk purchase rates
given to die IUATLD by major drug companies. Using
different suppliers will substantially alter the relative costs of
standard and short-course chemotherapy. Resolution of this
question may pave the way for cheaper tuberculosis drug
regimens -both standard and short-course. In general, the
short-course regimen used in IUATLD National Tuberculo
sis Programme is approximately $ 25 more per patient than
I
II
Table 10. Costs of anttuberculosis drugs
Drug
Isoniazid
Isoniazid
Isoniazid
Isoniazid/
thiacclazonc
Isoniazid/
thiacclazonc
Streptomycin
Streptomycin
>
Unit
Unit cost
IUATLD UNIPAC
$2.95
$2.70
$3.80
3OOmg/15Omgx 1000 $10.50
$9.11
100 mg/50 nig x 10(H)
$4.80
$4.93
1 gm vial
1 gm vial
$0.07
$0.09
100 mg x 1000
3(H) mg x 1000
$3.55
1 gm x 50
Pyrazinamidc
Pyrazinamidc
(CIF)
Pyrazinamidc
500 mg x 1000
500 mg x 100
$31.58
Ethambutol
Ethambutol
Ediambutol
400 mg x 1000
400 mg x 500
$17.00
Rifampicin
Rifampicin
Rifampicin
Rifampicin/
isoniazid
Rifampicin/
isoniazid
!
$8.34
$17.13
$40.90
$58.00
150 mg x 1000
300 mg x 1000
^Omg/lOOmgx 1000 $79.50
300 mg/150 mg x 1000 $159.00
standard depending on the supplier.
The second potential source of cost differentials between '
short-course and standard 12-month chemotherapy is the
level and intensity of supervision. Both standard 12-month
and short-course chemotherapy should be given whenever
possible on an entirely ambulatory basis. However, in rural
areas, where 80-85 % of the African population live and
where patients do not have easy access to a health centre,
daily regimens may only be delivered in district hospitals.
Not only will this improve compliance, but expensive and
valuable drugs can be better accounted for in these condi
tions. For these reasons, short-course chemotherapy may
justify higher hospitalization rates and more expense in some
countries.
This discussion has thus far been implicitly restricted to
the treatment of smear-positive tuberculosis. Once other
forms of tuberculosis have been identified, treatment costs
for other tuberculosis should be similar to standard 12-month
chemotherapy except for serious forms of smear-negative tu
berculosis, such as miliary tuberculosis, tuberculous menin
gitis, Poll’s disease, etc., who should be enrolled on short
course chemotherapy (in cases with tuberculous meningitis,
rimactazid should also be given in the continuation phase).
For treatment of cases that failed to sputum or culture convert
in the first round of treatment, the drug costs are particularly
high because these patients harbour tubercle bacilli fre
quently resistant, in developing countries, to isoniazid and/or
streptomycin. Many of them have to be treated with short
course chemotherapy for rctreatment cases which should
ideally contain 3 drugs to which the bacilli are sensitive. A
rctreatment regimen includes, as a rule, rifampicin and
pyrazinamidc. In the lUATLD-assisted National Tuberculo
sis Programmes the following regimen is used : 2SHRZE/
IHRZE/SHjRjE^ in patients resistant to isoniazid or 2SHRZE/
1HRZE/5TH in patients sensitive to isoniazid. In programmes
that are committed to treating all patients that present for
care, rctreatment must also be considered in examining
short-course and standard 12-month chemotherapy. As fail
ure rates arc higher for standard 12-month chemotherapy,
more resources would have to be devoted to rctreatment of
these patients.
Cost-effectiveness
The cost-effectiveness of tuberculosis treatment will vary
depending on the type of tuberculosis case that is treated. In
general, the cost per death averted directly and indirectly will
be lowest for smear-positive tuberculosis, higher for other
tuberculosis and highest for retreatment cases. While this
statement may run counter to intuitive notions of the clinical
costs of treating each type of tuberculosis, the rationale is
based on the effect of interrupting transmission as explained
more fully below. Treating smear-positive tuberculosis may
be as much as twice as cost-effective as treating other
tuberculosis because of the benefits of reduced transmission
in the former. Whether a country with limited resources
.would choose to target treatment in adult patients to exclu' I sively smear-positive tuberculosis is a difficult ethical, medical
and economic choice. The calculations presented here per
tain largely to treatment of smear-positive tuberculosis be
cause little information is available on the results of treating
other tuberculosis; this emphasis should not be interpreted as
a recommendation to treat only smear-positive tuberculosis.
be?
Jex
inv
ch<
evi
g3I
ant
tub
Na
Tar
Tab
star
tion
Ye
0
1
1.1
2
3
4
5
F
s
Ye.
0
1
1.5
2
3
4
5
Fa
sb
Yea
0
1
1.5
2
3
4
5
*Si}
18
17.
33
I
iw
- ■ r
W wKBl
mags
■ 'IS
s
£ '5
itil laaEllII__
I
o
O
O'
o
>-31
«
Few studies have examined the cost-effectiveness of tu
berculosis treatment in developing countries (Barnum, 1986;
Jocsoef el al., 1989 ; Feldstein el al., 1913). Two of these
investigations reported that per case cured short-course
chemotherapy was more cost-effective. They did not, how
ever, report figures on the cost per death averted. To fill the
gap in information on the cost-effectiveness of short-course
and standard 12-month chemotherapy, we have analyzed the
tuberculosis control activities over the last seven years of the
National Tuberculosis and Leprosy Programme (NTLP) of
Tanzania.
Our assumption and calculations arc summarized in Tables
I
e
i
HO
Table 11. Assumptions used in estimating the effectiveness of
standard 12-month and short-course chemotherapy in the Na
tional Tuberculosis and Leprosy Programme of Tanzania
'cr
i ,1s
Fate of 100 cases smear-positive tuberculosis with
no treatment based on 5 year epidemiological study
in South India (1974)
th
Year
Cured
i is,
p). >
ert
Idy 1
re!/or j
)rt,uld
A
und
! .110ZE/
ZE/
0
1
1.5
2
3
4
5
0.0
18.5
27.8
27.8
27.8
30.3
32.5
Year
wy.
0
1
1.5
0.0
61.1
2
3
4
5
61.1
61.1
: vai7
ipd. In
Jywill
. other
e this
inical
uale is
gained
ts may
oilier
fission
Sources
■ exclutcdical
| re por
osis beresting
j reted as
Jculosis.
i
Died
per
year
0.0
20.1
30.2
33.6
40.5
44.9
49.2
0.0
18.5
0.0 r
20.1
9.3
0.0
2.5
2.2
13.6/
100.0
61.3
42.0
38.6
31.7
24.9
18.0
6.9
4.4
4.4
Fate of 100 cases smear-positive tuberculosis receiving
standard 12-month chemotherapy based on treatment
results in Tanzania*
mes !
. for
I ning
tJlfail-
fj
Number of cases
Dead
Excreting
bacilli
Cured
per
year
Cured
61.1
62.4
63.7
Number of cases
Excreting
Dead
bacilli
Cured
per
year
Died
per
year
0.0
15.8
15.8
17.7
21.4
23.8
26.2
0.0
61.1
0.0
15.8
0.0
0.0
1.4
1.2
1.9
3.8
2.4
2.4
100.0
23.2
23.2
21.3
17.5
13.7
9.9
Fate of 100 cases smear-positive tuberculosis receiving
short-course chemotherapy based on treatment results
in Tanzania*
Year
Cured
Number of cases
Dead
Excreting
bacilli
Cured
per
year
Died
per
year
0.0
8.8
10.7
11.4
12.7
13.5
14.3
0.0
79.6
1.8
0.0
0.0
0.5
0.4
0.0
8.8
1.9
Table 12. Budgeted costsfor tuberculosis chemotherapy, Tanza
nia, 1986
Cost
category
STD
Short
$2.10
$1.95
$2.10
$0.81
Retreat
ment
Diagnosis
Slides/reagents
Sputum container
Bacteriological
Monitoring
Culture
Sensitivity
Drugs
Administration
Labor costs and
hospitalization
Transport
Training
Supervision
Capital 20 %
depreciation
$1.50
$0.81
$1.50
$17.00
$2.85
$40.00
$2.85
SI.50
$3.90
$65.00
$2.85
$67.65
$20.35
$2.37
$2.90
$90.20
$20.35
$2.37
$2.90
$169.12
$20.35
$2.37
$2.90
$3.22
$3.22
$3.22
Total cost per case
$122.70
$168.25
$271.21
$1.95
! 'sE
Hi
Short-course
Standard
chemotherapy chemotherapy
$368
$569
$168
$275
rsr
$314
$514
$243
Note : Based on a 3 % discount rate.
0
1
1.5
h
4
5
0.0
79.6
81.3
81.3
100.0
81.3
6.0
81.8
82.2
4.7
3.4
11.6
7.9
7.3
• Styblo and Chum (1987); Chum el al. (1989).
0.6
1.3
0.8
0.8
I
if
Table 13. Cost-effectiveness of standard 12-month and short
course chemotherapy for smear positive pulmonary tuberculosis
in Tanzania, 1986
$123
it
i'll
Bi
Noles: 1) Labour costs and hospitalization include the salaries
and wages of all staff working on tuberculosis control and the
cost of hospitalizing all tuberculosis patients. As more disag
gregated information was not available, the costs in this
calegciy have been distributed according to the hospitalization
rate for each type of treatment (60 % standard, 80 % short
course, 100 % retreatment). This underestimates the cost per
case treated for standard chemotherapy and overestimates die
cost per case treated for short-course and retreatment because
all staff costs are included in this category.
2) Drug costs are based on 1986 prices and 1986 exchange
rales. Since dial dale the price has declined but the value of the
US dollar has also declined.
3) Transport costs include 25 % of the entire purchase cost of
all vehicles and operating expenses. The assumpdon that
vehicles will last only 4 years on average may be overly
conservative.
Cost per case treated
Cost per case cured
at 18 months
Cost per death averted
Cost per death averted including
one round of transmission
1I
11 and 12. The NTLP has been assisted by the IUATLD since
1979. Excellent data are available on the results of both
standard 12-month and short-course chemotherapy (Styblo
and Chum, 1987, Chum el al., 1988). Comparing the results
of standard and short-course chemotherapy with the natural
history of tuberculosis as documented in South India (Na
tional Tuberculosis Institute, 1974), we can estimate (Table
13) the net impiovement in cure rates and death rates. For
19
V3
o
I
I'
i’-
i
.1
!
■
I
!
■
i
■
.1
!
i-
i
standard 12-month chemotherapy and short-course, the cost
per patient treated in 1986 US dollar was $ 122 and $ 168
respectively. In a programme where all patients that continue
to excrete bacilli receive retreatment, this would raise the
cost per case treated under standard 12-month chemotherapy
. to $ 186 and $ 190 for short-course chemotherapy.
Per case cured at the end of 18 months in excess of
spontaneous cure, it was $ 368 for standard 12-month chemo
therapy and $ 314 for short-course. Short-course chemother
apy is more cost-effective per patient cured. The difference
would be greater except that in Tanzania approximately 80 %
of short-course patients are hospitalized for the first 2 months
and only 60 % of standard chemotherapy are hospitalized.
For standard 12-month chemotherapy, the cost per death
averted was $ 569 and $ 514 for short-course, based on a three
percent discount rate. These estimates are serious overesti
mates for two reasons. First, the benefits of treating patients
relative to no treatment have, only been examined for five
years after treatment. In the South Indian epidemiological
study tuberculosis patients were only followed for five years
(National Tuberculosis Institute, Bangalore, 1974). Thus the
improvement in the death rate due to standard 12-month or
short-course chemotherapy has been underestimated by only
examining the effect for five years. Second, treatment also
reduced, the number of new infections of tuberculosis. Using
the lowest estimates of the number of cases that each case of
smear-positive tuberculosis causes in one year derived in the
section above, we can calculate the number of deaths averted
by reduced transmission in one cycle. The resulting estimates
show standard 12-month chemotherapy to cost $ 274 per
death averted and for short-course chemotherapy only $ 242
per death averted.’
These estimates of the cost per death averted through
tuberculosis chemotherapy are specific to Tanzania but proba
bly represent the higher end of the range for most other
developing countries for four reasons. First, the hospitaliza
tion rate in Tanzania for short-course chemotherapy is espe
cially high. Any country with a more developed peripheral
health system could deliver short-course chemotherapy with
a lower hospitalization rate. This observation must be tem
pered by the fact that the cost per bed-day in many develop
ing countries is considerably higher than the $ 1.50 reported
by the Tanzania Government. In a country where the cost per
bed-day is $ 5, the cost of hospitalizating patients for 2
jnonths would be increased by $ 210. Second, the benefits of
/chemotherapy over no treatment have only been considered
for the first five years following treatment. Consideration of
years 6. 7 and 8 if such data were available would reduce the
cost per death averted. Third, the assumption on transmission
were the lowest reasonable assumptions, not the midpoint of
the expected range of cases transmitted per excretor. Fourth,
die rate of capital depreciation was assumed to be extremely
high 20-25 % per year. In other developing countries, the true
cost per death averted may be considerably lower than
$ 265 ; although in some countries where staff costs and hos
pitalization is more expensive, they may be higher.
Taken together the studies on the cost-effectiveness of
both standard 12-month and short-course chemotherapy
show that tuberculosis chemotherapy is an excellent in
vestment relative to virtually any health intervention.
Most interventions including immunizations and oral rehy
dration therapy yield estimates per death averted in the same
20
Table 14. Comparison of standard 12-month chemotherapy and
short-course chemotherapy for smear-positive cases of tubercu
losis based on data from the NTLP of Tanzania
Cost per death averted
including one round of
transmission
Percent of patients cured
Percent of cases requiring
retreatment
Death rate after 5 years
assuming no re treatment
(%)
Standard
chemotherapy
Short-course
chemotherapy
$275
63.7
$243
82.2
23.2
7.9
26.2
143
range (Haaga, 1982). Second, the analysis clearly indicates
that short-course chemotherapy is preferable to standard 12month chemotherapy. The most significant advantages of
short-course chemotherapy over standard 12-month chemotherapy are summarized in Table 14. Not only is it more cost;
effective per death averted, as calculated above, but it
provides other advantages not included in the estimates. The
cure rate taking into consideration the natural history of
tuberculosis for standard 12-month chemotherapy under exl,
cellcnt conditions is 63.7 % while under short-course it is
82.2 %. The percentage of cases requiring expensive retreat
ment is nearly three times greater with standard 12-month
chemotherapy as compared to short-course chemotherapy.
Finally the death rate with standard 12-month chemotherapy
is nearly twice as high as with short-course chemotherapy.
Short-course chemotherapy, because of a higher cure rate,
will also accelerate the decline in the risk of infection by
reducing transmission. Short-course chemotherapy will also
limit the development of resistance to isoniazid and ri
fampicin in the long term. In summary, short-course chemo
therapy for tuberculosis is an excellent cost-effective health
intervention.
All these computations of cost-effectiveness have been
based on the assumption that all patients treated for smear
positive tuberculosis do indeed have smear-positive tubercu
losis. As the cost per case treated is high, false positives are
a particularly onerous burden on the health system. In Tan
zania, where a reference laboratory is available to monitor
diagnoses made in the periphery, the false positive rate is
low. The most important parameter from a cost point of view
is the predictive value positive or the percent of cases
diagnosed with tuberculosis who actually have the disease.
In Tanzania, this is greater than 97 %. The cost per death
averted must be divided by the predictive value positive to
get the true cost-effectiveness in a particular situation. In
countries with poorly trained microscopists or frequent atypi
cal mycobacteria infections, the predictive value positive
could be much lower than 95 %. The potential of wasting
scarce resources on patients without tuberculosis puls a high
premium on training health workers and microscopists to
diagnose tuberculosis correctly.
BCG and case treatment
One would like to compare the two major interventions for
tl
h
c
U
n
B
ti
u;
01
&
if
nc
m
di
tii
at
co
de
Ioj
the
co
be
cot
det
inc
ch<
ten
risJ
thn
infc
cos
The
Ind
nia.
low
mo/
rsk
sam
prel
shot
far j
exis
Thitube
Son
cour
relat
Rest
T
gene
can 1
-Ef
mate
need
basic
disiri
estab
prior
surve
the tc
-■ lli
J
-
11
s
i
o'
o
O
I
I
4
I
&
5i
i
Jf
s
y
!/-
h,
;y
; o
r
All
u
re
nor
is
3W
• sc.
dith
to
In
■PiJive
, ‘Hg
:.gh
! 10
I
i
I
.for
,
tuberculosis control : BCG and case treatment They are,
however, not truly comparable because even complete BCG
coverage at birth will only affect 10 % of mortality. Case
treatment is absolutely necessary to reduce the other 90 % of
mortality. How does the cost-effectiveness of expanding
BCG coverage compare to expanding case treatment activi
ties ? The cost per death averted can be compared directly
using the studies mentioned in the text above. Some may
object that a death between the ages of 0 and 14 represents a
greater loss of years of life than a death at age 35. However,
if we choose to examine discounted years of life lost it will
not significantly alter the comparison. A death at age 7, the
midpoint for deaths averted by BCG, represents at a 3 96
discount rate 29.7 years of life lost; while a death at age 34
the average age of a tuberculosis death represents 23.4 years
at a similar discount rate. Therefore, we can examine the
cost-effectiveness of the two interventions using the cost per
death averted bearing in mind that discounted years of life
lost would change the relationship by less than 20 percent
The cost per death averted through tuberculosis chemo
therapy should change little as the risk of infection in a
community declines. Ceterusparibus, the only change would
be the slight increase in the cost of detection as more cases or
cough would have to be screened per case of tuberculosis
delected. This does not hold true for any immunization
including BCG. The costs of vaccinating all infants will not
change as the risk of infection declines, but the benefits in
terms of deaths averted will decline proportionately to the
risk of infection. In other words, the cost per death averted
through BCG must be inversely proportional to the risk of
infection. Figure VII shows two hypothetical curves for the
cost per death averted as a function of the risk of infection.
The curves are fitted to die single data point on BCG for
Indonesia and the single point on case treatment for Tanza
nia. While the data are clearly weak, the principle is clear. At
low annual risks of infection case treatment is substantially
more cost-effective than expanding BCG coverage. At higher
risks of infection, the costs of both interventions are of the
same order of magnitude. This curve should not be inter
preted to mean that countries with low risks of infection
should curtail BCG vaccination activities. The discussion so
far provides no insight into the savings from cutting back an
existing activity versus the potential reduction in benefits.
This discussion does not imply that the policy choice in
tuberculosis control is between BCG and case-treatment
Some combination of the two is likely to be desirable in many
countries. Il docs, however, indicate that BCG becomes
relatively less attractive as the risk of infection declines.
Research priorities
This discussion of tuberculosis leads naturally to some
general recommendations for tuberculosis research. These
can be divided into six areas :
- Epidemiology. The wide confidence intervals in the esti
mates of incidence, prevalence and mortality highlight the
need for epidemiological research. Many countries require
basic information on incidence and mortality rates and their
distribution by age and socio-economic status, in order to
establish the importance of tuberculosis as a health sector
priority. For those countries without vital registration, new
survey uxhniques based on the verbal autopsy may provide
the tools with which tuberculosis mortality can be quantified.
- Prevention. Because of the uncertain and variable effec
tiveness of BCG, a new effective vaccine would be a major
tool, especially if it would also prevent tuberculosis in
already infected individuals. Fine (1989), however, has pointed
out that it will be difficult to test appropriately the effective
ness of any new vaccines for moral and technical reasons.
Research is also needed to explore the most appropriate role
for chemoprophylaxis in developing countries, especially in
subjects infected with tubercle bacilli and HIV.
- Diagnosis. Development of new tools for the rapid and
early diagnosis of tuberculosis would substantially improve
case detection. Research into serological or sputum diagno
sis that can be deployed at reasonable cost in peripheral
health facilities in developing countries should be a priority.
- Chemotherapy. Development of new shorter acting, cheap
drugs would help address two major issues in tuberculosis
control: compliance and cost. While opportunities exist for
developing new drugs (Sensi, 1989), relatively little research
is underway. Another possibility that seems worth exploring
is the use of depot preparations which would solve many of
the compliance problems.
- Programme design. There is an urgent need for opera
tional and health economics research on strategies for tuber
culosis control.
Some key issues have been highlighted in this piece: what
is the trade-off between the cost of supervision and the
improvement in compliance, taking existing infrastructure
into consideration ? What is the cost-effectiveness of alterna
tive diagnosis strategies ? These and many other issues need
to be addressed in an organised fashion.
- HIV and tuberculosis interactions. The interaction be
tween HIV and tuberculosis has not been fully addressed in
this piece. It is evident that immune suppressed patients with
HIV and tuberculous infections have a high probability of
developing clinical tuberculosis. In Central East Africa,
tuberculosis programmes are already reporting a consider
able increase in the number of cases of tuberculosis. The
impact of any HIV-tuberculosis interaction in developing
countries with a high prevalence of tuberculous infection on
the annual risk of infection for the rest of the population is not
yet known. Epidemiological study of these relationship has
just begun and should be considered a priority for research.
Major operational conclusions
This review of tuberculosis can be summarized in five
major points :
- The magnitude of the tuberculosis problem is simply stag
gering. Our estimates suggest that more than 2 J million
people die from tuberculosis each year. This is probably
more than any other single pathogen ; the only disease that
come close in terms of total deaths is measles, estimated to
kill 2.5 million per year (Walsh, 1988). The burden of
tuberculosis extents beyond mortality; the annual incidence
of new cases of all forms of tuberculosis is over 7.1 million
cases in the developing world. Tuberculosis is unique amongst
the major killers of the developing world in that it afflicts
nearly all age-groups. Many children die from tuberculous
meningitis and miliary tuberculosis. But the greatest burden
of tuberculosis incidence and mortality is concentrated in
adults 15 to 59. These are the parents, workers and leaders
of society. This heavy toll of the care givers for the rest of
21
I
I
hl
III
Hl
II!
o
O'
Ii
I
s:i
1:
H
I fl
I!
■ a
society makes tuberculosis a truly unique problem.
-In at least the last decade, tuberculosis has been ignored by
much of the international health community. Shimao (1989)
has ouilined the decline of the human and institutional
capacity to address the tuberculosis problem over the last
decades which is but one symptom of a general lack of
priority attached to tuberculosis action and research. An
other example is the Institute of Medicine (1986) study of
vaccine development priorities for the developing world.
They classified diseases into three levels of priority for
research on vaccines. While leprosy, received significant
attention tuberculosis was not even mentioned in the lowest
priority group. Clearly, focussing international attention on
tuberculosis is necessaryfirst step ifmore resources are to be
directed to combating tuberculosis.
- Existing diagnostic technology and chemotherapeutic agents
can be used effectively in developing countries to cure
tuberculosis. The lUATLD-assisted National Tuberculosis
Programmes (e.g. Tanzania, Malawi) have shown that short
course chemotherapy can be applied on a national scale with
excellent results. Cure rates approaching 90 % even taking
into consideration compliance can be achieved in even the
most difficult circumstances.
-Tuberculosis chemotherapy and BCG vaccination (in
countries with high risks of infection) are some of the most
.il
i
o
cost-effective health interventions available in the health
armamentarium. Our analysis of the National Tuberculosis
and Leprosy Programme in Tanzania has shown that treating
smear-positive tuberculosis costs less than $ 250 per death
averted. The cost per discounted year of life saved is there
fore substantially less than $ 10. There arefew interventions
that are as cost-effective as tuberculosis case-treatment.
Given our estimates that slightly more than half of all new
cases of tuberculosis receive some form of treatment that in
most cases is not highly effective, we estimate that the total
increased cost of treating all new cases of tuberculosis
through a well managed chemotherapy programme to be less
than 700 million US dollars per year.
- Evidence has accumulated that the HIVltuberculosis inter
action may significntly exacerbate the epidemiological situ
ation of tuberculosis. The potential rise, due to this interac
tion, in the risk of infection in Africa and other regions
depending on the spread of HIV makes all our operational
conclusions about tuberculosis all the more pressing.
The combination ofan enormous burden, years ofneglect,
the existence of effective interventions, the demonstrated
interaction between tuberculous and HIV infections and one
of the most cost-effective interventions available must make
tuberculosis one of the highest priorities of action and re
search in international health.
REFERENCES
ARONSON J., ARONSON C. & TAYLOR H. A 20-year appraisal
of BCG vaccination in the control of tuberculosis. Arch.Int.Med.,
101 : 881-893 (1958)
BARNET G.D., GRZYBOWSKIS. & STYBLO K. Present risk of
developing active tuberculosis in Saskatchewan according to pre
vious tuberculin andX-ray status. BulLInt.Un.Tuberc.f45: 51-74
(1971)
BARNUM H.N., TARANTOLA D. & SETIADY I.F. Cost-effec
tiveness of an immunization programme in Indonesia. BulLWHO,
58 (3): 499-503 (1980)
BARNUM H.N. Cost savings from alternative treatments for
tuberculosis. Soc.Sci.Med., 23 (9): 847-850 (1986)
BLACKWELL B. The drug regimen and treatment compliance. In
Haynes R.B., Taylor D.W. & Sackett D.L. (eds.). Compliance in
health care. Baltimore : Johns Hopkins University Press (1979)
BLEIKER M.A.. CHUM H.J.. NKINDA S.J. & STYBLO K.
Tanzania National Tuberculin Survey, 1983-1986. In : XXVIth
IUAT World Conference on Tuberculosis and Respiratory Dis
eases. Tokyo : Professional Post-graduate Services, p. 117-121
(1987)
BLOOM B. An ordinary mortal’s guide to the molecular biology of
tuberculosis. BulLIni.Un.TubercJRespir.Dis., 64 (3): 50-58 (1989)
CANETTI G. Endogenous reactivation and exogenous reinfection.
Their relative importance with regard to development of nonprimarv tuberculosis. Bull.Ini.Un.Tuberc., 47 : 116-122 (1972)
CAUTHEN G.M., PIO A. & TEN DAM H.G. Annual risk of
tuberculous infection. Geneva : WHO/TB/88.154 (1988)
CDC unpublished data. Atlanta, CDC (1989)
. ./
CHAULET P. Compliance with antilubcrculosis chemotherapy in| * z
developing countries. Tubercle, 68 : 19-24 (1987)
CHUM: H.J., STYBLO K. & VAN CLEEF M.R.A. Eight-years’
experience of the National Tuberculosis and Leprosy Progranune in
Tanzania. In : XXVIth IUAT World Conference on Tuberculosis
and Respiratory Diseases. Tokyo: Professional Postgraduate Serv
ices, p. 111-116(1987)
22
CHUM H.J. Ten years of the National Tuberculosis/Leprosy Pro
gramme in Tanzania. BulLInt.Un.Tuberc.Respir.Dis., 64 (3): 3436(1989)
CLEMENS J.D., CHUONG J.J.H. & FEINSTEIN A.R. The BCG
controversy. A methodological and statistical reappraisal. JAMA,
249 (17): 2362-2369 (1983)
CROFTON J. The contribution of treatment to the prevention of
tuberculosis. Bull.Int.Un.Tuberc., 32 (2) : 643-653 (1962)
DANIEL T.M. Rapid diagnosis of tuberculosis : laboratory tech
niques applicable in developing countries. Rev.InfiDis., II (suppl
2) : S471-S478 (1989)
DAWSON J. J. Y. ET AL. A 5 year study of patients with pulmonary
tuberculosis in a concurrent comparison of home and sanatonuni
treatment for one year with isoniazid plus PAS. BulLWHO, 34 : .
533-551 (1966)
DROLET G.J. Present trend of case fatality rates in tuberculosis.
Am.Rev.Tuberc. 37 : 125-151 (1938)
East African and British Medical Research Council. Tuberculosis j
in Tanzania : a follow-up of a National Sampling Survey of drug
resistance and other factors. Tubercle, 58 : 55-78 (1977)
East African and British Medical Research Council. Tuberculosis ;
in Kenya: follow-up of the Second National Sampling Survey and
a comparison with the follow-up data from the First (1964) National
Sampling Survey. Tubercle, 60 : 125-149 (1979)
East African and British Medical Research Council. A study of the t
use of maternity and child welfare clinics in case-finding for :
pulmonary tuberculosis in Kenya. Tubercle, 68 : 93-103 (1987)
FELDSTEIN M.S., PIOT M.A. & SUNDARESAN T.K. Resource
allocation model for public health planning. A case study of
tuberculosis control. BulLWHO, Supp.: 1-110 (1973)
FINE P.E.M., PONNIGHAUS J.M., MAINEN., CLARKSON LA |
& B LISS L. Protective efficacy of BCG against leprosy in Northern
Malawi. Lancet, 1: 499-504 (1986)
FINE P.E.M. The BCG story : lessons from the past and implica
tions for the future. Rev.InfiDis., II (suppl. 2): S353-S359 (1989)
' !
F
le
F
le
F>
ar
re
E
2'
G
ai
1G
W
O
nf
62
G
E
H
in
lit
ci<
H.
mi
(e<
Ur
H(
(1‘
Im
pri
trit
IU
JA
in}
kli
Vc
JO
Ep
los
17^
KL
res
Im:
LE
pet
Sci
Re;
Rej
88.
Lir
ma.
pul
bas
and
Me
vac
life
ME
cati
(19
Mir
198
MC
tube
95:
MU
dev
910 011 I H jo ipnos‘u-)jy pruoprunsui ‘of
Eipu| jo uoijepossy
<JBJun|OA
Xq pauoisiuiuio^
9^9 131
Z. 1-0 OB- I- - IHiaa AA3N '3AV1ON3 133HSHONVd Et^a
S3HMVHOOdd QNV SHIOIlOd H11V3H HOd SSHlOnN
A±ISU3AINn HUH3N IVIUVHVMVP
Sn±IH3N3 UOSSSdOHd
irusNva uvavaaa
( WSI3IXIH3 QNV S1N3MWOO S3HOO13M HOHinV 3H1 ’AHlNnOO
3HX 30 SUV3OHOS O3NH3ONOO ONOHV SNOISSHOSIO HOd H3dVd NOIllSOd V)
VIQNI HOd
awwvHDOdd noaiNoo sisoinoaaani ivnoiivn
aasiAaa s.)iNva aiaoM ani jo sNouvondwi snoiaas
•_<' Sl<l>
SERIOUS IMPLICATIONS OF THE WORLD BANK'S REVISED
NATIONAL TUBERCULOSIS CONTROL PROGRAMME FOR INDIA
(A POSITION PAPER FOR DISCUSSIONS AMONG CONCERNED
SCHOLARS OF THE COUNTRY. THE AUTHOR WELCOMES COMMENTS
AND CRITICISM)
DEBABAR BANERJI
PROFESSOR EMERITUS
JAWAHARLAL NEHRU UNIVERSITY
NUCLEUS FOR HEALTH POLICIES AND PROGRAMMES
B-43 PANCHSHEEL ENCLAVE, NEW DELHI-110017
TEL. 646 2851
1
CHAPTER 1
AN OVERVIEW
The proposal of the World Bank for what they call "Revised
National Tuberculosis Control Programme" (RNTCP) for India is
going to have very damaging consequences for development of the
health services of the country, as it suffers
from serious
infirmities. The Voluntary Health Association of India and the
Nucleus for Health Policies and Programmes have got together to
produce this document, which contains a scientific analysis of
the RNTPC to draw attention to its infirmities and to formulate
an alternative proposal for strengthening the National
Tuberculosis Programme (NTP) of India. While the RNTCP will be
analysed in detail at a later stage, it will be worthwhile here
to note that the infirmities belong to three categories. The most
important among them is that the RNTCP has been developed without
paying adequate attention to the process of formulation of the
NTP and the factors which have come in the way of its
implementation over the more than three decades since it was
adopted by the Government of India. Secondly, in considering the
an
of
conceptualisation
of
the
RNTCP
as
an
outcome
interdisciplinary study, adopting a systems approach, there are
very serious flaws in project formulation in terms of system
analyses,
optimisation,
epidemiological and sociological
coverage,
managerial
and
technological
perspectives,
epidemiological impact, repayment of the World ]Bank loan,
replicability of the RNTCP, and other such considerations.
Thirdly, the World Bank promoted RNTCP is a part of the sequence
of what are termed as ’’International Initiatives” thrust on the
country from outside at the instance of international agencies,
backed up by strong support from many powerful western countries,
which make substantial contributions to the budgets of the
former. Ironically, as will be demonstrated later on, it is these
international initiatives which have been proved to be the major
hurdles in the way of implementation of the NTP all these years.
The RNTCP
thus appears as a not well thought out operation
performed by persons from the very same group who, in the first
place, have been responsible for the damage done to the NTP.
Even from this very broad mention of the RNTCP it is possible to
discern an underlying deep streak of dogmatism among the
exponents of the RNTCP, which has impelled them to 'forget7 the
enormous and very substantial public health research in
tuberculosis conducted within the country and put enormous
pressure on the national
authorities to submit to 'models'
developed by them outside the country. Apart from very serious
conceptual flaws, these western models are technocentric, imposed
on the people from above and make the country dependent on
assistance
from
outside.
'Forgetting'
ideas
developed
indigenously has thus become almost a prerequisite for taking
international initiative in health fields; the fields gets closed
to scientific discussions and only those 'natives' who do not do
question them, or are incapable of doing so, are allowed entry
into the privileged group by the international syndicate.
Soon
after the poor countries of the world
had dared to make a
declaration of self-reliance in health in the Alma-Ata
Declaration of 1978 (WHO 1978), the affluent countries 'invented'
what they called "Selective Primary Health Care" (Walshe and
Warren 1979) , which was almost immediately followed by the
unleashing of a series of international initiatives in health,
This provides a frightening example of the extent to which the
more affluent countries of the world are prepared to go in
imposing their will on the countries that are economically and
politically dependent on them. Significantly, there has been
little protest from the concerned community of public health
scholars even in the affluent countries to such brazen forms of
manipulation of science to impose programmes on 'defenceless'
countries, from outside. The World Bank backed RNTCP is a
particularly unfortunate example of imposition of such
international initiatives.
The drive towards globalisation of the economy and polity has
made the poor countries even more vulnerable to manipulation by
the rich countries. In the so-called global village, the poor
countries are condemned to serve as bonded hirelings of the rich
kulaks and cowboys. A 'dialectical' outcome of this form of
international relations is for the oppressed peoples to make
conscious efforts to prevent the dominant powers to 'forget'
their historical heritage. To adapt a quotation from Milan
Kundera, it becomes a struggle between memory and forgetfulness.
Just as ahistoricity becomes an important weapon in the hands of
those who would fight to continue to monopolise the control over
the bulk of the resources of the world, breaking into their
consciousness to 'remind' them about the history they try to
forget becomes a weapon in the hands of the oppressed to fight
oppression.
At a time when a concerted effort is being made by World Bank
officials to promote RNTCP in this country, this document may be
considered as a modest effort to 'remind' them as well as the
concerned authorities in the country about the very significant
work that has been done in India to deal with tuberculosis as a
public health problem. No apologies will be offered here for
consciously taking the side of the people by bringing out well
researched data which had formed the basis of the NTP some three
and a half decades ago. A very deliberate effort is made here to
describe the work rather extensively. The 'battle lines' are
clear: on one side are the indigenous research efforts made to
formulate a nationally applicable, socially acceptable and
epidemiologically effective tuberculosis programme, and on the
other side is a 'foreign inspired', prepackaged programme that is
sought to be thrust on the country by powerful countries and
international organisations.
s
-/
CHAPTER 7
CONCLUSIONS AND AN ALTERNATIVE FRAMEWORK FOR ACTION
The above account shows how a well researched and reasonably
simple and straight forward programme can get hopelessly
confounded due to interplay of a variety of social, political and
economic forces. NTP essentially involved offering diagnosis and
treatment to the very substantial portion of tuberculosis
patients who were actively seeking treatment in various health
institutions, both in rural and urban areas.
These institutions
were offered a referral support system which extended right up to
the super-specialists in post-graduate teaching hospitals. State
Tuberculosis Centres and NTI and other tuberculosis research and
teaching institutes were meant to provide support to the
programme in the form of training, monitoring, evaluation and
operational research.
But as pointed out by Halfdan Mahler, 'even the simplest
technology, if it is not properly deployed and utilised by the
infrastructure,
just will
not move,
will
not control
tuberculosis, will not meet people's felt-needs. '
This is what
has befallen on NTP.
The infrastructure has been grievously
damaged because of sharp decline in the quality of public health
research.
practice and research,
filling up of key public health posts by
the persons who do not have technical competence, by imposition
of target oriented specialised programmes on an already weak
infrastructure and a correspondingly sharp fall in the quality of
administrators
in the field of
--- --- ; and research personnel
tuberculosis.
From the basic premises presented
suggestions are being made below:
above,
some
important
1.
While tuberculosis workers cannot take on themselves the
onerous task of rejuvenating the moribund health and family
planning services systems, the crisis has become so profound
that there are good chances that the political leaders will
have to wake up to it.
A detailed
programme for
rejuvenation of the health services is given in the author's
B.C.Dasgupta Oration of the Indian Public Health Association
in 1988 (Banerji 1988b; 1984b).
Some important components
are:
a.
Building up a critical mass of public health workers in the
fields of education, training, research and practice.
1
b.
Restructuring the cadre structure to place competent public
health specialists in key public health positions.
c.
Concurrent removal of the square pegs in the round holes of
the system.
d.
Making "conditional” integration of the special target
oriented
family
planning
and
other
programmes
"unconditional”.
This will lead to according much higher
priority to NTP as the problem is responsible for a
substantial part of the total suffering caused by health
problems as a whole.
2.
Tuberculosis workers can help in the process of rejuvenation
of the health and family planning service systems by
insisting that this process is critical for providing good
tuberculosis services to be suffering masses of the country.
3.
On its own, even considering the constraints of the general
health services as given, there is still considerable scope
for improving the NTP system through use of operational
research and systems analysis.
The Surajkund Conclave
recommendations can serve as a starting point.
4.
The very improvement in the NTP system might stimulate
improvement in the wider health and family planning services
systems, by providing an example.
5.
NTI can be rejuvenated by bringing together a competent
interdisciplinary team of workers, so that it can play a
role in strengthening the NTP.
It can even extend its
activities to serve as one of the many institutions which
would be necessary to strengthen the general health
services.
6.
Concurrently, competent tuberculosis workers are placed as
heads of tuberculosis wings of the central and state health
services.
7.
Other tuberculosis institutions, such as TRC, should be
tuned to serve the NTP, i.e., the problems they deal with
must emerge from the field situation, and not the other way
round, as is often the case at present.
8.
The idea of Task Force (Editorial 1990), or a similar set up
(Fox 1990)r which is vested with power and resources to act
as a watchdog for the implementation of NTP, very well
blends with the other suggestions for improving NTP given
here.
2
t
9.
Again, there is considerable scope for optimising the urban
components of the NTP.
10.
Tuberculosis Association of India and its branches can be
revamped to perform a complementary role in strengthening of
NTP - e.g., conducting independent evaluation, offering
technical assistance,
providing logistical
support,
providing training, and so forth.
In sum, the suggestion is that we take steps to unleash the
social forces which ensure that simple and efficacious technology
developed in India is made accessible to the hundreds of
thousands of sputum positive cases, who are actively seeking
relief for suffering but who are still being thrown out of the
health institutions with a Jbottle of useless cough mixture.
Sociologically, it is contended that the very meeting of the felt
need generates more needs, and, if that does not happen, active
educational steps are taken to generate more needs to reach a
level when it starts having an epidemiological impact.
This
epidemiological impact will occur in consonance with the impact
that might occur as a result of changes in the natural history of
tuberculosis in India.
3
■??) S'V
I
i
Tuberculosis Control in India
&
I
I
Sociaf Assessment
of Target Audiences in
13 Slums
by FEMCONSULT
Proposed TH Control Project
Public Folfcy Division
Voluntary Health Association of India ,
40, Institutional Area, South of II I
New Delhi - 110 016
Slum Sites
Bangalore
Lucknow
Banija Mohal (very poor)
Vija Khera (very poor)
Ambedgar Nagar (better off)
Frazertown (very poor)
Koramangalafbetter off)
Jaipur
Pune
Valmiki Basti (poor)
Fauji Basti (poor)
Hathroi Basti (better off)
Abedgar Nagar (poor)
Vaidu Wadi (better off)
Hyderabad
Indirammanager (poor)
Allapoor (less poor)
Mahatma Ghandi Nagar (better off)
Proposed TB Control Project
Slum Sites
cknow
Jaipur
Pune
Hyderabad
BangaloreA
x Proposed TB C ontrof Project
Slum Study Methodology
;
■ Individual In depth Interviews
• Community households
• Health providers - public
• Health providers - Private (all categories of doctors)
• Pharmacy Owners & staff nurses
■ Group Interviews
interviewers werex
• community embers
■ Exit Interviews
• Patients
■ Observation
• Government health care facilities and community
Proposed TB Control Project
TB/Persistent Cough
Prevalence among households
Based on a total of 1,042 households interviewed
u
-■■’I ■’! 11
in all five cities.....
20% 1_
18% |__
16% r14% L.
□ P ersj s te nt Coughers
■ Diagnosed TB Cased
12% j—
10%
8%
6%
4%
2%
0%
■D
}
Proposed TB Control Project
■?
X
?
Ic
■■
1
u
I
1
5
4
•j
I' Findings (Community Members)
m•
TB is.....
J Curable (according to most)
J Something best kept hidden
'S Contagious (through air, food, clothes)
1^4
'T Dangerous
J Disease of the poor
Never heard of TB (1/3 of sample)
Proposed TB Control Project
Findings (Community Members)
TB Symptoms
Cough
Fever
Blood in sputum
Proposed TB Control Project
4.. .
■
■
.■
i
w
■
TB and Stigma
Varies by City, Slum
Patients not told TB diagnosis
Isolate TB patients
V Medical workers & other fear infection
•JSome private doctors reluctant to treat
J TB researchers thrown out of house
V Euphemisms for TB
■JDon’t admit to having TB
Proposed TB Control Project
•Amount varies by slum and city
•Doctors often do not tell patients with TB their diagnosis
•Widespread community perception that TB patients, their food and
clothing must be isolated
•Afraid of being infected - medical practitioners, TB treatment facility
staff, patients in large hospitals
•Some private doctors do not want to treat TB patients
•In a few slums, researchers thrown out of community member’s
houses when topic raised
•Euphemisms for TB used
•TB patients do not admit to having TB
r
TB and Gender
■ More older men than women have TB
■ Husband collects medicines
■ Less access to medical care for women
■ Women default due to
• not allowed money for medicine, transport
• no direct contact with treatment center
■ Women reluctant to see male doctor
■ Female with TB can’t marry, is divorced
Proposed TB Control Project
•More common in older men than women
•Husband usually collects medicines for wife
•Women have less access to medical care for may use cheaper care
•Sometimes women defaulted because
«=>Husbands did not allow them to spend money on medicine or
transportation once wife was well enough to work
^Husband acted as intermediary so wife did not have direct
contact with treatment center
•Women reluctant to visit male doctors
^prefer female doctors
^prefer places other women go
•difficult for female TB patient to marry or stay married
■
.
T
i
Treatment Seeking
■ Treat TB with Allopathic Medicine
■ Don't use home remedies
■ Learn about TB from others
■ Go to private doctor first
■ Go from doctor to doctor
■ Go to public facilities If:
• referred by private doctor
• recommended by relative, other
• have previous experience
(Continued on next slide...)
Proposed TB Control Project
•Tb believed best treated by allopathic medicines
•Very few report use of home remedies for TB
•People learn about TB through interpersonal communications
•Those who seek treatment go first to private doctors because:
^conveniently located
cheap (Rs 10-2 sometimes includes drugs
^privacy accorded shameful disease
^treated better than at Government facilities
^Government medicine believed to be.inferior
•Patients go from doctor to doctor seeking correct treatment and
diagnosis
^People attend public facilities
^referred by private doctor
^recommended by relative or friend
^previous experience
■7
-
7'
Treatment Seeking (continued)
■ Believed Government drugs inferior, not
free
■ Collecting drugs every 14 days too frequent
■ Private, public doctors confused about
short course chemotherapy
■ Each private doctor has his own TB regime
■ Symptomatics can't afford treatment,
diagnosis
Proposed TB Control Project
•Heopie believe medicines are not free and inferior in public sector
•Doctors in both public and private sectors showed confusion about
SCC during interviews
•Even fortnightly visits to collect drugs problematic because:
^No extra money for transportation - few or no public health
facilities in slums
^Government facilities often out of medicines
^Day laborers cannot afford lost wages (including husband
coming for wives)
•Each private doctors has his/her own drug regime for treating TB
Incomplete Treatment
■ Main reasons financial
• funds needed to live
• transportation expensive
• private doctors expensive
• TB drugs expensive
■ Stop when better
■ Doesn't know why has TB
■ Don't understand treatment duration
■ Doctor says TB cured
■ Can’t afford second treatment cycle
■ No outreach workers follow up
Proposed TB Control Project
•
•-
*<V»‘
FEMCONSULTRecommendations
■ Issues to address through I. E.C
shortening path between INITIAL symptoms
and APPROPRIATE diagnosis
■ addressing defaulters problems
■ Address stigma (e.g. by emphasizing that TB is
curable)
■ Charge small fee for medicines (refunded upon
completion of treatment)
Proposal TR Control Project
I
*
SERIOUS IMPLICATIONS OF THE WORLD BANK'S REVISED
NATIONAL TUBERCULOSIS CONTROL PROGRAMME
FOR INDIA
(A POSITION PAPER FOR DISCUSSIONS AMONG CONCERNED SCHOLARS OF THE
COUNTRY. THE AUTHOR WELCOMES COMMENTS AND CRITICISM )
DEBABAR BANERJI
PROFESSOR EMERITUS
JAWAHARLAL NEHRU UNIVERSITY
NUCLUES FOR HEALTH POLICIES AND PROGRAMMES
B-43 PANCHSHEEL ENCLAVE, NEW DELHI - 11O 017
TEL. 646 2851
Coinmisioned by
Voluntary’ Health Association of India
40, Institutional z\rea. South of II I
New Delhi - 110 016
I
SERIOUS IMPLICATIONS OF THE WORLD BANK'S REVISED
NATIONAL TUBERCULOSIS CONTROL PROGRAMME FOR INDIA
(A POSITION PAPER FOR DISCUSSIONS AMONG CONCERNED
SCHOLARS OF THE COUNTRY. THE AUTHOR WELCOMES COMMENTS
AND CRITICISM)
DEBABAR BANERJI
PROFESSOR EMERITUS
JAWAHARLAL NEHRU UNIVERSITY
NUCLEUS FOR HEALTH POLICIES AND PROGRAMMES
B-43 PANCHSHEEL ENCLAVE, NEW DELHI-110017
TEL. 646 2851
1
CHAPTER 1
AN OVERVIEW
The proposal of the World Bank for what they call ’’Revised
National Tuberculosis Control Programme" (RNTCP) for India is
going to have very damaging consequences for development of the
health services of the country, as it suffers
from serious
infirmities. The Voluntary Health Association of India and the
Nucleus for Health Policies and Programmes have got together to
produce this document, which contains a scientific analysis of
the RNTPC to draw attention to its infirmities and to formulate
an alternative proposal for strengthening the National
Tuberculosis Programme (NTP) of India. While the RNTCP will be
analysed in detail at a later stage, it will be worthwhile here
to note that the infirmities belong to three categories. The most
important among them is that the RNTCP has been developed without
paying adequate attention to the process of formulation of the
NTP and the factors which have come in the way of its
implementation over the more than three decades since it was
adopted by the Government of India. Secondly, in considering the
an
of
outcome
conceptualisation
of
the
RNTCP as
an
are
there
systems
approach,
interdisciplinary study, adopting a
very serious flaws in project formulation in terms of system
analyses,
optimisation,
epidemiological and sociological
coverage,
perspectives,
managerial
and
technological
epidemiological impact, repayment of the World Bank loan,
replicability of the RNTCP, and other such considerations.
Thirdly, the World Bank promoted RNTCP is a part of the sequence
of what are termed as ’’International Initiatives” thrust on the
country from outside at the instance of international agencies,
backed up by strong support from many powerful western countries,
which make substantial contributions to the budgets of the
former. Ironically, as will be demonstrated later on, it is these
international initiatives which have been proved to be the major
hurdles in the way of implementation of the NTP all these years.
The RNTCP
thus appears as a not well thought out operation
performed by persons from the very same group who, in the first
place, have been responsible for the damage done to the NTP.
Even from this very broad mention of the RNTCP it is possible to
discern an underlying deep streak of dogmatism among the
exponents of the RNTCP, which has impelled them to 'forget' the
enormous and very substantial public health research in
tuberculosis conducted within the country and put enormous
pressure on the national
authorities to submit to 'models'
developed by them outside the country. Apart from very serious
conceptual flaws, these western models are technocentric, imposed
on the people from above and make the country dependent on
assistance
from
outside.
'Forgetting'
ideas
developed
indigenously has thus become almost a prerequisite for taking
international initiative in health fields; the fields gets closed
to scientific discussions and only those 'natives' who do not do
question them, or are incapable of doing so, are allowed entry
into the privileged group by the international syndicate.
Soon
after the poor countries of the world
had dared to make a
declaration of self-reliance in health in the Alma-Ata
Declaration of 1978 (WHO 1978), the affluent countries 'invented'
what they called ’’Selective Primary Health Care” (Walshe and
Warren 1979), which was almost immediately followed by the
unleashing of a series of international initiatives in health,
This provides a frightening example of the extent to which the
more affluent countries of the world are prepared to go in
imposing their will on the countries that are economically and
politically dependent on them. Significantly, there has been
little protest from the concerned community of public health
scholars even in the affluent countries to such brazen forms of
manipulation of science to impose programmes on 'defenceless'
countries, from outside. The World Bank backed RNTCP is a
particularly unfortunate example of imposition of such
international initiatives.
The drive towards globalisation of the economy and polity has
made the poor countries even more vulnerable to manipulation by
the rich countries. In the so-called global village, the poor
countries are condemned to serve as bonded hirelings of the rich
kulaks and cowboys. A 'dialectical' outcome of this form of
international relations is for the oppressed peoples to make
conscious efforts to prevent the dominant powers to 'forget'
their historical heritage. To adapt a quotation from Milan
Kundera, it becomes a struggle between memory and forgetfulness.
Just as ahistoricity becomes an important weapon in the hands of
those who would fight to continue to monopolise the control over
the bulk of the resources of the world, breaking into their
consciousness to 'remind' them about the history they try to
forget becomes a weapon in the hands of the oppressed to fight
oppression.
At a time when a concerted effort is being made by World Bank
officials to promote RNTCP in this country, this document may be
considered as a modest effort to 'remind' them as well as the
concerned authorities in the country about the very significant
work that has been done in India to deal with tuberculosis as a
4-
public health problem. No apologies will be offered here for
consciously taking the side of the people by bringing out well
researched data which had formed the basis of the NTP some three
and a half decades ago. A very deliberate effort is made here to
describe the work rather extensively. The 'battle lines' are
clear: on one side are the indigenous research efforts made to
formulate a nationally applicable, socially acceptable and
epidemiologically effective tuberculosis programme, and on the
other side is a 'foreign inspired', prepackaged programme that is
sought to be thrust on the country by powerful countries and
international organisations.
E>
CHAPTER 7
CONCLUSIONS AND AN ALTERNATIVE FRAMEWORK FOR ACTION
The above account shows how a well researched and reasonably
simple and straight forward programme can get hopelessly
confounded due to interplay of a variety of social, political and
economic forces. NTP essentially involved offering diagnosis and
treatment to the very substantial portion of tuberculosis
patients who were actively seeking treatment in various health
institutions, both in rural and urban areas.
These institutions
were offered a referral support system which extended right up to
the super-specialists in post-graduate teaching hospitals. State
Tuberculosis Centres and NTI and other tuberculosis research and
teaching institutes were meant to provide support to the
programme in the form of training, monitoring, evaluation and
operational research.
But as pointed out by Halfdan Mahler, 'even the simplest
technology, if it is not properly deployed and utilised by the
infrastructure,
just will
not move,
will
not control
tuberculosis, will not meet people's felt-needs.'
This is what
has befallen on NTP.
The infrastructure has been grievously
damaged because of sharp decline in the guality of public health
practice and research,
filling up of key public health posts by
the persons who do not have technical competence, by imposition
of target oriented specialised programmes on an already weak
infrastructure and a correspondingly sharp fall in the quality of
administrators and research personnel
in the field of
tuberculosis.
From the basic premises presented
suggestions are being made below:
above,
some
important
1.
While tuberculosis workers cannot take on themselves the
onerous task of rejuvenating the moribund health and family
planning services systems, the crisis has become so profound
that there are good chances that the political leaders will
have to wake up to it.
A detailed
programme for
rejuvenation of the health services is given in the author's
B.C.Dasgupta Oration of the Indian Public Health Association
in 1988 (Banerji 1988b; 1984b).
Some important components
are:
a.
Building up a critical mass of public health workers in the
fields of education, training, research and practice.
1
b.
Restructuring the cadre structure to place competent public
health specialists in key public health positions.
c.
Concurrent removal of the square pegs in the round holes of
the system.
d.
Making ’’conditional” integration of the special target
oriented
family
planning
and
other
programmes
’’unconditional".
This will lead to according much higher
priority to NTP as the problem is responsible for a
substantial part of the total suffering caused by health
problems as a whole.
2.
Tuberculosis workers can help in the process of rejuvenation
of the health and family planning service systems by
insisting that this process is critical for providing good
tuberculosis services to be suffering masses of the country.
3.
On its own, even considering the constraints of the general
health services as given, there is still considerable scope
for improving the NTP system through use of operational
research and systems analysis.
The Surajkund Conclave
recommendations can serve as a starting point.
4.
The very improvement in the NTP system might stimulate
improvement in the wider health and family planning services
systems, by providing an example.
5.
NTI can be rejuvenated by bringing together a competent
interdisciplinary team of workers, so- that it can play a
It can even extend its
role in strengthening the NTP.
activities to serve as one of the many institutions which
would be necessary to strengthen the general health
services.
6.
Concurrently, competent tuberculosis workers are placed as
heads of tuberculosis wings of the central and state health
services.
7.
Other tuberculosis institutions, such as TRC, should be
tuned to serve the NTP, i.e., the problems they deal with
must emerge from the field situation, and not the other way
round, as is often the case at present.
8.
The idea of Task Force (Editorial 1990), or a similar set up
(Fox 1990), which is vested with power and resources to act
as a watchdog for the implementation of NTP, very well
blends with the other suggestions for improving NTP given
here.
2
•5.
9.
Again, there is considerable scope for optimising the urban
components of the NTP.
10.
Tuberculosis Association of India and its branches can be
revamped to perform a complementary role in strengthening of
NTP - e.g., conducting independent evaluation, offering
technical assistance,
providing
logistical
support,
providing training, and so forth.
In sum, the suggestion is that we take steps to unleash the
social forces which ensure that simple and efficacious technology
developed in India is made accessible to the hundreds of
thousands of sputum positive cases, who are actively seeking
relief for suffering but who are still being thrown out of the
health institutions with a bottle of useless cough mixture.
Sociologically, it is contended that the very meeting of the felt
need generates more needs, and, if that does not happen, active
educational steps are taken to generate more needs to reach a
level when it starts having an epidemiological impact.
This
epidemiological impact will occur in consonance with the impact
that might occur as a result of changes in the natural history of
tuberculosis in India.
3
l|
•
’
ail: <:.
f
itfs
S|«
kM
t:|.
Aejjry,' -] pjaqdOiStjqQ
O) aouapuodsonog (qiaj 'O|qAig )q spuepaqiafy 'anben
aqi 'l»un qo J essay aaueniaAjng sisoinouaqnjL pue tfow opluo eg
VJ ant)fqujezo|/\| -oindei/y apneg ep oijajsiuiyy :(aw ninBue.'Aj
g a; lAAefew 'aAABuoin 'qjiean )o Ajjsiui^ : c/< ujnq3 p H)
eiuezuei'Lueeieg sa jea'queaq ;o Auisiuq/v ’ c/j aqBuoraa 3)
ujm6|ag 'sjassrijg 'qjieajq jo Ajjsiui.'(aw Aa;;'-,^ q p 3) VSA
'8EL30 masnqoessei/y -aBpijqajeg jaang wog g AjisjaAiun
pJCAjen
seipnjg uoijeindoy
joj
jajuag
S3SS3bGG7
jq
■
<
i ffl ■ -4
E
b
I $tii
It
J31
I si ■
fin
4
1
iffl
,1 •,,
■I
spoqiaiA]
“
4®
Bls©
■
1
f
f
■
■
:I?1
I-
Kt
1 ■
4 Li
JO sipuom 3 si ununSpj nsjnop-uoqs nqi ‘spunuBj3aid nsnin
iq pAPf jcuoncu e ie suoiupfoj o.wj pip jo ssnuPAimajp nip pjcdiucin
oi ninnujoddo ire guippojd ‘A’dcj.Sipoujpqp prepireis Sinnqdnj
st ptre ;peppp iscd nip Huunp pnnnjponin unoq seq AdBJPipoiuptp
psjnjjp-uoqs ‘souiunop psnip jo jjb uj snumrej^ojd psxn
luojj nep jo sspuniPjdujQP nip jo psncppq ppjnnjps sjpm ciuEZirej_
pure •r-nbtqurezojy ‘tnxBjEjy in soiuurejSojd nqj_ mxVU
pseps’.q 3un'j pire stsojnnjpqn p isureziy uoru ■) puoijEUJPrJi
oqj jo xuuikjSojj paisissy p:run;v mp jo ucd pjb :np soiuurej3<-ud
sts<>[n?jpqQj [Buonru nip Xq ppinnj|op ejep pnsn Xprus sn^j
.■>nbiquiEZc)j\'
pun tMDfcjv ‘oiinrzucjL
jo soluuiex^jJ [ojjucd
stsofrcj^qn] |cuoncu nip tn sisojnjjnqnj nAnisod-jcnirs
-tunjnds joj Adimq)oiu3i|.q jo spcdiui pin’ \)so.S 5ip ;o
Aprils ipdnp-ui m: jo uodnj Ajnuiunpjd u junsxid ?.a\ .upi]
•Adcjnipuumip pjupprjs
sipuoiu
tnnp PAip.yyn-ison pjoiu nq 01 punoj osji: saw
Adai-'-uioiunip nsjnm-Moi|<; niqiqnwi: suoijtiP.uniin Joints
is-xlantp nip jo nuo si:a\ sisojrLAjAqni .<n:uoiujnd
.■)Anis.x!-ji:.xus joj AdiTJAipotiKHp cturzuvJ tn irtp pn.woig
q sueuitnAJAiiH ipptAq jnipo ipiA\ pnjnduiio sisojnnj.'xjni
joj AdnjPipoimip jo ssnu.AAiin.njj.i-ison nip ;o s.innun'O
pnpi.wud .A'pnis niio .l u .j^ AilKjnipoimu? srsojn.'unqm
jo scup\ipnjj.n-iso.') nip 11: pnqixq PAi:q snrpnjs jiupap^
-•spijiur.co nindojPAnp
isoiu in ppAPtipi: upnq jou PAi:q jepa j ;o ssppxp in
Suustt supiuiSpj u’njppuu lupunupj] AJQjrpqun: ApiP|diuo?
ipiA\ -Tnpnjy urqjn in pPAPiipi? npurnduiop jo ’mirn
q5iu nip ‘jPAPAiopj „ _ /siuniiud sisojnojpqni *0 <i?fiuop nsop
jo aiiuxi nip inqitw uoissiiusuan iinoyiuS:s 01 ninquiuo?
jou prp pur jununnpji junnrdui sc pjopjo pifj r qsiq st pcu
luomzrxn .uoiqnqujE .qpjpjdujop icip pn wous
nip in -rrui ‘saipujy ui snipnj$ -(ojolu jo suiuom q spound
Suoj jo: fuoicucs sisojnpjoqru oi pnuyuop pjp w <i<ojn?jpqm
ipt.w sjunncd JJC JSOLU|B ‘spq^j nqi piuq . /sisojnonxini
joj Adcjnqjoiunqo SuiJOAqnp jo poqjpiu pjcudoiddc
'iM;:
K.,--
nip Surpinj oj pnjOA.np unnq srq uojjn qnrBosoj qaniv
/.uopos jo sjnpcnj pur ‘sjn>po.w Siunjed 3ln
‘sjboa 6C-CJ pn3c sjjnpc uo st - . c/. uctp ojolu. jjoj isojabo
□ip ‘pnDoyc 3JE so3b pc jo 0|dund q^noipp .suiBop pup
jo uonnquisip-o3c oqj 01 osjc mq {iqcuotu pue nounp^y,
n3nq sb oj ajuo jou nnp si juniudopAap oj zuniuipnduji
sc sisop’iojnqru jo nouBUoduji nq £ tpenp jo .-’'neo snoijoar^
0[3uis jso3jb[ s^pjjoax nip ji 3ui^biu -jcoa jnd '.ipBop uonjru;
Q c snsnen sisojnnjnqnj^ •sisojnnj.nqnj .UBue.-ujjnd nApisod
-jcnius njB uoipiiu
ipiq.w jo pppo.w SuidopAap3ln
in jeoa .AJOAn sisojnnjoqnj jo siujoj pc jo scsbo a\du uoijjtuj
I-/ initjc njB njnqjL pjjoai SindopAAp nip ui snujunoo
AUEiu joj uinjqojd qjjcnq nqqnd joIeiu e si ' s.ornnjnqn^
a
l4-
i-
K
uoQonpojjuj
8O-90EL :8££ 1661 Mur]
sjusiied aAiiisod-jesius-sisoinojsqnj
'aAiie6auojas-^iH Buiieaji ueqi aAHoajja-jso
ssa| A|jq6i|s A|uo aq pjnoM siuaned aAi’isod-jeaujs
sisojnojaqni 'aAinsodojas /qj-i 6uneaj> snipoeq aqj
)O uoissiwsueji paanpaj si AdejaqioiuaqD jo pjauaq
isajeajb aqj asneoag Adipjaip uoqejpAqaj jejo pue
sa|seaiu jsuiebe uoiiesiuniuuji se qons suoiiuaAjajui
qpL’aq aApaaqa-isoo jaqjo ueqi ;adeaqo snqi
si siso|nojaqni aApisod-jeaius joj Adejaqjocuaqg
Adejaqioiuaqo pjepuejs
AJOieinqiue joj £. [ 5.Q9 pue Acejaqjoiuaqo
osjnoa-Lioqs Ajoiejnquje joj l l 6 OS ubissiiupe
It’iidsoq qjiM Adejaqioiuaqo pjepueis »oj
uoissiiupi’ (undsoq qjiM Adejaqiouiaqoasjnoa-poqs
J0J 13 L IS SCI ojoaa poAes ajij jo jpaA jad sisoo
leiuoiuajaui aSejOAe aqj^ Adejaqioiuauo pjepuejs
qjiAA %99-og jo pue Adejaqioiuaqo asjnoo-uoqs
qiiAA paAaiqoe aja™ %06~98)° S91ej ajn3
eiuezue_L pue 'anbiqtuezoiAj ^vejeiAj u; s sojnajaqni
aAijisod-jeaius-iuninds Ajeuoiu|nd jo jojjuog
aqi joj saiuujejBojd Adejaqioiuaqo jo ssauaApaajja
-ISO3 aqj pauituexa aAeq
aieqap ;o loafqns
aqi suieiuaj saujunoo OuidojaAap ui s^sojnajaqn
Ajeuouj|nd jojjuoa oi sawujejBojd jo anjeA aqi
I
1
|
1
o'ulvi.s isravM ovivoivs v .nnoxvAx S a
ivai-O f H HHixxofna uhh Av^aiv q f hhhcIo.i.sihhd
sauiunoo ueou^v uejeqeg-qns sajqi ui sisoinojaqm
Ajeuoiu|nd jo± XdejaqioLuaqa jo ssauaAiiaa^j.a isoq
■-
IB
1
fl
Ii
i
i ' II> ’
I'
r-B 1
ilL
.v
aiI
HiivHH ananJ
'
'fi
un i
ijaw
i nil
if
•!
10A
*
d
I
Hi
’1
«
I'i
1■
1 kk)
■
HIE IJVNClirr
TABLEI
COSTS(USS) PER CASE TREATED
TABLE II
Malawi
Mozambique
Tanzania
160
217
155
140
174
127
101
>
Short course chenyoth^rapy
with hospital admission
Average
Average incremental
Marginal
Average
Average incremental
Marginal
Average
Average incremental
Marginal
QQ
60
01
71
42
73
5-1
40
63
37
I
I
Average
Average incremental
Marginal
Retreatment chemotherapy
4c
196
132
117
152
103
77
60
55
36
18
50
41
15
45
10
with hospital adrmsston
I
Hh
F||l
Us!
thi
mIIm
0
I: .] 5«r; -1 !_■; I
d
|| Wh'
Average
Average incremental
Marginal
Treatment results
Cured
’Freatmcnt completed
Failed
Died
Absconded
Transfcrrcd out
139
Ambulatory standard
chemotherapy
I
I
AS % OF PATIENTS) IN MALAWI MOZAMBIQUE. AND TANZANIA
Malawi
Ambulatory short-course
chemotherapy
II
RESULTS OF CHEMOTHERAPY PROGRAMMES (GIVEN
■
Standard chemotherapy with
hospital admission
i1
VOL 338: NOV 23,
A'W
141
97
323
232
206
252
182
146
Fof Malawi the estimates ot cost ot ambulatory therapy are hypothetical based on
measured costs but no ambulatory therapy cs actually provided
The period of hospital admission is 60 days during the intensive phase of
short course chemotherapy and 90 days during retreatment chemotherapy
strcptirmycin, isoniazid, rifampi an. and pyrazinamide followed by
0 months of isoniazid and ethambutol, and the standard regimen
is 2 months of streptomycin, isoniazid, and thiacetazone followed
by 10 months of istmiazid and thucvtazonc. 'Ihe treatment study
lias bcm supplemented by an tn-depth study of programme
costs during the perx'd 1988-89. Data on cost were collected for
all aspects of die tuberculosis programme including a unit-cost
study of two hospitals with tuberculosis patients in each country.
Costs of the tuberculosis pn>grammc can be divided into three
componmts: fixed costs associated wnh use of facilities outside the
tuberculosis programme such as hospitals, clinics, and routine
laboratory services; fixed costs associated with the tuberculosis
programme itself such as the salaries of coordinators, purchase of
vehicles, and purchase of equipment in the tuberculosis reference
laboratory; and variable costs, which arc a function of the number of
patients diagnosed and treated, including drugs, reagents for
sputum examination and culture, food for patients in hospital, and
paper for keeping patients’ records. The average unit cost is the total
fixed and variable costs divided by the number of patients treated.
The average incremental unit cost is defined as the variable costs
plus the fixed costs attributable to the tuberculosis programme itself
divided by the number of patients treated. Finally, the variable costs
divided by the number of patients treated is reported as the marginal
cost per patient treated.
Only costs incurred by the government or non-govemmcnt
organisations affiliated to the programmes have been counted.
Diagnosis and treatment arc free to the patient but most patients
incur personal costs for transport and lost income, particularly when
treatment protocols require 2 months of hospital stay during the
intensive phase. These patient costs have not been included in the
calculations.
The benefits of chemotherapy for smear-positive tuberculosis
can logically be divided into two types: direct benefits to the patient
treated, and indirect benefits to others through reduced
transmission of tuberculosis. The epidemiology' of tuberculosis is
well known.1315 Tuberculosis is an unusual disease because, in the
absence of human immunodeficiency virus (HIV) infection, the
annual risk of infection is stable or declining at 1-2% per year in
most developing countries.'J ’4 Population growth in most parts of
the developing world is equal to or greater than this rate of decline in
annual risk of infection; thus, each clinical case of pulmonary
smear-positive tuberculosis must cause one or slightly less than one
case of pulmonary smear-positive tuberculosis.
'fV (
Excreting
ElTcctivc cure rate
Mozambique
Tanzania
ShortShortShortcourse Standard course Standard course
1984 88 1985 88 1984 88 1930 82 1982 88
87 2
00
13
65
22
27
3 1
904
437
10 4
4 3
24 2
12 5
292
66 2
708
7-3
15
15
113
7-8
83
90 3
38 3
150
110
67
15 7
13 3
332
602
11
Hi
Bi
SI
|
76-9
0-0
24
65
99
42
7-4
|
86 1
Data are for all registered cases for the years shown, with the exception that some
data are not yet available for 1988
The years refer to the year of case registration not the year of completion of
treatment
Cured - those patients sputum-negative after 8 months of short-course
chemotherapy
or
12
months
of
standard
chemotherapy,
treatment
* ’- Wk
1
completed = patients who complete treatment but do not have confirmation with a
sputum smear at the end of treatment, failed = patients with a positive smear after 8
months of shoe-course chemotherapy or 12 months of standard chemotherapy;
absconders = patients who do not complete treatment and are lost to follow-up. and
transferred out patients who move to another district and are assumed to be lost to
follow-up (categories chosen by the IUATLD)
Effective cure rale = cured plus treatment completed, plus 35% of absconded and
transferred out for standard chemotherapy and 65% of absconded and transfened
out for short-course chemotherapy
'I’he stable transmission pancm of tuberculosis has been
incorporated into a conservative model of the transmission impact
of an untreated case of smear-positive tuberculosis. I’he extensive
epidemiological evidence for each variable in the transmission
model comes largely from empirical studies, and will be published
in a final report of this study. Transmission benefits have been
counted for four cycles of transmission, whidi take over 18 5 years
on average. Hcnefits in terms <of deaths averted and years of life
saved have been discounted*4 “
"■ at 3%. During die four cvclcs of
transmission, each untreated smear-positive
tuberculosis case will
.....................
lead to 5 2 deaths, or 3 8 discounted deaths. Of all the deaths
attributable to a group of smear-positive cases of tuberculosis, 18%
arc due to direct mortality and 82% to mortality secondary to
transmission of the disease to others.
The benefits of chemotherapy were calculated by construction of
a life table for treated patients that was compared with a life table for
untreated smear-positive subjects. The differences in the cure rates,
death rates, and transmission rates between the untreated and
treated populations arc the benefits of the programme. Thus, we do
not count the expected 25-33% spontaneous cure rate in smearpositivc patients'7 ’8 as a benefit of treatment.
The interaction between HIV infection and tuberculosis
infection, where the probability that clinical disease will develop in
an individual infected with M tuberculosis increases from a normal of
5-10% to 35-50%, may change the stable nature of the risk of
infection in some sub-Saharan African countries.19 21 It is possible
that if a large enough percentage of the population becomes HIV
infected then the annual risk of infection may cease to decline and
could even increase. The stable transmission dynamics of
tuberculosis would then work against the community and produce a
constantly increasing risk of infection. In such a case, the
transmission model used here would underestimate the benefits of
treating infectious pulmonary tuberculosis.
4
II
■
'i
K:-?
'
■
•If]
1
I■
i
E-
i
InI
I-
ip
Bi
'H
'j
I
Results
Costs per case treated
The average, average incremental, and marginal costs per
1
<3
case diagnosed and treated with standard and short-course
- .j
chemotherapy with and without hospital admission for 2 ’
months during the intensive phase of therapy arc given in
table I. Not surprinsingly, ambulatory chemotherapy is
substantially cheaper than chemotherapy with hospital
SB
SI
j
:
■
2
|fV.. VOL 338: NOV 23, i*H
i.
THE LANCLl~r
II
1
III
It-
TABLE III
AVERAGE INCREMENTAL UNIT COSTS (USS)
Malawi
Mozambique Tanzania
Short-c°urse chemotherapy
with hospital admission
Per cure
Per direct death averted
Per total death averted
Per year of life saved
165
200
38
17
232
267
57
215
187
54
2-4
301
272
76
3-4
270
227
107
130
81
•W
20
09
101
117
23
26
202
236
47
2 1
Standard chemotherapy with
hospital admission
Per cure
Per direct death averted
Per total death avened
Per year of life saved
Ambulatory short course
chemotherapy
fe-. -
t
11 fe'
4 ■ :
..
Per cure
Per direct death avened
Per total death averted
*”25
Per year of life saved
Ambulatory standard
chemotherapy
Per cure
Per direct death averted
Per total death averted
Per year of life saved
11
68
31
•
LU'
%
28
13
B2
74
21
09
107
90
27
12
i
likely cost of ambulatory chemothefapy and the results of treatmentt are the average
results achieved in Tanzania and Mozambique
The results lor ambulatory treatment are based on the overall results of the
programmes for each country not on specific results for ambulatory chemotherapy.
and as such they are only applicatJe to those urban areas where high compliance can
ambulatory standard chemotherapy and ambulatory short-course chemotherapy are
re
not based on actual programme results, instead, costs are based on estimates of the
■ IL .. . ........ —----
1:
IL 4
J
be maintained with daily superv»r<f chemotherapy m the intensive phase
j
I . admission in the intensive phase. The differences in prices
r\rrtn
a—*
?X ? f
between the programmes
in the three countries are
largely
y
P
attributable
•
attributable to
to two
two factors:
factors: first,
first, there
there isis nearly
nearly aa fourfold
fourfold
I If
difference between Malawi and Mozambique in the price
fl E
fccdin8 ;in inpat’cm; and second, civil service
salaries in Tanzania arc considerably lower than salaries in
Malawi and Mozambique.
J
Treatment results
B
:
* .
I®'
fc--
I
■"1*
■ '2-'-
Tablc II gives results of treatment in the three countries
calculated from the latest data avaikible at the time of
writing. For Tanzania, results of standard chemotherapy arc
..... ......
presented for 1980-82 when no short-course chemotherapy
was in use. Data arc available for all patients on short -course
chemotherapy
., siince 1982. In Mozambique, many patients
still ireceive standard chemotherapy, so standard and
short-course chemotherapy
. j can be compared over similar
periods. No standard chemotherapy data are available for
Malawi because short-course chemotherapy was rapidly
adopted after 1984.
because some patients who “abscond” or “transfer out”
havc received enough treatment to be cured, costeffectiveness ratios have been calculated assuming that of
those patients who abscond or transfer out 35 % on standard
^^^erapy and 65% on short-course chemotherapy are
In Mozambique and Tanzania short-course
Chemotherapy has increased the effective cure rate by about
Well-organised standard chemotherapy programmes
be able to achieve effective cure rates of 60-65%,
M erCaS t^e s^ort-course chemotherapy programmes in
Mozambique, and Tanzania have cured 85-90%
ot patients. More importantly in terms of reducing
^ansmission of the disease, the short-course programmes
reduced the number of sputum-positive patients at the
cnd of
■1
i
I
Cost-effectiveness
--------------------------------------------------For Malawi, the estimates of standard chemotherapy with hospital admission,
r!'-
standard chemotherapy. 'Hie achievements of these
programmes are particularly impressive when aim pared
with average cure rates below 40-50% in many developing
anm tries?
In urban areas such as Dar es Salaam and Maputo,
equally high cure rates have been achieved with ambulatory
short-course chemotherapy supervised daily during the 2
month intensive phase ^patients receive chemotherapy six
times a week). The replacement of standard chemotherapy
by short-course chemotherapy increased the effective-cure
rate in Dar es Salaam by 25%. These results do not imply
that ambulatory shon-course chemotherapy programmes
can achieve excellent results in all environments. Rather, in
some urban environments with easy access to health
facilities it is possible to achieve high cure rates with
ambulatory therapy.
11
B <’5' ■■
? • gii . g*
igg
si’
•J.
I
1307
The estimates of costs for different treatment regimens
and the direct and indirect benefits from various
programmes have been combined to estimate cost per case
cured, cost per direct death averted, cost per death avened
including deaths avened due to decreased transmission over
the next IS-5 years, and cost per year of life saved (table III).
Results are adjusted for an estimated rate of false-positive
diagnosis of 5%. In Tanzania, 5-3% of positive sputum
examinations between 1982 and 1988 were classified as false
positive. A more detailed study between July and
December, 1989, used culture to ainfirm the results of
positive sputum examinations, and found that 2-6% of
smear-positive results were true false positives. Average
incremental unit aists per case cured and per death averted
are similar to figures reported previously for Tanzania,2 but
because transmission benefits arc counted for 18-5 years, die
costs per total death averted and year of life saved arc
substantially lower.
i
I
11
Discussion
In terms of costs per death averted and per year of life
saved, chemotherapy for smear-positive tuberculosis is the
cheapest health intervention available in developing
countries.22 The other highly cost-effective interventions,
including immunisation for measles and neonatal tetanus,
oral rehydration therapy for diarrhoea, and blood bank
saeening for HIV, all cost US S5-10 per year of life saved,
whereas chemotherapy for smear-positive tuberculosis costs
SI-4 per year of life saved.
Short-course chemotherapy is cheaper than standard
12-month chemotherapy per death averted and per year of
life saved for both hospital and ambulatory care except in
terms of the marginal cost of ambulatory chemotherapy.
Short-course chemotherapy is also preferable to standard
chemotherapy because the cure rate of the former is higher,
thus more people can be helped for the same expenditure per
__________________
___ to
_______
_____
death avened. There
arc further benefits
short-course
chemotherapy: compared with the standard chemotherapy
’ ’ of resistant organisms is much reduced
regimen, selection
by the combination of four potent drugs in the intensive
phase of short-course chemotherapy; furthermore, because
the effective failure rate of standard chemotherapy is much
higher than that of the short-course regimen many patients
will require expensive retreatment, and the high cost of
retreatment regimens may raise the implementation cost of
standard chemotherapy by as much as 345 per case,
11s
1•
$
Is
■
^Ui hij
Mi o
IaM •
AjLaJL^>>
oA/
i
a
-tQ.
Ia
'b h> ff/aJ^~'
^xxU^/U cfil
4
■
y\^M
A*
J
6L
&<
^^'/-
X
^jL
ig-j-
oajMM
tv
&£
p-tAits^.
ytaM
I /v J^'/Ut/-
h>
/^ah^Jb
t
Sht^LM
h
Y''cJbf'a///y..
, Stv.
tf^/- '/^
OM.
yk-dUc
lol Oi
J) 4zuz?
A^
6^^
OXS
A/j
^lyj^
R
1
t
1A
?
for "
^k^fU- ^>VU<
/^v 3T M-W^r^xAs
n-Utc
^vxJjqZa/^i
Cf\
( A
O.
(-11^^
H-T(/ -f''c
■
‘h^J^'^ek
OWf
Ismi
ll-pvil
Km
I
i
I
IMS
nn-: lancuh
;'W
.-S
VOLSkSjsOX-^. 109 j
|
Tiere feasible, ambulator)- chemotherapy is much
dcK-wion and cure rates for HIV-seronegative, smcar
'
cheaper than hospital chemotherapy. However, the key
positne
patients
amid
be
substantial.
Although
thk
question remains: when is the extra cost of hospital-based
discussion is speculative, the amclusion is clear: as lone «k 1
chemotherapy justified in order to increase the cure rate? In
HI\ -seropositive, smear-positive patients transml
1
the programmes we describe, ambulatory diemotherapy
tuberculosis at nearly die same rate as HIV-seroneeariv/ 9
can only be used in certain urban areas if cure rates are to be
smear-positive patients, short-course chemotherapy is nJ
11
maintained. Unfortunately, there arc no data on the
much more expensive for HIV-seco-posiriw patients th °
marginal increase in die cure rate due to hospital admission
tor seronegative patients.
m a rural area. Using die marginal increase in cost of
admitting to hospital a patient in Malawi, Mozambique, and
lanzania, we calculate diat if hospital admission increases
I
5X 0 *VU!d.,o acknow lc^’c
suPP«n of the Tuberculosis Unit
U orki Health Organ.sation, and the Edna McConnell Clark Founda^’
1
the cure rate by 5% it will costs S777-200S per case cured; if
lh.s study has benefited from the axnments and cni.asms of Dr
■f
axnments
and cnticxsms
ofArJ^
Dr Rich;
it increases the cure rate by 10° o it will cost S389-1004; and
Monvw. Ms Diana Cooper-Weil, Dr
Serg.o Spirted,
and Dr
if it increases the cure rate by 15% the marginal cost per case
I
cured is not much different than the average incremental
cost of curing a case with any form of chemotherapy—ie
REFERENCES
-W®
3-^9-669. If a government can decide the price it is willing
1. Six bio K. Recent advances in epidemiological
research in tuberculosis.
to pay to cure a tuberculosis patient or aven one death then
Adt TubcrcRa NS0; 20: 1-63.
^Merrax CJI
Styblo K, Rouillon A.
Ul ucvcl
we am determine the increase in the cure rate that hospital
l ubcrcuioss in developing
admission must provide to be relatively cost-effective.
and
in,crvcntlon
------ ^-urig
/ rif
It may be relatively cost-effective to treat patients who
1
'h h
HG-Annmlriskofruhrailousinfection. 3
have X-ray evidence suggestive of pulmonary tuberculosis
Cienexj. World Health Orgarusation, 1988‘ 154
but are sputum-smear-negative for mycobacteria. Treating
4
- vr;
rp ■ D?adatu s’Fox 'iV'
-s. R^wshn™ cv 1
n T/! PreValcnoe of
among dose umiiv contacts of
smear-negative patients who go on to become smeartuberculous
patients
in South India, and influence of segregation of the
posinve cuts out the pre-diagnosis transmission that cannot
Funenr on the early attack rate. Bull World Hea!:k Orga,, I960- 23■
be affected with chemotherapy for smear-positive patients.
I his pre-diagnosis transmission bonus accounts for nearly
5. Qxx-ba RW Sanden JL, Planning models for tuhwulosis control
one fifth of total transmission. If 15% of smear-negative
programs. Health Sen- Res 1971; 6: 144-4H.
—5i^an1,MkIY'AlA-Sundarcsan TKalkemnn model for
patients become smear-positive, we estimate dial die cost
ru U eakh planning. A case study of tuberculosis axinvl. Bull World
I
per death averted of treating smear-negative patients is US
Health Organ 1973; 50 (suppl): 1-110.
3IH-), and this sum is reduced to SI55 if 20% of patients
7. Kama: SR, Dawson JJY, Des-adatta S, et al. A cuntnxDcd study of the
B
become smear-positive. Although this is 3-5-8 times more
xnflucnce ol segreganon of tuberculous patients fix one year on c
the
attack rate ol tuberculous m a 5-year period in ck^ ^mi
expensive dian treating smear-positive patients, aimpared
StHitfi India. Bull World Health Organ 1966; 34; 517-32.
with many other healdi interventions it is inexpensive per
H. Rcs-elk- C. Male J. A mathematical model for detemumng case- finding
death averted or year of life saved.
,ubCTaj^s «’n«rol programs. An,
I here is a concern that treating smear-positive
Reiptr Ihs 1070; 102: 403-11.
9. I uberculosis Chemotherapy Ccnirc, Madras. A currm: comparison of
pulmonary tuberculosis patients who are also HIVseropositive is not cost-effective. The a>st-effectiveness.of
X
°f pulnH’n;ir>- tuberculosis in South
India Bull World Health Organ 1959, 21: 44-51.
chemotherapy for HIV-seropositive patients with smear10. Vane/ A. Valenzuela P. Tratamicnto abrouido de b tuberculosis una
posnivc tuberculosis depends on the survival of patients
ai gnindC' aiHhdCTHealth Organ 1982; 92:
after treatment and the indirect benefits of treatment. It is
H<B.
t
mum
UN.
C
om
M
vtngs
from
altcnunve
treatments
for tuberculosis.
_
unlikely that die direct benefits in terms of years of life saved
•S<v -Sa .Med 1986; 2.3: 847-50.
will be substantial given die natural history of HIV infection
_Xhx>ocf MR Remington PL. Tjiptohcngmto P. Epidemical model
O
in developing countries. In terms of direct benefits only,
and cint-cffccuven^ analysis of tuberculosis treatment programmes
treating HIV-seropositive patients must be at least 10 times
in Indonesia. Int J Efhdcnuol 1989; IS: 174-79
11
S’ ^>bl" K- Dt’rkcn E- Tubowkni, in Edumos. Tuberck
«
more expensive than treating seronegative patients.
19'6. 57 suppl): 1-58.
However, HIV-seropositive, smear-positive patients will
14. Barnum H. Evaluating holthy day, of life gained from heUth projects. 39
also transmit the disease. Whether they live long enough, or
■Soc Sa Med 1987; 24:833-41.
have the same pattern of human contacts, to allow
15
MUrray CJL- A Critical ^-^ination of the economics of
transmission of as much disease as an untreated HIVblindness prevention under the Onchocerciasis Control Programme.
C#
S<x:Sa Med 1987;25:241-49.
|
seronegative, smear-positive patients remains unknown. If
16. Prost A. Prescott N. <^t.rfIect,v™w of blindness prevention by the
HIV-seropositive, smear-positive patients do transmit as
of blindness proxneion by the
Onchocerciasis Control Programme in Upper Volta. Bud World Health
<.^1
much tuberculosis as HIV-seronegative patients then
Organ 198.1; 62: 795-802.
short-course chemotherapy shoyld be cost-effective. As
17. National Tuberculosis Institute, Bangalore. Tuberculous in
----------------- - a rural
discussed above, over 18 5 years more than 80% of the
population of India: a f
„ _ epidemiological stud}. Bull World \
five-year
Health
Organ
1974;
51:
473-88.
benefits of chemotherapy arc due to reduced transmission.
18. Olakowskj T. Assignment report on a tuberculosis longmximal survey,
Even if there are no direct benefits, treating HIVrA;
i atjonal I uberculosis Institute, Bangalore. New Dchli: World Health ’
seropositive patients would be only 25% more expensive per
Organisation, Regional Office for South East Asia, 1975.
year of life saved than treating seronegative patients.
19. Elliott AM, Luo N, Tcmbo G, ct al. Impact of HIV on tuberculosis in
.'S
There arc other cost and organisational reasons for
Zambia, a cross sectional study. Br Med J 1990; 301- 41'>-15
20. Gtiebuntfcrs R. Ryder R, Nzilttntbi N, tx al. HIV infection in patients
treating HIV-seropositive patients. Screening all patients so
with tuberculosis in Kinshasa, Zaire. Am Rev Respir Du 1989; 139:
as to exclude seropositive patients from treatment would be
1082-85.
21. Chaisson R£, Scheaer GF, Thcuer CP, Rutherford GW, Echenbcrg - ' 3
expensive. More importantly, patient confidence in the
tuberculosis treatment programme would in all likelihood
1 E, Hopcu-cll PC. 1 uberculosis in patients with the acquired
immunodeficiency syndrome. Am Rev Respir Dis 1987; 136: 57(3-74.
be severely eroded if some patients were excluded from
22. Jam,™ DT. Mosley WH, editors. Evolving health sector priorities in M
&
treatment on the basis of a test result. The impact on the
■
<1
. r-';
n^ii
'I,!W
IM
I
■
I111
fi
lii
IS
11
^•1
Hk
developing countnes. Washington DQ World Bank, 1991.
wf
I .• L4J
‘I
£
r
I
a/d^ (J^-
rs
-f"
'/'4^t/l'v^-
^-t^pt I
(j)
Ikg/itftQ
I
^»*1 (>HZ6k/(7l*|
(_ j/J
S4/U-
G
<C A^n/^ 6^44x
w
lA.
Ck^y^)
<SAj2^tZ
CtTVM/-
Qt’J
'~^( ----
J^-y
('d/Lt (LtCC/fi&^
7g
dJAJih*
^3-
PicJcAlk-
0 Ffx-^
i. .
6R)h
fijceJ
Ceo^
Jt^ri f«
/
du^u
u
T(^
o^
y
\/aA) ^U^-
Jlc
7
g /ld--vxtj/V<JL_
xA?
p Tft
^c-
/
veA^'A
ckj L0U
(^)
e
(U^
Uot-
Z^iAk/
PLc
<^>V
Ccr^utX
j
f
/V^A/
OAJL
*T
fA<CX-kVf V"
pbo
(jM
/)v
^/tCdJ^ ’
I
G^
f*.
rJo
? euI
)
^0
1 p/ITJF/'J?^
. <■«*•
t
ft
Draft for Final Report.
PUBLIC HEALTH.
Dr. T Jacob John
COMMUNICABLE DISEASES
A. Situation analysis.
l.The degree of success of prevention and control of communicable diseases in a
community or a country is a measure of the effectiveness and efficiency of the public health
system in that setting. It is widely known that India’s successes in the prevention and control of
communicable diseases in general, and outbreaks of such diseases in particular, have been very
limited. Therefore, it is clear that our public health system is currently inadequate to face the
challenges of communicable diseases and it needs qualitative and quantitative strengthening.
2. The term communicable disease is used in this document synonymous with the term
infectious disease (ID). In as mush as the causes of IDs are infection by extraneous agents, it
should be relatively easy to interrupt the chains of their transmission, or to eliminate the media
of their multiplication in humans or in our environment including water, food, animals or
insects.
Another practical intervention, in the case of certain specific IDs, is the use of
vaccines in a tactical manner. Our continued heavy burdens of morbidity and mortality due to
IDs is not because of a lack of public health expertise or intervention tools and modalities, but
due to our apparent inability to apply them suitably in the field. The fundamental causes of this
gap between knowledge and technology on the one side, and their effective and efficient use on
the other, must be diagnosed and remedied, if we are to succeed in our system of public health.
3. It is pertinent to examine and learn from our past successes in this field. In mid1970’s India was able to eradicate smallpox. In late 1990’s we eliminated Guinea worm
infection (Dracunculiasis).
By 2001 we hope to eliminate wild poliovirus infection as the
essential step towards certification of elimination of polio. In each of these cases, 3 lessons
stand out. One, the goal was set from outside, either from the WHO or from other international
agencies. Two, the expertise for the interventions needed for success was also mainly from
outside experts. Three, high quality surveillance for each specific illness had to be established
for guiding the interventions and for assessing their successes. The Task Force recommends
that Karnataka State sets its own goals for the prevention and control of communicable
diseases, uses the considerable expertise already available in the State to the fullest extent and
I
<l^^
establishes a comprehensive disease surveillance system to guide interventions and to measure
their progress and success. Section ‘g’ will address disease surveillance.
4. It is equally important for us to learn from our failures also. Tuberculosis control has
been a major public health project for several decades. However, success has eluded us. In
1998, in Karnataka, a target of 782,172 was set as the number of sputum smears to be
examined for diagnosing an estimated number of 70,284 new cases of open pulmonary
tuberculosis (TB). The achievement was only 236,175 (30%) smears examined, but
surprisingly 55,557 cases were detected. This amounted to 79% of the expected number of
cases. It is very likely that three times as many more cases might have been diagnosed if the
target for smear examination had been met.
5. The National Malaria Eradication Programme of the 1950’s had met with
phenomenal success. Unfortunately, the design had been flawed and malaria made a come back
in late 1960’s. By then the vector mosquitoes had developed resistance to insecticides.
Whereas malaria had been confined to rural communities previously, the resurgent malaria is
both urban and rural. Earlier, malaria parasites had been fully sensitive to antimalarial drugs,
but now falciparum parasites are increasingly becoming resistant to chloroquine and other
newer drugs as well. Resistance has appeared even among vivax parasites. As malariologists
realized that malaria could not be eradicated, the programme was renamed as National Malaria
Control Programme. In the 1990’s even control was felt to be unattainable and the name has
been changed to National Anti-malaria Programme. In 1997, in Karnataka, 7,304,866 fever
cases were investigated with blood smear microscopy in various rural health care institutions
and 161,775 cases of malaria were detected. In addition, in 8 urban populations 103,671 cases
of fever were investigated and 12,548 more cases were detected. The number of falciparum
cases was 40,295. In 1998 there were 107,910 rural and 7521 urban cases diagnosed with
positive smear examination. Malaria is not under control, in spite of five decades of prioritized
action against it.
6. Other mosquito-borne IDs in Karnataka include Japanese encephalitis (JE), dengue
fever (DF) and dengue haemorrhagic fever and shock syndrome (DHF/DSS), West Nile (WN)
virus encephalitis, and lymphatic filariasis. During 1999, JE outbreaks were confirmed with
virological investigations in the districts of Bellary, Raichur and Kolar. JE has been known to
occur periodically in the districts of Bangalore Urban and Rural, Chitradurga, Mandya and
Koppal. In 1997 there was a large outbreak of DF, DHF and DSS in the districts of Bangalore
2
Urban and Rural, and Kolar. The virological investigations were conducted in the Field Station
Laboratory of the National Institute of Virology, Pune, Maharashtra, under the Indian Council
of Medical Research. The State public health system does not have a diagnostic facility for
outbreak investigations. There is neither programme nor plan for the control of these diseases.
The geographic spread, or magnitude, of WN virus infection, or encephalitis, remains
unexplored. Kyasanur Forest disease is unique to Karnataka, and prevalent in Shimoga, Uttara
Kannada, Dakshina Kannada and Chikmagalur. Infection is transmitted by the bite of ticks.
Fortunately, a killed virus vaccine is made in Karnataka itself.
7. Karnataka has endemic cholera, with annual seasonal outbreaks around the
monsoons. The government has established ‘cholera combat teams’ in the worst affected
districts of Bijapur, Gulbarga, Chitradurga, Bellary amd Mysore. In 1998, 503 instances of
death due to cholera or acute gastroenteritis were documented in the government health care
network. Typhoid fever is rampant very widely. Viral hepatitis (due to faeco-orally transmitted
viruses A and E) is also common in the State. Karnataka has a high prevalence of cerebral
cysticercosis, including in vegetarians, and it is suspected that infection is transmitted faecoorally. Thus, the environmental sanitation, personal hygiene, safety of water and food and the
level of public perception of these issues leave much to be desired.
8. Sexually transmitted IDs and other reproductive tract IDs had received little attention
from public health system, until HIV/AIDS emerged as a serious problem in India in general
and in Karnataka in particular. It has been estimated by the National A TPS Control
Organisation, that in Karnataka, over 1% of all adults (above 18 years) are already infected
with HIV. As HIV disease is characterized by secondary IDs, diseases like Pneumocystis
pneumonia. Cytomegalovirus retinitis, cerebral toxoplasmosis, cryptosporidial diarrhoea,
cryptococcal meningitis and many others are increasingly frequently being diagnosed in
teaching hospitals and in institutions with appropriate diagnostic facilities.
9. There are a number of other problems of IDs, but they do not get the attention of the
public health system. Karnataka has all the ubiquitous IDs, such as the common bacterial
(Pneumococcal, Staphylococcal, Streptococcal, Haemophilus) and viral (Respiratory Syncytial,
Herpes, hepatitis B, C). The frequency of bacterial meningitis, leptospirosis, brucellosis,
rickettsial fever, melioidosis, and human anthrax remain under-estimated. Acute rheumatic
fever and chronic rheumatic heart disease continue to cause disability and premature death.
3
10. The extent, pattern and nature of hospital-acquired IDs remain largely unexplored.
They must be investigated and preventive measures instituted in every hospital. Similarly,
antimicrobial resistance is becoming common among several bacterial pathogens and public
health action is needed to monitor and check this serious problem in hospitals and in the
community.
11. Statistics on Rabies in Karnataka are unreliable. Everyone knows that the disease is
uniformly fatal. Yet, in 1990, in the Statel345 cases with only 40 deaths were reported. In
1993, only 34 deaths were reported among 1424 cases of rabies. In 1990, in the Bangalore
Epidemic Diseases Hospital alone, 65 patients had died of rabies. Post-animal-bite rabies
immunization is given in at least 4 major Government Hospitals in Bangalore. In the Jayanagar
General Hospital, the annual number of persons so treated is about 3000. The major workload
of the Vaccine Institute at Belgaum is to produce sheep brain Semple antirabies vaccine
(ARV). During April-December of 1998, the Institute produced 1617 litres of ARV. The
annual expenditure of the Institute is over 6.2 million (62 lakhs) Rupees. Rabies is eminently
preventable, provided there is administrative coordination between several agencies. The
financial loss due to the lack of rabies control, in terms of human and animal lives and in terms
of expenses for the vaccine, are truly enormous.
12. Anthrax is another disease, which cuts across human and animal health. There is
anecdotal information of it being a not-so-uncommon problem. This disease, as well as rabies.
Brucellosis and Leptospirosis highlight the need and opportunity for cooperation and
collaboration between the Governmental wings entrusted with human health, animal health and
agriculture.
Remedial Measures
1. There are some root causes for this unsatisfactory state of affairs in Karnataka, and
indeed in our country at large. With rising population and population density even in rural
communities, and increasing urbanization and urban migration, and with industrialization and
also intensive agriculture, there has been deterioration of the environment, but without
commensurate increase in public health expenditure for sanitation and hygiene There is
an urgent need to develop a broad based assessment mechanism to quantify the public
health needs of the State and to prepare a need-based budget for public health (Note
This point needs a bit more professional touch)
4
2. The second half of the 20th century saw some spectacular successes in the combat
against IDs, including diagnostics, antimicrobials, insecticides and vaccines. Consequently,
public health was undervalued and health care was given greater importance. It was thought
that IDs could be treated and prevention was unimportant. Having realized this error, now
we must give prominence to public health in teaching and in implementation. Public
health expertise must be rebuilt.
3.Even though health care and public health are two major components for enabling and
ensuring the health of the people, these two are combined administratively into one
Department of Health, separating it from the department of Family Welfare. The Department
of Health gives prime importance to health care, but public health is not given its due
importance. The Department of Family Welfare fulfills some public health functions but is
not equipped to provide it in full measure. The task Force recommends that the State
Government explore the possibility of restructuring the Ministry to include two
departments, one on Health Care and the other on Public Health.
4.Public health has broader dimensions than what could be built into the Ministry of
Health alone. For example, education is a critical element in maintaining the health of the
people. A recent survey by the ICMR showed that immunization coverage of children
correlated well with the educational level of the mother.
Immunization status (coverage %)
Literacy of the mother
Fully
Partially
None
Illiterate
46.4
33.4
20.2
Primary education
64.9
29.6
5.5
Middle school
70.4
25.9
3.7
Higher secondary
78.8
19.6
1.6
Graduate
84.3
15.2
0.5
It is obvious from the above data that education is in itself a major component of true
public health, although traditionally not so perceived. The Task Force recommends that the
State Government take prompt action to ensure that the female (and male) literacy rate is
increased to as high a level possible in as short a period as possible. This one intervention
6*
will have multiple benefits, not only in reduction in morbidity and mortality, but also in
improving the socio-economic standards of the people, which will further enhance the health
status of the people.
5.The supply of safe water and maintaining a pollution-free environment are not the
functions of the Ministry of Health, even if it included a Department of Public Health. It is for
the Government to ensure that these functions are fulfilled through the concerned
departments or wings of the Government.
On the other hand, the Public Health
Department has the moral and technical responsibility to prescribe norms of safety of
water, food and the environment, and also to monitor the maintenance of these norms.
The public health role of the Ministry of Health, as far as vector control is concerned, is
again to prescribe norms of allowed vector densities, both of larvae in environmental
waters and of adults in human habitats, and to monitor the actual densities in all
communities, regularly, and to alert the local administration, if any limits are exceeded.
The actual control measures are to be undertaken by the local administration. The Public
Health system shall provide the necessary technical expertise and guidance for control
measures.
6. This clear definition of the functions of the various wings of the Government, in the
practice of public health, is essential if Karnataka is to succeed in areas where the nation as a
whole had failed for such a long time. Another area in which the monitoring function of the
Public Health system is essential is in the use of insecticides by the local administration
and by the Agriculture Department. At the present time, insecticide spray or even fogging is
undertaken without adequate rationale and without safety checks and controls. Indeed
Karnataka has the opportunity to provide a model for the rest of the country, in establishing a
viable and vibrant public health system.
7 A close look at the real life situation makes it clear that almost all of the ingredients
of public health mentioned above have been created through the vision of our administrative
and political leadership of the yesteryears. What is wrong with the system, is that these
functions are seen by the functionaries as independent activities, essentially as following the
orders or the established procedures, without coordination or evaluation. With this assessment,
it is clear to the Task Force that resources, human, material and financial, are being utilized but
without achieving the desired results. Efficiency, defined as the desired outcome for the efforts
(and expense) put in, is what is missing. The Task Force recommends that a complete
6
inventory is taken, of the various inputs of the Government, through health programmes
both vertical and otherwise, funded by the Government itself or by extramural agencies
(be it the Union Government or foreign and international agencies) and they be
channeled through a unified system of commands and operation, dividing them into
Health Care and Public Health. In all likelihood, the enhanced funding recommended in the
first paragraph may indeed be minimal and what the State Government itself could afford.
8. As far as public health is concerned, in the context of IDs, the two foundation
sciences are epidemiology and microbiology. The State must develop a time-bound plan to
establish these two disciplines within the Department of Health. Modem epidemiology is a
powerful tool to investigate the transmission pathways of IDs, in order to design and
implement interventions to interrupt transmission. Modem microbiology is essential to make
accurate aetiologic diagnosis, for assisting epidemiology and interventions. The State must
plan to establish a training facility for epidemiology. Persons already in service, and new
recruits interested in a career in epidemiology, should have access to such training facility.
More advanced training may be obtained where such facility exists now, but it may be feasible
for such advanced training facility also to be created in the State. By 2005, there should be
one trained epidemiologist in each district and a cadre of senior epidemiologists at the
State level.
9. Similarly, by 2005, there should be a diagnostic microbiology laboratory at the
district level, and the State Public Health Institute should be strengthened to function as
the State level supervisory and reference laboratory to support the district laboratories
The district laboratory should function as diagnostic laboratory for health care at the district
hospital, and also as the public health laboratory for the district. The Microbiology laboratory
must be headed by a specialist, ideally an MD in Microbiology. The district diagnostic
laboratory will require additional expertise, such as those in clinical biochemistry and clinical
and tissue pathology, each headed by trained and competent personnel, holding MD degree or
equivalent.
10. It is clear from the above, that public health may be broadly divided into those
activities (which are essentially outside the executing responsibility of the Health Ministry)
which will keep the environment safe from the potential of transmission of pathogens, and
those directly under the purview of the Health Department. The latter activities are essentially
those designed to be specific for various pathogens, and are closely linked to the epidemiology
7
of IDs. They include such vertical programmes like TB control, anti-malaria, leprosy control,
filariasis control etc. It is strongly recommended that these vertical programmes be
integrated under a common management at the State level leadership and similarly
integrated at the District level and even below
11. It is pertinent to highlight the need for integration, for efficiency and effectiveness,
in the control of vector-borne IDs. The public health approach for the control of malaria,
filariasis, dengue, Japanese encephalitis and West Nile virus infection, should be
integrated at the common grounds of the control of vector breeding, prevention of
human-mosquito contact, reduction of animal-mosquito contact, and maintenance of
below threshold levels of adult mosquitoes in habitats When any of these diseases breakout
as outbreak, then there should be a rapid epidemiological and entomological assessment of the
vector densities by location, and the identities of vectors and their susceptibilities to various
insecticides and only after these are fulfilled should there be the fogging or spraying of
insecticides.
12 * In our conversations with a number of involved persons, we have come to the
conclusion that different levels of personnel, teachers of Medicine, those in the NGO sector,
TB control personnel and other sections of the health care team do not have a uniform picture
of the procedures and processes needed for TB control. There is no uniformity in diagnostic
methodology or criteria. It is very clear to us, that the current processes of TB control need a
clearer vision and better management, both technical and administrative. The Task Force
recommends that the relevant issues be thrashed out in a workshop, in order to stipulate
the commonly agreed procedures of diagnosis, reporting, treatment and teaching.
Attention should be paid to extra-pulmonary TB, childhood TB, and appropriate
epidemiological investigations of every diagnosed case of TB, in adult or child. The
tuberculin test must be assessed as a tool in this process, and if found useful, its
methodology must be clearly defined.
13. The State has not invested adequately in, or reaped the benefits thereof, of the
strategic use of vaccines and immunization. Childhood immunization will be dealt with, in
detail, under the section on Child Health It is recommended that the State establishes a
Committee for advising the Government on immunization policies and practices. In the
opinion of the Task Force, it would appear humane and cost-effective to abandon the use of
sheep brain rabies vaccine in favour of safe and purified modem rabies vaccines as well as to
3
introduce universal immunization against hepatitis B virus infection in order to reduce the virus
carrier pool and to prevent cirrhosis and cancer of the liver in adults.
14. The school setting offers an opportunity for introducing several elements of public
health. In the context of IDs, it is an opportunity for pilot testing the feasibility and usefulness
of periodic one-dose de-worming in vulnerable groups of children. It is also an opportunity to
catch up on adolescent immunistions such as those against tetanus and typhoid fever. The Task
Force recommends that the school health programme be made efficient, goal-oriented
and systematic. Needless to add that the opportunity must be seized for health education, to
be included in school curriculum, and to provide sanitary toilet facilities and safe drinking
water.
15. Modem hospital setting is a breeding ground of nosocomial pathogens. The Task
Force recommends that a mechanism be evolved for monitoring hospital acquired
infections and to stipulate remedial measures.
-v
16. Antimicrobial resistance is a major problem, be it in typhoid fever, TB, malaria or
nosocomial infections. It is recommended that a mechanism, similar to the one m
nososcomial infections, be established to constantly collect, collate and review avaiaWe
data on antimicrobial resistance and to issue guidelines for the proper and rational use of
antimicrobials.
*
■piS-S'
nnW:
’/ s'**?
9
ifi
@ r
I ■-
ISli
A
lli
One third of the world's
population is infected
with the tuberculosis bacilli.
Every year, 8 million of
those infected develop
tuberculosis,
and every year between
2 to 3 million people die of
Tuberculosis patients,
their families and communities
join with NGOs to demand
this curable
disease.
TUBERCULOSIS TREATMENT THAT IS
FREE
ADEQUATE
AND UNINTERRUPTED
w
ACCESSIBLE
A-
s
ADMINISTERED) RY TRAINED
HEALTH WORKERS
s
To Governments,
Q>
C
(5
o
Q.
E
£
£
0
o
K<.
R
£
£a
<3
to the United Nations
and to development agencies
the world over,
we say here with a concerted voice:
“You have the power to stop the tuberculosis epidemic...
You must act now!”
Archbishop Desmond Tutu,
30"' World Conference on Lung Health Madrid. Spain, September 1999
I agree with this declaration
SIGNATURE
Name :
Organisation :
Address :
E-mail :
Fax:
Please send or fax this declaration to : The Karnataka Tuberculosis Association
# 3, Union Street, Infantry Road Cross, Bangalore 560001 KARNATAKA, INDIA
This campaign is organised by the International Union Against Tuberculoisis and Lung Disease
For more information, visit the website: www.iuatld.org
IS
/ O tf
yi 5 ■ s~.
Tl BERCl LOS1S.
The TB control Programmes Success failures and progress.
Tuberculosis control has been a major public health project for several decades. Soon after
independence. India launched the national BCG inoculation programme, in the hope that BCG
would protect from infection as well as from latent infection progressing to bacillary pulmonary
TB, which is the source of infection to fresh naive individuals, most often children and Youth.
Soon thereafter, a study was established under the 1CMR_ to investigate the protective effect of
BCG. This study, conducted in chingleput, Tamil Nadu, showed that the assumption that BCG
would offer protection from infection or from disease progression was incorrect. BCG has no
role in the public health intervention against TB
•
•
•
•
o
•
•
•
•
Inadequate budgets.
Lack of coverage in some pans of the country
Storage of essential drugs.
Varying standards of care in various centers
Poor administration or Lack of direct observation of the treatment.
Unmotivated and unevenly trained staff'
Poor quality sputum microscopy.
Focus on case detection without accompanying emphasis on treatment outcomes.
Lack of political commitment / Lack of Accountability & monitoring.
Consequently, the Government of India designed a revised TB Control strategy, in 1993.
This Strategy’ was pilot tested in a population of 2 35 million and was extended to cover 13.85
million, in 13 states. In these areas the diagnostic practice improved and cure rates more than
doubied. Based on this experience, the Revised National TB Control Programme (RNTCP) was
formally launched in India on March 26. 1997, with the plan to increase the area under coverage
in a phased manner. This was supported by a soft loan ( USD 142.4 million ) from the World
Bank, with a target to cover 102 districts with 271.2 million The goal of RNTCP is to detect at
least 70% of sputum positive pulmonary TB cased and to cure at least 85% of them. Treatment
is by the directly observed therapy, short course ( DOTS )
The situation in Karnataka
In Karnataka, RNTCP was established in 2 districts in 1997 and extended to
seven in 1999. ( This is to be verified ) In the rest of the Districts the NTP is under
operation. In 1998, in Karnataka, a target of 782.172 was set as the number of
sputum smears to be examined for diagnosing an estimated number of 70.284 new
cases of open pulmonary TB. The achievement was only 236.175 ( 30% ) smears
examined, but surprisingly 55,557 cases were detected. This amounted to 79% of
the expected number of cases. It is very likely that three times as many cases
1
might have been detected if the target for sputum smear examination had been
met.
The south East Asia Office of the WHO has published a monograph on TB in
India, in 2000 ( Research for Action. Understanding and Controlling Tuberculosis
in India, World Health organisation. Regional Office for South East Asia Region,
New Delhi, 2000). The situation in India in general and in Karnataka in particular
is not verj' satisfactory. The health-seeking behavior of "chest symptomatic" is
very interesting and illustrative. The vast majority of patients with chronic cough
seek care quite promptly, as shown in the table below
Table.
The proportion of chest symptomatic seeking care in public or prix ate facilities.
Private provider
Government facility
Other____________
Total taking action
| Not Yet taking action
M ysore________
Rural % _______ Urban %
48
__________ 76
99
51
1
9
83
17
85
15
Raichur
Urban %
Rural %
74
93
25
5
2
1
90 ~
85
15
10
Unqualified rural practitioners are first points of contact for most rural patients. Many
patients, rural pr urban, spend a great deal of time and money "shopping for health" before they
begin treatment. Very often, do not receive either accurate diagnosis or effective treatment,
despite spending considerable resources
The burden of TB and problems of its control in India,
The WHO has estimated that the annual gross economic loss for India, on account of TB
is about 13.000 crores of rupees. In addition. TB patients spend, from their own resources, 645
crores of rupees, annually. Some 300,000 children lose both parents due to TB, and become
orphans, annually. The Situation is rapidly deteriorating, on account of the increasing
prevalence of HIX’ infection and AIDS. To cite one representative study from a public hospital
in Mumbai, the frequency of HIV infection in-patients with TB rose from 2% in 1988 to 16% in
1998. TB has been found to be most common major secondaiy disease in symptomatic HIV
disease (otherwise. AIDS). The widespread use of anti TB drugs in an inefficient manner, the
continued transmission of infection from partially treated patients and the combination of HIV
and TB are all factors that might contribute to the emergence of drug resistance in TB, making
the future control of TB even more problematic
2
India has an estimated 1.799.000 cases of TB. an incidence of 187 new cases per 100.000
population per and 805,000 new total annual case burden Yet, in 1997, only 7,708 cases were
under DOTS. We get an idea of the magnitude of our failure when we compare this last figure
with 147,905 under DOTS in China, 19,492 in Indonesia. 25,871 in Bangladesh and 15,753 in
Ethiyopia. 1500 TB patients died every day due to lack of treatment, lack of political
commitment
The fault lies with the medical establishment, the lack of health education and the overall
leadership of TB control neither disciplined nor efficient. The following paragraphs are
quotations from the WHO SEARO publication, 2000.
U‘A11 too often, health providers fail to diagnose the disease correctly, they’re by delaying
the start of treatment and perpetuating in the community. Many providers do not confirm their
diagnosis of pulmonary TB by sputum examination realising instead on just radiograph and thus
often incorrectly diagnosing patients to have TB. In one study in Bombay only 39% of doctors
used sputum examination to confirm the diagnosis in TB studies in Karnataka, Delhi and Tamil
Nadu relieved that, even after the multiple visits less than one third of patients had undergone
even a single sputum examination, despite spending 1-6 months of their income In rural areas
lack of effective diagnosis and treatment was even more pronounced"
“Even when TB is diagnose by private practitioners, prescribing practices vary widely.
A study of 100 private doctors in Bombay found that there were 80 different regiments most of,
which were either appropriate, expensive, or both in a similar survey in Pune 113 doctors
prescribed 90 deferent regiments ( Uplekar and Shepard. Tubercle 1991; 72: 284 ) private
doctors seldom felt that it was their duty to educate the patient about TB and never made
attempts contact or trace patient who had interrupt treatment ( Khari. Indian J Tube 1999 ;
46:157 ) Virtually no individual patients records are maintained by private practitioners/'
” In one recent study, researchers interviewed several hundred patients and their families
and found that most patients felt uncomfortable talking about TB, several patients denied that
they were suffering from the disease are taking treatment for it. and some even refused to
mention TB by the name. Patient frequently attempted to hide their disease from their family
and community by registering under false names at TB clinics are by *denying their identity
when confirmed to their interviewers."
’’Estimates in India indicate that of every 100 infected TB cases in the community, about
30 are identified in public sector, of which at most 10 are cured. Similarly about 30 are
identified in the private sector, of which at most 10 are cured Hence not more than 20%of
patients who developed TB in Karnataka in each year are cured many of the remaining patients
remain chronically ill are die slowly from the disease, infecting others with strains ( of TB
Bacilli ) which may have developed drug resistance ”
3
What needs to be done in Karnataka to control TB 9
( To be written )
1. Shift the responsibility to cure from the patient to the health system.
2. Tuberculosis diagnosis based mainly on three sputum examinations by microscope.
3. Assurance to the patient regarding regular supply of good quality Anti TB drugs.
4. Trained volunteer administers TB medicines to TB patient under direct observation.
5. A systematic monitoring and accountabilities.
6. The above strategy has to be followed in a phased manner to achieve good success rate in
Karnataka.
4
7»S'S’TUBERCULOSIS COKTROL PROGRAMME
1.0
XETRODUCTIOH
Tuberculosis is known to man from ancient times and
continues to be a major public health problem.
The disease
affects primarily people in their most productive years of life
and is commonly associated with poverty, overcrowding and
malnutrition.
Lack of education, environmental pollution and
poor sanitation compound the problem.
The condition of relative
deprivation among economically weaker sections of the society and
the high tuberculosis case rates in then seem to form a vicious
cycle, one aggravating the other.
2.0
PROBLEM
2.1
Wor
The magnitude of the Tuberculosis problem is simply
staggering. The annual occurrence of new cases of all forms of
Tuberculosis is about 8 million, the greatest burden of incidence
and mortality is concentrated in adults age 15-59 yrs. Estimates
suggest that 3 million people die from Tuberculosis each year,
which is probably more than from any other disease. Considering
all this the WHO, for the first time, declared Tuberculosis as a
Globa] Emergency in 1993.
2.2
India
It is estimated that there are about 12-1< million TB
m trie country of which about 3 million cases are highly
infectious and sputum positive.
Every year nearly 2-2.5 million
new TB cases occur in the country and it is estimated that about
5 lakhs die due to the disease. The problem is equally prevalent
in rural and urban areas.
Annually about 1.5 million cases have been reported under
the programme.
It is estimated that an equal number are treated
by NGOs « Private Practitioners.
The experts opine that the epidemiological situation will
deteriorate with the spread of HIV as it has happened in other
countries.
Around 60$ of the AIDS cases reported in India have
evidence of active Tuberculosis.
TB - HIV coinfection increases
the risk of turning latent TB infection (by 7-10 times) into TB
cases with high fatality.
3.0
PROGRAMME
The National T.B. Control Programme has been in operation
since 1962 and aims at reducing morbidity, mortality and
transmission of the disease.
3.1
Qbj ectives
i)
To detect as large a number of TB patients as possible and
treat them effectively;
■'ubiic Policy DivtefOfl
Voluntary Health Association of India
40, Institutional Area, South of H I
New Delhi - 110 016
1
i i )
iii)
iv)
v)
district of the
To establish District TH Centres in every
country;
in all districts;
To extend Short Courses Chemotherapy
State TB Training and
To strengthen the existing
Demonstration Centers;
activities under the
To augment health educat ion
programme.
X.
Strategy
3.2
functions as a nodal centre and is
The District TB Centre
of district
district T.B.
T.B. programme
programme in the
responsible for
a ^^onnel are trained at NTI, Bangalore
Its key J
personnel
entire distri
iagnosis, treatment organization and
in X-Ray and
of Tuberculosis.
community <control
----
Diagnosis of patients is through sputum testing and chest
3 are given short course
x-.ray.
The sputum positive cases
months and sputum negative
chemotherapy for a duration of 6-9 u.
cases are treated with conventional anti-TB drugs for 12-18
months.
CURRENT STATUS
4.0
is being implemented
At oresent, district T.B. programme
--n chemotherapy has been made
Most of DTCs have been fullv
At all
equipped with X-ray units, and laboratory equipments,.
-medical personnel duly
such centres a team of medical and para --trained at NTI, Banglore is available.
• • —» are about another 330 TB Clinics
4.2
In addition there
and cities.
'which provide TB Control
c---------- services for big towns
47r600 beds are available for
4.3
A total of about
hospitalisation of emergency and operative cases.
A 1
Demonstration and Training Centres
4.4
There are 17 State TB
e for supervision, coordination and
providing training and guidanctechnical assessment of the programme in the respective States.
ACHIEVEMENTS
5.0
--------- 1 in the 20
With
With tne
the inclusion of Tuberculosis Programme
the expansion of
Short Course
containing highly potent drugs
Chemotherapy (SCO drug regimens
introduced in the programme since 1983 and
so ^253
have been :-----Xt
is
proposed
to
introduce
tne
It is proposed
districts are providing
in all the districts of the country in a phased manner.
regimens
5 1
5 2
5-2
•
As the programme is integrated with general heal_^2
also beina made for distributing anti 1B
"^-centres so that the tre.l.e.t facilities are
available closer to the patient.
2
The Mortality Rate has decreased from 80 / 100,000
population in 1970 to 53 / 100,000 population in 1993.
Further
the severer forms of childhood tuberculosis is on the decline and
extensive exudative lesions are less frequently seen.
BUDGET
6.0
The programme is run on 50:50 sharing basis between the
Centre and States for drugs and logistics while the Union
1001 assistance for the
Territories and the NGOs are provided
i
NTCP in preceeding 3
same.
The budgetary allocation to the
years is as follows:
(Figure in lakhs)
Year
1992- 93
1993- 94
1994- 95
1995- 96
7.0
Budgetary Provision
2900.00
3750.00
4600.00
5000.00
ISSUES
7.1
Over the years the programme has been continuosly
reviewed.
It
monitored and
and reviewed.
It is observed that the cure of
patients, which is the prime aim of management, has not received
—.
The Budgetary Allocation under
enough priority under the NTP.
been------inadequate to meet thp cost of 311 the
the programme 1has
-- ----cases detected.
* ' • treatment completion races
rates are
The case-finding and' the
7.2
less
than
40*.
Though
the
incidence
and
prevalence
rates
both
same
over
the
last
3
decades
but
the
total
<1
-----have remained the
number of cases have increased due to increasing population.
7.3
Impending threat of HIV-TB co-infectioni and the emergence
of drug resistant tuberculosis which may further worsen the TB
situation.
8.0
REVIEW
To address the above issues a nation-wide review was
conducted in 1992 by Government of India with assistance from WHO
& SIDA. Their salient findings were:i)
ii)
iii)
iv)
v)
vi)
vi i)
less than 30* treatment completion.
inadequate budgetary outlay and shortage of drugs,
undue emphasis on x—ray diagnosis.
poor quality of sputum microscopy.
emphasis on case detection rather than cure.
poor organisational set up and support for TB.
multiplicity of treatment regimens.
Based on the findings and recommendations of the review a
Revised Strategy for Tuberculosis Control has been evolved.
3
X
«.0
REVISED STRATEGY OF NTP
9. 1
The objectives of the Revised Strategy of NTP are:
i)
emphasis on the cure of infectious and seriously ill
patients of tuberculosis, through administration of
supervised Short Course Chemotherapy, to achieve a cure
rate of atleast 85%.
ii)
augmentation of the case finding activities to detect
70$ of estimated cases.
Current Strategy
9.2
i)
Increase budgetary outlay.
ii)
use of sputum testing as the primary
diagnosis among self reporting patients.
iii)
standardise treatment regimens.
iv)
augmentation of the peripheral level supervision
creation of a sub-district supervisory
through the
unit.
v)
ensuring a regular, uninterrupted supply of drugs upto
the most peripheral level.
vi)
augmentation of organizational support at central
state levels for mcaningiul coordination.
vii)
emphasise training, IEC, Operational Research and NGO
involvement in the programme.
10.0
PROGRESS OF REVISED STRATEGY IN INDIA
10.1
Pilot Phase
method
of
nd
1
With SIDA assistance the Revised Strategy was tested
as Pilot Phase in 1993 in 5 project areas as follows:-
State/City
Project Area
Population
Delhi
Gulabi Bagh
1.00 Million
Bombay
H / West ward
0.35 Million
Calcutta
Tangra Topsia
0.30 Million
Bangalore
Shanti Nagar
0.25 Million
Gujarat
Mehsana Distt.
(Patan & Chanasma Taluk)
0.45 Million
TOTAL
2.35 Million
These areas showed over 90% sputum conversion at 2
months and over 80% Cure Rate in initial cohorts.
3
Pilot Phase
I I
Encouraged by the results of the Pilot Phase - 1 the Govt.
of India decided to extend the Revised Strategy to 15 project
sites covering a total population of 14 million as follows:-
* District
State
Mehsana
Murshidabad
Hoogly
Hamirpur
Vaishali
Pathanamthitta
Gujarat
West Bengal
Himachal Pradesh
Bihar
Kerala
1.50
0.20
0.80
0.40
0.30
mill ion
million
mill ion
mill ion
million
1.10 ' million
4.30
TOTAL
million
Taluks covered
♦ District
Mehsana
Murshidabad
Hoogly
Hamirpur
Va isha1i
Pathanamthitta
Population to be
covered
Patan, Chanasma, Harij, Sami,
Sagardigi block
Chandannagar sub-division
Entire district
Lalgunj, Sadar block
Entire district
Cities
Sidhopur, Mehsana
Population to be
covered
Area
Delhi
Gulabi Bagh
L.R.S. TB Institute
1.00
0.70
million
million
Bombay
Munshi Chest Clinic
area
1.50
million
Calcutta
Tangra
1.00
million
Shanti Nagar Range
0.25
million
Hyderabad
Ward 6,7,8, (Hyd.)
Ward 12 (Sec.)
1.00
million
Madras
Ward 32 to 49 of
Zone - III
0.40
million
Pune
Entire City
1.60
million
Lucknow
Lal Bagh Area
0.50
mill ion
Bhopal
Itawara Area
0.20
million
Ja i pur
Entire City
1.40
million
9.55
mill ion
13.85
■i1lion
Bangalore
(Urban)
TOTAL
Total Population covered in States and Cities
World Bank assistance of
US $ 1.996 million has been made
available as Project Preparation Facility advance.
5
10. ?
Phase
I
It is envisaged to extend the Revised NTCP in phases
throughout the country with World Bank support involving
initially a population of 187 million in 5 States and 10
Metropolitan cities as given below:-
Cities
Calcutta
BoBbay
Madras
Bangalore
Hyderabad
Delhi
Pune
Jaipur
Bhopal
Lucknow
TOTAL
4.50
10.00
4.00
3.00
4.00
9.00
1.60
1.40
1.30
1.70
nillion
nillion
million
Billion
Billion
Billion
Billion
Billion
Billion
Billion
40.50
million
States
The
Initially 60 districts will be covered in 5 States,
state wise distribution of the districts and their population is
as under:
Si.No.
Nane of the
State
1.
2.
3.
4.
5.
West Bengal
HiBachal Pradesh
Bihar
Kerala
Gujarat
Total
Total No.
of Districts
Total no. of Districts
and their population to
be covered during 1st
phase.
14
19
11
10
12
10
17
51.56 Billion
5.07 Billion
28.95 Billion
22.20 Billion
38.85 Billion
112
60
146.63 Brillion
17
12
50
The total population being covered is 187.13 siillion.
Besides World Bank funded projects ODA has agreed to bear
the cost of implementation of Revised Strategy initially in three
districts (of Delhi and Andhra Pradesh) and subsequently to
extend it to the entire State of Andhra Pradesh.
DANIDA is also
willing to assist in implementing the strategy in Orissa and the
project is being prepared for this.
6
11.0
EXPECTED OUTCOMES
With the successfull implementation of the Revised
Strategy it is expected to achieve the following in the project
areas:
(i)
a cure rate of atleast 85%.
(ii)
case-detection of atleast 70% of the expected.
(iii)
rate of reduction in the annual risk of infection from the
current 2 - 2.5% to 8 - 10%.
(iv)
reduction in mortality to about 20/100,000 population.
(v)
reduction in relapse rate to less than 5% from current
rate of 15%.
(vi)
reduction in drug resistant/failure cases to less than 5%
from current figure of 20%.
12.0
FUTURE PLANS
With the implementation of Revised Strategy with the World
Bank and ODA assistance it is expected to cover about 20-25% of
the population. However,- there is a need to extend this strategy
at a faster pace to cover the entire country.
This is essential
to contain the transmission of the disease to an extent which
will have significant epidemiological impact, prevent emergence
of drug resistance and minimise the onslaught of TB-HIV
co-infection.
Tuberculosis in its early stages is easily curable at a
relatively low cost.
If the disease is allowed to progress it
reaches a stage where it becomes potentially incurable and very
expensive to treat. As per WHO, this is usually the outcome in
places where National Tuberculosis Programmes are not
given priority.
Hence it is imperative to strengthen the
implementation of the TB Programme throughout the country<
In this regard the Govt, of India is preparing a Concept
Paper for extension of the Revised Strategy in a phased
manner throughout the country with the goal of elimination of
tuberculosis.
7
Pl5- S’
SERIOUS IMPLICATIONS OF THE WORLD BANK S REVISED
NATIONAL TUBERCULOSIS CONTROL PROGRAMME
FOR INDIA
(A POSITION PAPER FOR DISCUSSIONS AMONG CONCERNED SCHOLARS OF THE
COUNTRY. THE AUTHOR WELCOMES COMMENTS AND CRITICISM )
DEBABAR BANERJI
PROFESSOR EMERITUS
JAWAHARLAL NEHRU UNIVERSITY
NUCLUES FOR HEALTH POLICIES AND PROGRAMMES
B-43 PANCHSHEEL ENCLAVE, NEW DELHI - 110 017
TEL. 646 2851
Connnisioned by
Voluntary Health Association of India
40, Institutional Area, South of I IT
New Delhi - 110 016
SERIOUS IMPLICATIONS OF THE WORLD BANK'S REVISED
NATIONAL TUBERCULOSIS CONTROL PROGRAMME FOR INDIA
(A POSITION PAPER FOR DISCUSSIONS AMONG CONCERNED
SCHOLARS OF THE COUNTRY. THE AUTHOR WELCOMES COMMENTS
AND CRITICISM)
DEBABAR BANERJI
PROFESSOR EMERITUS
JAWAHARLAL NEHRU UNIVERSITY
NUCLEUS FOR HEALTH POLICIES AND PROGRAMMES
B-43 PANCHSHEEL ENCLAVE, NEW DELHI-110017
TEL. 646 2851
1
CHAPTER 1
AN OVERVIEW
The proposal of the World Bank for what they call "Revised
National Tuberculosis Control Programme" (RNTCP) for India is
going to have very damaging consequences for development of the
health services of the country, as it suffers
from serious
infirmities. The Voluntary Health Association of India and the
Nucleus for Health Policies and Programmes have got together to
produce this document, which contains a scientific analysis of
the RNTPC to draw attention to its infirmities and to formulate
an alternative proposal for strengthening the National
Tuberculosis Programme (NTP) of India. While the RNTCP will be
analysed in detail at a later stage, it will be worthwhile here
to note that the infirmities belong to three categories. The most
important among them is that the RNTCP has been developed without
paying adequate attention to the processof formulation of the
NTP and the factors which have come in the way
of its
implementation over the more than three decades since it was
adopted by the Government of India. Secondly, in considering the
of
conceptualisation
of
the
RNTCP as an
outcome
an
interdisciplinary study, adopting a systems approach, there are
very serious flaws in project formulation in terms of system
analyses,
optimisation,
epidemiological and sociological
coverage,
managerial
and
technological
perspectives,
epidemiological impact, repayment of the World Bank loan,
replicability of the RNTCP, and other such considerations.
Thirdly, the World Bank promoted RNTCP is a part of the sequence
of what are termed as "International Initiatives" thrust on the
country from outside at the instance of international agencies,
backed up by strong support from many powerful western countries,
which make substantial contributions to the budgets of the
former. Ironically, as will be demonstrated later on, it is these
international initiatives which have been proved to be the major
hurdles in the way of implementation of the NTP all these years.
The RNTCP
thus appears as a not well thought out operation
performed by persons from the very same group who, in the first
place, have been responsible for the damage done to the NTP.
Even from this very broad mention of the RNTCP it is possible to
discern an underlying deep streak of dogmatism among the
exponents of the RNTCP, which has impelled them to 'forget' the
enormous and very substantial public health research in
tuberculosis conducted within the country and put enormous
pressure on the national
authorities to submit to 'models'
developed by them outside the country. Apart from very serious
conceptual flaws, these western models are technocentric, imposed
on the people from above and make the country dependent on
assistance
from
outside.
'Forgetting'
ideas
developed
indigenously has thus become almost a prerequisite for taking
international initiative in health fields; the fields gets closed
to scientific discussions and only those 'natives' who do not do
question them, or are incapable of doing so, are allowed entry
into the privileged group by the international syndicate.
Soon
after the poor countries of the world
had dared to make a
declaration of self-reliance in health in the Alma-Ata
Declaration of 1978 (WHO 1978), the affluent countries 'invented'
what they called "Selective Primary Health Care" (Walshe and
Warren 1979) , which was almost immediately followed by the
unleashing of a series of international initiatives in health.
This provides a frightening example of the extent to which the
more affluent countries of the world are prepared to go in
imposing their will on the countries that are economically and
politically dependent on them. Significantly, there has been
little protest from the concerned community of public health
scholars even in the affluent countries to such brazen forms of
manipulation of science to impose programmes on 'defenceless'
countries, from outside. The World Bank backed RNTCP is a
particularly unfortunate example of imposition of such
international initiatives.
The drive towards globalisation of the economy and polity has
made the poor countries even more vulnerable to manipulation by
the rich countries. In the so-called global village, the poor
countries are condemned to serve as bonded hirelings of the rich
kulaks and cowboys. A 'dialectical' outcome of this form of
international relations is for the oppressed peoples to make
conscious efforts to prevent the dominant powers to 'forget'
their historical heritage. To adapt a quotation from Milan
Kundera, it becomes a struggle between memory and forgetfulness.
Just as ahistoricity becomes an important weapon in the hands of
those who would fight to continue to monopolise the control over
the bulk of the resources of the world, breaking into their
consciousness to 'remind' them about the history they try to
forget becomes a weapon in the hands of the oppressed to fight
oppression.
At a time when a concerted effort is being made by World Bank
officials to promote RNTCP in this country, this document may be
considered as a modest effort to 'remind' them as well as the
concerned authorities in the country about the very significant
work that has been done in India to deal with tuberculosis as a
public health problem. No apologies will be offered here for
consciously taking the side of the people by bringing out well
researched data which had formed the basis of the NTP some three
and a half decades ago. A very deliberate effort is made here to
describe the work rather extensively. The 'battle lines' are
clear: on one side are the indigenous research efforts made to
formulate a nationally applicable, socially acceptable and
epidemiologically effective tuberculosis programme, and on the
other side is a 'foreign inspired', prepackaged programme that is
sought to be thrust on the country by powerful countries and
international organisations.
•/
CHAPTER 7
CONCLUSIONS AND AN ALTERNATIVE FRAMEWORK FOR ACTION
The above account shows how a well researched and reasonably
simple and straight forward programme can get hopelessly
confounded due to interplay of a variety of social, political and
economic forces. NTP essentially involved offering diagnosis and
treatment to the very substantial portion of tuberculosis
patients who were actively seeking treatment in various health
institutions, both in rural and urban areas.
These institutions
were offered a referral support system which extended right up to
the super-specialists in post-graduate teaching hospitals. State
Tuberculosis Centres and NTI and other tuberculosis research and
teaching institutes were meant to provide support to the
programme in the form of training, monitoring, evaluation and
operational research.
But as pointed out by Halfdan Mahler, 'even the simplest
technology, if it is not properly deployed and utilised by the
infrastructure,
just will
not move,
will
not
control
tuberculosis, will not meet people's felt-needs.'
This is what
has befallen on NTP.
The infrastructure has been grievously
damaged because of sharp decline in the quality of public health
practice and research,
filling up of key public health posts by
the persons who do not have technical competence, by imposition
of target oriented specialised programmes on an already weak
infrastructure and a correspondingly sharp fall in the quality of
administrators and research personnel in the field
of
tuberculosis.
From the basic premises presented
suggestions are being made below:
above,
some
important
1.
While tuberculosis workers cannot take on themselves the
onerous task of rejuvenating the moribund health and family
planning services systems, the crisis has become so profound
that there are good chances that the political leaders will
have to wake up to it.
A detailed
programme for
rejuvenation of the health services is given in the author's
B.C.Dasgupta Oration of the Indian Public Health Association
in 1988 (Banerji 1988b; 1984b).
Some important components
are:
a.
Building up a critical mass of public health workers in the
fields of education, training, research and practice.
1
b.
Restructuring the cadre structure to place competent public
health specialists in key public health positions.
c.
Concurrent removal of the square pegs in the round holes of
the system.
d.
Making "conditional" integration of the special target
oriented
family
planning
and
other
programmes
’’unconditional”.
This will lead to according much higher
priority to NTP as the problem is responsible for a
substantial part of the total suffering caused by health
problems as a whole.
2.
Tuberculosis workers can help in the process of rejuvenation
of the health and family planning service systems by
insisting that this process is critical for providing good
tuberculosis services to be suffering masses of the country.
3.
On its own, even considering the constraints of the general
health services as given, there is still considerable scope
for improving the NTP system through use of operational
research and systems analysis.
The Surajkund Conclave
recommendations can serve as a starting point.
4.
The very improvement in the NTP system might stimulate
improvement in the wider health and family planning services
systems, by providing an example.
5.
NTI can be rejuvenated by bringing together a competent
interdisciplinary team of workers, so that it can play a
role in strengthening the NTP.
It can even extend its
activities to serve as one of the many institutions which
would be necessary to strengthen the general health
services.
6.
Concurrently, competent tuberculosis workers are placed as
heads of tuberculosis wings of the central and state health
services.
7.
Other tuberculosis institutions, such as TRC, should be
tuned to serve the NTP, i.e., the problems they deal with
must emerge from the field situation, and not the other way
round, as is often the case at present.
8.
The idea of Task Force (Editorial 1990), or a similar set up
(Fox 1990), which is vested with power and resources to act
as a watchdog for the implementation of NTP, very well
blends with the other suggestions for improving NTP given
here.
2
9.
Again, there is considerable scope for optimising the urban
components of the NTP.
10.
Tuberculosis Association of India and its branches can be
revamped to perform a complementary role in strengthening of
NTP - e.g., conducting independent evaluation, offering
technical
assistance,
providing
logistical
support,
providing training, and so forth.
In sum, the suggestion is that we take steps to unleash the
social forces which ensure that simple and efficacious technology
developed in India is made accessible to the hundreds of
thousands of sputum positive cases, who are actively seeking
relief for suffering but who are still being thrown out of the
health institutions with a bottle of useless cough mixture.
Sociologically, it is contended that the very meeting of the felt
need generates more needs, and, if that does not happen, active
educational steps are taken to generate more needs to reach a
level when it starts having an epidemiological impact.
This
epidemiological impact will occur in consonance with the impact
that might occur as a result of changes in the natural history of
tuberculosis in India.
3
__
✓
Effectiveness of BCG vaccination against tuberculous
meningitis: a case-control study in Sao Paulo, Brazil
V. Wunsch Filho,1 E.A. de Castilho,2 L.C. Rodrigues,3 & S.R.A. Huttly4
A case-control study was carried out in the Metropolitan Region of Sao Paulo, Brazil, to determine the
protection against tuberculous meningitis conferred by BCG vaccination to children aged less than 5 years.
The BCG vaccination coverage in the study area was about 38%. A total of 72 tuberculous meningitis
patients were studied as well as 505 neighbourhood and 81 hospital controls. Analysis of the data using a
conditional logistic regression for matched case-control studies indicated that the efficacy of BCG was
similar for both groups of controls, that for neighbourhood controls (84.5°%) being slightly greater than that
for hospital controls (80.2%>). No significant interactions were found between vaccination status and sex,
age, or socioeconomic status.
Introduction
At the beginning of the last decade of the 20th
century, tuberculosis still presents a public health
challenge, particularly in developing countries. In
Brazil the death rate from tuberculosis has dropped
systematically since the introduction of specific
chemotherapy. However, the current death rate of 5.9
per 100 000 per year from tuberculosis indicates that,
apart from intestinal infections and pneumonia, it is
still the infectious disease that causes most deaths in
the country (14). According to official figures, the
incidence of tuberculosis has shown a tendency to
rise in Brazil (11). The annual risk of infection is,
however, not precisely known because the policy of
mass and indiscriminate vaccination with BCG has
not facilitated such estimates.
To reduce the global problem of tuberculosis,
m ernational health bodies have designated the
1 tp1 Cat*on and treatment of cases and vaccination
BCG as the principal components of control pro?ar s (25). Intradermal injection of BCG is conth ei^U t0 ke
best method of immunizing against
h 6 £lsease. Nevertheless, the effectiveness of BCG
trial Cen Placed unrier doubt since several controlled
s reported contradictory results, with efficacies
Apartment
Universidad, of Epidemiology, Faculdade de Saiide Publica,
le de Sao Paulo, Av. Dr. Arnaldo, 715, S3o Paulo. 01255.
Brazil. Rer _
Quests for reprints should be sent to this address.
’ Fundasao Osw;
—./aldo Cruz, Rio de Janeiro, Brazil.
London
School of Hygiene and Tropical medicine, London,
Enflland.
®oc*a' Medicine, Faculdade de Medicina, Univerderal de Pelotas, Pelotas, Brazil.
R°print No. 5047
sidade
World Health Organization, 68 (1): 69 74 (1990)
that ranged from zero to 76% (2-5, 7-9,12,17, 18, 24).
More recently, the case-control approach has been
advocated for the evaluation of the effectiveness of
BCG vaccination (21, 22); however, such studies have
also reported a wide range of efficacies (13. 19, 23).
Notwithstanding doubts about the effectiveness
of BCG on the chain of transmission of tuberculosis,
and therefore on the incidence of and death rate from
the disease, the vaccine may still be useful if it gives
protection against severe infantile forms of tuber
culosis, although such forms are not contagious (1,
15, 16). The results of a study in the United Kingdom
in 1950 already indicated that BCG vaccine offered
such protection (4); however, the results of a survey
conducted in Chingleput, India, were unclear on this
matter (1, 12).
In Brazil, tuberculous meningitis is a notifiable
disease. For all cases of the disease a surveillance
form is completed, covering data from clinical and
laboratory examinations and an epidemiological his
tory (6). Despite the difficulties in diagnosing this
type of tuberculosis and the lack of confidence in the
data collection in countries with socioeconomic
characteristics such as Brazil, the seriousness of the
disease^probably results in all cases being notified.---The hypothesis that BCG offers greater protec
tion against tuberculous meningitis than against pul
monary tuberculosis (4) is consistent v.ith evidence
from two Brazilian states with a-Ter<nl s heduies
for BCG vaccination. For example, in Rio Grande
do Sul, where children aged 7 years or older are
vaccinated with BCG, the incidence of pulmonary
tuberculosis in 1982 was about 12.5 times greater
than that of tuberculous meningitis. In contrast, in
Sao Paulo, where children receive BCG vaccine dur
ing the first year of life, the incidence of pulmonary
World Health Organization 1&30
6S
9
I
V. Wiinsch Filho et al.
tuberculosis to that of tuberculous meningitis was
52:1; regional differences may, however, confound
this apparent relationship.
BCG vaccine coverage varies markedly in dif
ferent regions of Brazil. Vaccine coverage in Sao
Paulo city is reported to be very high, exceeding
100% according to official estimates; a survey con
ducted in 1982-3, however, estimated that the
coverage was 88% for children less than 18 months
of age/
In view of these facts and of the necessity to
better define the role of BCG in tuberculosis control
programmes, we carried out a case-control study in
the Metropolitan Region of Sao Paulo to evaluate
the effectiveness of BCG against tuberculous menin
gitis. Our findings are reported here.
h
trials and methods
Study area
The study was conducted in the Metropolitan Region
of Sao Paulo (MRSP), which comprises 37 muni
cipalities within an area of 8053 km2. The population
of MRSP recorded in the 1980 census was 12.5
million, which corresponded to 50.3% of that of the
State of Sao Paulo and 10.6% of the entire Brazilian
population. A wide range of living standards prevail
in the study region, with some areas having only very
basic environmental and social amenities. MRSP is
very urbanized with only a few rural areas in the
outskirts of the city (20).b
Tuberculous meningitis
7
Between 1979 and 1983, about 150 cases of tuber
culous meningitis per annum were notified in the
State of Sao Paulo, and of these a third were among
children under 5 years of age (incidence, approxtely 1.7-per 100000-per annum). The majority of
cases of the disease notified in the State of Sao Paulo
are admitted to two hospitals: Emilio Ribas or Mandaqui.
i
BCG vaccination
Routine BCG vaccination (Moreau-Rio de Janeir |
strain)*7 is compulsory in Brazil as part of
programme established by the Ministry of Health, h
is recommended tha* the vaccine be given tu childrep
without a previous tuberculin test, between birth and*
the end of their first year of life. Although BCG i$|
widely used the protection afforded by it has never
been assessed in Brazil.
Selection of cases
All notified cases of tuberculous meningitis which <
were admitted to the Emilio Ribas or Mandaquij
Hospital from 1 January 1981 to 31 December 1983 1
that involved patients who were born after 19781
(coverage with intradermal BCG became high in?
Brazil only from 1979) were ascertained. Because of I
the difficulties in diagnosing tuberculous meningitis J
unequivocally, criteria were defined based on clinical |
and epidemiological findings, as well as on the re:
*
of bacilloscopy, culture of cerebrospinal fluid (Chrir
and necropsy. All cases selected were residents of
MRSP.
Data on cases were collected in two question
naires: one based on the hospital records and the 1
other on household interviews to clarify and com- j
plement the hospital record data, particularly in j
relation to the BCG vaccination status of the chil-1
dren. The vaccination status of children was deter-:
mined from their vaccination cards and, if possible,:
by the presence of vaccination scars. Cases were;
classified as BCG-positive only if their date of vaccin- j
ation preceded that of diagnosis of tuberculous men- j
ingitis. In situations where a case died, the child i
concerned was still included in the study and a J
household visit was made. The mother was then j
'questioned about the dead child’s BCG vaccination :
status and was asked to produce the vaccination Card.. If the mother had lost the child’s card, health
centre archives were searched. The mother’s worth
was accepted only if she affirmed that her child
never been vaccinated, and such children were c—.
1 sified as unvaccinated. Cases were excluded from the
. analysis if they could not be located or information^
could not be obtained about their vaccination status. .
Selection of controls
' [Investigation of vaccination coverage in the municipality of Sao
Paulo]. Centre for Health Information. Government of the State of
Sao Paulo. Unpublished document, 1982 (in Portuguese).
6 [Health care in the Metropolitan Region of Sao Paulo]. Paper
presented at the WHO/PAHO Regional Meeting of the Technical
Consultation on Primary Health Care and Development Services
in Urban Areas and Large Cities, Washington, DC, 20 November
1981. PAHO unpublished document (in Portuguese).
70
Neighbourhood controls. Cases and controls were i
matched by home area and socioeconomic stratum, s
In order to obtain a minimum of four suitable ’
controls per case, eight potential controls were ■
J
c Fundatpao Ataulpho de Paiva, Rio de Janeiro, Brazil.
-I
■i
WHO Bulletin QMS. Vol 68 199°-'
---------------------- r-
--
Effectiveness of BCG vaccination against tuberculous meningitis
sought from children in the neighbourhood of each
case. The mother of the index child was asked to
nominate two children of neighbours, each of whose
mothers nominated two more. This process was
continued until eight controls were identified. The
only requisite was that the children nominated
should have been born after 1978. Information on
controls was collected during home visits, using a
very similar questionnaire to that used for cases. To
determine the BCG vaccination status of the neigh
bourhood controls, the same procedure was used as
for cases, and only those children whose vaccination
status was known with certainty were accepted. Chil
dren who had a past or present history of tuberculosis
were rejected as controls.
Hospital controls. In order to detect any biases that
migf ive been introduced by the neighbourhood
controls, a second series of controls was selected from
patients in Emilio Ribas Hospital. In order to ensure
that there was one suitable hospital control for each
v case,
attempts were made to identify three potential
. controls per case.
Hospital controls who were suspected to have
had tuberculosis were excluded. Also, children with
diseases which could have been prevented by vaccin
ation, e.g., measles or diphtheria, were also excluded,
because it was considered likely that those not vac
cinated against these diseases would have had less
chance of having received BCG vaccine. The hospital
controls were selected from patients admitted with
meningitis caused by Streptococcus pneumoniae or
Haemophilus influenzae and who also satisfied the
birth
I.equ,renients of sex, home area, date of
birth, and date of admission to hospital ±6 months
with respect to that of the index case.
trnk L°iq?eSt,10nnaires wcre used for hospital conother whirl? Obtain hospital records data and the
hood’-ontrnl
S"ni,ar to that for the neighbourtion
fkf°ruthe .h0mc visiL The BCG vaccinathe same u/o
C , osPhal controls was determined in
controls
38 that °f thc cases and neighbourhood
Sample size snd estimation of vaccine efficacy
^th the number of
cases that were expected to be
found during the
study
period and the level of BCG
coverage, it
above 50% Wa?. concludcd that vaccine efficacy
significance atcould
r - be detected at the 5% level of
a power of 80%.
RR
Wa3 esl*mated from the relationwhere RR is the relative risk of
tuberculous
Pared to the lienin^’!’s among the vaccinated com—3 ratio ^rkCInatC^ children, estimated from
the odds
he odds ratio was calculated by
conditional logistic regression analysis for matched
case-control studies, using the EGRET software
package (10).
Results
Characteristics of the study population
During the study period, a total of 474 cases of
tuberculous meningitis were notified in Sao Paulo
State, 196 (41.4%) of which involved 0-4-year-olds.
In the two hospitals where the investigation was
carried out, 271 diagnosed cases of tuberculous
meningitis were admitted, U5 <424%) of which were
children aged less than 5 years. Any case that trans
ferred between the two hospitals or which was re
admitted was counted only once, using the initial
admission to the first hospital in the respective year.
A total of 94 eligible cases remained, 19 of which
were omitted from the study (11 were born outside
the study area, while eight could not be located). Of
these 75 cases that were located and visited, there was
uncertainty about the true vaccination status of two
children, who were therefore also eliminated from the
study. Also a control could not be obtained for one
case, which was therefore removed. Altogether, 72
cases fulfilled the study criteria 125 cases from 1981,
2TTfom 1982, and 23 frorfi~T9t3).
For these 72 cases, which formed the basis of the
study, the history of contact with tuberculosis
patients was traced for 46 of them (63.9%). Chest Xrays were available for only 50 of the 72 cases, and 46
(92%) were positive for tuberculosis. The results of
CSF cultures were available for all cases, and Myco
bacterium tuberculosis was isolated from 10 children
(13.9%). The results of CSF smears for acid-fast
bacilli were available for all cases and were positive
for four children (5.5%). The overall case fatality
rate was 50%, but was higher among those aged less
than 1 year (60.5%). Of children who survived,
many suffered neurological sequelae from which they
recuperated with difficulty. Only 11 of the children
investigated recovered without exhibiting apparent
neurological abnormalities (Table 1).
A total of 520 neighbourhood controls and 83
hospital controls were visited. Of the neighbourhood
controls, 15 were omitted (12 were born outside the
defined study area, one was being treated for pulmo
nary tuberculosis during the period in which he was
visited, and for two others doubts remained as to
their true vaccination status). Neighbourhood con
trols could not be located for four cases. Of the 83
hospital controls: two were omitted (one was born
outside MRSP and there wers doubts about the
vaccination status of the other), leaving 81. Hospital
controls could not be obtained for 12 cases.
Bulletin °MS. Vol 68 logo
71
(JI.
V. Wiinsch Ribo ot al.
Table 1: Clinical outcome of the 72 cases of tuberculous
meningitis that formed the basis of the study, Sao Paulo,
Brazil
No. of cases
Outcome
36 (50.0)'
Died n hospra!
□'■cd *ft?r discharge
from hospits 0
2 (2.8)
Neuro ogicai *equelae
23 (31.9)
No apparent
neuroiogica sequelae
11 (15.3)
Total
72 (100.0)
Efficacy of BCG vaccination
' Figures in parentheses are percentages.
0 Death was varified at a home visit.
Table 2 shows the distribution of cases and
controls b} age, sex and socioeconomic status
(defined in lerms of family income, area of residence,
degree of domestic crowding, and mother’s education
levelL and vaccination status. For ease of presenta
tion. unmatched data are shown; however, matching
Table 2: Characteristics of the study cases and controls,
Sao Paulo, Brazil
No. of
cases
No. of
neighbourhood
controls
No. of
hospital
controls
Age
<6 months
6-11 months
12-23 months
^24 months
14 (19.4)'
30 (41.7)
21 (29.2)
7 (9.7)
35 (6.9)
36 (7.1)
104 (20.6)
330 (65.3)
20 (24.7)
34 (42.0)
18 (22.2)
9(11.1)
Sex
Male
Female
49 (68.1)
23 (31.9)
250 (49.5)
255 (50.5)
51 (63.0)
30 (37.0)
Sccioeconomi:
status1
1
2
Unknown
58 (80.6)
13 (18.1)
1 (1-4)
431 (85.3)
74 (14.7)
55 (67.9)
26 (32.1)
Vaccination
status
Vaccinated
Unvaccinats:
42 (58.3)
30 (41.7)
463 (91.7)
42 (8.3)
72 (88.9)
9(11.1)
Total
72
505
81
Cha'actens'.c
was preserved to estimate vaccine efficacy.
thirds of subjects came from the municipality of sd
Paulo, most from the peripheral poorer areas, whO
the remainder were from the other 36 municipalitd
of MRSP. Hospital controls were matched by sej
and by age (within 6 months) but differed from caseifi
with respect to their socioeconomicLjtatu^ m0J
frequemly coming from higher status groups. Neig^f
bourhood controls, as expected, had the sanj
socioeconomic status as cases, but were older anJ
had a higher proportion of females.
Vaccine efficacy was calculated separately for eadf
group of controls using a conditional ’ Stic re|
gression analysis, and the results are shown m Tablet
3. The efficacies obtained were similar and high,
efficacy for neighbourhood controls (84.5%) being!
slightly greater than that for hospital control!
(80.2%). No significant interactions were founq
between vaccination status and sex, age, or —qo.|
economic status.
|
j
Discussion
To the best of our knowledge, this is the first largq
study to quantify the effect of BCG vaccination
against tuberculous meningitis. Previously, Miceli
al. in a case-control study in Argentina reported thaj
BCG vaccination had an efficacy of 100% agains’
this form of tuberculosis, although the sample sizt’
was small (23). Our results indicate that in the studj
community in Sao Paulo, BCG vaccination ws
highly effective against tuberculous meningitis inchiH
dren below 5 years of age. This finding is veijj
encouraging for the prevention of a disease that hasi|
high fatality rate and serious neurological sequel^
jerculois
among many of those who survive.
scr"1''
meningitis predominantly affects children
Table 3: Efficacy of BCG vaccination against tut
menlngltls for matched pairs of cases and cont
J
Paulo, Brazil
' Figures in parentheses are percentages.
6 Children we*e classified as socioeconomic status 1 if they
satisfied at isast three of the following conditions: per capita
household income less than one minimum wage (about USS 58.26
in May 1986); creater than four persons per bedroom; resident in
the periphera area of Sao Paulo municipality or other mun
icipalities of tre Metropolitan Region of Sao Paulo; and mother
illiterate or ony partly literate.
I
Vaccine
efficacy (%)
Cases and neighbourhood
controls'
84.5 (66.7-92.8%)*
1
Cases and hospital
80.2 (40.6-93.4%)^^
controls'
' Adjusted for age, sex, and socioeconomic status.
|
6 Figures in parentheses are the 95% confidence interva ■ A
c Adjusted for socioeconomic status.
WHO Bulletin OMS Vol 68
72
!
T
Effectiveness of BCG vaccination against tuberculous meningitis
poorer socioeconomic and environmental back
grounds, who may also be less likely to have been
vaccinated with BCG. Since the majority of cases
occur among children aged 3-11 months, we recom
mend that BCG vaccine be administered within the
first 3 months of life and that efforts are made to
achieve a high coverage across all socioeconomic
strata.
Use of the case-control approach has been
recommended for studies of the effectiveness of BCG
vaccination (75, 21, 22). Compared with controlled
trials, the case-control approach is both quicker to
carry out and cheaper. In accord with the reports of
other workers (13, 19, 23), our findings indicate that
the case-control method is useful for evaluating the
effectiveness of BCG vaccination. It is particularly
encouraging that similar results were obtained with
the
groups of controls. Hospital controls,
altho
easy to locate, differed from cases with
respect to socioeconomic status. The neighbourhood
controls, although they had the same socioeconomic
status as the cases, differed from the latter in their
age and sex distributions; they were, however, a more
plentiful source of controls. The analysis with each
group of controls therefore still required some con
trol of confounding variables, which led to similar
estimates of BCG efficacy. The vaccine efficacy was
slightly higher for neighbourhood controls, but this
may have arisen because of further confounding. No
evidence was found for interactions between vaccina
tion status and age, sex, or socioeconomic status, but
the sample size was rather small to study these effects.
In most countries where tuberculosis is endemic,
its incidence has remained fairly constant. For such
countries, BCG vaccination is an attractive policy to
protect children against tuberculosis, although it
does not significantly decrease transmission of the
disease. Our results are encouraging for the preven
tion of tuberculous meningitis and should hopefully
stimulate further case-control studies of BCG vaccina 10p d childhood tuberculosis in other countries.
Acknowledgements
t0 Dr
P’° ar|d Dr
ten Dam, both of
Tron’ i P G- Smith, London School of Hygiene and
FedpC^ Medicine, and Dr C.G. Victora, Universidade
niegifa
Pe,c*as< tor their helpful comments and techwitho^fth5*31^' This work wou'd not have been possible
RibasU h
cooPeration of the medical staff of Emilio
Mr L W0) Mar,daqui Hospitals. We are grateful also to
^anuscriph
^*S contrit5ution t0 the PreParation of this
wio5 inves«gation was partly supported by a grant from
R6sum6
Efficacitd de la vaccination par le BCG contre
la mSningite tuberculeuse: 6tude cas-t&moins
3 S3o Paulo, Br6sil
A I’approche de la fin du XXe siecle, la tuberculose
pose encore un probleme de sante publique,
notamment dans les pays en developpement. Pour
y remedier, les organismes sanitaires internationaux ont decide d’axer les programmes de lutte
sur I’identification et le traitement des cas de
maladie et sur la vaccination par le BCG.
Bien que le vaccin BCG soit largement utilise
dans le monde a titre de mesure preventive contre
la tuberculose, sa valeur a ete remise en question.
L’article presente une discussion du rdle du BCG
en tant que mesure de lutte contre la tuberculose
et etudie la protection qu’il confere contre la meningite tuberculeuse.
Les politiques de vaccination par le BCG dans
les Etats bresiliens de Rio Grande do Sul et de Sao
Paulo, qui ont differents calendriers vaccinaux, ont
ete evaluees; on a pour cela examine I’incidence
de la meningite tuberculeuse dans chacun de ces
Etats. Dans I’Etat de Rio Grande do Sul, ou les
enfants sont vaccines a I’age de sept ans, I'incidence de la meningite tuberculeuse est environ
quatre fois plus elevee qu'a Sao Paulo ou les
enfants sont vaccines avant Cage d’un an. La
couverture vaccinale du BCG varie sensiblement
d'une region a l’autre-du Bresil. Par exemple, en
vilie de Sao Paulo, elle est tres elevee, depassant
meme 100% selon les chiffres officiels; toutefois, une
enquete realisee en 1982-1983 conduit a estimer
a 88% la couverture vaccinale chez les enfants de
moins de 18 mois. L’article rapporte les resultats
d’une etude cas-temoins menee dans la zone
urbaine de Sao Paulo (Bresil) afin de determiner la
protection que confere le BCG contre la meningite
tuberculeuse chez les enfants de moins de cinq
ans.
L’etude a porte sur 72 cas de meningite tuber
culeuse, 505 temoins de voisinage et 81 temoins
hospitallers. On a calcule I’efficacite du vaccin
selon la formule 1-/7/7, dans laquelle RR est le
risque relatif de meningite tuberculeuse chez les
sujets vaccines par rapport aux sujets non vac
cines, exprirne par le odds ratio. Avec une analyse
de regression logistique conditionnelle, nous
avons calcule que I’efficacite du vaccin etait
analogue dans les deux gfoupes de temoins,
legerement plus grande toutefois chez les temoins
de voisinage (84,5%) que chez les temoins hos
pitallers (80,2%). On n'a observe aucune relation
Ho Bu|letinOMS Vol 68 1990
73
f
V. Wunsch Filho et al.
significative entre I’etat vaccinal et le sexe, I'age
ou le niveau socio-economique.
Bien que des reserves aient ete exprimees
quant a I'efficacite du BCG sur la chaine de trans
mission de la tuberculose et par consequent sur
I'incidence et la mortalite generale dues a cette
maladie, nos observations montrent qu’il peut etre
utile s'il protege centre les formes infantiles
graves de tuberculose. Comme la plupart des cas
de meningite tuberculeuse chez I’enfant surviennent chez les nourrissons de 3 a 11 mois, nous
recommandons d’administrer le BCG au cours des
trois premiers mois de la vie.
References
1. Aneja, K.S. Immunoprophylaxis in tuberculosis. Jouril of communicable diseases, 16(1): 49-53 (1983).
2. Aronson, J.D. et al. A twenty-year appraisal of BCG
vaccination in the control.of tuberculosis. Archives of
internal medicine, 101: 881-893 (1958).
3. Medical Research Council Tuberculosis Vaccines
Clinical Trials Committee. BCG and vole bacillus
vaccines in the prevention of tuberculosis in adoles
cents. First Report. British medical Journal, 1: 413427 (1956).
4. Medical Research Council Tuberculosis Vaccines
Clinical Trials Committee. BCG and vole bacillus
vaccines in the prevention of tuberculosis in adoles
cence and early adult life. Third Report. British
medical journal, 1: 973-978 (1963).
5. Medical Research Council Tuberculosis Vaccines
Clinical Trials Committee. BCG and vole bacillus
vaccines in the prevention of tuberculosis in adoles
cence and early adult life. Fourth Report. Bulletin of
the World Health Organization, 46: 371-385 (1972).
6. Centre for Health Information. [Manual for
epidemiological surveys. Rules and instructions.']
Sao Paulo, Secretary of State for Health, Government
of the State of Sao Paulo, 1978 (in Portuguese).
7. Clemens, J.D. et al. The BCG controversy. Journal of
the American Medical Association, 17: 2362-2369
(1983).
Comstock, G.W. & Palmer, C.E. Longterm results
of BCG vaccination in the southern United States.
American review of respiratory disease, 93: 171-183
(1966).
9. Comstock, G.W. & Webster, R.G. Tuberculosis studies
in Muscogee County, Georgia. American review of
respiratory disease, 100: 839-884 (1969).
* |
10. EGRET epidemiological graphics, estimation ,and I
testing package. Statistics and Epidemiol,Io9y |
Research Corporation, Seattle, WA, 1988.
11. Brazilian Institute for Geography and Statlstlci; |
[Annual statistics for Brazil]- Brasilia, Secretariat fOr ■
Planning of the Office of the President of the /
Republic, 1983 (in Portuguese).
12. Indian Medical Research Council. Tuberculosjc I
Prevention Trial, Madras. Trial ot BCG vaccine jn '
South India. Indian journal of medical research,
|
(suppl.): 1-74 (1980).
13. Miceli, 1. et al. Evaluation of the effectiveness of Bqq j
vaccination using the case-control method in Buenos •
Aires, Argentina. International journal of epi.'
demiology, 17: 629-S34 (1988).
14. [Mortality statistics. Brazil 1980.] Brasilia, National .
Secretariat for Basic Health Care, National Division
of Epidemiology, 1983 (in Portuguese).
15. WHO Technical Report Series No. 651, 1980. (Vacci.
nation against tuberculosis', report of an ICMR/WHO
Scientific Group).
16. WHO Technical Report Series No. 652, 1980 (SCG;
vaccination policies, report of a WHO Study G
17. Palmer, C.E. et al. Community trials on BCG vau_..,d.;
tion. American review of tuberculous and pulmonary
diseases, 77: 877-9Q7 (1958)18. Rosenthal, S.R. et al. BCG vaccination against tuber
culosis in Chicago. A twenty-year study statistically
analyzed. Pediatrics, 28: 622-S41 (1961).
19. Shapiro, C. et al. A case-control study of BCG and
childhood tuberculosis in Cali, Colombia. Inter
national journal of epidemiology, 14: 441-446 (1985).
20. [Studies and investigations—Part 73.] Sao Paulo,
Coordinator for Analysis of Data, Secretary for Econ
omics and Planning, Government of the State of Sao
Paulo, 1977 (in Portuguese).
21. Smith, P.G. Retrospective assessment of the effec
tiveness of BCG vaccination against tuberculosis
using the case-control method. Tubercle, 63: 23-35
(1982).
22. Smith, P.G. et al. Assessment of the protective
efficacy of vaccines against common diseases using
case-control and cohort studies. International jour
nal of epidemiology, 13: 87-93 (1984).
;
23. Smith, P.G. Case-control studies of the efficacy of
BCG vaccine in children. Bulletin of the Intern?*^Union against Tuberculosis and Lung Disease,
70-76 (1987).
24. ten Dam, H.G. Research on BCG vaccination. Advan
ces in tuberculosis research, 21: 79-106 (1984).
25. WHO Technical Report Series No. 671, 1982 (Tuber
culosis control: report of a joint IUAT/WHO Study
I
t
Group).
■
ii
I
I
WHO Bulletin OMS. Vol 68 19$
74
■pis-
eo
DOTS
^oio^ro Scod,
g*A
sseSdu*' fazg ts^dra, a±><dcd,do, zSortetod: ?3rtd z3<d.
080-23367268
c
<€ «^k
\
g i
Tii
osflv inftor wiB-4 Uhnr
o dobdiaedd) ‘d^dtae g^eoccbo □^c^d^Aae^^’ cdoa dfa^dtaedraas&od acbdd.
o doi)cteedoio ds^caad esqtaa &e8oad atadacbd sbosbcbdesod de cteeoaraadeb oaesoi dxaod ©cteec^dod
e^6ccb sgddiaed deo eed&d djaeoda enaoeaadadd.
O dcdacteedd eadradda
C4
O
o
o
o
O
O
O
C4
★ eadci) arod «>dsre esd^od daeeag dddaaad ddxj g^ ‘<oddsaedd ©dead)^
eaoda dedrf<fc
dd doedd ^dre&dbdjcb.
gdd ©deaddb
^d eoddexa dod ded dsrada^da.
carfcda© diaed), diad d®dao±jadad)da. d&aaadadad)da.
ddd© dd 29edad)da
dcdadraedd) dedd ccbad)de ©adsgdcte sadeaadda. gdda^ sgddbaedd doia dada sgddiaededd dcda
aoda adda ad^rao aodadeaaead.
Ejgd&aedd dcda a,aj©od a^od (asaoe^aad) dddadoddda.
896d ddcdad ddd© §aadda^ dcdaAaeacdD dd^d© 10 ©od 15 aad$ dcdacbaedd djaeoda ddctead.
afafea/ac^ djaeoAdad d$6dd© cbaedactaedd d6 dao®de3adad)d©od © s^ddb dcdaAaedd djaeodd
dedd Sudoactead.
dcdacbaeddda^ adda eaa© dd d©ed daadad)dd daaaaaodd doda&®©adadd.
ddd doedcda© §aadda doda ad©^d©d d-ddra d©ed daaaiaodd ^cdacbaeddd^ doda&®cdaaadada.
o DOTS 856d aodd (Direct Observation Treatment Short Course) ‘ded aoadraa ©©ad® 856d’
©odd S,d®o±>d^ ©dbaer^ saocbrddrd adbedgodbe deaabd ©qad.
O dcdacbaedd s96^ 6 ©od 8 soddddd gdadd.
O dcdacteedd 89dd oaa^d ae§ dsar© ©cbaed$ deo^dd^ erosSdaa® Aadcdiadd.
O acdaaadaa® asadia ad©d ©d©cdaddd e86d dddd ^cdadbaeddda^ d^draa® daradadaaadda.
«1
L
cO
—o
^ccbdiaed ^dd^ex) ^db^oddessd ^djd?±):
★
^oMraeodsb ^dxpsd assdis ^edocrad gjsoso d)^ dxsod adad ^dd^Jd^gtgAa^ded).
★
ctaemtu dddd^ dad^d aod dd ewocdbgjddda.
★
ddddb^ d^oi)^ dea)e)& d^oirao dx>$ dx^aeadded) e^d^ra dbo© diae® dudded).
★
ddsad ^Ebdesd ag&as «&d asaAddod).
★
&d^ d)da±)^ asadja djddudesddd^ ^cdaAaedd o^raddb^ddd^ dsdd dja^ddcd
deo^d deedoao dsb&dadjdo.
^odbdjsericd ®3©e^| sdb^
<D«5g ssdiaer^
d^dodso^cS.
aseaa dccbdsaed ftcdbodra deo^, doddsacb ddd 88$.
y
'<2
a.cDO.cfc.
sdde^ ^eodrteb sSortebadb rfrid ad
ANEKAL
ABBIGERE
K.R. PURA
KONANAKUNTE
YALAHANKA
ATTIBELE
TAVAREKERE
VARTHUR
BEGUR
HESARAGHATTA
CHANDAPURA
HEGANAHALLI
VYDEHI MEDICAL COLLEGE
KENGERIUPAN
K.G. HALLI
JIGANI
LAGGERE
K.N.PURA
KAGGALIPURA
BETTAHALSUR
SINGASANDRA
NELAMAHESHWARI
VIBHUTHIPURA
ARAKERE
SAPTHAGIRI MEDICAL COLLEGE
RAJARAJ ESHWARI MEDICAL COLLEGE
THINDLU
DOMMASANDRA
B.G.S. MEDICAL COLLEGE
a>
cdbdo
DR. RENUKA PRASAD
DR.JNANAPRAKASH
DR. CHANDRASHEKARA1AH
DR. HARISHWAR
DR.GIRISH M.L
KRBHNAMURTY
9480682156
PUNDALEEKAPW YATANUR
9480682159
SOMMANNAB.
9480682157
MAHADEVAPfAR.
9480682518 S.H.SOMASHEKAR
RAMESH.S
9480682161
D.P.SRINIVAS
9480682164
B. GURURAJ PATIL
9480682163
GOVINDANAIKM.L
9480682162
V. LAKSHMINARAYANA
9480682160
KRISHNAKIRAN
9980223575
MANJUNATHAMN.
9535016470
JAIPRAKESH M.G.
8892450733
SHEEBAK.M.
9845723793
SANTHOSHJADAV
9591602946
PRASHANTH KUMAR
9986783135
SHWETHAG.V.
9538949178
MOHMED NAWAZ
9900965542
RAVIM.
9902228174
SHIVAKUMAR..M
9731750736
SHIVARACHAYYA
9916252535
SUGUNA B.A.
7259817305
KUSUMA
9731121630
V1NAYAKKOLLURA
9663100303
VINOD G
9743301463
PMDT
Mr. SHAURAJ : 9480682165
9480682155
PPM/NGO PRIVATE PUBLIC MIX
&.d)O.a.£5.
Dr. HANUMANATHRAYAAPPA : 7829950034
A.&.eDot)®
/ eDKJ®.28,8j
Today we present to you
from a WHO approved plant
CAVITER
Patient friendly
anti-TB medication
Patient weight
rifampicin 120 mg; isoniazid 80 mg; pyrazinamide 250 mg
Cavidin-INH
CAVIZIDE
pyrazinamide
Continuation phase
CAVITER
Cavidin-INH
for first 2 months
for next 4 months*
rifampicin: isoniazid; pyrazinamide
Upto 49 kg
3 <3 9 <9
50 kg and above
33333
rifampicin 450 mg; isoniazid 300 mg
❖
Intensive phase
* For patient over 50 kg additional rifampicin may be required
500
750
Continuation phase
Intensive phase
CAVIDIN
Svidin-INH
450
BOO
rifampicin: isoniazid
CAVIZIDE &
pyrazinamide
------------ :---------- for first 2 months-------------------
rifampicin
* Registered trademark of TATA PHARMA Ltd.
™ Trademark applied for.
rifampicin; isoniazid
* For patient over 50 kg additional rifampicin may be required
Cavidin-INH
rifampicin; isoniazid
for next 4 months*
Series 1
Guidelines for managing suspected
pulmonary tuberculosis
Severely ill patieni
Sputum negative x'
X-ray: Shadow present
Culture for TB where possible
1
1. Treat with antibiotic for pneumonia
2. Plus antituberculosis chemotherapy
Start
CAMTTER
▼
After 3-4 weeks
7
1. Repeat X-ray
2. Repeat 3 sputa
CAVICARE
r
Sputum negative
Sputum positive
_____
r
Treat as tuberculosis
CAVTTER
(Complete 2 months)
X-ray minimal
changes
1
followed by
Cavidin-INH
(4 months)
A step towards a TB-free nation
Complete anti-tuberculosis
treatment
CAVITER
(Complete 2 months)
Patient and X-ray
greatly improved
J.
1. Stop treatment
2. Tell patient to
return if unwell
followed by
Cavidin-INH
(4 months)
Severely ill patient with 3 sputa negative for TB. X-ray shows abnormal shadows.
Adapted from Crofton J. et al. Clinical Tuberculosis 1994;. pg. 142
1989
1995
Acocella commented that
especially in India, individual
patients are at a high risk of
using preparations with a poor
bioavailability of rifampicin*
(Acocella had isolated combination products,
which were seriously substandard)*
1993
IUATLD and WHO issued
a joint statement:
"Antituberculosis medications
should be given in combinati<^|
tablets or capsules".**
Caveat
"Must be of demonstrated
bioavailability".**
* Acocella G. Human bioavailability studies. Bull IUATLD 1989; 64: 38-40
** WHO Drug Information, Vol 8, No. 1, 1998; Pg. 27,28
Right through the years
we have provided
your patients with 100%
For the use only of a registered medical practitioner or a hospital or a laboratory.
DECADE
r
PROVEN
’
s10AVA,LAB/t/nr
1986
For detailed prescribing information, please contact:
MERIND
'tata'^pharma
Mulund -Goregaon Link Road, Bhandup, Mumbai 400 078.
A year when Tata Pharma
set the standard for
bioavailable anti-TB products.
plS'-SA-.
- EXPERIENCES OF THE
URBAN POOR
A study on patients’
perspectives regarding TB
treatment under Revised
National Tuberculosis Control
Programme (RNTCP) Implemented by the
Bangalore City Corporation
AN ACTION RESEARCH CONDUCTED AS
PART OF LARGER INITIATIVE TO
IMPROVE HEALTH OF THE URBAN POOR
IN BANGALORE, INDIA
SJ.CHANDER
COMMUNITY HEALTH CELL,
BANGALORE, INDIA, SOUTH ASIA
To understand patient’s perspective
regarding TB treatment provided by the
Bangalore City Corporation under the
Revised National Tuberculosis Control
Programme (RNTCP) using DOTS
(Directly Observed Treatment, Short
course) approach.
1
£
■Assess the socio
economic status of the
patients.
■Understand the
treatment seeking
behaviour of the
patients.
•Gain an understanding
of patients’ perception
on TB.
■Understand the impact
of the disease and the
treatment on patients’
lives; and the
adjustment they need to
make towards this.
J Qualitative information using in-depth
nterview
guide.
? Sampling method: Systematic random
sampling.
40 patients selected out of 805 patients under
reatment from 7 TB units.
'4'
;g|(7©QDDD^J ©If to
^©©0©°@@®K)©[njD0©
Sex
Age
|t □ MEN
OCCUPATION
□ WOMEN ~]
Retired
Self employed
ts;—
10 [ -
Employed
' 51—
Farmer
Students
Labourers
Educational Qualification
Street Vendors
Pre-Unlv«r«lty
Construction workers
House maids
School dropouts
Home makers
lllli«rat>
0
0
5
10
15
20
2 •
6
8
10
12
25
2
-
*
?@[?©@[pQo©ro
aw®F@[fi}@©©
Locally called: TB Kaayele or TV Kaiyele,
Kshayaroga, TB katti Kshayarogamu.
gteft
ix patients said they did not know anything about TB.
People suffering from TB would have wounds inside the
heart and there will be germs in his sputum.
❖ It was found that FEAR kept patients from
being informed about the diagnosis
<• Five (12.5%) of patients did not know that they
were under treatment for TB
People who suffer from TB have intermittent fever and lose
weight.
A person suffering from TB would have cough, fever and
loss of appetite.
When a man coughs, he might have TB.
4r
§Wf®»
P@®(pO©0§ [o)@©©^0©ffl§ ©taiQ
W ©gm
©boo©(oI
It affects people irrespective of age, sex and economic status
□ The poor
The rich
Men are affected more
People living in villages
Mraw
P@@{o)fe°§ [p@©@^©G® stafl
W B§ ©(M«
Not eating on time
Alcohol and smoking
Occupation
3
0§SQfl@S
I .Communication to the patient by health services providers is
inadequate.
2.
Information given to patients is often limited to takins
precautionary measures for preventing transmission.
3.
Hence, misconceptions and ignorance about TB still continues.
4. Motivating alcoholics who were also TB patients to take
treatment and continue medication was found to be difficult. All
the four alcoholics in the study were found to be irregular in
taking medications or had discontinued treatment.
Tta© MW) to
grtecr
©©rotes
©[p[o)@g][rg}Di)©@.©ff
Except three patients, all the other patients first approached
private health care service providers, but found no relief and
were unable to pay the cost of treatment. Two of them however
continued in private healthcare institution.
The remaining patients then approached government TB
centers seeking relief.
teD[o) ftw feOfe fete
15% (6) of the 40 patients interviewed said that they also went t
folk healers, but they found no relief.
Patients under treatment for extra pulmonary TB
❖ Nine of the thirteen people noticed a lump, which was painful
and growing bigger. For some it was not painful, though it was
growing.
Others had the following symptoms: stomach ache, diarrhoea,
fever, loss of weight, weakness, tiredness and inability to lift heavy
tilings.
4
atients under treatment for pulmonary TB
Government
Healthcare
12
Providers
Nineteen men and eight women under treatment for pulmonary
experienced the following symptoms: fever, cough, tiredness, back pa
cough and chest pain, loss of weight, fever and headache, loss
Pulmonary
TB
Charlttable
Mission
Hospitals
Io Female
| B Male
2
1
Private
Healthcare
Is
provider*
0
Extra
pulmonary
TB
2
6
2
12
tj
W ° pftfflfe0 srf
TB patient^
Relapse
1
4
5
Person wouldispread
i
the disease an<id die
8
14
22
2
2
4
7
11
13
27
40
Health would
deteriorate
Pulmonary
[7@®[p©[n]®®
TOTAL
Extra Pulmonary TB
Pa'tients
RESPONSE
TOTAL
10
TH
| p"vX.’
Do not know
8
Key issues: Communication about the disease to the
patients by the health providers was not clear and
adequate.
©
Ten patients were of the view that a person suffering from TB
should not get married.
©
Family's attitude and support were generally supportive.
©
Most of them said they could not afford special care.
©
Four men and four women were given special diet by their
families during treatment.
©
Five men experienced social isolation. In one case, a man was
abandoned by his wife when she came to know that he tested
5
t
©(? ©GSgEffl®
©
Most patients were afraid of being stigmatized by their
neighbours.
©
14 patients (two women and twelve men) said that their
neighbours were aware about their disease status.
©
Two of the men were discriminated by their neighbours
and were asked to stay away.
©
One was served food separately when he was invited to
their house.
•All the patients* interviewed said that, they had spent money
for treatment ranging from a minimum of twenty rupees (less
than 1 US $) to a maximum of forty thousand rupees (more
than 900 US $) in private healthcare institutions, in spite of free
treatment being available at Government health centres.
•(The average daily wage of the patients was less than US $ 2
per day).
•More than 40% (17) of the 40 patients borrowed money
ranging from US $ 10 -1000 for treatment.
•Most of the patients received a word of encouragement
or advice.
•One man and one woman said their neighbours were
supportive. While the man was lent money; the woman
was given food and money by her neighbours.
•About 50% (19) of the 40 patients said their work had been
affected by the disease and treatment. 15 of them were men.
•1 person was rejected by his employer.
•4 patients (2 men and 2 women) were unable to work, but could
not take rest as they had to earn for a living.
•Six (three men and three women) of them said they had to
mortgage their personal belonging to pay for treatment.
6
^©@@§gMo%
Most of the DOTS centres were located close to the communities'
residences.
Two women said they had difficulty in reaching the health centre.
However, none of the patients discontinued treatment due to
distance.
©
Being addressed as a "TB case" rather than by their
names.
®
Being ill-treated by the staff and being shouted at, for
not covering their mouth while coughing.
©
Fear to go back and face DOTS staff after discontinuing
medication.
Money demanded for services in government referral
health centres.
Most of the patients were happy with the DOTS centre staff
attitude.
Positive experience: One patient said "When they see me entering
the centre to collect the tablets, they would welcome me and ask me to
sit down, they speak to me well ivith joy, and they gave me respect".
Seven patients - four unde? treatment for
extra pulmonary and three under treatment
for pulmonary TB, said they did not
experience any side effects.
Thirty three patients - nine patients under
treatment for extra pulmonary and twentyfour under treatment for pulmonary TB said
they had side effects.
7
The following side effects were reported:
• Reduced energy levels
§ Sour taste
§ Loss of appetite
§ Nausea
§ Bitterness in the mouth
§ Giddiness
§ Feeling hot
§ Burning sensation in the stomach
§ Increased hunger
• Itchy feeling all over the body
Key issues
Doctor's support was available in managing side-effects in most cases but not
adequate.
•Seven of them said they discontinued
the treatment and started again.
The reasons for discontinuing were:
®§ Other ailments like fever and cough
® § Going out of town
©§ Cough subsided
®§Fed up of long treatment
®§ Difficulty to swallow nine tablets
fi@ tap®®
• Open the DOTS centre on time.
• Be courteous to patients.
•Keep the health centres clean.
"The room where they send people for sputum collection stinks" A DOTS centre user
Series of monthly training and reflection'sessions were held
for staff of non-governmental organisations working with
the urban poor by Community Health Cell and Bangalore
City Corporation.
Awareness sessions were conducted for urban poor
women s self help groups (SHGs) and community members.
Mass awareness programmes for the larger public were
conducted during World TB Day with National Tuberculosis
Institute, Karnataka State TB Association and Bangalore City
Corporation.
8
E-
Need for wider public awareness
for removing myth and misconceptions.
to seek treatment early at DOTS centres
to minimise people from seeking treatment at
unhelpful places
Social support for socio-economically weaker patients
Training and sensitisation programmes for health
service providers on health education and
communication
9
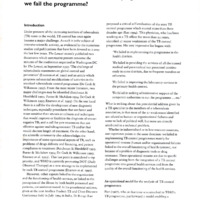
Position: 1751 (11 views)