HEALTH AND POVERTY
Item
- Title
- HEALTH AND POVERTY
- extracted text
-
RF_COM_H_70_B_SUDHA
LVg never had a strategy ///
P0VER;?^E RUTHLESS KILia
Eradicating poverty
—
/jfa very curious thing is that though we knew that poverty
/ ya existed in India, we don't find a discussion on poverty in
Indian context till late 1960's.
All the studies on poverty came into existence in the late 60’s
and in early 70‘s.
Why? Is it that the people earlier did not realise that poverty
was a major problem in Indian society?
The reason, to my mind was that in the 50’s and 60’s, we were
short of food grains. Perhaps, the planners felt while even those
who were already employed did not have enough food grains, what
was the point in thinking about unemployment and about those
who did not have the purchasing power.
After green revolution
After green revolution, and with the increase in food grain
production, I think, for the first time, there was optimism that we
had enough food grains in the society and that we could think
about the problem of poverty. A lot of studies ensued.
And the poverty estimates were based on calorie requirement.
ORP’‘,b V W HEALTH ACTON
,j;:T
t
'ICH.IW^------- a
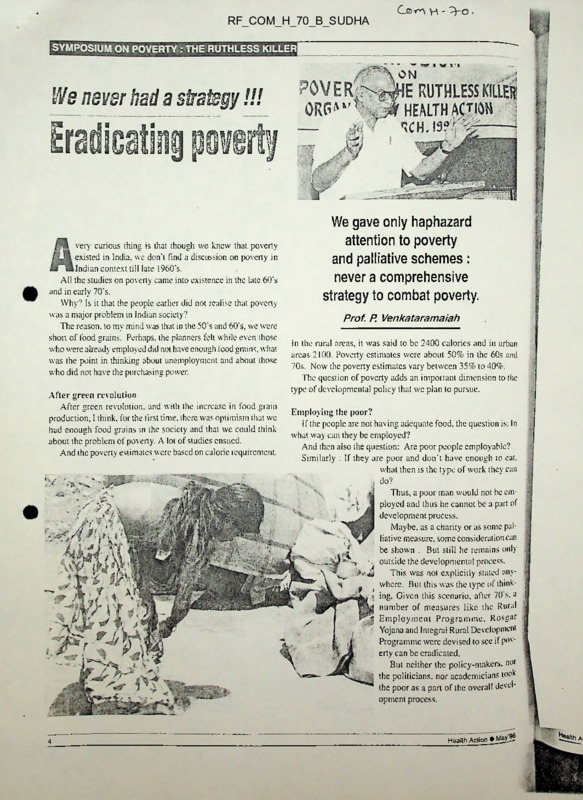
We gave only haphazard
attention to poverty
and palliative schemes:
never a comprehensive
strategy to combat poverty.
Prof. P. Venkataramaiah
In the rural areas, it was said to be 2400 calories and in urban
areas 2100. Poverty estimates were about 50% in the 60s and
70s. Now the poverty estimates vary between 35% to 40%.
The question of poverty adds an important dimension to the
type of developmental policy that we plan to pursue.
Employing the poor?
If the people are not having adequate food, the question is: In
what way can they be employed?
And then also the question: Are poor people employable?
Similarly : If they are poor and don't have enough to eat.
what then is the type of work they can
do?
Thus, a poor man would not be em
ployed and thus he cannot be a part of
development process.
Maybe, as a charity or as some pal
liative measure, some consideration can
be shown . But still he remains only
outside the developmental process.
This was not explicitly stated any
where. But this was the type of think
ing. Given this scenario, after 70 s. a
number of measures like the Rural
Employment Programme, Rosgar
Yojana and Integral Rural Development
Programme were devised to see il p<’v’
erty can be eradicated.
But neither the policy-makers, nor
the politicians, nor academicians took
the poor as a part of the overall devel
opment process.
Health Action •Way®?
poverty and quality of life
We will have also to think of the relevance of poverty to the
health status.
Social scientists are aware that we should not confine our
selves to only the economic dimension of poverty. For. the na
tional income or national expenditure does not capture all the
aspects of the general welfare of the people.
It is not the question of how much income you get but whether
it is reflected in the health status, in longveity.
The quality of life gets reflected in your longevity, reduced
infant mortality, literacy level, and so on.
In countries which were following a socialistic pattern, physi
cal quality of life seemed to be much better than what their in
come-level suggested.
If you take China, for example, on the ranking of income, it
comes much below, but on the ranking of quality of life, it comes
much above.
If you take Kuwait or some of the Arabic states, incomes are
very high there, but quality of life is low.
In Kerala, too, the per capita income is much below that of
other states, but the quality of life and health status is much higher.
Quality of life inspite of
Yes, India is poor. Her resources are low and her per capita
income cannot be very high; but does it put such a constraint on
resources that the quality of life cannot be improved'.’ That is the
question.
The question is all the more important now than it was a few
years ago. That is, in the context of the various economic re-
tf you are faced with international prices
and Indian incomes you will end up with
a situation where you build residences,
for non-residents. You
know in many places all
over Bangalore, Madras
and Hyderabadplaces
are allotted to non
resident Indians.
forms in the last few years.
The reformers pleaded that if you left
it to the market forces, poverty would
decrease.
Now you find large debates on whether
poverty has increased after the reforms
<>r has decreased.
Both the schools quote figures conve
nient to them. But implications are serious.
Healtn Action • May‘96
Prices and prices
The essence of the new economic policy is that you would
have a sort of a price level in this country which is in tune with
the price level abroad.
We seem to believe that we must move into a situation where
our price system will correspond to the international price sys
tem, so that the trade can flow in
both directions.
In this, I have a major objection:
it is good if prices are made equal;
but the price of labour cannot be
an exception.
You cannot have an economic
system where commodity prices
are equal across the borders with
out factor prices being the same.
The mistake we are doing is in
this that we want to have prices for
commodities the same but not for
factors.
If you arc faced with interna
tional prices and Indian incomes
you will end up with a situation
where you build residences for non
residents. You know in many places all over Bangalore, Madras
and Hyderabad places arc allotted to non resident Indians.
I cannot understand why non-residents need residences and
5
Real cause of illness
Public Distribution System
for Poverty Alleviation
Public distribution system (PDS) did not come up as a measure
of alleviating poverty. People in Andhra Pradesh and Kerala may
feel surprised if I say this, because there the PDS operates in ev
ery nook and corner of the State.
Originally, the public distribution system in the nation was drawn
for the urban people and not for the rural poor.
It was more a food security measure for the urban areas.
The other purpose was to
see to it that industrial wages
were restrained to an extent.
The logic: Indian industry
was not competitive compared
to that of the West and the prof
its of the Indian Industry had
to be ensured.
And Industrial workers were getting organized leading to a re
duction in the profit, making the Indian Industry non-competitive in
When I was discussing the
aspect of poverty with my
friend, he said, the main causes
or pin-causes for poverty in In
dia is 'U' and T. ‘U’ stands for
underdevelopment and ‘I’
stands for inequality. As a
medical man, when I see a
child with diarrohea, I have to
treat that child again and again
unless and until I extend my ho
rizon to the state of poverty
which is the root-cause.
For me, the root-cause is
poverty. Even when I see a
child wandering in the street
and not attending school, I feel
the cause is same poverty.
the process. Hence the urban prices for essential commodities
had to be kept low lest workers might demand higher wages.
The public distribution system, thus, was not meant as a pov
erty alleviation measure at all.
Somehow it has wrongly been ingrained in our minds that it is a
subsidised scheme for the poor.
Again, Food Corporation of India is doing the function of support
prices and not that of procurement after 70’s.
The difference between the open market price and the Food
Corporation of India (FCI) price has almost vanished. We cannot
think of a public distribution system based on the issue prices of
FCI as a poverty alleviation measure.
PV
As a conscious citizen, and
as a health professional, until
and unless I extend the equa
tion of drug-disease-and-office,
to the real cause of the health
situation in the country, that is
poverty, I would have failed in
my duty.
Dr DV Ramana at the
symposium
Health Action • May'96
Strange Reforms
the local residents are to be thrown out.
We end up with this situation because
the residents do not have the incomes of
non-residents.
Health prices
This has also great implications for
health. International drug prices are in tune
with the incomes of populations else
where. and not in tune with the incomes
of our own population.
What then about the health status?
Fortunately, it is not the drug technol
ogy that has a major role in improving the
health condition of the population as nu
trition, sanitation and indigenous systems
of medicine.
Employment and poverty
We know when people do not have em
ployment. they are poor.
But I must say also, that we should not
confuse unemployment with poverty.
If you look, the State with maximum
employment is Bihar. Unemployment is
lowest in Bihar and much higher in Kerala,
Maharashtra and so on.
Reason: It is only a rich man who can
afford not to work.
A poor man cannot. Whatever work
he finds, he has to do. Maybe if he is
'cry poor, he will even just sit before your
office and sell a few toffees. He purchases
Health Action • May'96
for 50 paise and tries to sell at 55 paise
and at the end of the day makes Rs.2/Hc must at least make that rather than do
nothing.
So when I say employment, I mean em
ployment at a level of a reasonable in
come.
Areawise approach
What is it that we can do if we want to
really alleviate poverty in such a situation ?
You know we have various schemes
like Employment Assurance Scheme, In
tegrated Rural Development Programme
(IRDP). Nehru Rojgar Yojana. etc. Actu
ally a stage has come wherein we put all
the money under these various schemes
together.
What we must rather do is to take
an area, district or a mandal, look at
what money is available, and supple
ment, if necessary, and have an employ
ment-guaranteed scheme.
When I say an employment gurantee
scheme, an employment with gurantee of
a minimum wage.
And this I think is possible and feasible.
This is the way to attack the poverty
problem.
(Excerptedfrom the keynote address by
Prof P Venkataramaiah at the symposium
on “Poverty : The Ruthless Killer")
Very strangely while from the
decade of 40’s to 70’s the State
control, state regulation and
state participation were consid
ered virtues and the market or
the free enterprise and private
enterprise were said to have
obvious limitations in delivering
public goods, the thinking
changed from 80’s onwards.
Then a thinking set in that plan
ning had obvious limitations and
that there were virtues to
the free market.
Prior to 80s the rate of growth
has been 3.5%. From 80 to 90
it was growing at 5.5%. And the
decade of 80's had been very
good for us as the queue for a
large number of goods had
come down. For example,
scooters, cars and TV because
of free availability.
It was not because the poli
cies of 80’s were made by a dif
ferent set of people or by an
other person. Only there was a
shuffling of chairs but not of the
people who made the policies.
Very strangely, it was the very
same people like Dr Singh,
Mr Venkataraman, etc.
— Dr Venkataramaiah at the
symposium
tn bn POVERTY.: THE RUTH
’
\ \ s »■'
over Story
fll
< s
■'or example, the statistiH. E., Shri Krishan Kant
Governor ofAndhra Pradesh
ians told us that India has
ec^-d food grain produc-
un which was over 191
million tonnes in 1994-95.
7zey did not care to tell us
hat this record food grains
production yielded only
:10 Kg offood grains per
■erson per year, which was
■ot enough to keep body
■ nd soul together.
“Millstone”
in most developing countries, poverty is a millstone which could not be cast off
despite years of serious effort. Significant sections of the population continued to live
in abject poverty and hopelessness, deprived of an assured minimum income, suffering
inadequate nutrition level, without health care and education.
Its social consequences were quite manifest.
Child mortality remained high, life-expectancy was low, the resistance to diseases
was insufficient, and the number of women dying in child-birth was high.
The sum ‘otal was that even when economic development revealed a statistical drop
in the levels of poverty, significant sections of the population continued to suffer on
account of its widespread prevalence.
The wretchedness of their lives had other fall-outs such as high levels of crime,
addiction to drugs and exploitation of women.
Deepening wretchedness”
That poverty needs to be tackled as the central focus of the economy is
unexceptionable.
There is wide divergence of opinion among experts about the methods to
find solutions for the problem of poverty.
This issue has assumed even greater importance in the wake of the ongo
ing world-% 'ide debate on the choice of the economic model for accelerated
growth.
Much of toe Third-World had languished in the race for gaining expedi
tious rewards Tom economic growth.
The internati onal politics and cold war put such strong onus on the politics
of national security espoused by the power blocks that many a newly inde
pendent state of Asia and Africa and Latin America could never muster requi
site resources or even the will-power to choose the right economic course for ;
accelerated growth.
Welfarism became very good politics although it was doubtful if it could
be good economics.
The block politics forced the third-world countries to spend disproportion
ately large sums of money on maintaining armed forces and purchase of ex
pensive defence hardwar e from the Eastern and Western blocks, leaving veIT
Health Action
1 1
little to meet such critical infrastructure requirements such as clean drinking water,
jecess to health care, universal education and employment.
Significantly, during the past 50 years of the cold war, a majority of the armed con- wars,civil wars, insurgencies, guerella warfare etc., occurred principally in the
y^jrjworld countries, where a majority of the world’s poor resided.
The politics of the cold war years reduced the Third-World merely to a front to be
used, exploited and discarded by the two chief power blocks.
The result was a stunning increase in world-wide poverty during the cold war period
3nd a deepening of the wretchedness of the world’s poor.
Statisticians’ field-day
The end of the cold war led to a flurry of activities, both in the developed and devel
oping worlds - euphemistically described as North and South - aimed primarily at re
solving the problem of poverty.
The statisticians had had a field-day describing what was poverty and then changing
the description and then again re-changing it.
But. as always, what the statisticians said was important but what they did not say
was even more important.
For example, the statisticians told us that India had a record food grain production
which was over 191 million tonnes in 1994-95.
They did not care to tell us that this record food grains production yielded only 210
Kg of food grains per person per year, which was not enough to keep body and soul
together.
The statisticians advised us to celebrate the fact that India was exporting food grains,
whereas China was importing it.
We were one up after all.
It was left to us to read between the lines and to remind ourselves that if we had an
efficient public distribution system, reaching food where it was needed most, we would
never have adequate surpluses for export.
Even when there was dramatic reductions in poverty, the off-take of both wheat and
rice, the staple food of India’s poor, had been declining over the years.
In the year 93-94, the off-take of rice was 8.88 million tonnes as against 9.36 million
tonnes in 92-93 and 9.94 million tonnes in 91-92.
Similarly, the off-take of wheat in 93-94 was 5.86 million tonnes as against 7.41 and
8.78 million tonnes in 92-93 and 91-92 respectively.
It may be interesting to assess the reasons for this declining off-take of food grains
from the Public Distribution System (PDS), which caters to the needs of the poor, espe
cially in the rural areas.
It is nobody’s case that the Indian poor have suddenly become so rich that they have
stopped going to the fair price shops to stand in long queues and suffer the uncertainties
of supply, and, instead, buy their supplies from the super market.
The low off-take from the PDS is perhaps an index of inadequate pur
chasing power of the rural poor.
Another index
Another significant index is the performance of our agricultural sector in
,crms of its contribution to the national Gross Domestic Product (GDP).
Over the years, although the contribution of agriculture to GDP has been
declining, the number of people dependent on agriculture for their living has
remained more or less unchanged.
>s unlikely that their wages have remained unaffected by the progresSlve decline in agriculture’s contribution to national income.
Critical factors
^These indicators really point towards the complexity of the problem of
^cry often, the choice of the methodology to compute the levels of pov-
It was left to us to read
between the lines and to
remind ourselves that if
we had an efficient public
distribution system,
reaching food where it
was needed most, we
would never have ad
equate surpluses for
export.
is nobody’s case that
the Indian poor have
suddenly become so rich
that they have stopped
going to the fair price
shops to stand in long
queues and suffer the
uncertainties of supply,
and, instead, buy their
supplies from the superMarket.
erty results in different statistical outcomes,
An excessive focus on nutrition levels, as is adopted by our Planning Commission,
docs show declining trends in poverty in purely statistical terms.
In all probability, it will be a correct estimate as well but it may underplay the impor
tance of such critical factors as feeling of security, optimism of outlook, self-confi
dence of the family etc.
A decline in quality of life can happen even in the midst of plenty and a constantlyrising economic curve.
Aping the west
The tragedy of a majority of the developing countries is that in trying to ape the
economic success of the west, they are squandering their own age-old social resources.
Take for example social security.
In the Western countries, billions of dollars are spent in providing social security in
terms of old-age pensions, old-age care homes, unemployment bonus, and other variet
ies of doles.
Contrast this with the systems of families taking care of the aged and infirm preva
lent in most countries of Asia.
For almost no cost, a remarkable social security system has come to exist through the
sheer force of history for thousands of years.
Our duty is to build further upon it and to profit from it rather than to squander it in
a hopeless pursuit of the western Eldorado.
I urge the Symposium to consider whether it serves our purpose to view poverty
through the blinkers of statistics as the Westerner does, or we can tap the very
great resources available in our socio-cultural environment to overcome the chal
lenge.
It is my belief that we can fight the wretchedness of poverty by strengthening
our age-old social institutions and make a significant difference in the lives of a
significant number of people.
An individual can feel secure if he is supported by the right social institutions.
even in a regime of relatively low wages.
The cost involved in creating institutions providing social security is impossible to be borne by most developing countries.
It is unnecessary as well because most of the developing countries have his
torically-created social institutions which are a good and adequate security-cover
for the poor.
I am not suggesting that this could be the only solution to the complex prot>"
lem of poverty but I am sure it can suggest a new approach and perhaps a ne*’
model which we can commend to the world.
I shall be happy for a debate on this subject.
***’
(Inaugural address at the symposium on 2 March, 1996 organized by
HEALTH ACTION at Secunderabad)
16
Health Action •APJ^
Prof. P. Venkataramaiah
PI
U vJot only the right to live but also the right to live with dignity is a basic human right
After nearly five decades of independence, while the percentage of the poor has
declined from 55% to 30%, it has grown in terms of absolute numbers.
The recent estimates show that twenty-five crores of our population live under povcrty. In the sense that they do not have the minimum calorie requirement.
The irony
Most of the diseases in the
developing countries are
rooted in undemutrition
and unhygienic living con
ditions associated with
poverty. The solution to
health problems lies in
eliminating poverty.
With the green revolution and the growth of food grains output, the average per
capita food availability is enough to meet the nutrient needs of the population.
But there is not enough purchasing power with some sections of the people to satisfy
their basic calorie requirements.
• It is a cruel irony that we have a huge buffer-stock of grains of about 35 million
tonnes and twenty-five crores of people without enough food.
The economic reforms of the past years have not had any beneficial impact on the
poor. If at all, there is a feeling, that has an adverse impact.
Health and poverty
■ ■■■’
'■ i'':!
What is the role of poverty in determining the health status of the population? His
torically, it is the availability of food that has resulted in the decline of mortality-rates ' J
in European countries.
•..;
If you look at India, it is felt that it is the advances in the medical sciences that
reduced the mortality-rate in the Indian context. That is, with the control of epidemics.
But, whatever control that can happen by eradicating epidemics has already hap
J
pened.
And the further morbidity that exists in the nation cannot be controlled, or
further improvement in mortality cannot be achieved, unless poverty is elimi
nated and enough nutrition is made available to the population.
Most of the diseases in the developing countries are rooted in undernutntion and unhygienic living conditions associated with poverty. The solution
to health problems lies in eleminating poverty.
Not difficult
It is estimated that in the Indian context, the resource required to eliminate
poverty is of the order of 10% of our national income or above one lakh crore
of rupees.
If you want to limit to the elimination of severe malnourishment and hun
ger or extreme poverty, it is said that it requires 4% of our national income
which comes to forty thousand crores.
And, this is not such a large amount.
If there is a political will, this is something which is within the manage3
reach of our economy and our resources.
I think, we should remember that poverty anywhere is a threat to Pf0S^
ity everywhere.
(Presidential address at the symposium.
Prof P Venkataramaiah is the Director of
Centre for Economic and Social Studies (CESS), Hyderabad)__________________
_ ____________ .___________ :—.tS/J
_____________________________________________________________________ Heallh Action 5/54—
Symposium on POVERTY : THE RUTHLESS KILLER
Cover Story
tert @81) tert©
T@ Iraite®
Under the present situation,
we need not expect much
Fr John Vattamattom svd
fi
£~u few days ago, I happened to be in Allahabad and I visited the Anand Bhavan. The
experience touched me deeply.
That was the place where people, like our beloved Father of the Nation and our first
Prime Minister and others, took very important decisions. And, when they took such
decisions, they had before their eyes the well-being of the people of this country.
Walking around the place that day, 1 was trying to compare that with the present
scenario and I could not help but be moved.
What a difference between the thinking of our leaders then and the thinking of our
so-called leaders now!
And, if poverty is the major sickness today, especially in our country, I think all of
us, especially our present leaders, are responsibile for that.
We need to look into the various aspects of this very important but very disturbing
topic : Poverty: The Ruthless Killer.
Actually, the biggest sickness we have in the country and the world today is poverty.
Poverty is not simply a state of affairs but a sickness by itself.
We need to question the effectiveness of the type of remedial measures taken by the
government, and particularly of its new economic policy and all that.
This, especially with regard to the ordinary people of this country whose number
unfortunately is on the increase.
The remedy for the sickness of poverty in this country cannot be found except by
People themselves, people coming together.
The peoples’ strength is what we can count on. And we have certain examples
cven in this state of Andhra Pradesh. Especially, the women’s initiative in the matter
°f prohibition and so on.
Unless the people take these things into their own hands the situation will not
change.
And, under this present situation, we need not expect much from our political
leaders.
Gandhiji’s principle of "Antyodaya" has to be held up. And it has to be implen,cnted through all of US.
And people need to come together and take decisions.
And they should say; we have something to say about our own destiny and days.'
Such days will come if all of us work together.
IICT
(Introductory talk at the symposium.
Fr John Vattamattom svd, is Director-Emeritus,
The Catholic Health Association of India, Secunderabad).
More pieces from the symposium will be published in the subsequent issues.
■~SSjAction » April'96____________
_______________________
from our political leaders.
Gandhiji’s principle of
“Antyodaya” has to be held
up. And it has to be imple
mented through all of us.
And people need to come
together and take decisions.
And they should say; we
have something to say about
our own destiny and days’.
t
Cover Story
A
with
tati«
J
they
by cl
i
Indian economy has
I
Dr Sr Placida Vennalilvally |
j|own and is growing
due to the modernization
butic
to tbi
tioai
in so
to th
of th!
green revolution and
latest technologies in the
agricultural sector.
But, this positive
progress of the economy
is marred by the ugly fact
that massive poverty
cmei
Wbi
H
pcoji
P
A overly is a situalion in which an individual fails to earn an income sufficient to buy
him/her bare means of subsistence.
;
It is a severe lack of material and cultural goods which impedes the normal develop
ment of individuals.
The number of poor estimated in the rural areas is about 168 million. They arc
landless labourers, fisherfolk, backward classes and backward tribes.
The urban poor are about 42 million who are immigrants from villages, living in
slums and on pavements.
crtyj
continues to exist.
Poverty: the killer
Poverty is the biggest single cause of
death, disease and suffering in the world.
Adequate income is basic to adequate
diet. Poor people do not have money to
purchase food.
The houses of the poor are not only over
crowded but they lack privacy, too. Pov*
erty forces them to live in sub-standard
houses which weaken the family solidarityPovcrty contributes also to mental ilJnesSr
stress, suicide, family break-up and drug
abuse.
The poor are harassed, humiliated
discriminated against at every level.
Unrepresented and powerless
Problems faced by the poor in our
ety are many; social discrimination, s00*
condemnation and homelessness.
Being unrepresented and powerl
they are always the target of attack *
hostility by the powerful, thus l«we
C'j;
heir self-image and creating in them a
feeling of inferiority complex.
The demoralising and dcterimental ef
fects of poverty are not confined to individual suffering only, but is also a danger
io the nation.
,\s Gandhiji said '’The cry of the poor
should not remain unheeded."
A limited income restricts people to live
with deteriorating houses, inadequate sani
tation. crowding and lack of privacy.
The poor are isolated from society. And
the' move about from place to place. Not
bv choice but by necessity.
They are ill-equipped to cope with
emergencies.
What are the causes?
Hunger and malnutrition of millions of
people are the result of the unjust distri
bution of resources, and production due
to the interests of selfish people, corrup
tion in public life, and massive investment
in sophisticated weapon-systems leading
to the neglect of even the primary needs
of the poor.
Economic and political causes of pov
erty are
®
unwise economic policy,
~
unequal distribution.
—
population growth,
H
unemployment,
®
unproductive hoarding and
®
economic depression.
nwise policies
There are policies which forcibly reduce
agricultural production and policies that
iurther the pauperization of women and
1
children.
Iherefore. poverty is the result of not
">!? individual greed but also the way our
' ciety and our economy function.
I he beneficial effects of growth do not
" ich large masses of the people due to
'-r development strategies.
Our efforts were not sufficient to ab’>rb the hacklogofunemployment and the
‘'•ng labour force as also to meet the con’“•hption needs of the people.
Another significant factor, which pre
dated benefiting from growth has been
"t widening inequalities of incomes.
Total amount of the subsidies meant for
’ - poor too is inadequate. And they do
‘ reach the poor.
vnder the ceiling policy, there was
much surplus
land for distri
bution. But,
in most cases,
the owners
have
par
celled out the
ownership
among rela
tives. friends
and even ser
vants so that
little remain
as surplus.
Thus de
velopment
strategy was
neither
enough nor
effective to al
leviate pov
erty.
Concerted ef
forts
How do we
solve these
problems of
the poor?
The ideal
solution in
solving the
problem of
massive pov
erty lies in making poverty reduction the
core of planning strategy.
We need to provide large employment
opportunities and raise the provision for
social consumption by the poor. Special
measures need to be undertaken for the
landless agricultural labourers, artisans,
hill area people and tribal population who
lack assets and skills to earn and stand on
their own feet.
We need to be aware of our social re
sponsibilities and change the consumerist
behaviour and combat hedonism and our
indifference towards poor.
Let us all, politicians, economists, in
dustrialists, educationists and social work
ers together crusade against poverty.
We shall thus become builders of a
prosperous, democratic and progressive
nation, enabling us to create social, eco
nomic and political institutions ensuring
justice and fullness of life to every man
and woman.
gjjj
The number of poor
estimated for the rura
areas is about 168 mil
lion. They are landless
labourers, fisherfolk.
backward classes and
backward tribes.
The urban poor are
about 42 million who are
immigrants from villages,
living in slums and or.
pavements.
C Or^ M -
POVERTY & HEALTH
Meeting with Ravi
23.01.99 and on 08.02.99
This was the first meeting to discuss the forthcoming WHO workshop on Poverty and Health
in South Asia.
The focus is
* What is poverty - what are the various definitions?
•
How is it measured?
1. How is poverty measured
2. Who are the poorest
3. What are their conditions
4. Where are they distributed - Karnataka - BIMAROU - India - S.Asia
-
What are the causes of poverty?
1. At the local level
2. At the State level
3. At the National level
4. At the Regional level
5. At the Global level
»
The effect of poverty on health and vice versa, the effect of health on poverty
1. How does poverty impact on health
2. What are the other determinants
3. How does health (or rather the lack of it) affect poverty
4. What is the impact of a lack of access to health resources for the poorest.
=
WTiat is being done to change poverty
1. In terms of health inputs
2. In terms of other inputs
My role is to read up relevant literature on S. Asian experiences so that we can develop a
book that will be presented at the workshop.
The focus is on South Asian poverty.
Keep a look out for appropriate publications, individuals, case studies.
WHAT IS POVERTY?
Definitions
Poverty is more than the lack of what is necessary for material well being. It can also mean
the denial of opportunities and choices most basic to human development. Human
development is “a process of expanding human choices and enabling people to enjoy long,
healthy, creative lives with a decent standard of living and to enjoy dignity, self esteem, the
respect of others and the things that people value in life."1
At present the focus is on Nutritional definition of poverty But it does not take into factors like
security, self esteem and quality of life.2
Many types of Poverty
Inherited Instant, Temporary, New Poverty, Relative P~. Absolute P~ Hidden P~, Endemic
P~, Overcrowding P~, Terminal P~.
Basic Needs are
Physical needs (food, water, sanitation, sleep)
Environmental needs (shelter, fuel)
Social and spiritual needs (affection, sexual, privacy, human rights)
Persona! and Communal assets (access to land, water, forests, grazing, roads, transport,
education/health services and productive employment)3
' RM 2
- RM 9
’ RM 16
HOW iS POVERTY MEASURED?
What ar© ths indicators^
Who are affected by it?
What are their conditions?
Where are they?
More than 3 million of New Delhi’s 11 million live in slums. Another 3 million fleeing rural
poverty are expected by the year 2000 AD1
Human Poverty Index - It provides an aggregate human measure of the prevalence of
poverty in a community. It measures
1
Survival and longevity: the vulnerabilty to death at a relatively early age. This is
represented in the HPI by the percentage of people expected to die before the age of
2
3
Knowledge: being excluded from the world of reading and communication. This is
measured by the percentage of adults who aare illiterate.
Decent standard of living, in particular, overall economic provisioning. This is
represented by a composite of three variables - the percentage of people with access
to health services and to safe water and the percentage of malnourished children
under five.
Value
Country
35.9%
India
____
Pakistan
46%
Myanmar
27.5%
Bangladesh
46.5%
Bhutan
44.9%
_______________________
Indian statistics
%age without access to safe water (90 - 96)
%age without access to health services (90 - 95)
%age of undernourished children (90 - 97)
%age without access to sanitation
%age of population not reached Class 5 (1995)
%age of pop. Living on an income < USS1 per day
19%
15%
53%
71%
38%
52.5%
There is poverty also in the industrialised countries (100 million below the poverty line, 37
million unemployed, 100 million homeless and 200 million with a life expectancy < 60yrs)2
Feminisation of poverty - some of the causes
«
Discrimination in nutrition. Increasing food costs will worsen this situation. The
average wt of women has remained the same from 1956 to 1992.
•
Discrimination in access to health care, esp during child birth
□
Susceptibility to infections, e.g. TB, malaria
s
Mental trauma leading to suicides, burns.
•
Violence against women3
Qijrrar|| SCSDSriO Of pOVCfty
36% of pop. Below poverty line in S3 -94
Totally 320 million of which 244 million are in rural areas (30% of rural pop.)
Incidence of poverty has decreased from 56% (73) to 36% (93)
GO! Those who consume < 2.435 Kcal per day. This measure was first developed in the
1930s by the Bombay Labour Enquiry Committee to measure poverty in Sholapur. It was
subsequently developed by the Planning Commission in 1962
Only 35% of pop is below the Poverty line.
A poverty line is a too! for measuring poverty and for seperating the poor from the non-poor.
It is constructed according to the value of income or consumption necessary* to maintain a
minimum standard of human nutrition and other basic necessities E.g. it can be drawn
based on a minimum wage or a minimum caloric intake necessary to sustain human life.
Head Count ratio - counts the number of people below a specified poverty line. However, it
does not show the various levels of poverty within the groups.
Poverty lines do not generally include other factors which determine quality of life (access to
safe water, basic public services).
One definition of poverty line - anybody with <1.5 acres of land and having to sell their
labour for > 90 day's a year.
Drawing poverty lines should be different for urban and rural pop. E.g if an income is taken
as the cut off, a specified income can buy more in a rural area compared to an urban area. It
has been suggested that a higher poverty line be drawn for urban areas.
The situations of those just above the poverty line may be no better than those below it. As
conditions fluctuate they* may go below it.
Consumption data is superior to income levels as the latter vary with employment.
Ths line is ususBy drawn to reflect consumption/income which wB! sustain human life. It is
also important to find the severity of those below the poverty line In one situation, most may
be just below the poverty line while in another situation, most may be way down. This is
called the Poverty Gap index and is measured by
PgunHy ]ing ryjgon income of those below ths povssT'1
7 line
6
5
*4
Poverty line
When looking at the PL, disaggregate - rural/urban; M/F; class; also look at the trends
(incidence of poverty).6
Poverty profiling is an analytical tool for rapidly and systematically identifying more clearly the
poor, where they live and what causes and characterises their poverty. This can be done in a
participatory way with the people themselves identifying the poor. It can be done at various
levels. But the outcome depends on who is doing it. Some tools from PRA can be used, e.g.
wealth ranking, semi structured interviews, FGI, etc.
Household and community surveys can also be used to identify the poor. The other
possibility is to look into existing records.7
1 RM 1
' RM 2
7 RM 6
4
KM 7
5 RM 12
6 RM 16
7 RM 17
WHO IS POOR?
Poverty profile - landless or small landowners, small scale artisans and traders; female
headed households: low wage workers; unemployed; marginalised indigenous populations;
nomadic herdsmen and pastoralists; small scale fishermen; refugees and displaced persons.
The most vulnerable in a population are those for whom multiple deprivations converge lack of food, shelter, water, health care, education and employment In any place the most
vulnerable form the bottom half of the pop Some people tend to move in and out of absolute
poverty.
Increasingly women are being hit by poverty. This is because the %age of female headed
households are increasing. Also women are being exploited on the job front by being paid
less. Increasingly cutbacks in Govet services increases the burden on the woman - e.g.
home based care for AIDS patients 1
Among the most poorest and the vulnerable in some countries are the indigenous people.
Their rights to land, natural resources and lifestyles have been continually eroded whether by
the Govt or by the settlers or by MNCs.2
Those suffering from inadequate shelter are usually women children, displaced
communities, older people and people with physical and mental disabilities.3
’ RM 16
" RM 17
' RM 18
WHAT ARE THE CAUSES OF POVERTY?
At a local - state - national - regional - global level
4 billion people have been excluded from the consumption revolution. 3/5 of them live without
basic sanitation, 1/3 without safe drinking water; 1/5 have no access to health services; 1/5
do not get primary education; 1/5 of the children are undernourished Some of the reasons
for this exclusion are
1
Lack of re-distribution of income
2
Disinclination to shift from a polluting to a cleaner technology
3
The need to promote goods that empower poor producers and
4
The Neglect to shift from consumption to meeting basic needs.
Expanding consumption strains the environment, which can deplete and degrade renewable
resources. Consumption is usually by the well of while the effects of the degradation are on
the poor.1
SE'A'A believes that poverty is created by those who exploit others and capitalize on their
vulnerabilities.2
Feminisation of poverty - some of the causes
=
Discrimination in nutrition, increasing food costs will worsen this situation. The
average wt of women has remained the same from 1956 to 1992.
»
Discrimination in access to health care, esp during child birth
Susceptibility to infections, e g. TB, malaria
=
Mental trauma leading to suicides, burns.
•
Violence against women.3
Arms race has led to much diversion resources for defence rather than welfare or
infrastructure development (like water, health care, education and employment).4
Unjust distribution of resources. Corruption. Arms race. Unwise economic policies.
Population growth. Unemployment. Inadequate land redistribution efforts.5
Kalahandi in Orissa and Tikamgarh in MP are supposed to be the most backward districts,
considering the ‘distress deaths’ Yet Kalahandi’s per capita rice production is the highest in
India. And Tikamgarh is the highest wheat producing district in MP. The distress deaths are
not due to lack of food, but the inequitable distribution. In kalahandi, only 25% of the grains
produced there is consumed there. Rest is exported to the rest of the country by the
merchants. In both these districts, a few very prosperous people profit from the misery of the
large majority.
The health budget in India for PHCs is Re 0.50 per person per year. This has remained static
since the 1980s. The State's contribution to Health has fallen from 3% of total Budget (in the
1st Five year plan) to 1.05% in the 8lh Five Year Plan.6
20 main causes of poverty
1
Inequity
2
Unemployment
3
Small landholdings
4
No access to credit
5
Producers get minimal returns - most profits go to middle men
6
Cuts in social sector
7
Little access to modern technology
8
No democracy
9
Non supportive legal system
10
Poor environment
11
Privileges retained by the elite
12
Neglect of traditional systems
13
Ecological degradation leading to disasters
14
Civil war
15
Gender bias
16
Alcoholism
17
Illiteracy
18
No access to health care
19
Lack of water
20
Colonial conditions continue
Rapid urbanisation is one of the main cause for urban poor. In 1900, 10% of the pop were
urban with only one city (in China) with a pop >1 million, by 1950 it was 30% with 26 cities
with pop > 2 million. The slums are growing at twice the rate of cities, Calcutta’s 67% of pop
are in slums. Some of the causes of this urbanisation are migration for jobs, displacement
and disasters in the rural areas (economic/environmental refugees)*7
Corrupt practices which prevent the poor from escaping the poverty cycle
•
Passing agrarian reforms without implementing it
=
Elite hijack funds intended for the poor
•
National teaching hospitals absorb most of the health budget
=
Leaders ignore unjust practices like bonded labour
•
Distortion of welfare programmes, e.g. sick animals given to beneficiaries or poor quality
of grain supplied in the PDS
»
Informal fees paid to doctors/nurses for treatment
» Drugs and medicines siphoned from the hospitals/HCs
• NGOs use programme funds to further the Director's needs
Tourism and its effect on worsening poverty. Some are prostitution, STD, unwanted
pregnancies, inappropriate diets thanks to ‘fastfoods' displacement.8
Lack of access to legal aid and advice. The law enforcement agencies are usually on the
side of the rich/oppresor/gangs/elite. (Case study from Yellamalai)9
’ RM 2
7 RM 3
' RM 6
4 RM 9
' RM 10
RM 1 I
RM 17
" RM 20
’ RM 21
CASE STUDIES
ASHA - works in the slums of New Delhi. Has trained Community Health Workers who
conduct deliveries at a fraction of the cost of hospital deliveries. These are women who are
from the slums and provide MCH care to the mothers and children. They have reduced
severe malnutrition from 47% to 4%. Immunisation coverage is at present 97% (as compared
to 15% in 1989). The Eligible couple’s protection rate has also increased from 8% to 45%.
The CHWs are also members of women’s groups who lobby Govt to regularise their land
holdings.The Govt responded and today 475 families have responded.1
SEWA has a twin strategy of development along with struggle. While organizing women, it
ensures employement and meeting the women’s basic needs. The women have been
struggling for the rights of the vendors, for minimum wages, for access to credit, for
employement, for social security, for women’s control over forests and lands. At the same
time it felt the need for building Alternative Economic Organisations like co-operatives and
unions. Some of the institutions built are the SEWA Bank with a membership of 81,000 +
members and a working capital of Rs 180 million. SEWA believes that
® Strengthening, protecting and promoting employement, especially self - employement, is
the most effective way to combat poverty
*
Building alternative economic organisations - co-operatives and producer groups - is
essential for the poor to emerge from the cycle of poverty.
» A joint action of struggle and development — union and cooperative - has resulted in
significant gains for the poorest workers.
• A holistic and integrated approach - which combines work and income security as well as
food and social security is essential to break the chain of poverty.
- Critical inputs like access to raw materials, markets, capital, skills, capacity building of
workers in management and enabling policies (minimum bureaucracy, access to
resources like land water, forests) are needed to develop and strengthen worker owned
economic organisations.
•
When poor women lead the struggle against poverty, the whole nation prospers.2
Fatima Bi of Kalva Village, Kumool District.3
NDDB with its dairy co-operatives has produced income to the tune of Rs 50,000 crores for
the women of this country. It tried the same with oilseeds, fruits and vegetables, but thanks to
bureaucratic intereference could not proceed as expected.45
Page 107s
Case studies from Yellamali - KN
Case studies in organ sale
1 Rm 1
2 RM 3
5 RM 5
4 RM 14
5 RM 21
WHAT ARE THE EFFECTS OF POVERTY?
Poverty on health
III health on poverty
Child labour is one of the effects of poverty. In S. Asia there are 80 million children in
servitude
India - 55 million (41.47 in agricultural occupations, 7.6 million in manufacturing units, 1
million each in brick kiln, stone quarries and construction, 0.14 million in transportation, 1.52
million in trade and commerce and 0.84 million in circus, cinema, begging and rag picking.
Pakistan - 10 million (7.5 million in agriculture, 0.5 million in carpet industry, 2 million in brick
kiln otr \
Bangladesh - 10 million (9 million in agriculture)
Nepal - 4 million
Sri Lanka & Madives - 1 million
Bhutan - 0.1 million1
Effect of poverty on health
®
Low Birth Wt
=
Unaided delivery leading to increased potential for mortality (matenal and
neonatal)
=
Increased infections in the infancy leading to high IMR
»
Malnutrition and infectious diseases in the childhood leading to stunting
•
As they grow their productivity decreases2
In 94 - 95 there was “a bumper crop of grains" - 191 million tonnes. But per capita this 210
kgs per person per year, which was not adequate for the needs of the average person. On
top of that we exported food grains, thus reducing the availability even further. The uptake of
grains in the PDS has been reducing over the years
1991 -92
Rice
(Million
tons)
9.94
Wheat
(Million
tons)
8.78
1992-93
9.36
7.41
1993-94
8.88
5.86
Year
j
This low uptake is probably due to the diminishing purchasing power of the poor.3
In 1995, India apparently had a buffer stock of 35 million tones, yet 250 million people did not
have enough food to eat!
According to a senior administrator, at least a third of the country is under what we may call
low intensity civil war. Parts of Bihar and AP are virtually ungovernable. Dogged battles are
being fought over land, water and forests.4
Poverty is not only whether one can afford a bundle of goods but also what prevents one
from doing so. Being poor in India means the lacking good health and skills to make the most
economic opportunities. Being poor also means a very high chance of being illiterate - 45%
of illiterate households are poor. 1 /3rd of boys and <1/10th of girls in poor households reach
the 8th standard.5
The poor have higher mortality figures compared to others - Guatemala - MMR = 243 for
remote areas as compared to National average of 106.
Poverty may have different effects depending on the circumstances. Example poor, rural
indigenous people may actually have a healthy life because of their lifestyle and access to
basic resources like food and water On this front they may be better off compared to the
urban slum inhabitant On the other hand they may be vulnerable to violence from
developers and Forests Depts.6
Unemployment leads to reduced food intake, stress on personal and social relationships,
reduced access to health services, and increased health damaging life-styles like smoking.
alcohol and violence.7
Poverty usually leads to reduced intake of food This is governed by factors like
= Access to land and agriculture
•
Food crops Vs cash crops
• Seasonal variation -eg pre-harvest
•
Preference to “modem foods’’ and animal foods
•
Household expenditure pattern
» Allocation of food within a household
The urban poor usually live in crowded slums. The 'houses’ are small and cramped and often
dark. The floor is earthen. Safe water and sanitation is usually non-existent. The ‘wretched’
are the pavement dwellers who don’t have the luxury of having a roof above their heads or
walls around them. They are at the mercy of the elements. This poor shelter results in water
and vector borne diseases. Crowding allows measles and TB to spread rapidly. Lack of
ventilation results in pollution from cooking fuel causing respiratory and eye problems.
Very few of the poor have access to safe water and sanitation (give figures). Diseases
caused by contaminated water are
1. Diseases caused by the ingestion of contaminated water - e.g diarrhoea, cholera,
typhoid, dysentery, hepatitis, etc.
2. Diseases caused by insect borne vectors - debgue, malaria, filaria
3 Diseases caused by lack of water - scabies, trachoma, lice
4. Diseases caused by parasites in the water - helminthiasis, dracunculosis, amoebic
dysentery, etc.
All these diseases cause untold misery, morbidity and mortality among the poor, (give
figures)
Lack of potable water has other implications also for the woman
®
Fatigue in collecting the water
=
Backache, arthritis, slipped disc
=
Miscarriage
• Time and energy(12%) can prevent the woman from doing other useful work like nonformal education or child care.
Inability to grow a kitchen garden or raise small livestock
=
Even safe child birth may not be possible
Poverty can affect a person from conception to death. This is given in detail in page 47 - 59.
Some of the common diseases of the poor other than the above are Malaria, TB, worms and
mental diseases.8
Psychological aspects of poverty
.
Mental disorders
=
Feeling of inferiority
®
Lack of self esteem
s Treated as objects
e
Feeling vulnerable and insecure
•
Feel less equal to others
•
Feel at the mercy of fate and destiny
=
Feel lonely, especially if they do not have the family support.
« They feel unable to help dependents
e They are forced to depend on others
Trade in organs
Bonded labour
Lack of family life due to working and living conditions.
Effects of ill-health on poverty. Acute illness and even more chronic illness (HIV) steadily
pushes a person into poverty. Also the frustration of inaction can generate powerlessness.
Illness undermines the productive capacity leading to a loss of income 9
RM 4
RM 8
' Rivi S
j Rivi 11
’’ RM 12
RM 16
‘ RM 17
6 RM 18
RM 21
WHAT IS BEING DONE/CAN BE DONE TO REDUCE POVERTY
Action on the determinants of poverty
Action to increase health care to the poor
ASHA — works in the slums of New Delhi. Has trained Community Health Workers who
conduct deliveries at a fraction of the cost of hospital deliveries. These are women who are
from the slums and provide MCH care to the mothers and children. They have reduced
severe malnutrition from 47% to 4%. Immunisation coverage is at present 97% (as compared
to 15% in 1989). The Eligible couple’s protection rate has also increased from 8% to 45%.
The CHWs are also members of women’s groups who lobby Govt to regularise their land
holdings.The Govt responded and today 475 families have responded.1
The HDR recommends the poor countries to increase consumption to overcome poverty.
They should ‘leapfrog’ into 'growth pattern’ that are pro-environment and pro-poor. This
requires a few chosen ingredients, consumption that is to be shared, strengthening, socially
responsible and sustainable. Consumption being shared would ensure that basic needs for
all are met. Consumption that is stre~ means that it must build the human capabilities. C~
that is soci~ res- so that it does not compromise the well being of others. C~ which is susmeans that it will not mortgage the choices of future generations.2
SEWA has a twin strategy of development along with struggle. While organising women, it
ensures employment and meeting the women’s basic needs. The women have been
struggling for the rights of the vendors, for minimum wages, for access to credit, for
employment, for social security (health care, education, housing), for women’s control over
forests and lands. At the same time it felt the need for building Alternative Economic
Organisations like co-operatives and unions. Some of the institutions built are the SEWA
Bank with a membership of 81.000 + members and a working capital of Rs 180 million.
SEWA believes that
*
Strengthening, protecting and promoting employment, especially self - employment, is
the most effective way to combat poverty
=
Building alternative economic organisations - co-operatives and producer groups - is
essential for the poor to emerge from the cycle of poverty.
• A joint action of struggle and development - union and co-operative - has resulted in
significant gains for the poorest workers.
= A holistic and integrated approach - which combines work and income security as ’well as
food and social security, is essential to break the chain of poverty.
• Critical inputs like access to raw materials, markets, capital, skills, capacity building of
workers in management and enabling policies (minimum bureaucracy, access to
resources like land water, forests) are needed to develop and strengthen worker owned
economic organisations.
» When poor women lead the struggle against poverty, the whole nation prospers.3
Some of the ways to reduce poverty
• Accelerated growth in agriculture
»
Promote the productive use of labor
• Provide basic social services - primary health care, FP, nutrition, primary education,
»
Economic growth which is sourced in agriculture, in rural non-agricultural activities and in
productive expansion of the informal sector, all of which will have high employment
elasticities.4
We cannot depend on the politicians, the people must take things into their own hand.
The Government spends 12% on anti-poverty programmes and food subsidy in 1997. it cut
back on health and education expenditures in the nineties. Also thanks to poor targeting, the
non poor receive the benefits.
Targeted expenditure on health, education, growth enhancing, job oriented investements in
infrastructure (roads, water supply, sanitation, irrigation and rural markets). Re-tegreted PDS
in UP and Bihar seem to be helping the poor. The other crucial input is land reforms.5
In Dharamapuri Dt, a massive IEC programem to increase awareness among the people
about health issues has increased the utilisation of the PHCs (OPD and deliveries)6
Devolve power and funds down to the Panchayat level
NDDB with its dairy co-operatives has produced income to the tune of Rs 50,000 crores for
the women of this country'. It tried the same with oilseeds, fruits and vegetables, but thanks to
bureaucratic mtereference could not proceed as expected.7
Globalisation is good for a country, but safety nets have to be provided to protect the
vulnerable.8
The rural poor need measures which will re-establish the agricultural practices, while at the
same time protecting the products and prices
Urban poor may be helped with food subsidies, subsidies for industry and public sector.9
Providing adequate water and sanitation reduces water borne diseases considerably, as well
as helminthiasis. Adequate ventilation and prevention of pollution will reduce the load of
respiratory' infections. Siting the shelter away from vector breeding areas will reduce malaria.
filaria and dengue. Some other measures are given on page 43.10
Look at the roots of poverty and try to tackle some of the shallow ones first.
= Inequity
National policies to curb inequities. Unions to represent the interests of the
poor. IGP and C&S prg. Local industries and marketing systems.
«
Unemployment
Unions to represent the interests of the poor. IGP and C&S prg. Local
industries and marketing systems. Food for work, loans for self employment.
=
Unequal land holdings
Unions of landless. National policies. Subsidised food schemes
and PDS. Small industries
»
Lack of access to capital IGP and C&S Prg. Keep health costs low.
=
Globalisation
Unions to demand fair wages and safer working conditions.
<= SAP
Unions to demand exemption of poor household from user fees. IGP and
welfare activites to support the indigent.
«
No role in governance
Will depend on the National policies.
» Violence Low cost legal aid. Counselling for vicitms.
• Environmental degradation
Unions to protect the environment, promote
reafforestation, protect water sources, promote sustainable agricultural practices, etc.
« Race & class discrimination
Unions to represent their interests. Education, IGP,
health and human rights schemes.
»
Natural disasters Siting of dwellings on safer locations. Use of better materials for
construction of shelters for the poor. Early warning systems for cyclones, typhoons, etc.
Emergency back up services available for the victims. Instant relief.
® War and Conflicts
NGO initiatives to rebuild wartom societies
• Gender discrimination
Education. IGP and C&S P. FP, abortion and delivery services.
•
Domestic violence
Trg of police, HWs, teachers, local leaders. Access to free legal
advice and assistance.
No access to education/training Innovative school systems to reach the poor, school
dropouts, adult learners. IGP to raise funds for school fees. Support children for higher
learning.
=
No access to health services
Mobile services. Exemption of fees. Recruit local
volunteers and health staff who will work with the poor
• No access to water
Community managed water systems. Sanitation need to be
established.
Livestock is invaluable for the poor.
Appropriate technologies for
food and nutrition (agricultural tools, improved seeds, local methods for composting.
processing and preserving food, improved granaries).
shelter (low cost dwellings, community should be involved in the construction)
water and sanitation (rainwater catchments, standpipes, rainwater harvesting.):
MCH (health records. TBAs, ORS,)
First aid (1st aid kits)
Prevention of diseases (bed nets,)
Education11
*
Some policies which can mitigate poverty
Legal age of marriage (to prevent teenage pregnancies)
FP, Maternal and abortion services available, affordable and accessible
Regulation of VHWS, TBAs so that care is accessible
Prohibition of female infanticide
Ensure availablitlity of emergency obstetric services at hospitals
Compulsory registration of births and deaths and investigation of maternal and child deaths
Compulsory service for young medical graduates
Ban on breast milk substitutes
Free services for children
Supplementary feeding in drought prone areas
Monitoring of abortion of female fetuses
Compulsory' flouridation
Compulsory certification of hotels and vendors
Strict enforcement of laws on child prostitution
Compulsory education and prohibition of children working in hazarous industries
Services for disabled people
Increased access to Reproductive health services and sexual education
Prohibition on manufacture, advertising and distribution of cigarettes, alcohol, narcotic drugs
Driving laws to prevent RTA
Services for mentally ill
Occupational laws to prevent accidents
Food security for poor
More in page 89-92
NGOs are one answer.
Credit and Savings programme
IGP for women12*7
1 Rm 1
7 RM 2
3 RM 3
M RM 7
5 RM 12
6 RM 13
7 RM 14
'<N\
Reference List
1
Marion Lloyd, Urban Poverty. Health for the Millions 24 (6):5-7, 1998.
2.
Anonymous. Human Development. Health for the Millions 24 (6): 10-11, 1998.
3
Mirai Chatterjee. Women's struggle against poverty Health for the Millions 24 (6):12-15,
1998.
*F
Kailash Satyarthi. Child Labour. Health for the Millions 24 (6):28-30, 1998.
>5
Anonymous. The Challenge of a Sarpanch. Health for the Millions 24 (6):32-32, 1998.
(o
Mira Shiva. Feminization of Poverty. Health for the Millions 24 (6):33-34, 1998.
1
J. N Godrej. Rural Poverty. Health for the Millions 24 (6):35-37, 1998.
S
CM Francis. Poverty the ruthless killer, Health Action 9 (4) 3-3, 1996.
Krishna Kant. Deceptive Statistics and Deceptive Solutions. Health Action 9 (4): 14-16, 1996.
|c
Placida Vennalilvally. The Why and How of Massive Poverty. Health Action 9 (4):20-21,
1996.
from such chronic threats as hunger,
Jisease and repression. It also involves pro
tection from sudden and hurtful disrup
tions in people’s daily lives—in the home,
workplace and community.
In poor nations and rich, human life is
under threat from crime, accidents and vio
lence. Reported crimes worldwide were
increasing by 5% a year in the late 1970s and
early 1980s—faster than the growth in pop
ulation. Recently, however, some countries
,4th disturbingly rampant crime have been
witnessing improvements. In the United
States incidents of violent crime have fallen
three years in a row, and between 1995 and
1996 the number declined from 3 million to
2.7 million, the lowest level since surveying
gan 24 years ago.
Industrial and traffic accidents also pre
sent great risks. In most industrial countries
the number one killer of people aged 15-30
is accidental injury. In developing countries
traffic injuries account for at least half of
accidental deaths, and in Thailand, for
example, the death rate due to traffic acci
dents quintupled between 1962 and 1992,
from 4 per 100,000 people to 20.
Another threat to human security: in
adequate and illegal housing. More than a
billion people live in inadequate shelter,
without piped water, electricity, roads or, in
most cases, security of tenure. Between
30% and 60% of the people in developing
countries live in illegal settlements, and
around 100 million are thought to be home»s. Such conditions leave people con
stantly exposed to overcrowding, chronic
diseases, environmental disasters, evictions
and other sudden new threats, undermin
ing progress in human development.
Domestic violence—an often hidden
but universal scourge—causes physical and
persistent mental suffering, disrupts
women’s lives and blocks their personal
growth and participation in society. In
Thailand a study shows that more than 50%
°f married women living in Bangkok’s
biggest slum are regularly beaten by their
husbands. In Santiago, Chile, 80% of
women acknowledged being victims of vio
lence in their homes. Every nine seconds in
the United States a woman is physically
abused by her partner.
11STATE ()P HUMAN DEVELOPMENT
Human poverty and deprivation
Despite the remarkable progress in human
development, the backlog of human
poverty remains pervasive.
Human poverty, a concept introduced
in Human Development Report 1997, sees
impoverishment
as
multidimensional.
More than a lack of what is necessary for
material well-being, poverty can also mean
the denial of opportunities and choices
most basic to human development. To lead
a long, healthy, creative life. To have a
decent standard of living. To enjoy dignity,
self-esteem, the respect of others and the
things that people value in life.
Human poverty thus looks at more than
a lack of income. Since income is not the
sum total of human lives, the lack of it can
not be the sum total of human deprivation.
Since income is not
the stint total of
hitman lives, the
lack of it cannot be
the sum total of
human deprivation
Measuring human poverty in developing
countries
Human Development Report 1997 intro
duced the human poverty index (HPI) in an
attempt to bring together in a composite
index the different dimensions of depriva
tion in human life. The TIPI provides an
aggregate human measure of the preva
lence of poverty in a community. It is impor
tant to keep in mind that the concept of
human poverty is much bigger than the
measure, for it is difficult to reflect all dimen
sions of human poverty in a single quantifi
able composite indicator. Lack of political
freedom, lack of personal security, inability
to participate freely in the life of a commu
nity and threats to sustainability can hardly
be measured and quantified. The HPI
nonetheless draws attention to deprivations
in three essential elements of human life
already reflected in the HDI—longevity,
knowledge and a decent living standard.
What’s the difference between the HDI
and the HPI? The HDI measures progress
in a community or country as a whole. The
HPI measures the extent of deprivation,
the proportion of people in the community
who are left out of progress.
Estimates of the HPI for developing
countries (HPI-1) have been worked out
for 77 countries with comparable data (see
25
TABLE 1 7
Human poverty index (HPI-1) for developing countries
Country
Human
poverty index
(HPI-1)
HPI-1
value
(%)
rank
HPI-1
rank
minus
HDI rank3
HPI-1 rank
minus
$1 -a-day
poverty
rank3
Human
poverty index
(HPI-1)
HPI-1
value
rank
(%)
Country
HPI-1
rank
minus
HDI rank3
HPI-1 rank
minus
$1-a-day
poverty
rank3
-15
Papua New Guinea
Namibia
Iraq
Cameroon
Congo
29.8
30.0
30.1
30.9
31.5
49
41
42
43
44
-1
11
3
-1
4
-1
-9
-4
-13
0
Ghana
Egypt
India
Zambia •
Lao People's Dem. Rep.
31.8
34.0
35.9
36.9
39 4
45
46
47
48
49
0
14
-3
-7
2
Togo
Tanzania, U. Rep, of
Cambodia
Morocco
Nigeria
39.8
39.8
39.9
40.2
40.5
50
51
52
53
54
-4
-8
1
16
2
Central African Rep.
Dem. Rep of the Congo
Uganda
Sudan
Guinea-Bissau
40.7
41.1
42.1
42.5
42.9
55
56
57
58
59
-7
3
-10
-6
-10
-10
7
-16
Haiti
Bhutan
Mauritania
Pakistan
Cote d'Ivoire
44 5
44.9
45 9
46.0
46 4
60
61
62
63
64
-6
-2
4
14
7
8
24
20
-16
13
-10
-16
Bangladesh
Madagascar
Malawi
Mozambique
Senegal
46.5
47.7
47.7
48.5
48.6
65
66
67
68
69
9
5
-1
-2
4
-10
-6
20
-11
Yemen
Guinea
Burundi
Mali
Ethiopia
48 9
49.1
49.5
52.8
55.5
70
71
72
73
74
10
0
-1
-1
2
Sierra Leone
Burkina Faso
Niger
58.2
58 2
62.1
75
76
77
-2
1
1
Trinidad and Tobago
Chile
Uruguay
Singapore
Costa Rica
3.3
4.1
4.1
6.5
6.6
1
2
3
4
5
-4
0
-1
3
2
Jordan
Mexico
Colombia
Panama
Jamaica
10.0
10.7
11.1
11.1
11.8
6
7
8
9
10
-15
-1
-1
3
-9
Thailand
Mauritius
Mongolia
United Arab Emirates
Ecuador
11.9
12.1
14.0
14.5
15.3
11
12
13
14
15
1
1
-15
7
1
7
China
Libyan Arab Jamahiriya
Dominican Rep.
Philippines
Paraguay
17.1
17.4
17.4
17.7
19.1
16
17
18
19
20
-13
5
—4
-8
-4
-14
Indonesia
Sri Lanka
Syrian Arab Rep.
Bolivia
Honduras
20.2
20 6
20.9
21.6
21.8
21
22
23
24
25
-4
-1
7
-10
-10
1
8
Iran, Islamic Rep. of
Peru
Tunisia
Zimbabwe
Lesotho
22.2
23.1
23.3
25.2
25.7
26
27
28
29
30
11
7
10
-13
-16
Viet Nam
Nicaragua
Botswana
Algeria
Kenya
26.1
26.2
27.0
27.1
27.1
31
32
33
34
35
-5
-6
7
17
-13
Myanmar
El Salvador
Oman
Guatemala
27.5
27.8
28.9
29.3
36
37
38
39
-7
4
25
8
-13
-16
-7
-9
16
-11
-14
14
28
8
-2
"
15
-3
9
1
21
15
3
-12
Note: HDI and $1-a-day poverty ranks have been recalculated for the universe of 77 countries.
a. A negative figure indicates that the HPI-1 rank is better than the other, a positive the opposite.
Source: Human Development Report Office.
technical note 2). The HPI-1 value reflects
the proportion of people affected by the
three key deprivations—providing a com
parative measure of the prevalence of
human poverty. Here’s what the HPI-1
reveals (table 1.7):
• The HPI-1 ranges from 3% in Trinidad
and Tobago to 62% in Niger.
• Other countries with an HPI-1 of less
than 10% are Chile, Uruguay, Singapore
and Costa Rica.
• The HPI-1 exceeds 50% in Mali,
Ethiopia, Sierra Leone, Burkina Faso and
Niger.
26
• The HPI-1 exceeds 33% in 32 coun
tries, implying that an average of at least a
third of the people in these countries suffer
from human poverty.
A comparison of HDI and HPI-1 values
shows how well—or poorly—the average
achievements in a country' are distributed.
China and Egypt have similar levels of over
all human development, but the HPI-1 for
China is only 17%, while that for Egypt is
34%. Similarly, Kenya and Pakistan are at
par in the HDI, but the HPI-1 for Kenya is
less than 30% and that for Pakistan is more
than 45%. This reveals that the fruits of
human development are distributed more
inequitably in Egypt and Pakistan than in
China and Kenya.
The HPI-1 also reveals deprivation that
would be masked in the income measure of
poverty’. Egypt and Pakistan have reduced
their income poverty to less than 15%. But
human poverty' in these countries remains
much higher, at 34% and 46%. The HPI-1
also shows progress masked by the income
measure of poverty. In Zimbabwe and
Nicaragua, for example, income poverty is
severe, at nearly 50%. But these countries
have made much more progress in reducing
human poverty, achieving HPLl values of
25% and 26%.
^Measuring human poverty in industrial
'“'countries
Poverty and deprivation are not only a prob
lem of the developing countries.
• On the basis of an income poverty line
of 50% of the median personal disposable
income, more than 100 million people are
income-poor in OECD countries.
• At least 37 million people are without
jobs in OECD countries, often deprived of
adequate income and left with a sense of
social exclusion from not participating in
the life of their communities.
• Unemployment among youth (age
15-24) has reached staggering heights, with
32% of young women and 22% of young
men in France unemployed, 39% and 30%
Italy and 49% and 36% in Spain.
• About 8% of the children in OECD
countries—including half or more of chil
dren of single parents in Australia, Canada,
the United Kingdom and the United
States—live below the income poverty line of
50% of median disposable personal income.
• Nearly 200 million people are not
expected to survive to age 60.
• More than 100 million are homeless, a
shockingly high number amid the affluence.
To capture the multiple dimensions of
poverty in a composite measure, an HPI for
industrial countries (HPL2) is introduced
here, focusing on deprivation in the same
three dimensions of human life as the HPI1, but replacing the measures with ones that
better reflect social and economic condi
'rin.ST.Vi! ()| I U MAX DEVEI.OPMHXT
tions in these countries. And it adds a fourth
dimension—social exclusion—for which
the HPLl does not include a quantitative
measure because no reliable data could be
found. For industrial countries appropriate
data are available.
The nature of deprivation in human life
varies with the social and economic condi
tions of a community or country. Studies of
poverty in the developing countries—with
low levels of resources and human develop
ment—focus on hunger, epidemics, illiteracy
and lack of health services and safe water.
These issues are less dominant in industrial
countries, where hunger is not as pervasive,
primary schooling is nearly universal, most
epidemics are well controlled, health services
are typically widespread and safe water is eas
ily available. Not surprisingly, typical studies
of poverty in the more affluent countries con
centrate on social exclusion, a complex and
persistent deprivation difficult to eliminate in
all countries, industrial and developing alike.
Although the dimensions used in the
HPLl, for developing countries, are equally
relevant to industrial countries, the indica
tors used are not. A second index is needed,
using indicators that reflect the way poverty
is manifested in industrial countries.
The HPI-2 comprises:
• Deprivation in survival, measured by
the percentage of the population likely to
die before age 60.
• Deprivation in knowledge, measured by
the percentage of the population function
ally illiterate—lacking an ability to read and
write adequate for the most basic demands
of modem society, such as reading instruc
tions on a medicine botde or reading stories
to children.
• Deprivation in economic provisioning,
measured by the proportion of people
whose disposable personal income is less
than 50% of the .median, leaving them
unable to achieve the standard of living nec
essary to avoid hardship and to participate
in the life of the community.
• Social exclusion, measured by one of its
most critical aspects—the percentage of
long-term unemployed (those out of work
12 months or more) in the total labour force.
The HPL2 uses the same measures as
the HPLl for survival and knowledge,
i'oi’Cl'ty and
deprieation are
also major
problems in
industrial
countries
27
applying a higher cut-off point. For eco
nomic provisioning and exclusion, new
measures are used. These require
explanation.
Social exclusion takes many forms,
varies considerably from one community to
another and is difficult to measure. But
long-term unemployment, which is consis
tently monitored in most industrial coun
tries, is a suitable proxy for exclusion. It
reflects exclusion from the world of work
and the social interaction associated with
employment, which is an important part of
social exclusion in most communities.
For economic provisioning the HPI-1
uses a combination of malnourishment and
lack of access to water and health services,
while the HPI-2 uses a headcount measure
of income poverty. These divergent
approaches were followed for three
reasons.
First, the HPLl incorporates economic
provisioning from both public and private
income. Public provisioning is an important
source of consumption for poor households,
and key deprivations in this area are cap
tured in lack of access to such services as
health care and water. Deprivation in private
provisioning focuses on food consumption,
since by far the largest proportion of per
sonal incomes of the poorest households in
the poorest countries goes to food—more
than 50%, sometimes more than 80%. For
the HPI-2 these would not have been the
most suitable measures because in industrial
countries food is not the principal compo
nent of private income and because most
people already have access to such basic
public services as water.
Second, deprivation in income is a more
appropriate measure for industrial coun
tries because it reflects deprivation in the
material means that people require. But the
use of a single international poverty line can
be misleading—because of variation^n
what are defined as "essential” comrnfflities. Differences in the prevailing patterns
of consumption—of clothing, housing and
such means of communication as radios,
televisions and telephones—mean that
TABLE 1.8
Human poverty index (HPI-2) for industrial countries
DEPRIVATION IN
SURVIVAL
DEPRIVATION IN
KNOWLEDGE
DEPRIVATION IN
INCOME
SOCIAL
EXCLUSION
HUMAN
POVERTY INDEX
People who
are functionally
illiterate3
(% age 16-65)
1995
Population below
the income
poverty lineb
(%)
1990
Long-term
unemployment,
12 months or more
(as % of total
labour force)
1995c
Human poverty
index (HPI-2) for
industrial countries
Countries
People not
expected to survive
to age 60
(%)
1995
Sweden
Netherlands
Germany
Norway
Italy
8
9
11
9
9
7.5
10.5
14.4
6.7
6.7
5.9
66
6.5
Finland
France
Japan
Denmark
Canada
11
11
8
12
9
Belgium
Australia
New Zealand
Spain
United Kingdom
10
9
10
10
9
Ireland
United States
9
13
Value
(%)
HPI-2
rank
Real GDP per
capita (PPP$)
rank
1.5
3.2
4.0
1.3
7.6
6.8
8.2
10.5
11.3
11.6
1
2
3
4
5
14
10
8
2
9
62
7.5
11.8
7.5
11 7
6.1
4.9
0.6
2.0
1.3
11.8
11.8
12.0
12.0
12.0
6
7
8
9
10
14
7
4
3
5
21.8
5.5
12 9
9.2'
10.4
13.5
6.2
2.6
1.3
13.0
3.8
12.4
12.5
12.6
13.1
15.0
11
12
13
14
15
6
11
16
17
12
22.6
20.7
11.1
19.1
7.6
0 5
15 2
16.5
16
17
15
1
__ d
—d
__ d
__ d
__ d
__ d
16.6
18.4®
17 0
18.4
__ d
A
W
a. Based on prose level 1, as reported in the International Adult Literacy Survey (IALS). Data are for 1995 or a year around 1995.
b Poverty is measured at 50% of the median disposable personal income. Data are for 1990 or a year around 1990.
c. Standardized unemployment rates calculated by the International Labour Organisation.
d. No data available. For calculating the HPI-2 value, the average of 16.8% of all countries (except Poland) included in the International Adult Literacy Survey has been used.
e. Data refer to Flanders.
f. The unweighted average of the industrial countries (excluding Eastern Europe and CIS).
Source: column 1: UN 1994e; column 2: OECD, Human Resource Development Canada and Statistics Canada 1997; column 3: Smeeding 1997; column 4: OECD 1997d
28
many goods considered essential for social
participation in one community might not
be seen as essential in another. Thus the
minimum income needed to avoid social
exclusion can be quite different across
countries. For this reason 50% of the coun
try’s median personal disposable income
was used as the poverty line, reflecting what
is appropriate for each country. Moreover,
this measure of income poverty is now the
standard used in the European Union for
making international comparisons.
Third, data availability and quality are
an important concern. Income poverty data
are available for only 48 developing coun
tries and rely on many estimates. Data on
malnourishment and access to public ser
vices have broader coverage. In industrial
countries comparable data on income
poverty are available.
What does the HPI-2 reveal?
els of human development, with HDI val
ues of more than 0.900. But the top HDI
countries—Canada and France—have sig
nificant problems of poverty, and their
progress in human development has been
poorly distributed. Canada ranks tenth in
the HPI-2 because 17% of its people lack
adequate literacy skills, more than twice the
proportion in Sweden (figure 1.7).
Fluman poverty is deprivation in multi
ple dimensions, not just income. Industrial
countries need to monitor poverty in all its
dimensions—not just income and unem
ployment, but also lack of basic capabilities
such as health and literacy, important fac
tors in whether a person is included in or
excluded from the life of a community.
Human poverty is one side of the story
of the backlog of human deprivation. The
other side is persisting disparities—often
the result of uneven progress in human
development, but reinforced by the backlog
FIGURE 1.6
Incomes do not predict
poverty levels
Income
Real GDP
per capita
(PPPS)
Human
poverty
index (HPI-2)
(%)
Source: Human Development Report Office.
of human poverty.
Among 17 industrial countries Sweden has
the lowest incidence of human poverty as
measured by the HPI-2, with 6.8%, fol
lowed by the Netherlands and Germany
(table 1.8). The countries with the most
poverty are the United States, with 16.5%,
followed by Ireland and the United
Kingdom at 15.2% and 15%.
The extent of human poverty has little to
do with the average level of income. The
United States, with the highest per capita
income measured in purchasing power par
ity (PPP) among the 17 countries, also has
the highest human poverty. Sweden ranks
first in the HPI-2, with the least poverty, but
only 13th in average income. And the
Netherlands and the United Kingdom have
similar average incomes but very different
human poverty levels, at 8.2% and 15%. One
might expect that the higher a country’s
GDP, the fewer poor people there would be.
But comparing GDP per capita with the
HPI-2 suggests the opposite: poverty rates
in higher-income countries are the same
as—or higher than—rates in lower-income
industrial countries (figure 1.6).
The level of the HPI-2 does not corre
late with the overall human development
achieved by a country. All 17 countries
ranked on the HPI-2 have reached high lev
■| III-: STATE (>F IIUMAN DEVELOPMENT
Persisting disparities
The inequalities that persist between poor
people and rich, women and men, rural and
urban, and among different ethnic groups
are seldom isolated—instead, they are
interrelated and overlapping.
Income and wealth—stark inequality
In 1960 the 20% of the world’s people who
live in the richest countries had 30 times the
income of the poorest 20%—by 1995 82
times as much income. Consider the extra
ordinary concentration of wealth among a
small group of the ultra-rich (box 1.3).
Disparities are just as stark within coun
tries. In Brazil the poorest 50% of the pop
ulation received 18% of national income in
1960, falling to 11.6% in 1995. The richest
10% received 54% of national income in
1960, rising to 63% in 1995. In Costa Rica
during the 1980s the richest 20% enjoyed a
per capita income of PPP$ 14,400, while
the poorest 20% had an average income of
PPP$ 1,340.
Income distribution in industrial coun
tries also shows wide disparities between
rich and poor. In the worst case, Russia, the
FIGURE 1.7
No pattern between the HDI
and human poverty
Source: Human Development Report Office.
29
households are malnourished. In Cote
d’Ivoire research shows that doubling the
income under women’s control would lead
to a 2% rise in the share of the budget for
food—and a 26% decline in the share for
alcohol, 14% for cigarettes. And a study in
Guatemala shows improvements in chil
dren’s nutritional status when the mother
earns a higher share of the income.
Intrahousehold resource allocation
shows bias not only by gender, but also by
age and by sibling hierarchy. The point:
intrahousehold power relations determine
claims to consumption. The policy implica
tion: assuming that equity reigns in the
household is unrealistic, and policies that
target household heads may well be inefActive. Food stamps and assistance to
Bremen, for example, are likely to be more
effective in securing household food secu
rity than are income subsidies for the entire
household.
Unequal claims on time restrict consump
tion choices. Consumption requires time,
and each day’s 24 hours need to accommo
date a variety of consumption objectives.
Everyone has those same 24 hours—but
gender and differences in access to ameni
ties and resources determine how much
time is available-—and how much is
required—to meet a consumption objec
tive. Just as food takes up the most
resources for the poorest families in poor
countries, walking—especially to collect
^rwood and water—takes up the most
time resources for poor households, both
urban and rural. As recent studies attest,
time is the critical constraint people face in
meeting all their needs—and in lifting
themselves out of poverty.
A study in Ghana shows that a farmer
spends 43 minutes a day collecting fire
wood, 25 minutes collecting water, 48 min
utes walking to the farm, 28 minutes to
reach the grinding mill and 2 hours and 8
minutes walking to the market—a total of
almost five hours. So much time spent walk
ing leaves little time for activities that might
enhance health, knowledge and productiv
ity, such as improving care of children and
of the aged, improving cultivation of crops
and preparing better food.
The time spent working is unequally dis
tributed—with women spending much
more time than men in work—paid and
unpaid—in virtually every society for which
time use studies exist. As Human
Development Report 1995 documented,
women take on a larger share of the work—
53% on average in developing countries,
and 51% in industrial. But the disparities
are particularly marked in rural areas of
developing countries, where women’s work
burden is significantly larger than men’s—
35% more in Kenya, 21% in the Philippines,
17% in Guatemala (figure 3.5). In most
industrial countries the disparity is less—
but women still take on 28% more in Italy,
11% more in France and 6% more in the
United States. A study of rural areas in the
United Republic of Tanzania shows ablebodied women carrying 86 ton-kilometres a
year, compared with only 11 ton-kilometres
for able-bodied men. Women in these areas
spend 1,842 hours a year walking—to mar
kets, to fields, to fetch water—but men only
492 hours (figure 3.6).
FIGURE 3.4
Rural populations are poorly
served by public provisioning
Index (urban population served=100)
Safe drinking water
100
Urban
60
O Rural Cambodia
40
Rural Ma*awi
■<3 Rural Argentina
20
O Rural Paraguay
Sanitation facilities
100
-<1 Urban
80
O Rural Argentina
O Rural Nicaragua
O Rural Yemen
Policies for securing basic consumption needs
20
Securing entitlements for all people to the
basic essentials has long been an interna
tional commitment.
The
Universal
Declaration of Fluman Rights set the
objective 50 years ago: “Everyone has the
right to a standard of living adequate for
the health and well-being of himself and
his family, including food, clothing, hous
ing and medical care and necessary social
services.” In any country’s poverty eradi
cation strategy meeting basic consump
tion requirements should be an important
goal.
Such an objective would make a sub
stantial difference in many sectoral policies.
Transport and energy investments are con
sidered primarily as “economic infrastruc
ture” driven by the goal of economic growth
rather than the needs of people for mobil
ity and communications. Construction of
walkways and bicycle lanes in cities receives
little public attention—even though walk
ing is how most people get about, and
cycling is the first accessible improvement
over walking. More equitable access to such
Rural Paraguay
■O Rural Dem. Rep. of
the Congo
Health services
100
■*< Urban
60
-<3 Rural Nicaragua
40
Rural Yemen
O Rural Malawi
-<3 Rural Argentina
0
Source: UNICEF 1997.
53
FIGURE 3.5
Women work longer than men
Index (men's work time=100)
140
Kenya (rural)
130
Italy
Philippines (rural)
120
Guatemala (rural)
Colombia (urban)
-J France
Indonesia (rural)
110
USA
-< Kenya (urban)
100
Men's
work
time
Women's
work time
Source: UNDP 1995a
FIGURE 3.6
Rural transport activities in
the United Republic of
Tanzania—who carries the load?
public infrastructure as clean water, energy,
roads and public transport is a key criterion
for assessing the performance of a state in
democratic governance.
Housing also receives little public
attention and is generally left to the pri
vate sector. But with the pace of urban
ization outstripping the development of
sites and services, families have little
option but to resort to squatter settle
ments, where they face the constant threat
of eviction. Singapore, in its vision of
development and poverty elimination in
the early 1960s, had explicit goals to meet
needs for housing, transport and a clean
environment in addition to schooling and
health (box 3.1).
Achieving equitable access—through
public investments, fair pricing of sendees
and an enabling environment for private
investment—should be a public policy goal
in each sector in each country. The post
apartheid government in South Africa has
articulated a comprehensive policy for
assuring equitable access to basic services
(box 3.2).
Rising consumption puts stress on the
environment
Almost any human consumption activity
produces environmental impacts through
out the life cycle of the product-—from pro
duction to consumption to waste disposal.
The impacts:
• Depletion of the stock of non-renewable resources (like metals and minerals).
• Mismanagement of renewable resources,
leading to depletion and degradation—such
as overfishing, overexploiting forests, overexploiting groundwater and exposing soils to
erosion.
• Emissions of pollutants that create an
unhealthy environment: cigarette smoke
filling a room, traffic fumes hanging over a
Ton-kilometres yearly
Women
Men
Source: Howe 1998.
54
city, industrial effluents choking river life.
• Generation of pollution and waste
beyond the sink capacity—the earth’s
capacity to absorb them—both locally and
globally. Toxic waste builds up in landfills,
and pollution from oil-burning industries
releases carbon dioxide (CO2), causing
global warming.
The unprecedented growth in world
consumption is leading to environmental
stress through impacts that are both global
and local. What are the principal environ
mental problems affecting human develop
ment? Contrary to the fears of the 1960s
and 1970s, the problem is not the scarcity
of non-renewables, such as metals and min
erals. Quite the opposite. There is no
immediate shortage, prices for these
resources have been falling, and demand is
depressed. Consumption of ores and min
erals as a proportion of reserves has actu
ally declined with the discovery of new
reserves. Far more urgent: the scarcity of
renewable resources and the generation of
emissions and waste that exceed the sink
capacity.
The crisis ofrenewable resources
w
The world is facing a growing scarcity of
renewable resources essential for sustaining
the ecosystem and for human survival—
from deforestation, soil erosion, water
depletion, declining fish stocks and lost bio
diversity.
Deforestation. Since 1970 the world’s
wooded area has fallen from 11.4 square
kilometres per 1,000 inhabitants to 7.3.
Only 40 years ago most deforestation was in
the industrial countries. Now it is concen
trated in the developing world. Over the
past decade at least 154 million hectares of
tropical forest—three times the area of
France—have been cut, and every year a4|
area the size of Uruguay is lost. Latin
America and the Caribbean fell 7 million
hectares a year, and Asia and Sub-Saharan
Africa 4 million each. These estimates tell
only part of the story, for they count only
land that has lost more than 90% of its for
est cover—only a quarter of Africa’s loss in
the 1980s. Despite rapidly growing global
demand for timber, the lost stocks are not
being replenished. Worldwide, only 1
hectare of tropical forest is replanted for
every 6 cut down—in Africa, 1 for every 32.
India, a notable exception, now plants 4
hectares for every 1 felled.
Deforestation has many human and
environmental consequences, from scarcity
C or-A H - ^-0 -
FIGURE 3.1
Growth of consumption has been dramatic,
but severe disparities remain
Total consumption expenditure
1995 $21.7 trillion
Total consumption expenditure
1970 $10.2 trillion (1995prices)
------ Industrial countries $16.5
Calories
per capita per day
1970
1995
Sub-Saharan Africa
Arab States
South Asia
East Asia
South-East Asia and Pacific
Latin America and Caribbean
All developing countries
Industrial countries
2,225
2,206
2,094
2,041
2,237
1,957
2,533
2,781
2,491
2,131
3,016
Total consumption
expenditure, 1995:
$21.7 trillion (1995 prices)
2,903
2,385
2,717
Developing countries $5.2a
2,572
3,157
Latin America & Caribbean $1.3
East Asia $1.0
Eastern Europe & CIS $0.8
Total consumption expenditure (USS trillions; 1995 prices)
Note: Eastern Europe and the CIS
countries are not included
among industrial countries.
1970
Industrial countries
Developing countries
1970
8.3
1980
11.4
1.9
3.6
1980
Source: FAO 1997b and 1998; ITU 1997b; UN 1996c and 1997b, UNESCO 1997d; World Bank 1997d.
48
1990
15.2
4.3
1990
South-East Asia & Pacific $0.5
1995
16.5
South Asia $0.4
5.2
Arab States $0.3
Sub-Saharan Africa $0.2
1995
a. Developing country total includes
countries not in regional aggregates.
TABLE 3.1
Long-term trends in private consumption of selected items, by region
Developing
countries
SubSaharan
Africa
Arab
States
East
Asia
South-East
Asia and
the Pacific
South
Asia
Latin America
and the
Caribbean
Item
Year
World
Industrial
countries
Meat (millions of tons)
1970
1995
87
199
57
95
29
103
3
6
2
5
8
53
3
8
3
8
10
23
Cereals (millions of tons)
1970
1995
473
866
91
160
382
706
27
56
20
49
142
236
41
82
112
212
33
57
Total energy (millions of
tons of oil equivalent)
1975
1994
5,575
8,504
4,338
5,611
1,237
2,893
139
241
67
287
407
1,019
102
296
180
457
306
531
Electricity (billions of
kilowatt-hours)
1980
1995
6,286
12,875
5,026
9,300
1,260
3,575
147
255
98
327
390
1,284
73
278
161
576
364
772
Petrol (millions of tons)
1980
1995
551
771
455
582
96
188
10
15
12
27
11
38
8
19
6
13
48
72
Cars (millions)
1975
1993
249
456
228
390
21
65
3
5
2
10
0.5
7
2
7
2
6
12
27
Bicycles produced (millions)
1970
1995
36
109
McDonald's restaurants
1991
1996
12,418
21,022
11,970
19,198
448
1,824
0
17
0
69
123
489
113
409
0
3
212
837
Source: FAO 1998; McDonald's Corporation 1997; UN 1996a, 1996c and 1997b.
more than 20% refrigerators. Households
owning a sewing machine increased from
39% to 64% in 1988-94, and those owning
televisions from 31% to 57%. The upsurge
in purchases of consumer durables and
products reached even the 90 million
lowest-income households
in
India.
Although two-thirds of them had incomes
below the official poverty line, more than
50% owned wrist watches, 41% bicycles,
31% transistor radios and 13% fans.
So, there have been many achievements
in consumption that are propelling human
development. But the current patterns and
growth of consumption raise problems:
• The expansion of consumption is badly
distributed, with about a fifth of the world’s
people left out.
• Consumption growth and patterns arc
environmentally damaging. Thus the con
sumption of some harms the well-being of
others, in both present and future
generations.
• Consumption growth and patterns have
social impacts that deepen inequalities and
social exclusion.
* Consumer rights to information and
product safety are difficult to defend in the
context of the global consumer market.
Consumption shortfalls and poverty
The poor distribution of the growth of
global consumption has left an enormous
backlog of shortfalls in areas of consump
tion essential to human development.
Although consumption is an essential
means to human development, not all con
sumption has the same value. We focus here
on those areas of consumption that are
most essential to achieving basic capabili
ties to live long, healthy and creative lives
and to enjoy a decent standard of living.
These include such basics as food, shelter,
clean water, schooling, health care, energy
and transport as well as means of commu
nication and freedom of creative and cul
tural expression (figures 3.1 and 3.2).
Uneven growth and increasing inequalities
Global consumption expenditure, private
and public, has grown an average 3% a year
since 1970. But this overall figure masks
enormous disparities in growth that have
widened inequalities.
In low-income countries (except China
and India) private consumption expendi
ture per capita has declined by about 1%
47
FIGURE 3.2
The environmental cost is also growing, and many basic deprivations remain
STEADY GROWTH IN CONSUMPTION
| ENVIRONMENTAL CO!
LOSS OF BIODIVERSITY
• About 12% of mammal species, 11 % of bird species and almost
4% of fish and reptile species are classified as threatened.
• Between 5% and 10% of the world's coral reefs and half the
world's mangroves have been destroyed.
• About 34% of the world's coasts are at high potential risk of
degradation, and another 17% are at moderate risk.
DECLINING FISH STOCK
• About 25% of fish stocks for which data are available are either
depleted or in danger of depletion, and another 44% are being
fished at their biological limit.
SOIL DEPLETION
• Nine million hectares are extremely degraded, with their original
biotic functions fully destroyed, and 10% of the earth's surface is
at least moderately degraded.
ilCCAPABILmESlfCONSUMPTfONIREQUIREMEI
laPEPRIVATIOI
Long, healthy life
Knowledge
(freedom from premature mortality and avoidable morbidity)
(freedom from illiteracy, innumeracy and lack of acquired basic skills)
Requirement
Backlog of deprivation
Requirement
Backlog of deprivation
Clean water
1.3 billion deprived of access to safe water
Schooling
Shelter
1
109 million (22% of primary-school-age
children) out of school
Food and nutrition
841 million malnourished
Information
885 million illiterate adults (age 15 and above)
Health care
880 million without access to health services
Sanitation
2.6 billion without access to sanitation
billion without adequate shelter
Energy
2
Transport
3
cars per 1,000 people in least developed
countries, 16 in developing countries, 405
in industrial countries
4 copies of daily newspapers circulated per
100 people in developing countries, 26 in
industrial countries
billion deprived of electricity
Communication
3 telephone lines per 1,000 people in least
developed countries, 40 in developing countries,
414 in industrial countries
Decent standard of living well distributed among members of society
Creative life
Requirement
Backlog of deprivation
Requirement
Backlog of deprivation
Secure access to
material resources
1.3 billion people in developing countries living
on less than $1 a day, 32% in transition economies
on less than $4 a day and 11 % in industrial
countries on less than $14.40 a day
Culture—language, arts,
traditions, philosophy
3,000 of the world's 6,000 languages
endangered
Freedom from political and
civil constraints
13.2 million refugees
Freedom from time
constraints
6-8 hours a day spent by rural women in develop
ing countries in fetching fuelwood and water
Source: CDIAC 1996; FAO 1995, 1996b and 1997c; ITU 1997b, OECD 1997e; Shiklomanov 1996; UN 1996b and 1996c; UNESCO 1997d; World Bureau of Metal Statistics 1996;
Worldwatch Institute 1997b; WR11994 and 1996a.
(.().\'SUMPTION IN A GLOBAL VILLAGL
UNEQUAL AND UNBALANCED
49
TABLE 3.2A
Inequalities in
consumption: the
world's highest and
lowest consumers
Telephone services, 1995
Top 5
countries
Lines per
1,000 people
Sweden
USA
Denmark
Switzerland
Canada
681
626
613
613
590
Bottom 5
countries
Lines per
1,000 people
Cambodia
Dem. Rep. of
the Congo
Chad
Afghanistan
Niger
1
1
1
1
2
Meat consumption, 1995
Top 5
countries
USA
New Zealand
Cyprus
Australia
Austria
Kilograms
per capita
a year
119
119
108
107
105
Bottom 5
countries
Kilograms
per capita
a year
Bangladesh
Guinea
Malawi
Burundi
India
3
4
4
4
4
Source- FAO 1998; ITU 1997b.
50
annually over the past 15 years. Both pub
lic and private consumption per capita are
about 20% lower in Africa today than in
1980.
For the world, average per capita food
consumption rose dramatically in the past
25 years. The developing country average—
only 2,131 calories per person in 1970, well
below the minimum requirement of 2,300
calories—is now 2,572 per person, well
above the minimum. But in Sub-Saharan
Africa it rose only from 2,225 calories to
2,237. As a result Sub-Saharan Africa was
the only region not to see a steady decline
in malnutrition: the number of undernour
ished people more than doubled, from 103
million in 1970 to 215 million in 1990.
Inequalities in consumption patterns
and levels are huge (see figure 3.1; tables
3.2a and 3.2b):
• Per capita private consumption expendi
ture is $15,910 (1995 prices) in industrial
countries (excluding Eastern Europe and
the CIS), but $275 in South Asia and $340
in Sub-Saharan Africa. And public con
sumption per capita is $3,985 in industrial
countries, but $183 in developing countries.
• Industrial countries, with 15% of the
world population, account for 76% of
global consumption expenditure. Allowing
for differences in purchasing power (using
a $PPP measure) would moderate some of
these consumption expenditure gaps—
however the gaps are still very wide.
• The fifth of the world’s people who live
in the highest-income countries consume
58% of the world’s energy, 65% of electric
ity, 87% of cars, 74% of telephones, 46% of
meat and 84% of paper—86% of total
expenditure. In each of these areas the
share of the bottom fifth, in the lowestincome countries, is less than 10%.
• The average protein consumption per
person is 115 grams a day in France, but
only 32 grams in Mozambique. And while
annual energy consumption per person is
more than 4,500 kilograms of oil equivalent
in industrial countries, it is less than a tenth
of that in South Asia (300 kilograms).
• For the world the average number of
cars per 1,000 people is 90—but it is 405 in
industrial countries, only 11 in Sub-Saharan
Africa, 6 in East Asia and 5 in South Asia.
• More than 600 telephone lines serve
every 1,000 people in such countries as
Sweden,
the
United
States
and
Switzerland, but in Cambodia, Democratic
Republic of the Congo, Chad and many
other developing countries there is only one
line per 1,000 people.
These huge inequalities remain even
though consumption has expanded more
rapidly in developing countries than in
industrial countries, especially in such basic
essentials as food and energy. The initial dis
parities were so large that even with spec
tacular increases, consumption levels in
developing countries have not caught up
with those in industrial countries.
• Per capita petrol consumption has
increased sixfold in East Asia and ninefold
in South Asia since 1950. But while it aver
ages 500 kilograms per capita a year in
industrial countries, it is still only 29 kilo
grams in East Asia and 10 in South Asia.
• Total meat consumption has risen more
than fivefold in East Asia since 1970 but is
still only 41 kilograms per capita a year,
compared with 77 kilograms in industrial
countries.
Pervasive consumption shortfalls
Of the 4.4 billion people in developing
countries, nearly three-fifths lack access to
sanitation, a third have no access to clean
water, a quarter do not have adequate hous
ing and a fifth have no access to modern
health services of any kind (see figure 3.2).
A fifth of primary-school-age children are
out of school. About a fifth do not have
enough dietary energy and protein, and
micronutrient deficiencies are even more
widespread—with 3.6 billion suffering iron
deficiency, 2 billion of whom are anaemic.
This, despite poor households spending at
least half their incomes on food (table 3.3).
And 2 billion people lack access to com
mercial energy such as electricity.
These consumption shortfalls hold back
human development and lead to human
poverty. About 17 million people in develop
ing countries die each year from such curable
infectious and parasitic diseases as diarrhoea,
measles,
malaria
and
tuberculosis.
Micronutrient deficiencies reduce physical
strength, intellectual functioning and resis
Constraints to meeting basic needs
tance to disease. Malnourished mothers pass
these deficiencies on to their children, mak
ing them less alert at school and more prone
to sickness. More than 850 million people in
developing countries are illiterate, excluded
from a wide range of information and knowl
edge. And in this day of ever-expanding
global communications and networking, the
poor in developing countries are isolated—
economically, socially and culturally—from
the burgeoning information and progress in
the arts, sciences and technology'.
Shortfalls in essential consumption are
not just a problem of poor countries. In
industrial countries too, many cannot meet
their basic needs and the life choices of mil
TABLE 3.26
These inequalities and shortfalls in basic
consumption reflect the unequal distribu
tion of income and assets and the uneven
rate of economic growth—globally and
nationally. About 1.3 billion people still live
on less than $1 a day (1985 PPP$), and
almost 3 billion on less than $2 a day. In
recent decades economic growth has been
both qualitatively and quantitatively inade
quate. In about 100 countries incomes
today arc lower in real terms than they were
a decade or more ago. These issues are
analysed in detail in Human Development
Report 1996 (on economic growth) and
Human Development Report 1997 (on
poverty).
Apart from the basic constraints of
income and economic growth, several other
constraints limit poor people’s options for
meeting their basic needs: lack of access to
public provisions, failure of the market to
supply poor people’s goods, intrahousehold
power relations and the enormous amounts
of time the poor must spend walking and
lions are limited. The United States may
Bave among the highest levels of per capita
food consumption in the world—fourth in
calorie intake—yet 30 million of its people,
including 13 million children under 12, are
hungry' because of difficulty getting the
food they need. In Canada 2.5 million peo
ple (9% of the population) received food
assistance in 1994—and in the United
Kingdom more than 1.5 million families
could not afford an adequate diet in 1994.
Remarkably, iron deficiency anaemia affects
55 million people in industrial countries.
In Eastern Europe and the CIS the
process of transition gave rise to many con
sumption shortfalls. Malnutrition rose to
levels similar to those in many low-income
countries. In Russia stunting affected 15% of
■diildren two years of age in 1994. In
Romania the share of infants who were
carrying.
Public provisioning ofbasic social services
is inadequate—and access is inequitable.
Many essentials—schooling, transport,
modem energy' health facilities—are pro
vided publicly. For low-income groups pub
lic provisioning is often an important source
for consumption. Yet the poor suffer con
sumption shortfalls because they lack
access—to water supply, modern energy,
sanitation, health, education, public trans
port and road infrastructure. Access is often
highly inequitable, favouring high-income
underweight at birth increased to 10% in
1993, and in Bulgaria in 1991, 17% of chil
dren aged three to six were undernourished.
Inequalities in
consumption: the
world's highest and
lowest consumers
Private and public health
expenditure, 1990
Top 5
countries
Expenditure
per capita
(USS)
USA
Switzerland
Sweden
Finland
Canada
2,765
2,520
2,343
2,046
1,945
Bottom 5
countries
Expenditure
per capita
(USS)
Viet Nam
Sierra Leone
Tanzania, U. Rep. of
Lao People's
Dem. Rep.
Mozambique
3
4
4
5
5
Public expenditure on
education (preprimary, first
and second levels), 1992
Top 5
countries
Expenditure
per pupil
(USS)
Luxembourg
Finland
USA
Austria
Belgium
15,514
11,720
11,329
9,065
8,143
Bottom 5
countries
Expenditure
per pupil
(USS)
Sn Lanka
Nepal
Mozambique
China
Madagascar
Source
38
44
46
57
60
WHO 1995b. UNESCO
1995.
TABLE 3.3
The lower the household income, the larger the share spent on food and energy, the smaller the share spent on
transport, health and education
(as a percentage of household expenditure)
Highest income quintile
Lowest income quintile
Country
Food
Energy
Transport
Health
Education
Food
Energy
Transport
Health
Education
Sierra Leone
Costa Rica
Thailand
Jordan
67.9
54.4
52.8
43.4
6.6
9.4
5.0
7.6
1.9
4.2
3.8
3.5
2.7
2.1
2.6
2.4
1.8
0.7
1.2
1.3
53,9
29.1
25.2
32.1
3.3
7.5
2.9
4.1
8.9
19.5
20.3
16.8
4.7
4.8
3.9
2.0
3.2
1.0
2.1
4.7
Note: Data are from household surveys conducted in 1987-94.
Source: Sierra Leone, Central Statistics Office 1993; Costa Rica, General Office of Statistics 1988; Thailand, National Statistical Office 1995; Jordan, Department of Statistics
1993
□X
V
l/2>
05608
51
FIGURE 3.3
Public provisioning
is not equitable provisioning
Percentage of population quintile
with access to public goods and services
Access to public water supply
80
RICHEST
QUINTILE
60
20
POOREST
QUINTILE
0
Mexico
Peru
Cote
d'Ivoire
Access to sanitation
100
80
RICHEST
QUINTILE
60
20
POOREST
QUINTILE
0
Mexico
Peru
Cote
d'Ivoire
Access to electricity
100
RICHEST
QUINTILE
80
60
40
POOREST
QUINTILE
20
0
Guatemala Peru
Cote
d'Ivoire
Source: World Bank 1994.
52
groups and leaving the poor with little or
without (figure 3.3). Access also heavily
favours urban communities, leaving great
deprivation in rural areas (figure 3.4). In
Brazil disparities in access due to regional
inequalities are marked: in the Central West
region 98% of children aged 7-14 are
enrolled in school, while in the lowerincome North-East region 50% of children
are not enrolled.
Even when the poor have access, pric
ing can undercut them. In Lima a poor fam
ily pays more than 20 times what a
middle-class family pays for water.
Unregulated water markets in the Indian
state of Tamil Nadu lead to grotesque
inequities: tubewell owners pump ground
water, often using subsidized electricity, and
sell it to intermediaries, who then sell it to
poor households. The mark-up can be
1,000%!
The increasing “marketization” of edu
cation and health services—with growing
use of private facilities and private tutors,
often accompanied by declining quality in
public services—has added to disparities.
In Egypt access to basic education has
improved, but public spending on educa
tion per student has declined. In 1991 non
personnel expenditures were a fifth of
what they had been 10 years before. To
make up for the declining quality, middle
class parents send their children to fee
charging private schools, which are
expanding rapidly.
Supplies ofpoor people’s goods in the mar
ket are inadequate. Often, the goods most
needed for human development—goods
that are affordable for the poor, that meet
basic needs, that are environmentally
friendly, that create productive work for the
needy—are not available in the market.
Market incentives for innovation are much
stronger for rich people’s goods than for
poor people’s—because profits are larger.
The incentives are also stronger for envi
ronmentally destructive goods than for
environmentally friendly goods—because
production costs are lower. And they are
stronger for socially negative than for
socially positive goods—again, because
production costs are lower.
Provision of the goods essential for
human development requires technological
innovation and product development.
Public investment has driven much of the
progress in increasing the availability of
such goods—oral rehydration salts, seeds of
high-yielding varieties of rice, wheat and
maize and many other products that have
led to better health, improved food security
and a cleaner environment.
New incentives are needed to accelerate
the provision of poor people’s goods—
starting with pricing incentives, especially
the removal of perverse subsidies, and sup
port for technological development.
Intrahousehold power relations lead to
inequitable access and consumption. House
holds are often assumed to be harmonious
units of cooperation, and public policies
often target the household as the benefi
ciary of assistance. But gender research
consistently reveals flaws in this assump
tion. In reality power relations in house
holds often favour boys over girls, and
young adults over the aged—in nutrition,
education and many other resources.
Research shows evidence of boys receiving
more food than girls in regions of India and
Pakistan. Gender gaps in schooling may be
narrowing in all regions of the world, but
enrolment of girls still falls short of that of
boys in developing countries as a whole—
girls’ enrolment is 88% of boys’ at the pri
mary level, and 78% at the secondary. And
when user fees are introduced, it is the girL
who are taken out of school, as studies in
many countries show, including Cote
d’Ivoire and Zambia.
When women retain control over
household income, more resources tend to
be channelled to the health, education and
nutrition of children. Many empirical stud
ies show that women spend their incomes
for the entire household, while men spend
more on items for themselves—such as
entertainment, alcohol and cigarettes. A
study in Jamaica shows that compared with
male-headed households, female-headed
households consume foods of a higher
nutritional quality and spend less on alco
hol. In Kenya and Malawi a smaller per
centage of children in female-headed
1 Il’MA.X 111 \ I |.( >|>.\U XT R| Pl )!<r |9'>s
VOL
6
N ° 1 8
JULY
1999
Healthcare
The Promise of Innovation
hat w!!!
The Novartis
Chais" m Healthcare
Management
healthcare
!ook Dike
in 2020? Will! genetic
coding redefine how
illnesses are treated?
Wil! fitness and well
being centres replace
hospitals? Will
testing be conducted
in patients' homes
rather than
laboratories?
V”
Vs. n April 9'1', more than 250
V,
Yj \iea\t\acare practitioners,
by this former Professor ol
Management and Strategy at INSEAD,
educators and policy-makers who was the institute's Director and
converged at INSEAD to discuss these Dean of Faculty in 1964-70.
and other provocative questions.
Though perhaps it might surprise
We were delighted to welcome such
some to see healthcare issues discussed
an exciting mix of international
at a business school, Dean Antonio
participants from both the public and
Borges noted that the sector needs
private sectors, said Prolessor John
mantigers capable ol dealing with broad
Kimberly, the Salmon and Rameau
and sophisticated issues. "We cannot
Fellow in Healthcare Management.
provide all the answers, but we will
"We wanted to stimulate their thinking certainly provide a lot of managers
during the conference, and send them to the healthcare industry'," lie said.
off with some new ideas and perhaps
Much of what we teach here can be
even a different perspective.”
transposed to this last-growing and
Organised under the aegis of the
incredibly important sector."
Healthcare Management Initiative
The conference revolved around
at INSEAD, "Healthcare 2020:
three themes, genetic profiling,
The Promise of Innovation" was the
innovations in medical technology,
second in the series Les Conferences
and new approaches to the organisation
Roger Godino. The scries was started of health services.
Genetic Profiling: A Mew of I be Future
Editorial: The Internet
Revolution ° IEP Fontainebleau
Singapore
New Associate Dean Appointed
« Asian Campus Update
Challenges of Large
Corporations ® World Bank
President Speaks » New
Campaign Gifts
Alumni Giving o Wendel/CGIP
Chair Inauguration
Learning from Internet Leaders
o Faculty Awards & Honours
Faculty Publications
IN Briefs « The INSEAD Calendar
'The first keynote speaker was
Dr. Kliri Slelansson, a neurologist
anil CEO ol deCode Genetics.
Dr Stelrtnssons company was recently
granted permission by the Icelandic
government to create a database that will
combine medical, genealogical and
genetic data. He spoke about how this
controversial approach will lead
to increasing quality ol life while
decreasing healthcare costs. "Individual
genetic profiles will become one of themost important tools in treating disease
by helping tailor treatment to the
disease," he said. Though lie admitted
that genetic profiling raises serious
questions about who will have access to
(Iris information especially lor insurance
companies, employers and mothers-tobe, "it would lie criminal not Io develop
this knowledge because it could save
people's lives." I Ic foresees that genetic
counselling will become part ol basic
education: "treatment ol disease will be
not only based on the nature ol the
disease but also on the individual."
For him, it will also lead to a paradigm
sliilt in healthcare systems. In the
future, healthcare systems will move
from an intervention to a prevention
>de, with more focus being placed on
fitness and well-being centres instead
ol traditional provider structures.
Questions were raised about how
genetic profiling would affect public
policy, social dialogue and information
access. "Any change needs careful
management by governments," pointed
out Strachan Heppel, Chairman of
the Management Board, European
Medicines Evaluation Agency (EMEA).
"We have to identify general public
concerns and there must be full, open
and honest public discussions of issues.”
The audience questioned who would
have access to this information,
who would own it, and who would be
allowed to use it. Professor Theodore
Marmor ol die Yale School ol
Management responded dial the most
obvious risk is that the information will
be misused. "Insurance companies are
Building on the
HMI experience and
developing further
management
knowledge and insight
requires on-going and
in-depth research. For
this reason, Novartis,
a global leader in the
life sciences with
Daniel Vasella
100,000 employees
worldwide, has endowed the Novartis Chair
in Healthcare Management. This chair will
help develop understanding and insight into
the future developments in the sector and
the evolving role of the pharmaceutical
industry. "Our industry is undergoing rapid
change due to intense global competition,
innovation and cost pressures around the
world," said Daniel Vasella, Chairman and
CEO of Novartis. "As a leader in our field,
Novartis will best meet these challenges and
fully maximise opportunities by sharing
know-how and continuous learning
throughout the company. Many members of
our management team have benefited from
INSEAD, further sharpening their skills.
We are delighted to be deepening our
relationship with the institute by funding
a chair in healthcare management."
Formed through the 1996 merger of Ciba
and Sandoz, Novartis is a long-time friend of
INSEAD. Sandoz gave the Sandoz Chair in
Management and the Environment in 1990,
which is dedicated to the study of
environmental problems and opportunities at
management level. The chair was the first of
its kind to be created at a European business
school.
From 1985 to 1994, Ciba was a very
important supporter of the Management of
Technology and Innovation Programme at
INSEAD. This project increased the institute's
research and development efforts in the
management of technology and innovation.
Novartis currently employs 29 MBA
graduates, has sent more than 600 executives
on programmes and is represented on several
of INSEAD's advisory boards, including the
INSEAD Board, the Swiss Council and the
Advisory Committee for Management
Education.
paid to think about risk selection, not
about policies in healthcare,” he said.
Technological Innovation
and (he Hospital of the Future
The second plenary session discussed
how digitalisation, computerisation,
networking and the Internet are
creating "e-hcallhcare." “We can predict
a move towards home-based diagnostic
screening, monitoring and ambulatory
treatments which include remote check
ups and on-line follow-ups," noted
I'rancis Bailly, Vice-President, GE
Medical Systems Europe. “The role ol
hospitals might become that ol 'centres
ol competence’which deal exclusively
with the most complex diagnosis and
treatments."
Continued on page 2
INSEAD's Focus
on Healthcare
H NSEAD's Healthcare Management
0 Initiative (HMI) was conceived in 1996
in recognition of the enormous economic,
social, and political significance of the
healthcare sector and in the belief that
the application of many of the tools and
analytical approaches of management
could add considerable value in this time
of change. HMI is led by Professor John
Kimberly, the Salmon and Rameau Fellow
in Healthcare Management, and Dr Franz
Schmidthaler, the programme director.
Goal 1 Eradicate extreme poverty and hunger
Target 1. Halve, between 1990 and 2015. the proportion of people whose income is less than one dollar a day
’
*
“
8
8
Poorest quintile’s share in national income or consumption, per cent (WB)
Population below $1 (PPP) per day consumption, percentage
Population below national poverty line, rural, percentage
Population below national poverty line, total, percentage
Population below national poverty line, urban, percentage
■
Poverty gap ratio
8
Purchasing power parities (PPP) conversion factor, local currency unit to international dollar
Target 2. Halve, between 1990 and 2015, the proportion of people who suffer from Hunger
8
■
8
8
Children under 5 moderately or severely underweight, percentage
Children under 5 severely underweight, percentage
Population undernourished, number of people
Population undernourished, percentage
Goal 2 Achieve universal primary education
Target 3. Ensure that, by 2015, children everywhere, boys and girls alike, will be able to complete a full course
of primary schooling
“
Literacy rates of 15-24 years old, both sexes, percentage
a
Literacy rates of 15-24 years old men percentage
a
Literacy rates of 15-24 years old, women, percentage
a
Net enrolment ratio in primary education, both sexes
°
Net enrolment ratio in primary education boys
“
Net enrolment ratio in primary education, girls
"
Percentage of pupils starting grade 1 reaching grade 5, both sexes
8
Percentage of pupils starting grade 1 reaching grade 5, boys
"
Percentage of pupils starting grade 1 reaching grade 5 girls
8
Primary completion rate, both sexes
8
Primary completion rate, boys
a
Primary completion rate, girls
Goal 3. Promote gender equality and empower women
c
Target 4. Eliminate gender disparity in primary and secondary education, preferably by 2005, and to all levels of
education no later than 2015
“
"
Gender Parity Index in primary level enrolment
Gender Parity Index in secondary level enrolment
8
Gender Parity Index in tertiary level enrolment
0
Seats held by men in national parliament
8
Seats held by women in national parliament
8
Seats held by women in national parliament, percentage
8
Share of women in Wc..-,e employment in the non-aqricultural sector
B
8
Total number of seats in national parliament
Women to men parity index, as ratio of literacy rates, 15-24 years old
Goal 4. Reduce child mortality
O
Target 5. Reduce by two thirds, between 1990 and 2015, the under-five mortality rate
8
Children 1 year old immunized against measles, percentage
■
Children under five mortality rate per 1,000 live births
8
Infant mortality rate (0-1 year) per 1,000 live births
Goal 5. Improve maternal health
o
Target 6. Reduce by three quarters, between 1990 and 2015, the maternal mortality ratio
8
Births attended by skilled health personnel, percentage
8
Maternal mortality ratio per 100.000 live births
Goal 6. Combat HIV/AIDS, malaria and other diseases
o
Target 7. Have halted by 2015 and begun to reverse the spread of HIV/AIDS
■
Condom use at last high-risk sex, 15-24 years old, men, percentage
■
Condom use at last high-risk sex, 15-24 years old, women, percentage
8
8
Condom use to overall contraceptive use among currently married women 15 49 years old,
percentage
Contraceptive use among currently married women 15-49 years old, any method, percentage
8
Contraceptive use among currently married women 15-49 years old, condom, percentage
8
8
Contraceptive use among currently married women 15-49 years old, modern methods, percentage
Men 15-24 years old with comprehensive correct knowledge of HIV/AIDS. percentage
8
Men 15-24 years old who know ttiat a person can protect himself from HIV infection by consistent
condom use percentage
People living with HIV, 15-49 years old, percentage
■
■
■
Women 15-24 years old with comprehensive correct knowledge of HIV/AIDS. percentage
Women 15-24 years old, who know that a person can protect himself from HIV infection by consistent
condom use, percentage
Target 8 Have halted by 2015 and begun to reverse the incidence of malaria and other major diseases
■
Tuberculosis death rate per 100,000 population
n
Tuberculosis detection rate under DOTS, percentage
■
Tuberculosis prevalence rate per 100,000 population
■
Tuberculosis treatment success rate under DOTS, percentage
Goal 7 Ensure environmental sustainability
o
Target 9 Integrate the principles of sustainable development into country policies and programmes and reverse
the loss of environmental resources
H
Carbon dioxide emissions (CO2), metric tons of CO2 per capita (CDIAC)
■
Carbon dioxide emissions (CO2), thousand metric tons of CO2 (CDIAC)
B
Consumption of all Ozone-Depleting Substances in OPP metric tons
■
Consumption of ozone-depleting CFCs in OPP metric tons
o
o
“
Energy use (Kg oil equivalent) per $1,000 (PPP) GDP
°
Land area covered by forest, percentage
■
Protected area to total surface area, percentage
n
Protected areas, sq. km,
Target 10. Halve by 2015 the proportion of people without sustainable access to safe drinking water
“
“
Proportion of the population using improved drinking water sources, rural
Proportion of the population using improved drinking water sources, total
■
Proportion of the population using improved drinking water sources, urban
n
Proportion of the population using improved sanitation facilities, rural
0
Proportion of the population using improved sanitation facilities, total
■
Proportion of the population using improved sanitation facilities, urban
Target 11 By 2020 to have achieved a significant improvement in the lives of at least 100 million slum dwellers
“
“
Slum population as percentage of urban, percentage
Slum population in urban areas
Goal 8 Develop a global partnership for development
o
Target 15 Deal comprehensively with the debt problems of developing countries through national and
international measures in order to make debt sustainable in the long term
o
“
Debt service as percentage of exports of goods and services and net income from abroad
Target 16. In cooperation with developing countries, develop and implement strategies for decent and
productive work for youth
“
o
Ratio of youth unemployment rate to adult unemployment rate, both sexes
■
Ratio of youth unemployment rate to adult unemployment rate, men
n
Ratio of youth unemployment rate to adult unemployment rate, women
"
Share of youth unemployed to total unemployed, both sexes
“
Share of youth unemployed to total unemployed, men
■
B
Share of youth unemployed to total unemployed, women
Share of youth unemployed to youth population, both sexes
B
“
Share of youth unemployed to youth population, men
Share of youth unemployed to youth population, women
B
Youth unemployment rate, aged 15-24, both sexes
B
Youth unemployment rate, aged 15-24, men
"
Youth unemployment rate, aged 15-24, women
Target 18 In cooperation with the private sector, make available the benefits of new technologies, especially
information and communications
Internet users
Internet users per 100 population
Personal computers
Personal computers per 100 population
Telephone lines and cellular subscribers
Telephone lines and cellular subscribers per 100 population
50 Bangalore Urban Health Initiative
11"'Dec
CHC
51 Health as a Human Right Training
12"’ 13'"
Dec
23,fl Dec
Bagalkote
3J JAAK Planning Meeting
5'" Jan
10
CHC
54 Solidarity opposing the GM Foods & Bt
Brinjal
55 MFC Meeting
18Janl0
52 Public Hearing
56 “ Public Health situation in India and Civil
society responses with the students of 1HP ‘Study Abroad’ coordinated with Mani
Kalliath
57 Workshop on SCP
58 Public Hearing -Bagalkote
59 Public Hearing -Belgaum
8-10 Jan
Sewagram
2"" Feb
10
CHC
8'" Feb
ISI, Blr
Bagalkote
Feb 10
*19®
MarlO
MarlO
22th
March
62 Workshop on Health
63 Public Hearing -Bellary
64 CHLP announcement/interviews/ final
sharing /Final feedback/advisory comm.
meeting/orientation
Belgaum
Haveri
60 Public Hearing -Haveri
61 BBMP Election manifesto
Davangere
March
“27*
MarlO
5FebMar
Consolidatio
n ofPHC
Survey
HHR Trg
Public
Hearing
Planning
about Pub
Herg
Advocacy
Community
Health"
Networking
Discusions
Public Hearing
JAAK
EP, KBO,
RV, SR
Listing
Y
JAAK
EP & KBO
Listing
Y
JAAK
EP, KBO,
PL
EP, KBO,
Pl and PL
Report
Y
Listing
Y
JAAK
JAAK.
--
CHLP
Public Health
Public
Hearing
Public
Hearing
Public
Hearing
CHC
EP, RV, PI
Report
Yes
CHC & JAAK
JAAK
EP, KBO
EP, KBO,
PI
EP. KBO,
Pl
EP. KBO,
PI
EP. Pl and
Soumya
EP, KBO
Report
Report
No
No
Obalesh
Prahlad
Report
No
Prahlad
Report
No
Prahlad
Report
Yes
List
No
EP
EP. KBO,
Pl
Report
No
Prahlad
JAAK
JAAK
Bangalore
Public Health
CHC
Davangere
Public Health
JAAK
Bellary
Public
Hearing
-
JAAK
NATIONAL MEETING UPDATE FORM
BE PART OF THE GLOBAL CALL
TO ACTION AGAINST POVERTY
I
GLOBAL call to action
AGAINST poverty
Please return via email to info@whiteband.orq or by fax to +44 (0)870 010 8707 by January 14th 2005 after your national meeting.
This form will give the International Facilitation Group an initial record of your national plans and discussions, and the main contacts who
will lead the communication with us on the Global Call to Action against Poverty.
1. Major national organisations networks, and groups planning to be involved in the Global Call to Action Against Poverty
2. Communications co-ordinators for the Global Call to Action Against Poverty
Name
Organisation
Position
Telephone
Email address
3. Main outcomes of your meeting - wha”? actions do you have planned in 2^)5?
When?
Where?
Action
4. Will you be supporting the White Band Action on July 1st?
In early September?
Aims
YES / NO
YES / NO
5. Have you decided on any particular slogans / statements to write on the white band?
6. Will you use the White Band action nationally on any dates other than July and September?
Please note when and explain significance.
India - National Contacts List
This is a list of all the people in India who have received this mailing, please pass it
on to anyone else you think might be interested. There are many activities already
being organised and planned for next year. The aim of the White Band action is to
support these efforts and provide an opportunity to join up in solidarity with others
all over the world at the same time.
In India there is no national platform already active. You can make this happen
and start your national platform in support of the Global Call to Action against
Poverty by talking to the other organisations on this list, and then letting us know
your plans.
University of Delhi
C-516 Defence Colony,
New Delhi 110024
India
Prof. S. Dasgupta,
Priyaranjani Dass
A-12Paryavaran Complex,
Maidangarhi Road,
New Delhi
110030
India
Minar Pimple,
Young Men's Christian
Association (YMCA) - Beirut
53/2 Nare Municiple School,
opp. Nare Park Parel,
Mumbai ? 400012,
India
Mr. Arbind Singh,
NIDAN
Sudama Bhawan,
Boring Road,
Patna 800001
India
Alika Khosla,,
Director-Operations,
Breakthrough Trust
C 3/15, Safdarjung
Development Area,
New Delhi 110016
India
Arvind Ojha„
Secretary,
Urmul Rural Health
Research and Development
Trust
P.O. Box 55, Urmul Bhawan,
Sri Ganganagar Road,
Bikaner 334001, Rajasthan,
Near Central Roadways Bus
Stand
Muralidhar Koteshwar,
SriSri Ravishankar Vidya
Mandir Trust
No. 1987-A, 26th Main,
South Road C Cross,
Bangalore 560069,
9th Block, Jayanagar
India
Ashok Nanda,,
Secretary,
VIKASH
D-2/7, Industrial Estate,
Rasulgarh,
Orissa,
Bhubaneswar 751010
India
K.M. Sheshagiri,
Learning Advisor,
Plan India
C-210 Sarvodaya Enclave,
New Delhi,
Pin-110 017,
India
Mr. Rajesh Tandon,
PRIA (Society for
Participatory Research in
Asia
42 Tughlakabad Institutional
Area,
New Delhi
110062
India
Manmohan Singh,
India
Ashok Singh,
Ramon Aboitiz Foundation,
Inc.
Sahbhagi Road,
Behind Police Fire Stattion,
Sitapur Rd.,
Lucknow, 227 208
India
Dr. Claude Alvares,
Director,
Goa Foundation
G-8 St Britto's Apartments,
Feira Alta.Mapusa,
Goa
403 507 Goa
India
Ms Claire Noronha,
PROBE/CORD
R. 20 W, Indian Social
Institute,
10 Lodhe Inst. Area,
New Delhi
110 003
India
Dr. Ravesh Tandon,
PRIA
42 Tughlakabad Institutional
Area,
New Delhi
110 062
India
Director,
Potters House Trust Inc.
18 Infantry Rd. 517 Maple
Monroe, Ml 48162 (US),
Karnataka
01 Bangalore
India
Mr. Rohit Jain,
Executive-Director,
SRUTI - Society for Rural,
Urban & Tribal Initiative
Q-1, Hauz Khas Enclave,
NEW DELHI - 110016
India
Mr. Pradeep Priyadarshi,
Secretary,
Pragati Grameen Vikas
Samity
East of Anurag Hospital,
Patna 801503, Bihar,
West Bailey Road
India
Subash ChandraMohapatra,
Forum for Fact-finding
Documentation and
Advocacy
A-3, Shahni Vihar,
Telibandha Ring Rd. no. 1,
CHHATTISGARH - 492006,
P.O. Ravigram, Raipur Dist.
India
N.B. Sarojini,
Management-Trustee,
Sama Resource Group for
Women & Health
G-19, 2nd Floor,
Marg no. 24, Saket,
New Delhi 17
India
Dr. Yogesh Jain,
Jan Swasthya Sahyog
1-4, Parijat Colony,
Nehru Nagar,
Bilaspur-495001,
Chhattisgarh
India
Savita Varde-Naqvi,
Senior Officer Meciia and
External Relations,
United Nations Children's
Fund
India Country Office,
Unicef House,
73 Lodi Estate,
New Delhi
110 003
Shobha Sakharwade,
Secretary,
PRAKRITI
Water Tank Road,
Lonara,
Gumthi-441111,
Nagpur (Maharashtra)
India
Colleague,
Centre for Youth & Social
Development (CYSD)
E/l Institutional Area,
Bhubaneswar 751013
India
Ms. Shobha Gasti,
Mahila Abhivrudhi Mathu
Samrakshana Samste
(MASS)
House no. 574, Patil
Building,
Mruthyunjayanagar,
Belgaum District, KARNAT,
Ghataprabha 591306, Gokak
Taluk,
Arun Jindal,
Society for Sustainable
Development
Jagdamba Colony,
Karauli, Rajasthan 322241
India
Mr. J. Vimalanathan,
Executive-Dire,
NESA - New Entity for Social
Action
93/2 Charles Campbell
Road,
Cox Town,
BANGALORE - 560005,
Karnataka
India
Mr. Girish Sant,
Trustee,
Prayas
Amrita Clinic, Athawale
Corner,
Karve Road,
Pune 411004, Maharashtra,
Deccan Gymkhana Corner
India
Mr. Ravi Duggal,
CEHAT - Research Centre
of Anusandhan Trust
Aram Society Road, Sai
Ashray,
Village Kole Kalyan,
Mumbai 400055,
Vakola, Santa Cruz (E)
India
Dr. Narendra Gupta,
Secretary,
PRAYAS HEALTH
B-8, Bapu Nagar,
Senthi,
Chittorgarh 312025,
Rajasthan
India
Mr. Badal Kumar-Tah,,
Secretary,
SANHATI
Plot no. 163/361,
Gajpati Nagar,
Orissa,
Sainik School, Bhubaneswar
751005
India
Cherian Mathews,
Oxfam (India) Trust
C-5 Qutab Institutional Area,
New Delhi
110016
India
Mr. Yogendra ExecutiveDirector,
Bodh Shiksha Samiti
AA-1, Anita Colony,
Bajaj Nagar,
Jaipur 302015, Rajasthan
India
Dr. Mani Jacob,
General Secretary,
All India Association for
Christian Higher Educati
Ecumenical House,
39 Institutional Area, DBlock,
Janakpuri,
New Delhi
110 058
Babu Mathew,
ActionAid Int India
India
Shakil Ahmed Kakvi,
Chairman,
KAINAT FOUNDATION
KAINAT INTERNATIONAL
SCHOOL.KAINAT
NAGAR,KAKO(JEHANABA
D),
BIHAR 800418
India
Mr. Amit Singh,
Development Manager,
Network of Entrepreneurship
& Economic Development
(NEED)
39- Neel Vihar
Near 14- Sec. Power House,
Indira Nagar
Dr B Ekbal,
People's Health Movement
India
Professor Ali Baquer,
CAN - Concerned Action
Now
3067, B-4 Vasant Kunj
Aruna Asaf Ali Road,
New Delhi
110 070
India
George Mathew,
Institute of Social Sciences
8, Nelson Mandela Road
Vasant Kunj
New Delhi
110070 New Delhi
India
Director,
Strategic Alliance of
Organisations
C 75, South Extension Part
ll„
New Delhi
New Delhi 110049
India
Lucknow 226016
Dr Vijay Rukmini Rao,
GRAMYA - Gramya
Resource Centre for Women
1-16-79/3, Sainagar Colony,
Alwal,
Secunderbad 500015,
Andhra Pradesh
India
PRIA, Participatory
Research in Asia
42, Tughlakabad Institutional
Area,
NEW DELHI
110 062
India
Burnad Fatima,
Coordinator,
Tamil Nadu Women's
Collective
E-53,15th street,2nd cross
Periyar Nagar
Chennai
Kailash Satyarthi,
SACCS Central Office
(Global March Against Child
Labour)
L-6 Kalkaji,
NEW DELHI
India
Tamilnadu
Tamilnadu 600 082
Nav Bharat Jagriti Kendra
Amritnagar, P.O. Korrah,
Post Box 37,
Hazaribag,
BIHAR
825 301
India
Dr. Stephen Maveley,
President,
All India Association for
Christian Higher Educati
Ecumenical House,
39 Institutional Area, DBlock,
Janakpuri,
New Delhi
110 058
Director,
lndianNGOs.com Pvt Ltd
Prasad, Ghantali,
Naupada
Thane
Thane 400 602
India
Director,
Centre for Youth and Social
Development
E-1, Institutional Area,
Chandrashekharpur
ORISSA
Bhubaneswar 751013
India
Ms Neelima Khetan,
Chief Executive,
Seva Mandir
Old Fatehpura,
Udaipur,
Rajasthan
313 004
India
Director,
Potters House Trust Inc.
18 Infantry Rd. 517 Maple
Monroe, Ml 48162 (US),
Karnataka
01 Bangalore
India
T.J.P.S. Vardhan,
SIDUR
144/2RT, Vijayanagar
Colony,
HYDERABAD 500 057, A.P.
India
Malini Ghosh,
Nirantar
B-64 2nd Floor,
Sarvodaya Enclave,
New Delhi
100 017
India
Mr Kedar Nath Bishoyi,
District Project Director,
National Child Labour
Project (NCLP)
Qr. No. 3RI Irrigation Colony,
At/Post: Balimela,
Dist. Malkangiri,
Orissa
India
Shri Ranjit Mukherji,
Programme Coordinator,
Ramakrishna Mission
Lokshiksha Parishad
PO Narendrapur,
Kolkata, Dist South,
25 Paraganas,
West Bengal
701 103, 743 508
India
Gagan Sethi,
President,
YUVA - Youth for Unity and
Voluntary Action
2nd Floor, Kamgar Bhavan,,
Baidhyanath Square
Rambagh,
Nagpur
440 044
India
Prof. Jaroslav Vanek,
Director,
Renaissance Universal
527, VIP Nagar
Tiljala
Prema Gopalan,
Director,
Swayam Shikshan Prayog
58 CVOD Jainn High School,
5th Floor,
84 Samuel Street,
Pali Galli, Chaar Null Dongri,
Mumbai
400 009
India
Ms. Deepika D'Souza,
Executive Director,
India Centre for Human
Rights and Law (ICHRL)
5th Floor, CVOD Jain
School,
84, Samuel Street,
Dongri
CALCUTTA
Calcutta 70039
West Bengal
Mr Jacob Thundiyl,
President,
People's Rural Education
Movement
Mandiapalli, Rangailunda,
Bhanjavihar,
ORISSA
BERHAMPUR 760007
India
Jagdanand ,
Social Watch/CYSD
India
Mumbai
Abha Bhaiya,
Coordinator,
JWRC - Jagori Women's
Resource Centre
C-54 (Top Floor), South
Extension II,
New Delhi
110 049
India
Manu Alphonse,
Social Watch Tamilnadu
India
Mr. ,
Chairman,
MITHRAM
Mithram Rehabilitation
Complex,
Kanjirikkappilly,
Arakunnam P.O
Mulanthuruthy 682313
Dr Thakur V. Hari Prasad,
president,
Thakur Hari Prasad Institute
of Research and
Rehabilitation for the
Mentally Handicapped
Vivekananda Nagar,
Dilsukh Nagar,
Kerala
HYDERABAD
Director,
MC - Mobile Creches
DIZ Area, Raja Bazaar
Sector IV,
New Delhi
110001
India
Sugandhi Baliga,
Executive Director,
Youth for Unity and
Voluntary Action
52/53 Nare Park Municipal
High School,
Parel,
Mumbai
400012
India
Mr Ashish Sen,
Director,
Voices
165 9th Cross 1 st Stage,
Indiranagar,
Bangalore
560 034
India
Dr. D. Suryakumari,
Director,
Centre for People's Forestry
12-13-445, Street no. 1,
Tarnaka,
Secunderabad 500017, A.P.
India
Dr. Jitendra Uniyal,
Doctor,
International society for
alternative medicine
14 A Circular road,
Dehra dun
248001 Dehra dun
India
Dadi Janki,
Director,
BRAHMA KUMARIS
WORLD SPIRITUAL
UNIVERSITY
Pandav Bhawan P.O.Box
No. 2 Mount Abu 307501,
Rajasthan
307501 Rajasthan
India
Director,
The Samabhavana Society
602 Debonair,
153B V.S. Marg,
Mahim,
Mumbai
400016
India
Mr. R. N. Dey,
President-Executive
Committee,
CUTS - Consumer Unity and
Trust Society
D-217, Bhaskar Marg
Bani Park,
Jaipur
302 016
India
Dr Vasudha Prakash,
Director,
V-Excel Educational Trust
77 "Anugtaha",
Greenways Lane,
R.A. Puram,
Chennai
600 028
India
Chevian L Mathew,
Oxfam GB
India
Nancy Gaikwad,
Executive Director,
DISHA - Disha Social
Organisation
5 Ratnaraj Apartments
Karjat Road
RAIGAD DIST,
Maharashtra
410 201
India
Director,
Regional Centre for
Development Cooperation
424, Sahidnagar,
ORISSA
Bhubaneswar 751007
India
Campaign against Child
Labour
c/o PECUC, House no. VIIH-26,
Sailashree Vihar,
bhubaneswar 751021,
Orissa
India
Hari Dev Goyal,
Nkong Hill Top Common
Initiative Group
P.O. Box 10518, JNU Post
Office, E-6-b, MIG Flats,,
New Delhi, 110067
India
Roli Prasad,
President,
India Development Service
1920 S. Highland Avenue,
Suite 300,
Lombard, IL
60148
India
Director,
India Social
11/158 (LGF)Malviya Nagar,
NEW DELHI
New Delhil 7 1100
India
Mr.Subhransu-Bhusan
Swain ,
Paribartan
At - Pendarabasa,
Dimiria,
Po.-Pallahara,
Angul - 759119, ORISSA
India
Soni Srivastava,
Policy and Research
Coordinator,
National Alliance for Right to
Education and Equity
T-101-C,
Bharat Nagar,
New Friends Colony,
New Delhi
110 065
Director,
The Global Communication
Center for Development
Organisations
63C Bharahtiar complex,
100ft Rd,
Vadapalani,
Chennai
600026
India
Nishat Farooq,
SFC
Jamia Millia Islamia,
Jamia Nagar,
New Delhi
110 025
India
Inu Annue Stephen,
Childline India Foundation
2nd Floor Nanachowk
Munucipal School,
Frere Bridge,
Low Level, Near Grant Road
Station,
Mumbai
400 007
India
Anuta Anand,
Director,
Women's Feature Service
G-69 Nizamuddin West,
New Delhi
100 013
India
Mr Vivekanandan,
Chief Executive,
South Indian Federation Of
Fishermen Societies
T.C. 20/816-1 Karamana,
PO Trivandrum,
Kerala
695 002
India
Dr Ramanath Nayak,
National Conference of Dalit
Organisations (NACDOR)
India
Swati Narayan,
Asian South Pacific Bureau
of Adult Education
India
Swami Asaktananda,
Director,
Ramakrishna Mission
Lokshiksha Parishad
PO Narendrapur,
Kolkata, Dist South,
24 Paraganas,
West Bengal
700 103, 743 508
India
Mohammad Rafiuddin,
Hyderabad Council of
Human Welfare
#12-2-790/56,
Ayodhya Nagar Colony,
HYDERABAD 500028,
Andhra,
Mehdipatnam
India
Director,
Barefoot College
Tilonia
Madanganj
District Ajmer
Tilonia 305816
G Placid,
Sahayi Centre for Collective
Learning
T.C. 5/789 Peroorkada P.O.,
Thiruvananthapuram,
Kerala
695 005
India
Dr. Yogesh Kumar,
Director,
Samarthan - Centre For
Development Support
E-7/81 Arera Colony,
Bhopal
426 016
India
Mukul Sharma,
Action Aid Int Asia
India
Fr. Louis Mascrenhas,
Director,
DDWS - Diocesan
Development and Welfare
Society
Diocesan Deve. & Welfare
Society, Bishop's House,,
32, Thornhill Road,
Allahabad
211-002
Sulabha A Donde,
Leader,
Happy Home Society
Resi 205 Aradhana,
J Sawant Marg Dahisar (W),
Mumbai
400 068
India
Ms Elizabeth Sivakumar,
Executive Director,
Positive People
A/7 Skylark Apts., Near
Govinda Buildinq,
GOA
Pajim 403 001
India
Shri Arvind. N. Lalbhai,
President,
Blind People's Association
Dr. Vikram Sarabhai Road
Near IIM, Ahmedabad
Vastrapur
Gujarat
Ahmedabad 380015
India
Director,
Muktangan International
Foundation
503, Ivory Towers-1,
Juhu Tara Road,
Mumbai
Mumbai 400049
India
Rajasthan
Tilonia 305816
India
Mr. Srinivas Mudrakartha,
Director,
Vikram Sarabhai Centre for
Development Interaction
Nehru Foundation for
Development
Thaltej Tekra,
Ahmedabad
380 054
India
Mr Hemraj Bhati,
General Secretary,
Seva Mandir
Old Fatehpura,
Udaipur,
Rajasthan
313 004
India
Director,
CRE-The Centre for
Resource Education
CRE - Center for Resource
Education
201, Maheshwari Complex
Masab tank,
Hyderabad
500 028
India
Ashok K Bharti,
National Conference of Dalit
Organisations (NACDOR)
India
Ms. Aparna Bhat,
Director,
Human Rights Law Network
65, Masjid Road Jungpura,
NEW DELHI
New Delhi-110014
India
Mr. K.Somnath Nayak,
President,
Nagarika Seva Trust
P.O. Guruvayanakere 574,
217 Belthangady Taluk,
DAKSHINA KANNADA, DT.
India
P Chennaiah,
APVVU/NAPM
India
Mr. Achyut Das,
Director,
AGRAGAMEE
AT/P.O.-KASHIPUR-765015
DIST.-RAYAGADA
ORISSA
India
Mr. Vijay Tendulkar,
President,
National Centre for
Advocacy Studies
Serenity Complex
Ram Nagar Colony
Pashan
Pune
India
Shireen Miller,
Save the Children
2nd floor,
A-20 Kailash Colony,
New Dehli
110048
India
Director,
Peaceful Action
157/J, P. G. H. Shah Road
Kolkata 700032
West Bengal/lndia
Kolkata
700032 Kolkata
India
Director,
People's Institute for
Development and Training
People's House,
A12 Paryavaran complex
Saidullajab
New Delhi
New Delhi 110070
India
Javed Anand,
Sabrang Communications
Post Box No. 28253, Juhu
P.O., Juhu,
Bombay
400 049
India
Mr N. Paul Divakar,
National Convenor,
National Campaign on Dalit
Human Rights
Premier Residency PLot No.
165, 1-8-142B, 3rd Cross,
Prenderghast Road,
Secunderabad
Secunderabad 500 003
India
Jayashri Balachander,
President,
CCD - The Covenant Centre
for Development
18-C/1, Kennett Cross Road,
Ellis Nagar,
Madurai
625 010
India
Sh. Binoy Acharya,
Director,
UNNATI - Organisation for
Development Education
G-1,200 Azad Society
Ahmedabad,
Gujarat
380 015
India
Director,
Gene Campaign
J-235/A, Lane W 15 C,
Sainik Farms,
New Delhi
110062
India
Dr. Shiraz A.Wajih,
Secretary,
Gorakhpur Environmental
Action Group
224, Purdilpur,
M.G. College Road,
Postbox # 60,
GORAKHPUR 273 001 U.P.
India
Mrs. Mumtaz Ben,
Chairperson,
MMBA - Mahila Mandal
Barmer Agor - Gender
Equity and Justice
Indira Colony .Barmer
Rajasthan,
India
Mr. K. Satyarthi,
AVA - Association for
Voluntary Action
L-6, Kalkaji,
NEW DELHI 110019
India
Mr. K.P. Sinha,
Secretary,
(JSS) Jagriti Sewa Sanstha
Vill. UrlaP.O. Abhanpur,
RAIPUR 493 661, MADHYA
PRADESH
India
Mr. Satyendra Kumar-Singh,
Secretar,
AAA - Agrarian Assistance
Association
Near Forest Range Office,
Bandorjori Ch.,
DUMKA814 101, Jharkhand
India
Mrs. Lalita Missal,
Vice-President,
Council of Professional
Social Workers
D-49.MAITREE
VIHAR,CHANDRASEKHAR
PUR,
ORISSA
BHUBANESWAR-751023
India
Damodaram Kuppuswami,
ActionAid Int India
India
Director,
INDIAN COMMITTEE OF
NON-GOVERNMENTAL
ORGANIZATIONS FOR
THE UNITED NATIONS
C-4/70. Safdarjung
Development Area,
New Delhi
India
Mr. M.V.N. Rao,
Executive-Directo,
Grama Vikas
Honnsetthalli,
Yelagondahalli P.O.,
KOLAR DISTRICT 563 127,
Karnataka S
India
Pradeep S. Mehta,
Canadian Crossroads
International
D-218 Bhaskar Marg,
Bani Park,
Jaipur 302016, Rajasthan
India
Nalini Abraham,
Plan India
C-210 Sarvodaya Enclave,
New Delhi,
Pin-110 017,
India
Mr. Raju Samson,
Project-Manager,
Lokshakti Samajsevi
Sanstha (LSS)
16/391, Hanuman Nagar,
Titurdih,
Durg 491001, Chhattisgarh
India
Himanshu Rath,
Director,
AGEWELL FOUNDATION
M-8A, Lajpat Nagar-IINew
Delhi,
New Delhi
Delhi-11 00 24
India
Mr. K.Rama Rao,
(CWS) Centre for World
Solidarity
12-13-448,
St.No.1, Tarnaka,
SECUNDERABAD 500 017
India
Mr. Biswajit Sen,
Grameen Development
Services
B 1/84, Sector-B,
Aliganj,
LUCKNOW 226 024
India
B.C. Rokadiya,
166 Mandakini Enclave,
New Delhi
110 019
India
Mr. Rajesh Kumar,
Chief-Functionar.
LOKMITRA
B-57 & 62,
Anand Nagar,
Raebareli, 229001,
Uttar Pradesh
India
Fr. Varghese Pallipuram,
Executive Director,
BOSCO
91 'B‘ Street,
6th Cross
Gandhinagar
Bangalore
Bangalore 560009
India
Mr. Umasankar Sahu,
Coordinator,
Association for Development
& Health Action in Rural
Areas
At/P.O. Loisingha, Dist.
Bolangir (Orissa)
Pin Code. 767 020
ORISSA
Mr Ashok Kumar Singh,
SAHBAGHI SHIKSHAN
KENDRA
Sahbhagi Rd,
Lucknow,
India
Dr. Rama Ch.Dash,
Member-Secretar,
NIPDIT - National Institute
for People's Development,
Investig. & Training
College Road,
Phulbani, Dist. Kandhamal,
ORISSA 762 001
India
Ms Charmaine Rodrigues,
Commonwealth Human
Rights Initiative
N-8 Second Floor,
India
Dr. Imrana Qadeer,
Founder,
PSI - Peoples Science
Institute
252 Vasant Vihar-1„
Dehra Doon
248006
India
Director,
INDIAN COMMITTEE OF
NON-GOVERNMENTAL
ORGANIZATIONS FOR
THE UNITED NATIONS
C-4/70. Safdarjung
Development Area,
New Delhi
India
Sandeep Chachra,
ActionAid Int India
India
Mr. N. Samson,
GRAM - Gram Abhuydaya
Mandali
Dharmaram, 503 230,
DHARMARAM 503
230.NIZAMABAD DT.
India
Amitabh Behar,
National Center for
Advocacy Studies (NCAS)
India
India Alliance for Child
Rights
A64,
Gulrnohar Park,
New Delhi 110049,
India
Dr. Vasudha Dhagamwar,
Executive Director.
Multiple Action Research
Group (MARG)
125 Shahpur Jat, Second
Floor,
Near Asiad Village,
New Delhi
110 049
India
Mr. C. Ramachandraiah,
Centre for Economic &
Social Studies
Nizamiah Observatory
Campus,
India
Ms Sheela Bharat Patel,
SPARC
3691 Ellengale Drive,
India
Mr Jagadananda,
CYSD Social Watch
E -1 Institutional Area,
India
J Vincent Manoharan,
NCDHR
India
Mr Ranjan Rao Yerdoor,
Credibility Alliance
C/o Voluntary Action
Network India,
D25-D,South Extension Part
II,
New Delhi 110049
India
Sushil Kumar,
87 Panchwat,
Udaipur,
Rajasthan
313 001
India
Dr.Mrs. Daisy Dharmaraj,
PREPARE
4, Sathalvar Street
Mogappair West,,
Chennai, MADRAS 600 050
T.N.
India
John Chaloner,
National Director,
Plan India
C-6/6, SDA,
New Delhi
100 016
India
Dr. Madhav Chavan,
Prog.Director,
Pratham Mumbai Education
Initiative
Adarsha Mithai Mandir,
2nd Floor,
Mumbai 400007,
309 Tardeo Road, Nana
Chowk
India
Mr. N.S. Bedi,
President,
YIP - Young India Project
Bangalore High Way,
PENUKONDA 515110
ANANTAPUR DT.
India
Mr. A.P. Rao,
Centre for Education and
Agriculture Development
Sastry Nagar Colony,
NIRMAL504 106,
ADILABAD District
India
Mr. George Kadankavil,
President,
Cyriac Elias Voluntary
Association
CEVA Bhavan
Monastery Road
Karikkamuri
Kerala
Ernakulam 683 011
Mr. Aloysius P.Fern,
MYRADA
2, Service Road,
Domlur Layout,
BANGALORE 560 071,
KARNATAKA
India
Mr. M.P. Vasimalai,
Development of Humane
Action Foundation
No.18, Pillaiyar Koil Street,
S.S. Colony,
MADURAI 625 010, TAMIL
NADU
India
Anil K Singh,
SANSAD
India
K.C Choudhary,
Indian Adult Education
Association
17B Indraprastha Estate,
New Delhi
110 002
India
Savita Sinha,
F1,
University Officers' Quarters,
Vikram University,
Ujjain Madhya Pradesh
India
President,
Teachers' Association of the
Republic of Indonesia
Jalan Tanah Abang Tiga 24,
Jakarta
10160
India
Binoy Acharya,
UNNATI Organisation for
Development Education
G1-200,
Azad Society,
Ahmedabad
380 015
India
Meena Raghunathan,
Program Officer,
Centre for Environment
Education (CEE)
Nehru Foundation for
Development,
Thaltej Takra,
Ahmedabad
380 054
India
Mr Madhusudan,
Executive Secretary,
Yakshi
B-135, Sainikpuri,
Secunderabad,
Andhra Pradesh
500 094
India
Mr. Henri Tiphagne,
People's Watch Tamil Nadu
6A Vallabhai Road,
Chokkikulam,
Tamil Nadu,
Madurai
625 002
India
Mr. Santi Karar,
Executive Director,
FRIENDS' SOCIETY IN
SOCIAL SERVICE
GPO BOX # 2943,
CALCUTTA- 1
CK-165, SECTOR -II,
SALT LAKE CITY
CALCUTTA
Director,
People's Institute for
Development and Training
People's House,
A12 Paryavaran complex
Saidullajab
New Delhi
New Delhi 110070
India
Mr M.G Karrunanithi,
Award Trust
99/1 N.H. Road,
Nungambakkam,
India
Dr. S.Y Shah,
Director,
Adult, Continuing Education
& Extension
Unit 204,
School Of Social Sciences,
Jawaharlal Nehru University,
New Delhi
110 067
India
A Kalamani,
Center for World Solidarity
(CWS)
India
Fr. Robert Simon,
llaiya Deepam
P.O.Box 146,
Karumandapam,
Trichy
620001
India
Mr. Jambu Kumar Jain,
Pan African Dev't Education
and Advocacy Programme
(PADEAP)
1-K-22, Dadabari,
Kota-324009 (Rajasthan),
India
Mr Chaurasia,
Association for Voluntary
Action
L-6 Klakaji,
New Delhi
110 019
India
Prof. Ila Patel,
Institute of Rural
Management
C-42 Near NDDB Campus,
P.O. Box 60,
Anand,
Gujarat
388 001
India
Maria Lourdes Almazan
Khan,
Secretary General,
Asian South Pacific Bureau
of Adult Education (APS
1st Floor Shroff Chambers,
259/261 Perin Nariman
Street Fort,
Mumbai
400 001
Mr Mohd Khasim,
General Secretary,
All Indian Federation of
Teachers Organisations, A
C-6/30 Lawrence,
Delhi
110 035
India
Director,
Peaceful Action
157/J, P. G. H. Shah Road
Kolkata 700032
West Bengal/lndia
Kolkata
700032 Kolkata
India
Dr MG Shilpa Society,
president,
Shilpa Society
Shruti Shilpam, 21/1252 A
Palluruthy,
682006 Cochin
India
Director,
India Social
11/158 (LGF)Malviya Nagar,
NEW DELHI
New Delhi17 1100
India
Ms. Maja Daruwala,
Director,
Commonwealth Human
Rights Initiative
B-117 Sarvodaya Enclave,
New Delhi
New Delhi 110017
India
Mr. P.K. Sahoo,,
Chairman,CYSD,
CYSD - Center for Youth
and Social Development
E-1, Institutional Area,
P.O.: R.R.L.,
BHUBANESWAR 751 013,
ORISSA
India
Manjeet Ahluwalia,
698 Sector 11-B,
Chandigarh,
UT
160 011
India
Education Co-ordinator,
VSO India
VSO Programme Office,
B-8/25 Vasant Vihar,
New Delhi
110057
India
Indrani Sinha,
Director,
SANLAAP
38 B Mahanirban Road,
Kolkata 700 029, West
Bengal
India
Tasqeen Macchiwala,
Action Aid India, Olicay
Advocacy Unit
D-3 Blessington Apartments,
34 Serpentine Street,
Richmond Town,
Bangalore
560 025
India
Anil Dharker,
Senior editor,
InfoChange
Flat No. 3, Silver Spurs
NIBM Road
Kondhva
Pune
PUNE 411048
India
Ravi Pratap Singh,
Senior Manager,
Action Aid
Country Office 71,
Uday Park,
New Delhi
110 049
India
Jagdish Manubhai,
Chairman,
Indian Society for
Community Education
(ISCE)
Community Education
House, Dr. Navjivan Press
Road,
Gujrat Vidyapith,
Ashram Road,
Action Aid
INDIA NORTH,
E.7-727 - Arera Colony,
Bhopal
462 016
India
Action Aid
INDIA SOUTH,
225, Peters'Road,
Chennai
600 086
India
Director,
Regional Centre for
Development Cooperation
424, Sahidnagar,
ORISSA
Bhubaneswar 751007
India
Mahendra Singh Kunwar,
Himalayan Research Centre
(HARC)
744 Indira Nagar, Phase II,
PO New Forest,
Dehradun,
Uttar Pradesh
248 006
India
Shri Bhawani Shankar
Garg,
President,
Indian Adult Education
Association
17B Indraprastha Estate,
New Delhi
111 002
India
Mr Dhani Ram Singh Negi,
General Secretary,
All India Secondary
Teachers' Federation, AISTF
Central Office N.P.-129-B,
Maurya Enclave,
Pitampura,
Delhi
110 034
India
RN Mahlawat,
Treasurer,
Indian Adult Education
Association
17B Indraprastha Estate,
New Delhi
110 002
India
Dr. Alexander V. Daniel,
President,
Institute for Integrated Rural
Development (IIRD)
Kanchan Nagar,
Nakshatrawadi,
P.O. Box 562,
Aurangabad,
Maharashtra State
431002
Mrs Lalita Ramdas,
Lara' Ramu Farm
61 Bhaimala,
Alibag Dist. Raigad,
Maharashtra
402 201
India
Seema Gaikwad,
Coordinator,
Commonwealth Education
Fund- India
C-88, South Extension Part
II,
New Delhi
110049
India
Mr Yashwant Singh Rana,
General Secretary,
All India Secondary
Teachers' Federation, AISTF
C-8/302, Yamuna Vihar,
Delhi 53
110053
India
FODRA
302, Jai Apartments,
Sector 9, Rohini,
DELHI
110 085
India
Dr. Manorama Bawa,
Secretary General,
All India Women's
Conference
6 Bhagwan Dass Road,
Sarojini House,
New Delhi
110001
India
Mr Subramaniam Eswaran,
General Secretary,
All India Primary Teachers
Federation, AIPTF
41 Institutional Area,
Pankha Road, D-Block,
Janakpuri,
New Delhi
110 058
India
Mr Rohit Trivedi,
Director,
Arushi
E-7/793 Arera Colony,
Bhopal
462 016
India
Mr. E. Deenadayalan,
The Other Media
B-14 Second Floor,
Gulmohar Park,
New Delhi
110 049
India
Director,
lndianNGOs.com Pvt Ltd
Prasad, Ghantali,
Naupada
Thane
Thane 400 602
India
Joe Madiath,
Gram Vtkas
Mahuda Village, Via
Berhampur,
Dist, Ganjam,
Orissa
760002
India
RORES
Srinivasapura PO,
Kolar Dt.,
KARNATAKA
563 135
India
C Upendranadh,
PU Learning Advisor,
Plan India
C-210 Sarvodaya Enclave,
New Delhi,
Pin-110 017,
India
Vandana Shiva,
India
Ajaib Singh,
Director,
Department of Adult,
Continuing Education and
Exte
Punjab University Sector-14,
Chandigarh
160 014
India
Director,
Strategic Alliance of
Organisations
C 75, South Extension Part
ll„
New Delhi
New Delhi 110049
India
Ms Vasanth Kannabiran,
ASMITA Resource Centre
For Women
10-3-96 Plot 283, 4th Floor,
Street 6, Teachers Colony,
East Marredapalli,
Secundrabad,
Andhra Pradesh
500 026
India
Bina Agarwal,
President,
International Association of
Feminist Economics
Institute of Economic
Growth,,
University of Delhi,
Delhi
110007
India
Bosco Reach-out
Don Bosco,
Guwahati 781 001,
ASSAM
India
Alison Aldred,
Regional Director,
Oxfam (RMC)
C-28-29 Qutab Institutional
Area,
New Delhi 110 016,
New Delhi
India
Chris Marsden,
Country Representative,
Oxfam
C-28-29 Qutab Institutional
Area,
New Delhi 110 016,
New Delhi
India
Mr Lakshman Khanna,
President,
All India Secondary
Teachers' Federation, AISTF
C-8/302, Yamuna Vihar,
Delhi 53
110 053
India
Mr. Paul Divakar,
NCDHR
136/42 Street No. 10,
Venkat Rao Nagar Colony,
P.G. Road - A.P.,
Secunderabad
500 003
India
Friends of WWB, India
G-7, Sakar I Building,
Opp.Gandhigram,
Station, Ashram Road,
AHMEDABAD
380 009
India
CENDERET, Centre for
Devt. Research and Training
C/o: Xavier Institute of
Management,
Bhubaneswar 751 013,
ORISSA
India
Mr Nitin Paranjape,
Executive Director,
Abhivyakti Media for
Development
31-A Kalyani Nagar,
Anandwali Shiwar,
Ganagpur Road,
Nashik
422 005
India
Rajiv Tikoo,
One World South Asia
India
Director,
Muktangan International
Foundation
503, Ivory Towers-1,
Juhu Tara Road,
Mumbai
Mumbai 400049
India
Mr Bibekananda Dash,
General Secretary,
All India Federation of
Educational Associations,
Mahantypara,
Cuttack,
Orissa
753 002
India
K. G. Kannabiran,
President,
People's Union for Civil
Liberties
81 Sahayoga Apartments
Mayur Vihar -I
Delhi
110091 Delhi
India
Fr. Aloysius Irudayam s.j.,
IDEAS
26/A Vallaithoppu
Chinthamani Road,
Tamil Nadu,
Madurai
625 001
India
CORE, Collective Order for
Rural Rec.
D No. 14-145-14,
Om Sakthi Lay out,
Palace Road,
KUPPAM
517425
India
Mr Ram Pal Singh,
President,
All India Primary Teachers
Federation, AIPTF
41 Institutional Area,
Pankha Road, D-Block,
Janakpuri,
New Delhi
110 058
India
Mr Dharamvijay Pandit,
General Secretary,
All Indian Federation of
Teachers Organisations, A
E-15/13 Krishna Nagar,
Delhi
110051
India
Mr Rohit Dhankar,
Digantar, India
Todi Ramzanipura,
Jagatpura,
Jaipur
302 017
India
Dr. M Elias,
Professor,
Dept, of Social Dynamics,
St. Joseph's College
Tiruchirappalli,
Tamil Nadu
620 002
India
Dr. P lllango,
Honorary Director,
Ageing Research
Foundation of India (ARFI)
No.2 Second Street,
Gandhi Nagar,
Crawford Tiruchirapalli
620012
India
Y. Padmavathi,
Zonal Director,
Save the Children, India
Plot No. 8, 1st Floor,,
D.No:6-3-852/2/B/6-1,
Aparajita Housing,
Colony, Ameerpet
Hyderabad 500 016
India
Jeevana Datha Rural
Development Project
St. Joseph's House,
Ramanthapur,
Amberpet P.O.,
HYDERABAD
500 013-A.P.
India
CHC, Community Health
Cell
No. 367, Srinivasa Nilaya,
Jakkasandra, 1st Main, 1st
Block,
Koramangala,
BANGALORE
560 034
India
Mr. Sifaji,
Sanghamitra Service Society
74-14-52 Krishna Nagar,
Vijayawada - 7,
Krishna District, AP,
India
Care India
PO Box 4657,
New Delhi,
110-016,
India
COVA, Confederation of
Voluntary Associations
20-4-10, Near Bus Stand,
Charminar,
Hyderabad,
ANDHRA PRADESH
500 002
India
Ms Eunice Pamie,
National Campaign
Coordinator,
Micah Challenge
Prabhaav-Association of
Christian services,
D7/7417,
Vasant Kunj,
New Delhi
110070
Virginia Shrivastava,
ASTHA Sansthan
39 Kharol Colony,
Udaipur 313 001,
Rajasthan
India
Raffaele K Salinar,
president,
Terre des hommes
781, Regie House
Nana Peth
Padamjee Park
Pune
PUNE 411002
India
Suneeta Dhar,
C1 Paposh Enclave,
New Delhi
India
Arvind Kumar,
Lok Jagruti Kendra
Madhupur 815353,
Deogarh,
Bihar
India
Utpal Moitra,
Head, Programmes,
Save the Children, India
2nd floor,
A-20 Kailash Colony,
New Delhi 110048,
India
Asha Iyer,
Zonal Director,
Save the Children, Calcutta
Flat No. 1 C (1st Floor),
37 A, Carcha Road,
Calcutta,
India
Deen Khan,
Zonal Director,
Save the Children, India
Post Box No. 23,
Leh, Ladakh-194 101,
Jammu & Kashmir,
India
National Centre for Advocay
Studies (NCAS)
Serenity Complex,,
Ramnagar Colony, Pashan,
Pune
411 021
INDIA
Jagadananda ,
CYSD Centre for Youth and
Social Development
E-1 Institutional Area,,
Bhubaneswar 751 013,,
Orissa
INDIA
Fr John L. Noronha,
Executive Director,
Caritas India
C.B.C.I. Centre, Ashok Place
(Gole Dakhana),
110001,
New Delhi
India
Ambika Prasad Nanda,
CIEE
Sector Specialist Education,
12 Patliputra Colony,
Patna
800 013
India
Steve Hollingworth,
Care India
PO Box 4657,
New Delhi,
110-016,
India
N.C Pant,
215 Sanghi Street,
Mhow,
Madhya Pradesh
453 441
India
Ms. Nafisa Barot,
Utthan
36 Chitrakut Twins,
Nehru Park Vastrapur,
Gujarat,
Ahmedabad
380 015
India
International Commission on
Irrigation & Drainage
48 Nyaya Marg.,
Chanakyapuri,
New Dheli
110 021
India
Balkan-Ji-Bari International
C-129 Ganesh Nagar,
New Delhi
110018
India
Meenakshi Batra,
Zonal Director,
Save the Children, India
20 Kiran Path,
Suraj Nagar (west),
Civil Lines,
Jaipur 302 006
Rajasthan
India
Jai Chandiram,
President,
International Association of
Women in Radio and
Television
D-2D, DDA Flats,
Munirka,
New Delhi
110067
India
Working Group on the CRC
c/o Butterflies U-4,
1st Floor Green Park
Extension,
New Delhi 110 016,
India
The Asian Women's Institute
Women's Christian College,
Madras
600006
India
Indian Council of World
Affairs
Saru House barakhamba
Road,
New Dheli
110001
India
Foundation for Amity and
National Solidarity
10168 East Park Road
(KCP),
PO Karol Bagh,
New Dheli
110 005
India
Brian Heidel,
Programme Director,
Save the Children, India
2nd floor,
A-20 Kailash Colony,
New Delhi 110048,
India
All India Boy Scouts
Association
7 Mathura Road Janpura
"B",
New Delhi
110014
India
Mr Ram Prakash Gupta,
President,
All Indian Federation of
Teachers Organisations, A
E-15/13 Krishna Nagar,
Delhi
110051
India
Mrs. Swam Kohli,
President,
Consumer Education and
Research Centre (CERC)
Suraksha Sankool SarkhejGandhinagar HWY,
Thaltej,
Ahmedabad,
Gujarat State
380 054
ICSD
Valakom,
P.O. Box 691532,
Kollam Dist.,
Kerala State
India
Kailash Satyarthi,
Chairperson,
Global March Against Child
Labour
Main Address L-6, Kalkaji,
New Delhi
New Delhi
110019
India
Jiya Lal Jain,
Secretary General,
United Schools International
USO House,
USO Road,
6 Special Institution Area,
New Dheli
110067
India
Jayakumar Christian,
National Director,
World Vision India
Post Bag No. 5305,
Kodambakkam,
Chennai
600 024
India
...EVERY DAY 24,000 PEOPLE DIE
FROM HUNGER.
...EVERY DAY MORE THAN 100
MILLION CHILDREN ARE DENIED
THE CHANCE TO GO TO SCHOOL
...EVERY DAY 1.1 BILLION PEOPLE
HAVE TO DRINK POLLUTED WATER
...EVERY DAY 8,200 PEOPLE
DIE DUE TO HIV/AIDS
IT IS TIME FOR ALL OF US TO
SPEAK OUT TOGETHER
IT IS TIME TO DEMAND THAT
WORLD LEADERS DO MORE
TO FIGHT POVERTY
A
GLOBAL call to ACTION
against poverty
www.whiteband.org
V
V ;
W
“If one of us has a problem, it is everyone’s. Also we
have become well-known. People hear about us and
encourage us, because we’re a group. Three are
stronger than two, arid
• " sixty are much stronger than
one. Being together.makes us determined.”
Fatuma Mint Suleymane,;a member of the Rosso Naja women’s
ajiwciation in Mauritania; bn the advantages of forming a group.
GLOBAL CALL TO ACTION
AGAINST POVERTY
ACTION
GUIDE
WHAT SS THE GLOBAL CALL
TO ACTION AGAINST POVTRl mL
people all over the world will wear white bands
as a sign of solidarity with other campaigners
and those living in poverty.
In July 2005, the G8 Summit will take place
in Scotland, UK and promises have been made
to put poverty at the top of the agenda.
This is our opportunity to make sure that action
is agreed by the world leaders who have the
power to cancel debt, deliver more and better aid,
and change unfair trade rules and practices.
On 1st July we will attempt to get everyone in the
world who is against poverty to act in solidarity,
and wear a white band to call for world leaders
to do more to eradicate poverty.
Then in September 2005 the UN
Millennium Summit will discuss the progress
made on the Millennium Development Goals.
The Global Call to Action against Poverty
2005 is the time for world leaders to make
is a growing alliance of organisations, networks
eradicating global poverty the priority it
and national campaigns committed to
deserves to be.
eradicating extreme poverty, which will be
Together, we will pressure governments
This is a vital time to ensure that countries and
world leaders are on track to meet their
commitments to eradicate poverty and that
government policy and decisions aiming to
eliminate poverty and reach the Millennium
working together in 2005 to take action across
to eliminate poverty and achieve the Millennium
the world to force world leaders to tackle the
Development Goals are developed and
Development Goals. We want Trade Justice,
causes of poverty, and meet and exceed their
implemented in a way that is democratic,
Debt Cancellation, and a major increase in the
own promises on the MDGs.
transparent and accountable to citizens.
quantity and quality of aid. Also we want
Why are we writing to you?
national efforts to eradicate poverty that are
We are writing to your organisation to invite
developed and implemented in a way that
you and your members to join and become part
is democratic, transparent and accountable
of this global effort to ensure that world leaders
to citizens.
keep their promises to eradicate poverty and
Visit the website www.whiteband.org to see
achieve the Millennium Development Goals.
more detail on what we are calling for together.
As an alliance, we have a shared goal to ensure
that world leaders put their promises into action.
In 2005, and particularly on a few key dates,
we will be working in solidarity with thousands
of other organisations across the world to put the
interests of the poorest people in the world at the
top of the political agenda.
early September.
What if the organisations acting
together in this coalition have different
views on how world leaders should
eradicate poverty?
We will be stronger and achieve more for the
Why 2005?
We know that 2005 will be an important
poorest people in the world if we concentrate
on what unites us rather than on what divides
year to make progress in the fight against poverty.
us. For instance, Jubilee 2000 saw groups and
There are several key moments in the year when
campaigners will be active on a national and
international level. Around at least two of the
key dates we will be organising two events where
This pack explains the 'white band action’,
We will organise a second white band day in
networks from all over the world coming
together to campaign on debt. There was a loose
international co-ordination, but the campaigns
were planned and implemented at the national
which will visibly link the efforts and activities
level with focus on relevant specific issues.
of organisations and individuals all over the
These groups and networks may have had
world around key dates in 2005. While groups
in different countries will be planning their own
different detailed policies, but everyone came
together and rallied around the call to‘drop the
campaign strategies and activities, by wearing the
debt’. Similarly this alliance is backed by a wide
white band they can associate themselves with
range ol global organisations which may have
different priorities and policies, but we are all
united in our belief that progress on debt, aid and
the wider call to make change a reality in 2005.
This is your chance to ask politicians and
leaders what they are going to do to eradicate
poverty, and to demand that they do it now.
What are we asking world leaders
to do?
In the 21 st century 58,000 people die every
day from hunger and easily preventable diseases.
trade is necessary to lift millions out of poverty.
"2005 Is a year of great opportunity we can really
do something to change the world and make It
a better place. The time has come to stop talking
and start taking some action.
If everyone who wants to see an end to poverty,
hunger and suffering speaks out then the noise
will be deafening. Politicians will hove to listen"
Archbishop Desmond Tutu, 2004
JOIN THE GLOBAL CALL T© ACTION
AGAINST POVEmnf
It is important that you and your members
availability to help facilitate the Global Call
are part of this effort. Il is not possible for one
to Action against Poverty at national level.
person, one group, one organisation or one
We encourage you to work with them - working
country to bring about this change on their own.
Together though, we can unite all organisations
together our call will be louder and more
and individuals who want to eradicate poverty,
at national level, we invite you to contact one
and show our solidarity in this important year.
of the supporters of the call to action, listed in
How does this mobilisation relate
to other campaigns that some
of us are already involved in?
The white band mobilisations are designed
powerful. If you have problems finding partners
Section 5.
What happens at the national meetings?
The aim of the Global Call to Action against
Poverty is to support and build on pre-existing
to be as‘‘light and loose” as possible, with very
activities and campaigns in your country.
broad policy' messages and a minimum
We encourage you in your national group
of coordination, so that they complement,
to plan your strategy and activities for 2005,
and don't compete with or displace, ongoing
discuss how to support the white band action
campaigns and lobby efforts by our separate
and who could be involved in your country.
networks and organisations.
You might want to develop a national platform
What happens after the
national meeting?
In fact, if all of us link our ongoing lobby
to support the call to action, or work in an
and campaign efforts to the white band actions,
existing coalition or network. You could also
that decide they want to be part of it, will make
Together, the organisations in your country’
together we can build cumulative pressure on
work in a consortium or committee that has
the decisions about what steps your country will
decision-makers as the year goes on. Particular
come together solely for the purpose of backing
take between now and the start of activities in
opportunities to do this exist in April, just ahead
the call.
2005. You each know best what will work in your
of the World Bank-IMF Spring Meetings, when
At these meetings, you would, most probably,
own country/area. The best results will be
many groups around the world mobilise around
want to decide the following:
achieved by working at a national level and
the Trade Week of Action (April 10-16) and the
Education Week of Action (April 25-30). There
may be other opportunities to target forums such
as the G5, G20, NEPAD, etc.
Groups involved in the Global Call to Action
A Which organisations arc working together
on their national plan for 2005?
a global network that will use the symbol of the
A Who are the main points of contact for
liaison with the international coordinators
of the call to action?
can decide whether, and to what extent, they
want to link or coordinate their advocacy efforts
beyond the white band days. You may decide that
there is “added value” in organising additional
A What events will you organise in your
country.
A In addition to the two key dates for action
joint events or actions (beyond the while band
(1st July, early September), are there any
days) to target national or regional forums.
other significant dates in your country that
Or you may feel that it is most effective for
you would like to target, with or without
existing campaigns and networks to work mainly
the white band (for more info on the white
separately, but to link their efforts in the simplest
band sec the questions later on).
possible way by adding the Call to Action logo
and policy messages to their separate materials
A Will your country have a title / banner
and media work. Whether we do it separately
under which you will work together?
or do it together, the key thing is to get the Call
What will this be?
to Action message resounding louder and louder
▲ How will you show that you are linking
in the corridors of power everywhere.
to the Global Call to Action against
What happens now?
Poverty?
Over the next month, wc are encouraging
You might also wish to explore strategies
organisations active on poverty-related issues
to motivate citizens in your country who cares
in each country to come together to have their
about eradicating poverty to wear a white band
first national meetings on making the call
during these key moments. By doing it at the
to action a reality at national level. Their role
same time worldwide you will be part of what
is information-sharing, coordination and
we hope will be the biggest mobilisation ever
facilitation rather than leadership or gate
keeping. In many countries there are already
against poverty in history.
groups that have indicated their readiness and
keeping in touch with all the other organisations
and groups involved. All together we will form
white band to unite our demand to eradicate
poverty.
We are asking you to fill in the Update Form
attached at the back of this pack and return
it to the International Facilitation Group.
The form should be used to update us when
the plans at your country level have been formed,
so that the global network of participating
organisations are aware of your plans, and can
be inspired by your plans and activities.
Alternatively, you can e-mail us at
(info@whiteband.org or via one of the contacts
listed in Section 5) with the information.
BEING A NATIONAL FUTORM
QUESTIONS AND ANSWERS
If our national meeting is already
planned by other organisations,
how do we get involved?
It is not too late to get involved, and the
more organisations working together in 2005,
the stronger your national voice will be. You can
either talk to organisations already active in your
What if different national groups want
to organise different activities?
Again, it is likely that some organisations
will want to organise their own activities.
One way to manage this is to synchronise the
actions, and also to make the white band part of
all of them. The great thing about the white band
country, or to one of the organisations listed
idea is that it is easy to combine with other
in Section 5 to find out more and to discuss
activities that are already planned.
getting involved.
The important thing is to have as many people
If our national meeting is already
planned by other organisations and
we do not attend, how can we get
involved in the Global Call to Action
against Poverty?
You do not have to attend this national
as possible wearing the band at the same time
on the key dates.
Can I use the White Band outside
of the key dates?
Yes. It is up to each national platform
to choose how the white band idea will be used,
meeting to be part of this action. You can still
and if there are any other national or regional
be involved in planning your national strategy
events that you would like to wear it for.
for 2005 by gening in touch with the main
organisations working to organise your
national meeting.
Why 1st July?
We want to put pressure on the G8 meeting
to make some real decisions to benefit the world’s
If there is no national planning underway
at present in our country, how can we
get started?
If there is no national planning going on in
your country' at this stage, you can help to make
this happen by getting in touch with other
organisations in your country; Please let us know
poorest people in 2005. We have chosen a date
a few days before the summit so that leaders
Hillbrow Tower, Johannesburg
can be pressured in their own countries before
they leave.
debt crisis, introduced conditions for aid that
Should we target the G8?
The G8 countries still control most of the
force countries to liberalise, and have developed
unfair rules on trade, we feel it is appropriate
to have a date when the leaders of these rich
what happens!
world’s resources and are choosing to spend it in
ways that allow millions to die from poverty
countries are held to account. Whilst millions
What if some of the different
organisations in our coalition don't
have the same policy on all issues?
every year.
die every month, these leaders oversee both the
This action aims to bring together
organisations who share the same overall belief
against Poverty arc expected to happen all over
the world, but for one day, groups around the
that more must be done to eradicate poverty,
world want to unite in holding the richest
even if they have some different policies.
countries to account. As the richest countries
have overseen the world economy during the
It is likely' and expected that the networks and
financial and political resources to save them.
Actions linked to the Global Call to Action
The G8 provides the perfect moment to ensure
we do not let world leaders off the hook in the
fight against world poverty.
Why early September
The UN summit in September will see
organizations working together in 2005 will have
leaders from all over the word come together
some differences in exact policies and priorities
to discuss how they are addressing poverty.
on how to eradicate poverty. What we will all
Just five years into the establishment of the
share is a commitment to eradicating poverty',
Millennium Development Goals, the world
and by demanding it together we will be stronger
is way off track, with some targets in Africa not
and achieve more for the world’s poorest people.
What do we want world leaders
to do?
Together, we will pressure governments
to eliminate poverty'and achieve the Millennium
Development Goals. We want Trade Justice,
Debt Cancellation, and a major increase in the
quantity and quality' of aid. Also we want
national efforts to eradicate poverty that are
developed and implemented in a way that
is democratic, transparent and accountable
to citizens.
likely to be met for 150 years, let alone 15 years
after the goals were set. We have picked this date
so that world leaders can be targeted before they
leave home to go to the UN Millennium Summit.
By wearing a white band on this day you will be
able to deliver a clear message to world leaders,
and your country’s head of state, that this time
they need to put the world's poorest people first.
QUESTIONS AND ANSWERS
How do we launch our
national campaigning?
It is entirely up to your national platform.
There are a number of warm-up actions being
chosen in December/January to get the campaign
off to a strong start. These are different in
different countries, and national platforms are
invited to pick one that is most relevant for
them. A launch can be a moment where you
just announce the campaign to the media or
a moment for significant mobilisation.
The following ideas are already being supported
by campaigners m certain countries:
Skip a Million meals event on
10th December (India)
A Media Launch on 1st January (UK).
Mainly a media event with white bands
Will we get any updates on what
is happening Internationally?
If you let us know that you want to be kept
up to date (see www.whiteband.org), we will then
add you to the “Global Action Forum”, a list
Facilitation Group at info@whiteband.org.
e-mail updates. From the website you will be able
Please also visit the website at
www.whiteband.org which will be launched
to see what other countries have planned if they
on December 1st. This will have information
have provided the information. On the website
and materials from national platforms around
you will also be able to sign up for weekly
the world.
updates, keeping the organisers around the world
in touch with the latest developments.
Who do I ask If I have any
questions/want more information?
If you have any questions about the your
national plans and activities, you should use the
in your country, or one of the organisation
on behalf of the worlds poor.
A Launch at the World Social Forum (Brazil).
A number of groups in Brazil are keen to
use the World Social Forum to launch
national platforms, and the global action.
If you have any other questions about this
the campaign. Via this list, you will receive
national contacts list to get in touch with the
campaigners present cards to their leaders
country and across the world.
which are involved in one way or another with
organisation which is hosting the initial meeting
where New Years Greetings cards are sent,
be able to see what plans are in place in your
mailing please contact the International
appearing on some famous landmarks
January (France). For those countries
their plans to the international alliance, you will
of all organisations, national and international,
across the world.
A New Years Greetings cards throughout
Once the national groups have communicated
contacts listed in Section 5, who can help put
you in touch with others in your country. If there
is no planning going on in your country at this
stage you should talk to other organisations
about holding a national planning meeting.
USING
THE WHITE BAND
Why a white band?
The white band was agreed to as the one
Bands could be worn at demonstrations and
be organising the action under the banner
4.
of’Deliver the Promises’. The UK is organising
marches, union meetings, conferences etc
symbol to unite all of our activities and
the action under the banner ‘Make Poverty
demonstrate the truly worldwide nature of the
History’ and that will be written on many of the
to catch media attention and gain more support
for the action, and each national group will have
All of these concepts add to the opportunity
Global Call to Action against Poverty. The white
bands. And of course individuals can write their
band has lots of potential to gel everyone
own messages, for instance if your national
other eye-catching and high-impact ideas.
involved - it is deliberately easy for anyone in the
campaign decides that the white bands will
The most important thing though, is that
world, no matter how poor, to take part. It is also
sent to an embassy or a national politician.
everyone can wear the band around the key dates
easy to adapt to fit your existing plans and
actions, to visibly display your key messages, and
in 2005, regardless of what they are doing on
How will the white bands be made?
to draw media attention.
This action has been chosen because anyone,
anywhere can take part. All they need is to make
So what should the white band look like?
a white band from a piece of white cloth, plastic,
This is entirely up to you. Some suggestions
paper or similar material. It is a cheap and simple
are wrist bands, arm bands, head bands etc.
action, so that everyone is able to be a part of this
The most important thing is that you work with
demand for change.
the ideas that will be most successful and
appealing in your country. The white band you
How else can we use the white band?
wear does not have to be professionally
The white band can also be used as a media
opportunity. For example:
produced, and we would encourage you to show
other organisations and individuals taking part
1.
in your country that they can make their own
band in support of this global movement.
bands from pieces of fabric or paper.
2.
Famous people and celebrities can wear the
You may choose to stage stunts where the
white band is put around a famous building
Do our white bands have to bear
a slogan or a message?
Many groups will be organising under
a national slogan. India, for example, will
or monument, or around the venue of a key
meeting of leaders to make your point visible.
3.
Small white bands can be tied together
to form chains.
those days. People can wear the bands at work,
at school, whilst travelling, shopping, cooking,
or socialising, or just at home with their families.
USING
THE WHITE BAND
How many people are we expecting
to wear the white band?
We firmly believe that there are hundreds
What will happen to the white bands
after the actions in 2005?
It is up to each country to decide, national
of millions of people world-wide who agree
groups will have their own final ideas of what
Will any white bands be produced
centrally?
We will be producing some white bands
centrally on “fair trade’’ cotton. When you have
that world leaders should do more to eradicate
they will do with the national collections of white
returned your update form we will let you know
poverty now. By organising the white band action
bands at the end of the 2005 actions. Some ideas
which types of band we have available and how
we hope to prove the extent of this solidarity
are to post them en mass to a political leader
you can order them.
by aiming to have 100 million people wearing
or to tie them around a national monument.
a white band on the two key dates in 2005.
Who should wear the white band?
ANYONE who believes in eradicating
Also some national groups may produce
their own white bands to distribute in their
Will this get in the way of other actions
we are already planning?
The white band has been chosen because it is
country. It is not necessary to wear a
professionally produced white band, the vast
majority of people wearing one will make their
poverty should wear the white band, and we
complementary to any other actions. Whatever
own. The quality of the band is not important,
want as many people as possible to feel part of
issue your country and your organisation wants
and everyone should feel able to take part by
this movement. This could be school children,
to raise next year, and whatever specific activities
making their own band.
campaigners, activists, trade unionists,
you plan, the white band can be worn alongside
community groups, celebrities, families;
those plans. The key message is that we all believe
whoever you are, this action is for you.
in eradicating poverty.
How will we know how many people are
wearing the white band?
Each country will be asked to count the
number of people in their country who wear the
band - there will be numerous ideas on how you
can do this on the campaign website.
For example after the actions have taken
place, you could ask people to write their name
on their white band and send it to be collected
and counted nationally. Some groups could tie
their white bands together locally and make
larger bands for display around famous buildings
and monuments.
WHO iS ORGANISM® THE
GLOBAL CALL TO ACTSOM
AGAINST POVERTY?
Entraide et Fraternite
Santi Sena, Cambodia
activity in each country. A wide range of
organisations have already agreed to work
Fastcnopfer
SAPPK, Pakistan
Feminist Dalit Organization (FEDO)
Sccours catholique - Caritas France
together to this, but the aim is to go further
Global Campaign for Education
Social Watch
and to get every organisation committed
Global Movement for Children
South Asia Watch on Trade, Economics &
to eradicating poverty involved in what will
IBASE
Environment
hopefully be the biggest mobilisation ever
ICAE
South Asia Partnership Pakistan
against poverty.
ICW
(SAP-PK Lahore)
INESC
STAR KAMPUCHIA, Cambodia
Integrated Rural Development Foundation (IRDF)
TANGO
National Groups will be organising the
List of supporting organisations:
.Alliance bringing together the International
Confederation of Free Trade Unions,
the 10 Global Union Federations and
TUAC-OECD (contactCglobal-
unions.orgf contact(Pglobal-unions.org
www.global-unions.org)
Interaction
Transparency International
International Council for Adult Education
Trocaire
Japan International Volunteer Centre (JVC)
UN Millennium Campaign
Koordinierungsstelle
Urban Sector Group, Cambodia
LEGAMBIENTE
VnM/Focsiv
LUMANTI
Voloil tari nel mondo - FOCSIV
Public Services International
Manos Unidas
World Vision International
Action Aid International
MICAH Challenge
Yayasan Bina Usaha Lingkungan/GEF - SGP
African CSO Network on Water (ANEW)
MWENG0
Yes Country Network Nepal, Youth Initiative
AFRODAD
NANG0F
Zambia Trade Network
Agency Coordinating Bodyfor Afghan Relief
National Campaign on Dalit Human Rights
Zimbabwe Coalition on Debt and Development
Afghanistan
National Conference of Dalit Organizations
(ZIMC0DD)
Agir id
(NACDOR)
Alianza Social Continental
NCDHR
All Africa Council of Churches
NG0 Federation ofNepal
ALOP
NOVIB
ANCEFA
One World Africa
ANND
One World South Asia
All of the above are asking their national
members, partner organisations and other civil
society groups to become part of this global
movement. Those involved so far are individuals,
existing coalitions, charities, NGOs, INGOs,
trade unions, religious and faith groups,
APWUINAPM, India
Oxfam International
Asia Forum for Human Rights & Development
People's Health Movement
Asia Pacific Network on Food Sovereignty
PIDHDD
(APNFS), Philippines
Plan International
AWEP0N
Poverty Action Network Ethiopia Steering
AWN
Committee."
BRAC
PSI Brazil
Broederhjk Deien
SAAPE, Nepal
CAFOD
SAMARTHAN
society organisations (this could be a formal
community groups, activists and campaigners
from all over the world. After the initial meetings
happen, each country could have its own
autonomous national platform to co-ordinate
activities in that country and to communicate
with the International Facilitation Group.
A national platform is just a group of civil
Cambodian Human Rightsand Development
Samay Weekly
coalition or network, or it could be a consortium
Association (ADHOC)
Sanayee Development Foundation, Afghanistan
or committee that has come together solely for
Campaign for Popular Education, Bangladesh
SANGOCO
the purpose of the Call to Action against Poverty.
Caritas Intemationalis
SANSAD
CCFD
Centrefor Social Development, Cambodia
Centrefor World Solidarity (CWS)
Christian Aid
CIDSE
CIVICUS: World Alliancefor Citizen Participation
COMGAD
Comic Relief
CONGO
Coordination SUD
Cordaid
CRID
CSACEFA
DATA
Development and Peace
CHC. Community Health Cell
No. 367, Srinivasa Nilaya
Jakkasandra, 1st Main. 1st Block
Koramangala
BANGALORE
560 034
India
BE PART OF THE
GLOBAL CALL TO ACTION
AGAINST POVERTY
Dear Friend
A growing group of civil society organizations is working together to pressure world leaders to act against
poverty in 2005. We are writing to invite you to be part of this global effort to demand that the world stops
allowing millions to die every year because of extreme poverty. This movement will call for world leaders to
start keeping their promises,and to do all they can to achieve the Millennium Development Goals and move
towards eradicating poverty.
ADAR THE WHHfE BAND
During 2005,millions of people around the world will be taking part in activities that coincide with significant
international,national,and local events. Community organisations,national and regional networks,
international NGOs, trade unions,school children,faith groups,and celebrities,are calling for action
to eradicate poverty. In countries all over the world, people will be asked to wear a simple while band to show'
their desire for world leaders to act now. There will be key dates in 2005 where we will aim to mobilize together,
but we also foresee a series of dynamic campaign processes to put pressure on decision-makers in the South,
the North and at the global level throughout the year.
The more people we can encourage to lake part,the louder the call for action will be. Together, we will pressure
governments to eliminate poverty and achieve the Millennium Development Goals. We want Trade Justice,
Debt Cancellation,and a major increase in the quantity and quality of aid. Also we want national efforts
to eradicate poverty that are developed and implemented in a way that is democratic, transparent and
accountable to citizens.
Poverty denies hundreds of millions of people their rights to water, health care,and education,and fuels the
HIV/AIDs epidemic. This is not an unchangeable fact of life - for instance the WHO estimates that
vaccinations could pievent - of all infant mortalities. But change will not happen unless all of us, together,
demand it loud and clear. If we can get all of those who want to eradicate poverty to speak at the same time
then leaders will be forced to act.
We know from past experience that success,and a better world,is possible.Global campaigns to ban
landmines, to end apartheid,and to realise women’s rights have all made a huge difference.These campaigns
have helped to change - and save - lives. That’s why we really hope that you become part of this global effort.
There are many national platforms and groups already working on these issues,and this action is designed
to compliment, support and build on activity al the national level. The attached list of contacts in your country
shows some erf’ those this mailing has gone to, and in some cases highlights the organisation that has been
involved in the coordination of the Global Call to Action against Poverty so far.
Please read me enclosed action pack and national contacts list. The action pack contains ideas on mobilizing
people at national level,and details on the various international and regional organizations which have already
backed the Global Call to Action against Poverty. Feel free to distribute the pack to otherc ’"ho you think may
be interested.Please don’t miss the opportunity to add your influence.
Global Call to Action Against Poverty
0384LA01.AC1/00001360/CIDSE-EA/ID_3
...EVERY DAY 24,000 PEOPLE
DIE FROM HUNGER.
...EVERY DAY MORE THAN
100 MILLION CHILDREN ARE
DENIED THE CHANCE TO
GOTO SCHOOL
...EVERY DAY 8,200 PEOPLE
DIE DUE TO HIV/AIDS
IT IS TIME FOR ALL
OF US TO SPEAK OUT
TOGETHER
IT IS TIME TO DEMAND
THAT WORLD LEADERS
DO MORE TO FIGHT
POVERTY
i
<
.
I
“The success is Uiat the commAities have rea. seen the neei come together.
It is through comming togetheAat you have ^beginning of| power.”
www.whiteband.org
Lawrenca (Wo (right), a member of orfla network of Kenyairaommunity groups and paralegal workers
fighting for land reform and against the Wictions of urban poor from their land.
Crispin Hughes/Oxfam
I
...EVERY DAY 1.1 BILLION
PEOPLE HAVE TO DRINK
POLLUTED WATER
CIDSE-F.
CIDSE
International
Cooperation
for Development
and Solidarity
Cooperation Internationale pour le
Developpement
et la Sol id a rite
Secretariat general:
Rue Stcvin. 16
1000 Bruxelles
Belgique
T61: (32) 02 230 77 22
Fax: (32) 02 230 70 82
, E-mail: postmastcr@cidsc.org
' Sitc-wcb: http://www.cidsc.org
Membres
Members
Brocderlijk Deien
Belgium
CAFOD
England and Wales
WRcfd
France
CORDAID
Nederland
Developpement & Paix /
Development & Peace
Canada
Entraidc ct Fraicrnite
Belgique
Fastcnopfcr/Action de Caremc
Schweiz/Suisse
Koordinicrungsstellc
Ostcrreich
Manos Unidas
Espana
Miscrcor
Deutschland
^feclAF
Scotland
T rocaire
Ireland
Volontari nel Mondo-FOCSIV
Italia
MEMBRE ASSOCIE
ASSOCIATED MEMBER
Internationale
Arbeitsgemeinschaft
fur Entwicklung
und Solidaritat
Cooperation
International
Para el Desarollo
y la Solidaridad
Brussels, 2 November 2004
Re: Global Call to Action Against Poverty
Dear friend,
We invite you to read the attached mailing of the Global Call to Action against Poverty
and to consider your participation in this unique civil society effort in the year 2005.
The Global Call is a loose alliance, of which CIDSE and many of its members are
part, working on facilitation and co-ordination of campaigns that organisations and
networks all over the world will organise in 2005.
Riding on the optimism of the new millennium, the world's political leaders agreed on
the Millennium Development Goals (MDGs), set to be reached by 2015. Though only
a first step towards the total eradication of global inequality, the MDGs represent a
unique set of internationally agreed poverty reduction commitments. In 2005, we
begin the 10-year countdown to ensuring that governments live up to their
commitment.
Informed by our values emphasising human dignity, social justice and care for God’s
creation, CIDSE and its Member Organisations recognise that achieving the MDGs is
a challenge that, on current trends, risks being lost in many countries principally in
Africa. We believe that only through mobilisation and campaigning all over the world
is there any hope to change the life for millions of people across our shared planet.
For this reason CIDSE and many of its Members are part of the Global Call to Action
Against Poverty. You too are invited to be part of this Global Call and the attached
mailing explains how you can get involved.
CIDSE and its Member Organisations will contribute to the Global Call through
different activities. One initiative is a post-card campaign to put pressure on the
leaders of the richest nations to double aid and improve aid quality; to cancel debt
that prevents the achievement of the MDGs; and to end dumping now and allow
developing countries to protect their farmers.
Beyond these demands we are
advocating for fundamental changes towards a more equal division of power in the
system of global governance.
Please visit our website www.cidse.org to learn more about our activities. For
background information please order our brochure on the MDGs “International
Campaign on the Millennium Development Goals". If you have any questions do not
hesitate to contact Jean Letitia Saldanha at CIDSE (saldanha@CIDSE.org).
Remaining in Solidarity
Bridderlich Deien
Luxembourg
Center of Concern
Christiane Overkamp
Secretary General
COMMUNITY BASED PREVENTIVE HEALTH INITIATIVES IN
THE POVERTY ALLEVIATION PROGRAMME (UNDP
RAS/96/600) IN ANDHRA PRADESH - AN OVERVIEW (1996-99)
PREAMBLE
X----------
Though the health initiatives in the project RAS/96/600 India component started from
September 1996 but it was of a pilotiexpcnmental nature and was mostly confined to the
Orvakal mandal of Kumool district In the progress report for the year 1996-97 and in the
document “Community Based Health Initiatives” published in September 1997, a detailed
account of the activities taken up during die period under reference was furnished, similarly in
both the strategy papers (Health Initiatives) for the year 1998 and 1999 - detail activities to be
taken up during the respective years has also been submitted along with the progress reports
for the year 1998 and 1999. Keeping in this mind, therefore, we feel there is no need to go
over the ground once again and shall report hereunder an overview of all the activities in a nut
shell since inception till date and justify the need to install an effective functional monitoring
system and to document in detail the operationalisation of field level modalities m developing
a full proof monitoring mechanism to be taken up on an experimental/pilot basis in the
Hindupur sector (Hmdupur, Gunbanda and Madakasira mandals) in next three months
(January - March 2000).
OVERVIEW OF THE ACTIVITIES UNDER HEALTH INITIATIVES (1996-99)
I ntroduction:
It is now becoming increasingly clear that there is a strong relationship between
sustained poverty, ill-health and cost of medical care Poverty is a fertile ground on which
overwhelming majority of diseases grow and affect the poor. In addition, poverty is directly
related to poor social status, which drastically reduces the access of the poor to the available
health care resources, making them even further vulnerable to diseases. This chain continues,
as the outcome of ill-health is more poverty. Thus, in brief, for the poor, health status is an
outcome of an indicator of the degree of) and a condition for emancipation from-poverty.
The Human Development Reports (HDRs) published by the United Nations
Development Programme (UNDP) looks at Poverty much beyond income or material poverty
and defines Human Poverty as demal of choices and opportunities to live a tolerable life. The
new concept of Human Poverty Index (HPI) as advocated in these reports concentrates on
depnvations in 3 essential elements of human life i.e., a) longevity (vulnerability to death at n
relatively early age i.e., 40 years), b) knowledge (illiteracy) and c) decent standard of living
{access to. safe drinking water, basic health facilities, food (in terms of malnourished
children)}. Interestingly enough, most of the variables used in the HPI directly or indirectly
are related to health.
The cost of medical care bccne by poor when accessing services, pin-chafing
medicines and other necessities (inducing the travel cost etc.) - is likely to be one of. the
important cause tn perpetuating an increasing poverty. Several studies have also shown that
the poorest segments of the population spend higher amounts in proportion to their incomes
for seeking medical care, even the NCAER study has shown that the poor spend on an
average about 15% to 20% on treatment of diseases as agiunst 6% among the better off. From
our own experience under the SAPAP, we have also observed that a substantial part of
medical/hcalth expenditure of poor families is taken on loans.
BackgrMtrul about the SAJ'AI'
The UNDP supported SAPAP being implemented since 1996 in 671 habitations
spreadover 20 mandrils in 3 districts of Kumool, Mahabubnngnr and Annnfhnpur of Andhra
Pradesh, seeks to demonstrate a pro-poor perspective nurturing the potentialities witlun the
poor with thrust on social mobilisation as a critical element for poverty alleviation
The
project strategy' relied on the mad of 1) social organisation of poor - facilitated through social
guidance, 2) skill development - to nurture inherent capacities and potentialities and 3) capital
formation - for improved quality of life The. programme initiatives have enabled the poor
build their own organisations (SHGs. VOs and Mandal Samakhyas/Tkya Sanghams) at
grassroots through social mobilisation.
The programme invigorates the process of
empowerment of poor to secure greater access to resource for poverty alleviation.
During these 2 years, the poor tn the project area have demonstrated their inherent
potential to help themselves. The SHGs, VOs and Mandala Samakhyas promoted and
developed with programme initiatives aic attaining self-reliance The organisations of the
poor are effectively addressing social dimension of poverty also
HEALTH INITIATIVES
In the background indicated above, recognising the importance of health in a Poverty
Alleviation Programme such as ours, a health component has been incorporated
The
approach and strategy of health initiatives followed is in consonance and congruence with
broader conceptual framework of the main poverty alleviation programme, which is based on
the premise and conviction that “willingness within the people to help themselves" The focus
and emphasis is on developing community based preventive health initiatives in which the
community fully participates and is involved al every stage. The oilier mum areas of strategic
emphasis arc training, communication, social mobilisation and advocacy.
Community Health Activist (CHA) is the nucleus of the initiative. A woman form
among the members of SHGs chosen by the Village Organisation (VO) is designated as CHA
She is trained intensively for 15 days (in tow spells of 8 & 7 days) so that she is adequately
equiped with knowledge and skills needed to perform her tasks effectively. CHA is well
trained to provide preventive and promotive health care and is expected to be a dynamic link
between the community and formal health system, a critical factor hitherto missiing
To begin with, before initiating health activities in Orvakal mandal of Kumool
District, Sakunala village of the same mandal was taken up for an in-depth study during the
month of Novcmbcr’96 to test whether the approach of community based health initiatives
was feasible for replication And the Sakunala study brought out very clearly that the
approach of involving people at every stage and at every level was possible, feasible and
practical.
It was found that in a small colony of less than 100 households (98), the people had
spent a staggering Rs.97,560-00 (nearly 1.00 lakh) in preceding 6 months apparently for
health (but in real sense, it was for their ill-health and treatment of diseases only). The
amount spent was not just only far treatment (medical consultancy and purchase of
medicines) but aim included such other expenses like travel cost, accommodation, food etc.,
not only for the patient but for attendants as well. Loss of daily wages (both for the patient
and for the attendants) has also been included. In simple terms it meant that Rs.2.00 lakhs
drained off form this small colony of about 100 households in one year i.c., on an average a
family/houschold was spending Rs.20O0/- annually as compared to Rs.365/- (@ Rc. 1 per day)
which it was saving through thrift by the help of the SHG. which can very well be compared
to a "Leaking Bucket". People themsel ves understood the impbeation of such a huge amount
drained oil, and here exactly, the people (women of the bllGs) were very muui keen and
interested to reduce the burden substantially by receiving inputs in terms of information and
knowledge aimed at prevention of disease, nutrition, water, sanitation and personal hygiene
from any source that is available. It is for this very reason that there is an increasing concern
to empower the poor (particularly the women) with information and knowledge that would
enable them to lead healthier lives by bringing about changes in their behaviour and attitudes
towards their own health.
♦
The minimum programme goals of this initiative arc the following:
To improve the health knowledge of the poor (with a focus on the poorest of the poor
SHG members and their families)
To bring about a perceptible positive behavioural change in relation specifically to
«
sanitation and personal hygiene among the, poor
To Jiclp uuxsi llic existing health facilities by the |iooi by establishing linkages With tile
♦
♦
providers
To benefit such vulnerable/focal groups namely pregnant women, infants, children,
adolescent girls, old/disabled persons and persons suffering from chronic diseases in
terms of availing relevant services/referrals etc.
In order to achieve the above goals, the specific activities, which are being initiated,
are the following.
1
o
*
2.
3.
4.
5.
6.
Establish linkages with Village Organisations (VOs), Self Help Group (SHG) members
and other organised groups like Balika Sanghams, wherever male snaghams exist etc., for
health education in a regular basis byConducting specific sessions on important topics directed towards bringing about change
m health related behaviour particularly in relation to sanitation and personal hygiene.
Interacting with groups informally during routine self help group meetings, meeting of the.
Village Dcya Sangham etc
Establish linkages with focal groups viz., pregnant women, mothers of infants/children
under 5, adolescent girls by organising special sessions with adolescent girls and by
providing necessary inputs in terms of ANC and PNC in case of pregnant women and
lactating mothers.
Conduct sessions with adolescent girls especially on issues of personal and menstrual
hygiene.
Establish linkages with the Government Health/ICDS Functionaries at mandal level (PHC
Doctor, ANM, 1CDS Supervisor, AWW and olehrs)
Conduct training for the CHAs in tow phases of 8 & 7 days each and refresher training as
well.
Provide CHAs with a kit containing pictorial charts (posters) and corresponding manuals
to impart health education/scnsitisation among the SHG members.
The CHA is the mam actor in this initiative and for all practical purpose, she is a
health educator. The three main objectives of health education arc:
Informing people
Motivating people and
Guiding into action
The Tasks which are being performed by the CHAs are the following:
♦
♦
♦
♦
♦
♦
Providing health education
Motivating mothers to bring children for immunisation
Motivating pregnant women for Ante-Natal Care (ANC) Registration and follow-up of
ANC and Post-Natal Care (PNC)
Motivating Eligible Couples to adopt Family Planning
Register Births and Deaths
To support and co-operate the Auxiliary Nurse Midwife (ANM) and Health Workers of
Government Machinery, Angiuiwudi Wtuke.ni (AWW) Jt other functionaries of ICDS etc.
♦
♦
(to establish meaningful linkages)
To provide first aid and treat minor ailments and refer cases in right time
Promoting simple home remedies (which has usually no harmful side effects) and if
possible use of herbs.
Keeping in mind that most of the CHAs are semi-literate/illiterate, to makethe task of
providing health education simple and understandable, 8 modules have been prepared in
Telugu containing 85 pictorial charts.
Thus, an attempt has been made To give all necessary information in pictorial
form and brief messages in these multi-coloured posters. The posters are accompanied by
corresponding manuals instructing the users how to use the charts (The manuals are also
in Telugu). They cover the following topics.
♦
♦
Pre-natal and Post-natal care
Child care
♦
Food and Nutrition
♦
Family planning
♦
Reproductive health care of women
♦
♦
Communicable diseases
Environmental sanitation & personal hygiene and
♦
First Aid.
What follows in the next page is the information on the modules and the posters in detail
COMMUNITY I IF.AI .TH
MODULE-2
MODULE-1
PRE-NATAL » POST-
NATAL CARE
Conception at right age
Early Registration 1' Exammaboo-weight
& Height Urine test BP testing
3)
■ "
“
Tetanus injection
4)
“
Blood test for HB
Foetal Heart Sounds
1)
2)
Health check-ups for pregnant women
Diet for Pregnant woman
Enough rest
Minor problems - (Morning sickness Nausea,
Vomiting, Backpain, Heartbum, Constipation,
9) High risk problems 1) Early age, late age,
short height, prime, BOH
10)
“
“
1) Oedema, severe
bleeding
11) Preparing for delivery
5)
6)
7)
8)
Safe delivery.. 1) 5 cleans and delivery
with the help of Dai.
13) Emergencies during cliild birth -Malposition,
Maipresentations prolonged labour etc.
14) Post-Natal care of mother
15) Care of the new bom child
12)
CUILUCARE*
I)
2)
Breast-feed
The care of new bom
3) Food for child — 0 to 12 month*
Growth mile-stones - 0 to 12 months
stages wt and progress
5) Six killer diseases - symptoms
6) Immunization schedule Fundal Palpation
7) Growth of the child 1 Mto5'i' year-Growth in wt.
8) AR Common cold -Symptoms/
remedies, Sore throat, Pneumonia (Referrals
Doctor’s advice)
9) Diarrhoea/Dysentry - Continue light feed
extra feed
- after recovery, ORS
10) Malnutrition (Vicious cycle)
4)
5
11) Deficiencies
«
Kwashiorkor * Marasmus * Vit A
Deficiency
»
Vit B Deficiency * Anaemia * Iodine
Deficiency
MODULE-3
MODULE-4
EQQ.D&HVTR1TJ.QM
FAMILYPLANNING___
Types of Food:
I) Small happy family
A happy family with 2 cliildien
2) Too big family (5 ctiildren) children
working with parents
3) When to have the first child
4) When to have the second child
5) Temporary methods of contraception
for Women (copper-T, oral pills)
6) Temporary methods of contraception
1)
2)
Types of food
Carbohydrates/Protons
3)
4)
5)
FatsA/itamins Minerals
Balanced diet
Malnutrition (Kwasluorkoi Marasmus)
o) Vit.A deficiency (night blindness), Vit. B
deficiency (cracking of lips)
7) .Anaemia -Iodine deficiency
for Men (Nirodh)
7)
Permanent methods of contraception
Womcn-Tubectomy&Mcn Vasectomy
FOOD FOR CHILD
8) Breast-feeding
9) Immediately ntler birth (0-3 months)
10) Food for Child (4-6 montlis)
11) Food for Child (7-9 montlis)
12) Food for Child (10-12 months)
FOOD FOR-
13) Pregnant woman. Lactating mother.
SnT/iIl aged
8)
Medical termination of pregnancy
MODULE-5
MODULE-6
REPRODUCTIVE HEALTH CARE OF WOMEN
COMMl TNICAB1 .E DISEASES
•
1) Malaria
2) Filanasis and brain fever
3) Tuberculosis (TB)
4) Leprosy
5) AIDS (HIV)
6) Jaundice
7) Diarrhea - Dyscntry-1
8) Diarrhea - Dyscntry-2 (Dehydration)
9) Typhoid
1)
2)
3)
4)
5)
6)
7)
8)
Life cycle of woman
Puberty
Menstrual cycle and care
Pregnancy & Child Birth
Anaemia
Reproductive licaltli problems-1
Reproductive health problems-2
Care at Menopause Age 45 to 55
MODULE-7
MODULE-8
ENVIRONMENTAL SANITATION &
FIRST - AID
personal hygiene
Environmental Sanitation
1) Wlial is Sanitation?
2) Sanitation at home
3) Sanitation outside house
4) Management of drainage
5) Usage of-latrines & construction
6) Management of Garbage & Animal waste
7) Safe Drinking Water
8) Personal Hygiene (1) Keep the body clean
9) Personal Hygiene (2) Some good habits
1) Unconsciousness
2) Wounds & Bleeding
3) Falls, Injuries
4) Broken Bones
5) Some Bandages & Slings
6) Bums & Scalds
7) Electric shock & Effects of heat
8) Fevers, Loose motions, vomiting
9) Poisoning
10) Foreign Bodies in throat, car, nose,
Eye
11) Bites &. Stings.
Need to document and develop effective functional monitoring system:- An experimental
exercise in Hindupur Sector, Ananlhopur District -■■-lonuary - March JlH)l).
As things stand today, about 250 CHAs (to be precise 248 in all - 104 from Ananthiipur
district, 72 each from Kumool and Mahaboobnagar districts) have been trained and positioned
tn their respective villages, where the Village Organisations (VOs) are owning and sustaining
them
Now that CHAs are already positioned in their respective villages and are implementing their
tasks, in order to have a continuous follow up and close monitonng every month refresher
course /review of 2 days duration is no doubt conducted at the mandal/PHC level, but still
much is desired and there is an urgent need to install an effective functional monitonng
uyslcm which cun be uricd fin mundiil level planning us well us constant feed buck foi heiillh
pioprunimc impiovrim nl .'Ionic | >i c hniiiiiii y rltniln in thin duri linn luivc ulirmly lkx>n nuulv
in Ihndiijiur sccloi fl Iiii>Iii|hu, < iiiril^uulu unit Mmliik nun a munilnlu) in Aniintluipui diMitui
wlicrc maximum numlici of CHAs (ovci C>0) Imvc liccn tiumcd mid |Kisitiunr.d
Keeping the
above tn mind there is a need to document in detail the operationalisation of field level
modalities in developing a full proof monitoring mechanism This exercise is needed to be
taken up on an cxpcnmcntal/pilot basis in the three mandals of Hindupur sector (viz.
Hindupur, Gunbanda and Madakastra mandal) and the PO(H) can be stationed at Hindupur
for next three months i.e form January to March end, 2000 to implement to this pilot project
Health and Poverty in the Context
of
Country Development Strategy
By
Binayak Sen, Ph.D.
For
World Health Organization
Dhaka, Bangladesh
September 1996
I. Health in the Overall Strategy for Poverty Alleviation
The poverty alleviation strategy adopted by the Government is based essentially on three
mutually supporting approaches. The first and foremost is to influence poverty indirectly via the
growth channel. Development of physical infrastructures such as road, electrification, and modern
irrigation are examples of growth oriented programmes. The second approach is to raise the direct
capability of the poor via increased social sector allocations (education and health). The spread of
primary education and expanded programmes for immunization in the recent years are relevant
examples in this regard. The last but not the least, governments also attempts to help directly in
mitigating the severity of poverty via public safety net schemes. Food for Works and Vulnerable
Group Development for the extreme poor households are examples of the third kind. Many of these
programmes are implemented through the collaboration of government and NGO agencies.
Despite some modest progress in poverty reduction in recent years, there are several areas
of policy concern which are important to take into account in the context of the Fifth Population and
Health project. Of all the measures that are currently under implementation, curative health care for
the poor in both rural and urban areas remains in the most dismal state. It is not only an issue of
quality (which is also important in case of other programmes such as primary and secondary
education), but also one of quantitative access. The sheer absence of any urban health infrastructure
is a case in point. The access’of the rural population to public health care is extremely limited, being
restricted to 12 per cent of rural households. This proportion has remained remarkably stable over
the years, at least during the period since mid eighties.
The above realization has brought to the fore the issue of health care as an integral part of
the national poverty alleviation strategy. What is the level of access by various groups of the poor
to different health care providers? How successful is the existing network of public health facility
in reaching the poor and mitigating the stress of the health-hazards? What is the consequence of
having ill health for a faster and sustained poverty alleviation? And, finally, how to situate and
strengthen the poverty focus in the design of health interventions? While comprehensive answer to
these issues requires a much detailed review, we shall discuss some of the first-order concerns
relating to the nexus of health and poverty.
Summary Points
*
Although three prong approaches to poverty via growth, direct interventions in
education and health, and safety net transfer programmes are widely recognised, the
actual progress made on the health front is highly unsatisfactory.
*
It is postulated that the lack of adequate attention to health concerns has adverse
poverty implications both in the short and the long-term.
II.
Profile of the Poor and the Poorest
Before we proceed to discuss the health implications of poverty, it is useful to know the
profile of the poor. Who constitute the poor? What are their socio-economic characteristics? Is there
differentiation within the poor community? These are some of the questions which lie at the heart
of the following discussion. The empirical evidence is mainly drawn from rural surveys
supplemented by broad observations culled from the urban scenario. This has been conditioned by
two principal considerations. First, urban poverty situation is a relatively under-researched area and
comparable urban data do not exist on many counts not the least of which is the absence of a
standard poverty profile according to per capita income (consumption) classification.1 Second, about
90 per cent of the poor still live in rural areas which requires that special emphasis be given to
analyzing the rural conditions.
(A)
Differentiation within the Poor
Using a number of criteria (i.e., income/calorie measure, self-categorization of households
according to surplus/ deficit status, living standard indicators, etc), one can examine whether a sharp
differentiation exists within the poor community. All of these measures are, however, scarcely
available for a given survey year and survey agency. The 62-viilage panel survey periodically carried
out by Bangladesh Institute of Development Studies (BIDS), for instance, provides income-based
poverty estimates but do not present consumption (calorie) based estimates. The Household
Expenditure Surveys (HES) of the Bangladesh Bureau of Statistics (BBS) present both income and
calorie based estimates but do not use the self-categorization indicator. Similarly, until recently, the
housing indicator (which is more directly expressive of the poverty scale compared to the income
or self-evaluation indicators) is also missing in HES as a means for identifying the poor. Despite
these differences in terms of emphasis between various agencies, sharp differentiation within the
poor community can be seen through the prism of every single indicator.
The BIDS survey provides a recent estimate of rural poverty measured in the income space.
It reveals that about 52 per cent of the rural population lived in absolute poverty in 1994. This poor
1 The recently concluded ADB-sponsored study on urban poverty is, perhaps.
the only exception in this regard. But. the poverty estimates presented in this
study seem to be biased rather to the high side (about 60 per cent, which is
substantially higher than even the current level of rural absolute poverty of 4852 per cent). At least, this is the preliminary impression that one gets when the
findings of this study are analyzed in the backdrop of Household Expenditure
Surveys (HES) of the Bangladesh Bureau of Statistics (BBS).
2
population is divided into two distinct groups- moderate poor (29 per cent) and hard core poor (23
per cent). In other words, in 1994 about 44 per cent of the poor population fell into the category of
'hard core1 poor.
The most recent HES that is currently available relates to 1991/92 which allows to construct
poverty estimates by the direct calorie intake method. Following this approach, one may identify
several layers among the poor. BBS, for instance, considers two extreme poverty lines: one
corresponds to 1805 calories per day per person (i.e., about 85 per cent of the absolute poverty line
of 2122 calories per day per person); the other line corresponds to 1600 calories per day per person
(i.e., about 75 per cent of the absolute poverty line). Despite the arbitrariness involved in ascertaining
the second extreme poverty line, it relays an alarming message. Even if one takes 1600 calories per
day person as the cut-off mark for severest poverty, the proportion of rural population living below
that line would be 18.3 per cent in 1991/92. As a proportion of the total rural poor in 1991/92, this
translates into an alarming figure of 38 percent.
The above picture of sharp differentiation among the poor is also confirmed by the perception
survey. According to the self-categorization of the respondents of the BIDS survey, in 1994 the
number of rural households who lived in chronic deficit throughout the year was 19 per cent, while
households facing occasional deficit stood at 32 per cent.
The housing indicator identifies an even more extreme level of distress. This is done by using
the BIDS survey data. The housing status is defined by considering the roof/ wall characteristics of
the structure as well as the number of rooms in a house. This yields 4 categories: (i) jhupri, (ii) single
structure house, (iii) thatch and more than one room, and (iv) other more durable types. In 1989/90,
the "single structure" category represented 23 per cent and the "Jhupri" category represented 9 per
cent of rural households. If one focuses on the hard core poor (defined in income space) residing in
these two categories at the bottom end of the housing scale, one may capture the most vulnerable
segment (the poorest of the poor) within the rural poor. This segment constituted about 13 per cent
of rural households and represented 23 per cent of the rural poor.
Access to minimum clothing is another identifying indicator for capturing the extreme
expression of poverty. Proportion of rural population without two sets of minimum clothing was
assessed at 15 per cent in 1989/90; those without any winter clothing was as high as 22 per cent.
While various identifying indicators point to the existence of significant differentiation
within the poor community, it is difficult to conclude which of these best captures the extent of
disparity among the poor. The choice of particular method of estimating poverty may have
significant implication for assessing the size of the hard core poor population (an obvious item of
concern for the policy makers). The 1991/92 HES carried out by BBS may be used to illustrate the
nature of the problem. Thus, according to the direct calorie intake method, the proportion living in
moderate poverty (1805-211 1 Kcal per person per day) in that year was 18 per cent. This is much
lower than the estimated share of the hard core poor (defined up to 1805 K. cal per person per day)
which was assessed at 28 per cent. However, if one goes by the yardstick of income measure, the
rural poor population becomes almost evenly divided into moderate and hard core poor groups (24
and 26 per cent, respectively).
The upshot of the above is to point out the large gap that exists between the poor and the
poorest in rural Bangladesh. The poorest are not small in number or to be viewed as a localized
phenomenon limited to particular regions. They are spread across the country. The next section
explores their demarcating characteristics vis-a-vis the moderate poor and the non-poor.
Summary Points
*
A significant differentiation exists within the poor irrespective of the criteria one
chooses for demarcating the poor (income, consumption, housing, clothing, etc).
*
In designing health interventions, particular emphasis needs to be placed on
reaching the extreme poor who represent about 44 per cent of the total poor as per the
income criteria.
(B)
The Face of the Hard Core Poverty
The poor are defined in this section in the income space. The absolute poverty line of taka
4790 per person per year in 1989/90 prices has been used to differentiate the poor from the non-poor;
the extreme poverty line corresponds to about 60 per cent of the absolute poverty line. The main
variables that have been used in this section for identifying the population who comprise the hard
core poor are: land ownership, land tenure, principal occupation, level of education, and gender
status (see, annex tables 1 through 6).
Nearly 53 per cent of the hard core poor are concentrated in households having no cultivated
land and 90 per cent in households owning less than 1.5 acres. This suggests that hard core poverty
inflicts mostly landless and marginal landowning households. This is not surprising since land still
remains the most important income earning asset within the rural economy. One implication of this
finding is that the current (NGO) practice of targeting households owning up to 0.5 acres may still
4
miss a considerable section of the hard core poor. About 37 per cent of the latter reside in the land
size group of 0.5-1.5 acres. There is a need to bring these households under poverty alleviation
programmes.
Access of land through the tenancy market does not improve the extreme poverty situation
of the landless households. The incidence of hard core poverty is almost the same for the landless
non-cultivator households as for the pure tenant farmers (47 vis-a-vis 44 per cent) who rent their
entire holding. These two categories considered together constitute 41 per cent of rural households
but contain 60 per cent of the hard core poor. In contrast, the mixed tenants and the owner cultivators
are mostly represented by the moderate and the non-poor. Thus, only 15 to 17 per cent of the
population belonging to these households are "hard core" poor. It is possible that, lacking capital as
well as networking capacity, most of the extreme poor households are competed out in the tenancy
market by the more entrepreneurial sections belonging to the moderate and the non-poor groups.
Among various occupational groups the cultivator households have the lowest incidence of
poverty. Only 16 per cent of the population in the cultivator households are hard core poor and
another 25 per cent- moderate poor. At the other end, households who depend entirely on manual
labour, such as agricultural and non-agricultural wage workers, transport and construction workers
have the highest incidence of poverty, particularly hard core poverty. Non-farm households with
capital (trader) and better quality human resources (service holder) occupy an intermediate position
in terms of poverty ranking and are substantially better off than the wage labourers (47-53 per cent
compared with 84-86 per cent).
An overwhelming proportion of the hard core poor (75 per cent) are located in marginal
cultivator and wage labour households. Within the category of wage labour, non-agricultural
households have lower incidence of hard core poverty than agricultural labour households. A further
differentiation can be observed within the agricultural wage labour households as well: workers who
have better health and are better endowed with mental and physical skills generally hire out for piece
rated work which have much higher return to labour compared to work which are valued at daily
wage rate. The share of contract labour for piece rated work is increasing over time and now
constitutes about 30 per cent of those who supply their labour to the agricultural labour market. A
recent comparison between various category of agricultural workers shows that the average wage
income for piece rated workers is about 30 per cent higher than that earned by those working for a
daily wage.
The level of education is also found to be an important correlate of hard core poverty.
Households whose heads had no formal schooling contain 60 per cent of the hard core poor while
those with "above secondary" education, only 5 per cent. Nearly 88 per cent of the hard core poor
5
remain in households who are either illiterate or have attended only primary schools. The importance
of education is amply demonstrated by these findings.
A significant gender dimension is associated with the phenomenon of hard core poverty.
While 28 per cent of male headed households fall within the hard core poor, the corresponding figure
for female headed households is 33 per cent. On average, it is seen that females have a nutritional
intake only 88 per cent that of males and 46 per cent of the wage rate earned by males. Only 29 per
cent of females are literate compared to 45 per cent males. Female headed and female managed
households constitute about one-tenth of rural households and represent perhaps the most vulnerable
social group within rural society.
This provides us the context within which the issues related to the health-poverty interface
need to be articulated and contested. This is attempted in the subsequent section.
Summary Points
*
There are important correlates of hard core poverty. They provide a useful guide
for identifying the poorest as potential beneficiaries ofpublic health related interventions.
*
The hard core poor own little land but not necessarily is restricted to the lowest
land-size group. While 53 per cent of the hard core poor belong to the above group,
another 37per cent belong to the marginal category owning less than 1.5 acres. Thus, the
current (NGO) practice of targeting households owning up to 0.5 acres may still miss a
considerable section of the hard core poor. There is a need to bring these households
under poverty alleviation programmes.
*
The hard core poor has very little link with the tenancy market and almost entirely
comprise of illiterates who earn their livelihood mainly as low productive agricultural
wage labour. They reside in single structure and extremely fragile (jhupri) houses.
*
A large section of these households are female headed or female managed who
experience additional vulnerability as women over and above the problem of severe
income poverty.
6
III.
Interface between Health and Poverty
(A) Morbidity Rate by Poverty Status
Here we consider the rate of morbidity for all types of illness. The 62-vilIage survey of BIDS
carried out in 1994 has been used for the purpose. The overall morbidity rate is defined as the
proportion of sick household members during one month preceding the survey. It is estimated at 12.5
per cent in the rural area. Several aspects are noteworthy in this regard (Annex table 7).
First, morbidity varies considerably by age. The period prevalence rate of morbidity
(referring to one month period) and age have an U-shaped relationship indicating concentration of
high morbidity risk at the two ends of life. The morbidity rate for the elderly people aged 60+ is
about 24 per cent and that for children aged under 5 is 22 per cent. The morbidity risk of the rural
people starts declining after age 5 and the process continues up to age 29 and then take an upward
trend. From age 30 the morbidity risk increases monotonically with an acceleration after age 59.
Second, there is some variation in morbidity rate by poverty status. The morbidity rate for
acute illness is about 15 per cent in case of the hard core poor which is considerably higher than the
matched figure for the moderate and non-poor (about 12 per cent). The greater vulnerability of the
hard core poor is also revealed in the incidence of repeat and major illness.2 This has strong
implication for the income earning capacity of the hard core poor. The latter's only income
generating asset is the labour power which is mostly employed in hard manual work and hence, the
added importance of maintaining better health for this group.
The higher proneness of the hard core poor households to diseases and sickness is also
reflected in the BBS data. Prevalence of morbidity per 1000 rural population in 1994 was 147 in case
of households owning more than 5 acres of land which may be contrasted to 175 observed for
households with less than 50 decimals of land. Such sharp differentiation in morbidity will
predictably entail higher mortality rates in the poorer groups. Thus, as per the BBS data, infant
mortality rate recorded in case of landless and functionally landless households (owning up to 0.5
2 The Information on sickness was collected through three separate
inquiries: (a) acute illness of the household members during one month preceding
the date of enumeration: (b) the repeat illnesses of the members not enumerated
in the first inquiry i.e. members who are not ill during the preceding month
but fall sick off and on from one or the other diseases: and (c) major illnesses
suffered by the members during last one year.
7
acre of land and largely corresponding to hardcore poverty) is more than two times higher than the
matched level observed in the large landowning groups (90-95 vis-a-vis 40). The same applies to the
indicator of crude death rate as well (Annex tables 8 and 9).
Third, both the moderate and the non-poor categories face almost similar risk from diseases.
This may be one indication that, after a certain income interval, the non-food physical environment
still may be the major determinant of health status in rural area.
Summary Points
*
Poverty is associated with higher incidence of sickness and diseases. Both BIDS
and BBS data point to the much higher morbidity and mortality rates among the hard core
poor vis-a-vis the moderate and the non-poor.
*
Both the moderate and the non-poor categories face almost similar risk from
diseases indicating that, after a certain income interval, the non-food physical
environment still may be the major determinant of health status.
(B) Health Care Access by Poverty Status
What is the current status of health care access by different groups of the poor in rural areas?
Health care is defined broadly in this section and includes modem allopathy to crude totka and
spiritual healing having little scientific basis.
The most striking aspect that emerges from the available evidence relates to the very limited
access to public health care facility (Annex table 10). In general, the level of access varies little
across poverty status, averaging at about 12 per cent for acute illness. For major illness, the access
level is higher (about 23 per cent). More disturbing is the fact that the public sector role is shrinking
over time. In 1984, about 20 per cent of the total rural treatment for acute illness was done in the
public sector. This declined to 13 per cent in 1987 while the recent estimate for 1994 is just 12 per
cent (Begum 1995).
What are the factors underlying the poor performance of public health care facility in rural
areas? It appears that the supply side constraints play the dominant role here. According to one
estimate, about 30 per cent of the Thana Health Complex (THC) lack adequate equipment and
8
supplies of pharmaceutical. The absenteeism of the doctors is rampant: 3 out of 9 doctors are
physically present in THCs and that too for only a limited period of time. The problem of inadequate
personnel management is also linked to the poor incentives for the urban-centric doctors with higher
medical degrees to work in the rural areas. This is related to the overall problem of incentive
compatibility of the institutional design and can be traced back to the abolishment of the very
important intermediate tier of health service personnel, i.e., the paramedics.
The above trends are confirmed through a perception survey carried out in the late eighties
(Annex table 11). "Inadequate attention given by the physician" is cited as the major reason for non
visit to public health facility (representing 28 per cent of responses), followed by lack of medicine
(26 per cent of responses). Another 24 per cent cited poor quality of services involving long waiting
time, absenteeism, ineffective treatment, charge of "extra" fees. While more needs to be documented
on the quality of medicare as applied to rural and urban areas, there are strong impressions that the
quality of public health care accessed by the urban poor is no better. Indeed, in one respect, urban
public health care even lags behind its rural counterpart. In rural areas, there is a public health
infrastructure at thana and union levels (THCs, sub-centres, dispensaries, maternity centres), and a
referral system can be developed linking these levels with the district hospitals. Such infrastructure
is virtually non-existent in urban areas. This results in tremendous load on the existing outpatient
facility in the public hospitals which could have been reduced by lower tier medicare facility (say,
at the Word level). Such a practice adversely affects both the access and the quality aspects.
If one focuses on the health care providers in the private sector, several trends are discernible.
In general, the most notable development in this sector pertains to the emergence of medicine shops
as a major actor in the area of rural private health. About 17 per cent of private treatment is provided
by this source which is only next to the weight of quack allopathy practitioners. Another notable
feature of current health care practice of rural people is that the totka and spiritual healing which
used to enjoy much popularity earlier have virtually lost ground for the management of illness: these
sources accounted for 9 per cent of the total treatment for acute illness in 1984; it has come down
sharply to only 2 per cent in 1994. At the other end, only 21 per cent of private treatment is provided
by qualified individual practitioner. The stunning absence of NGOs or private clinics is also notable?
This suggests that the predominant supplier of the rural health care is still the unqualified and
untrained ones. Outside the sphere of public health care, rural population has only limited option for
accessing quality services. This is particularly true for the hard core poor who can hardly afford to
pay for the visits to quality private medicare.
3 The case of qualified individual practitioners is not without some irony.
however. The widely held view is that many of these practitioners are actually
in the pay-roll of rural public health centres, but work most of the time as
private doctors, often in their own medical shops.
9
Some variation in access can be noted among the poverty groups. As expected, the share of
private treatment provided by qualified private practitioner is much lower in case of the hard core
poor compared with the moderate and non-poor (13 vis-a-vis 19-27 per cent for the category of acute
illness). This is matched by higher prevalence of totka and unqualified allopathy practitioner as
sources of private medicare for the hard core poor. Hence, it is safe to conclude that not only the hard
core poor are more prone to sickness and disease, the average quality of health care accessed by them
is worse compared to their more privileged counterparts. This is suggestive of vicious circle of
"morbidity-ill care-morbidity" that characterizes the existential destiny of the hard core poor.
Summary Points
*
The access to public health care in rural areas is extremely limited, about 12 per
centfor acute illness and 23 per cent for major illness. Even at that low level, the access
to public health is declining over time.
*
The level of access varies little by rural poverty status reflecting in general the
primacy of the supply side constraints.
*
In general, the public health has suffered in a major wayfrom the abolishment of
the very important intermediate tier of health service personnel, Le., the paramedics.
*
The quality of public health access is very poor. This is true not only for rural
areas, but also applies to urban areas. The quality issue, however, needs to be studied in
greater details.
*
From the policy point of view, the situation with regard to the urban poor seems
to be in an even more precarious state. In rural areas, after all, there is a health
infrastructure, and a referral system can be potentially developed linking the lower (thana/
union) levels with the district levels. Such infrastructure is virtually non-existent in urban
areas. This results in tremendous load on the existing outpatient facility in the public
hospitals which could have been reduced by lower tier medicare facility (say, at the Word
level).
10
(C)
Poverty Implications Ill-health
So far the discussion has centered around only one aspect of the health economics of being
poor, namely, how poverty affects the likelihood of getting sick and receiving quality health care
service at affordable price for the treatment of such sickness. In this section, we shall consider the
reverse causation, i.e., how lack of adequate health care places the rural households at even greater
risks of slippage into the downward spiral of poverty.
We start by exploring the cost of the burden that private treatment expenditures impose on
the rural poor. Households are ranked by per capita income and grouped into ten deciles. Average
private expenditure per household on medical treatment is computed for each decile and expressed
as percentage of total household income. We also did the similar "incidence" exercise for estimating
the "gross" benefits from public health allocations that are currently received by different rural
income groups.4
Several aspects of the health-poverty interface are notable from this exercise (Annex table
12). First, the hard core poor households (corresponding to the lowest two income deciles) currently
spend 7-10 per cent of their income to cover private health expenses which is a sizable burden by
any reckoning. If this burden can be relieved through greater targeting and provision of public health
care, this would have substantial poverty alleviating effect.
Second, this is just one aspect of the income erosion. The other, more critical, aspect of it lies
4 The latter estimate Is relatively tentative In nature, though the emerging
trends seem plausible. To estimate the distribution of "benefits" from public
health expenditure In rural areas, the relevant Indicator to consider is the
number of annual visits of household members to government facility. The survey
based figure of average annual visits per rural person has been used to
approximate the total visits to government health facility by rural population.
as recorded in 1994. Combining this information with macro budgetary data, one
can estimate the "gross" subsidy per (rural) visit to government health facility.
This is estimated to be taka 211 in 1994. Once the estimate of subsidy per health
visit is known, one can calculate the total amount of
benefits accruing to various income deciles using the survey information on the
utilization of health facility. This is. of
course, based on the assumption that unit costs are the same for the various
income levels which is hardly satisfactory. However, such disaggregated data are
not currently available.
11
in the acute vulnerability of the poor households to sudden and unanticipated health related shocks.
leading to the loss of income and employment, and increased indebtedness. Health related shock
represents important determinant of the downward mobility along the poverty spiral. Thus.
additional analysis of panel data reveals that health hazard related risk-events explain, on average.
16 per cent of causes of deterioration experienced by households during the 1990-94 period. For
non-poor households who slipped into hard core poverty, the share of health related causes is as high
as 21 per cent. The importance of the health factor is also considerable (explaining 18 per cent of
causes) for those among the moderate poor who descended into hard core poverty in the subsequent
period (Sen 1996).
Third, underlying the adverse dynamic effects of ill-health on poverty is the way the
households cope with the sudden and unanticipated crisis events. Data are available at the average
rural household level. Only in 15 per cent of cases, the option of soft credit mobilization can be
obtained. Negative methods of coping such as asset sale is recorded in 15 per cent of cases, while
other forms of dissaving explain 60 per cent of coping mechanisms. High interest borrowing is
recorded in only a few cases (4 per cent), implying the limited role that rural informal credit plays
in providing risk-insurance. Thus, the almost exclusive reliance on disinvestment and dissaving has
long-term adverse consequence for recovery, upward mobility and poverty alleviation.
Fourth, a comparison of the relative proportion of public and private health expenditures
indicates that benefits through public health still cover a small part of the health care demand. The
amount of "gross" benefits derived from public health spending represents only 0.5 per cent of
average rural household income. The pattern of distribution of public health spending, however,
shows certain degree of progressivity. Benefit from the latter source, as proportion of income, is
found highest for the poorest (2.9 per cent) which declines almost secularly to 0.2 per cent in case
of the top two deciles. This shows the potential re-distributive benefits associated with effective
expansion of public health programmes in rural areas.
Summary Points
*
Poor health imposes a significant burden on the poor. Such burden represents 7-10
per cent of the hard core poor's income. If this burden can be relieved through greater
targeting and provision of public health care, this would have substantial poverty
alleviating effect.
*
Acute vulnerability of the poor households to sudden and unanticipated health
related shocks leads not only to the loss of income and employment, but also to increased
12
indebtedness associated with the raising of coping costs. Poor health thus reduces the
long-term accumulation and hence, growth capacity of the poor.
*
Health hazard related risk-events explain, on average, 16 per cent of causes of
deterioration along the poverty spiral experienced by households during the 1990-94
period. For non-poor households who slipped subsequently into hard core poverty, the
share of health related causes is as high as 21 per cent. While such slippage may origin
in the stochastic nature of events, for many of these households it may well turn out to be
a route to permanent poverty.
*
Benefitfrom the public health spending is quite low, representing only 0.5 per cent
of rural household income. The incidence of such spending, as proportion of income,
however displays certain progressivity. It is found highest for the poorest decile (2.9 per
cent), declining almost secularly to 0.2 per cent in case of the top two deciles. This shows
the potential re-distributive benefits associated with effective expansion ofpublic health
programmes.
IV.
Some Broad Policy Implications
The preceding review points to several aspects of the health-poverty interface. First, the
focus on income is just not enough for sustainable poverty alleviation. The routine approach to
poverty alleviation through various growth-promoting (including micro credit) policies misses out
a very important dimension of the income erosion problem facing the poor households. The threat
of income erosion constantly exerts downward pressures along the poverty spiral. Second, Lack of
adequate health care represents a particular source of income erosion for the poor, particularly the
hard core segment of it. The burden of income loss represents about a tenth of hard core poor's
income. The dynamic implications of ill health are even greater: health hazard related risks explain
16 per cent of all cases of downward movement along the poverty spiral. Third, to a large extent.
such risks also explain the vulnerability of the tomorrow's poor. Thus, even for households who are
otherwise classified as non-poor as per the income criteria, ill health has emerged as a prime concern
and an important explanator of downward mobility.
It is in the above context that one needs to re-think the current strategy of poverty alleviation
with its near total reliance on giving access to non-farm micro credit, training and the like through
NGOs. Many of these programmes lack any explicit focus on health, particularly in its curative
dimension. While access to credit/ training helps the poor to generate additional incomes, the net
13
impact of such policies is often nearly wiped out (or, at least greatly reduced) by the lack of adequate
insurance mechanism against health-related risks. This may provide an important explanation as to
why despite the proliferation of micro credit programmes, their net impact on poverty reduction at
the aggregate level has been marginal.5 We argue that all routes matter: what is needed is a mix of
income generation and risks-insurance policies aiming at a faster reduction of poverty. In concrete
terms, it would translate into an effective combination of health and micro credit (along with
education) interventions targeted specifically to the poor.
Another major lacuna in the current thinking on poverty alleviation lies in the stunning lack
of knowledge about possible health implications of the various sectoral policies that currently pass
under "development". Many of these policies are implemented without considering the possible
negative externalities associated with ill health. Expansion of primary education without a minimum
provision for school-based health care, sanctioning of industrial units regardless of their pollution
contents, the highly inadequate system for the safety of industrial workers, deteriorating quality of
the so-called "safe" tubewell water, etc are some of the cases in point. Even for the readymade
garments sector which employs over 600,000 women workers and earn over 65 per cent of the
country's exports, there are no direct health care policies. But, the issue goes beyond just identifying
the potential areas of health-distress in the profile of on-going sectoral policies and interventions.
A greater health awareness in the design of the sectoral policies will also help to promote
positive health actions in many unexplored ways and areas. To what extent is health awareness built
in the current primary and secondary education curricula? How can one strengthen public health
awareness through mass media? What roles local governments (including the City Corporations) can
play in ensuring a clean environment? At the moment we can only pose these questions. There is
hardly any study in Bangladesh which looked into the impact of sectoral policies on health.
As noted in the review, public health care is inj.,very dismal state in both rural and urban
areas. The incentive compatibility of the institutional Arrangement for public health is yet to be
worked out, as revealed in the endemic problem of absenteeism of the doctors at rural THC. The
abolishment of the paramedics as a very important tier of health personnel management had a far
reaching adverse consequence for the rural poor's health care.
5 This can be judged by various data. According to the household expenditure
survey of BBS, rural poverty declined by only 1 per cent during the entire eight
year period between 1983/94 and 1991/92. i.e.. at a time when most of the NGOs
have gone into credit operations (Ravallion and Sen 1996). The 62-village surveys
carried out by BIDS also show the rate of poverty reduction to be rather modest:
rural headcount declined by only 6 per cent in the seven year period between 1987
and 1994.
14
What are the options that exist beyond routine drives to improve upon the existing quality
of public health? The involvement of NGOs in the field of curative health care is still in the stage
of infancy and the strategic thinking on this score lacks a sense of direction and dynamism. The same
applies to the potential case of promoting local social development activities with focus on
community health care. The role of local government in this vital area of public life has been
restricted to the minimum, if not virtually non-existent. How to re-orient the public agencies, NGOs
and local communities to address the health concerns of the poor is something for which we do not
yet possess a definitive institutional answer, but it surely represents a question marked with urgency
that needs to be articulated and contested further.
References
Hossain, Mahabub, "Socioeconomic Characteristics of the Poor" in:
Rahman, Hossain Zillur, and Mahabub Hossain (ed.), Rethinking Rural Poverty. Bangladesh as a
Case Study, Sage Publications, New Delhi, 1995.
Begum, Sharifa, "Health Dimensions of Poverty" in: Rahman, Hossain Zillur, Mahabub Hossain,
and Binayak Sen (ed.), 1987-94: Dynamics of Rural Poverty in Bangladesh, Bangladesh Institute
of Development Studies (BIDS), Dhaka, April 1996.
BBS (1996) Bangladesh Bureau of Statistics (BBS), Divisionwise Health and Social Statistics of
Rural Bangladesh by Land Ownership 1994, Dhaka, April 1996.
Ravallion, Martin and Binayak Sen, "When Method Matters: Monitoring Poverty in Bangladesh"
in Economic Development and Cultural Change, Vol. 44, No. 4, July 1996.
Sen, Binayak, "Movement In and Out of Poverty: A Tentative Explanation" in: Rahman, Hossain
Zillur, Mahabub Hossain, and Binayak Sen (ed.), 1987-94: Dynamics of Rural Poverty in
Bangladesh, Bangladesh Institute of Development Studies (BIDS), Dhaka, April 1996.
Sen (1996b), "Poverty and Policy" in Independent Review of Bangladesh's Development 1995/96,
Centre for Policy Dialogue (forthcoming).
15
Annex
Tabic 1
Incidence of Poverty by Size of Land Ownership, 1989-90
Land ownership
Extreme and moderate
Extreme poverty
poverty
group (acres)
Incidence of
poverty
Share of
the poor
Incidence of
poverty
Share of
the poor
(per cent)
(per cent)
(per cent)
(per cent)
No cultivated land
47.0
53.0
78.3
43.9
Up to 0.49
42.3
19.1
71.4
16.0
0.5 - 1.49
24.8
17.4
60.9
21.2
1.5-2.49
11.8
4.5
44.5
9.1
2.5-4.99
8.4
4.1
31.2
7.7
5.0 and more
3.4
1.5
9.1
2.1
Total
27.5
100.0
55.4
100.0
Source:
Hossain (1995). Analysis of Poverty Trends Project, BIDS: 62 Village Survey.
17
Tabic 2
Incidence of Poverty by Land Tenure, 1989-90
Land tenure
Extreme and moderate
Extreme poverty
group
poverty
Incidence of
Share of
Incidence of
poverty
the poor
(per cent)
poverty
the poor
(per cent)
(per cent)
46.7
47.9
78.8
39.2
Pure-tenant
44.0
13.1
78.7
11.7
Tenant-owner
24.7
9.7
60.8
11.9
Owner-tenant
16.5
6.6
38.4
7.6
Owner culti-vator
14.9
22.6
39.3
29.6
Total
27.5
100.0
55.4
100.0
(per cent)
Landless Non
Share of
cultivator
Source:
Hossain (1995). Analysis of Poverty Trends Project, BIDS: 62 Village Survey.
18
Table 3
Incidence of Poverty by Education Status, 1989-90
Education level
Extreme and moderate
Extreme poverty
of the head
poverty
Incidence of
poverty
(per cent)
Share of
Share of
the poor
Incidence of
poverty
the poor
(per cent)
(per cent)
(per cent)
No formal
schooling
37.5
60.1
68.5
54.5
Primary
22.2
28.2
56.0
32.3
Secondary
16.9
7.9
35.9
7.6
Above secondary
10.4
4.5
26.7
5.6
Total
27.5
100.0
55.4
100.0
Source:
Hossain (1995). Analysis of Poverty Trends Project, BIDS: 62 Village Survey.
19
Table 5
Incidence of Extreme Poverty by Occupation Controlling
Landholding Size, 1989-90
(Per cent of population)
Landholding size (acres)
Occupation
Less than
0.5-2.49
2.5-4.99
5.00 and
above
0.50
Cultivator
54.1
18.9
7.5
3.0
Wage Labour
57.9
39.9
*
*
Traders
25.6
13.6
12.2
14.6
Service
35.8
20.5
17.1
16.4
Others
49.5
25.5
21.8
4.3
Source:
Hossain (1995). Analysis of Poverty Trends Project, BIDS: 62 Village Survey.
21
Tabic 6
Characteristics of Hard Core Poor, Moderate Poor and
Non-Poor Households, 1987/88
Variables
Extremely
Moderately
Poor
Poor
Non-Poor
Land and New Technology
Land owned (acre)
1.02
1.14
2.15
Land Cultivated (acre)
1.59
1.85
2.72
23.1
25.0
21.5
30.9
37.1
45.1
24.2
26.1
35.1
Family Size
6.53
5.96
5.85
Per Cent of Family
Children below age 10
34.6
31.6
24.2
33.3
24.1
35.0
42.7
26.8
33.4
78.7
69.2
56.9
Proportion of Area under
Tenancy (%)
Proportion of Area under Modern
Variety Rice (%)
Proportion of Area Irrigated (%)
Demographic Characteristics
Males above age 10
Adult males (16 years
and over)
Child-Woman Ratio
22
Education
Proportion of Students in
Age Group 6-15 (%)
Male
Female
52.8
43.0
63.0
56.5
70.0
85.5
63.6
47.0
9.7
14.4
24.7
61.8
Proportion of Illiterate
Adult Members (%)
Proportion of Literate Adult
Members with Higher Education (%)
Source:
Hossain and Sen (1992)
23
Table 7
Morbidity rate by Sex, Age and Economic Condition: Rural Area
Rate per 100
All
Acute
illness
Repeat
Major
illness
illness
12.5
9.1
4.0
12.0
7.8
10.6
4.0
4.1
2.1
Sex
Male
Female
13.1
Age (years)
0-4
5-14
22.1
10.1
9.2
4.1
15-29
8.1
3.6
1.3
3.7
30-44
12.9
15.7
11.6
5.6
45-59
22.1
7.6
60+
23.6
30.9
10.2
Hardcore Poor
Moderate Poor
14.6
12.4
9.4
8.7
4.7
3.7
Non-Poor
11.6
9.0
3.9
Economic Condition
Source:
Begum (1996). Analysis of Poverty Trends Project, 62 Village Resurvey, 1995.
24
Table 8
Infant mortality rate (IMR) per 1000 live births by size of land
owned (acres) and division in rural Bangladesh, 1994
Size of Land
Total
Division
owned (Acres)
Barisal
Chittagong
Dhaka
Khulna
Rajshahi
Total
84.5
102.1
79.3
82.0
79.4
85.9
0.00-0.04
95.2
104.2
86.8
91.2
102.3
102.1
0.05-0.49
90.3
105.1
82.8
81.6
93.6
98.6
0.50 - 2.49
89.7
■ 112.0
81.2
89.5
65.6
89.9
2.50-4.99
41.1
71.4
50.9
48.5
60.6
28.6
5.00 +
39.9
85.1
44.1
25.0
37.0
21.3
Source:
BBS (1996).
25
Table 9
Crude death rate (CDR) per 1000 population by size of land
owned (acres) and division in rural Bangladesh, 1994
Size of Land
Total
Division
owned (Acres)
Barisal
Chittagong
Dhaka
Khulna
Rajshahi
Total
8.9
9.7
9.0
9.1
8.7
8.5
0.00-0.04
11.8
12.8
10.9
12.4
14.6
1.4
0.05-0.49
10.3
11.7
8.6
9.1
13.7
11.8
0.50-2.49
9.0
9.3
9.6
9.1
8.1
8.5
2.50-4.99
6.0
6.0
6.2
7.3
3.1
6.1
5.00 +
5.7
5.6
5.4
8.5
7.4
5.1
Source:
BBS (1996).
26
Table 10
Source of Treatment by Economic Categories: Rural Area
(% household)
Hardcore
Moderate
Non
Poor
Poor
Poor
A. Government Health Facilities
11.9
11.7
B. Non-Govemment Health Facilities
( i) Private Clinic
( ii) Qualified Practitioner
88.1
12.5
87.5
Acute Illness (last treatment)
(iii) Unqualified Practitioner
( iv) Homeopathy
( v) Kabiraji/Unani
( vi) Pharmacy
(vii) NGO
(viii) Totka
( ix) Own Knowledge/Other
.8
12.7
44.6
5.2
3.6
17.5
-
2.0
1.6
1.9
19.2
43.8
3.4
3.0
15.5
-
88.3
1.3
27.2
32.0
3.6
5.2
17.3
-
.7
1.6
25.3
21.5
22.9
74.7
78.5
.4
2.5
77.1
2.6
( ii) Qualified Practitioner
28.9
35.4
41.8
(iii) Unqualified Practitioner
24.0
2.4
17.7
-
15.7
2.0
7.2
-
Major Illness (main treatment)
A. Government Health Facilities
B. Non-Govemment Health Facilities
( i) Private Clinic
( iv) Homeopathy
8.4
8.9
( vi) NGO
( vii) Totka
1.2
-
(viii) Own Kmowledge/Other
2.4
2.5
1.3
-
(
v) Kabiraji/Unani
Source:
1.3
Begum (1996). Analysis of Poverty Trends Project, 62 Village Resurvey, 1995.
Table 11
Reasons for Non-visiting the Government Health Centres by Allopathy
users from Non-Government Sources
Percentage
Reason
Government health centre is far away and communication with the
health centre is bad
9.2 (62)
Long waiting time
4.9 (33)
Doctors are not available often
1.9 (13)
Inadequate attention given by the physician*
2'8.1 (186)
Medicines ar not available
25.7 (172)
Government health centres ask for money
12.7 (85)
Treatment is no good
3.7 (25)
Other
13.6 (91)
All
100.0 (669)
Includes answers like "doctors do not examine the patients carefully" or "doctors do not
listen to the patients".
Note: Figures in parentheses indicate number of cases.
28
Table 12
Public and Private Health Expenditure Incidence by Per Capita
Income Decile in Rural Bangladesh: 1994
(Annual figure in taka)
Decile
Per
Capita
income
(1)
(2) as %
of(l)
(3) as %
of(l)
(3) as %
of (2)
expenditure
Per Capita
public
health
expenditure
(2)
(3)
(4)
(5)
(6)
Per Capita
private
health
1
1693.58
173.50
48.71
10.2
2.9
28.0
2
2911.38
202.19
33.51
6.9
1.2
16.6
3
3678.96
208.29
46.20
5.7
1.3
22.2
4
4457.10
170.80
13.87
3.8
0.3
8.1
5
5361.35
187.40
67.46
3.5
1.3
36.0
6
6352.07
205.56
30.75
3.2
0.5
15.0
7
7930.18
194.14
32.59
2.4
0.4
16.8
8
9986.57
251.23
25.97
2.5
0.3
10.3
9
14291.59
297.74
27.50
2.1
0.2
9.2
10
26915.58
626.57
51.66
2.3
0.2
8.2
- Media
 RF_COM_H_70_B_SUDHA.pdf
Position: 2250 (8 views)