NUTRITION & CHILD SCHOOL HEALTH
Item
- Title
- NUTRITION & CHILD SCHOOL HEALTH
- extracted text
-
RF_COM_H_69_3_SUDHA
5/7/£f
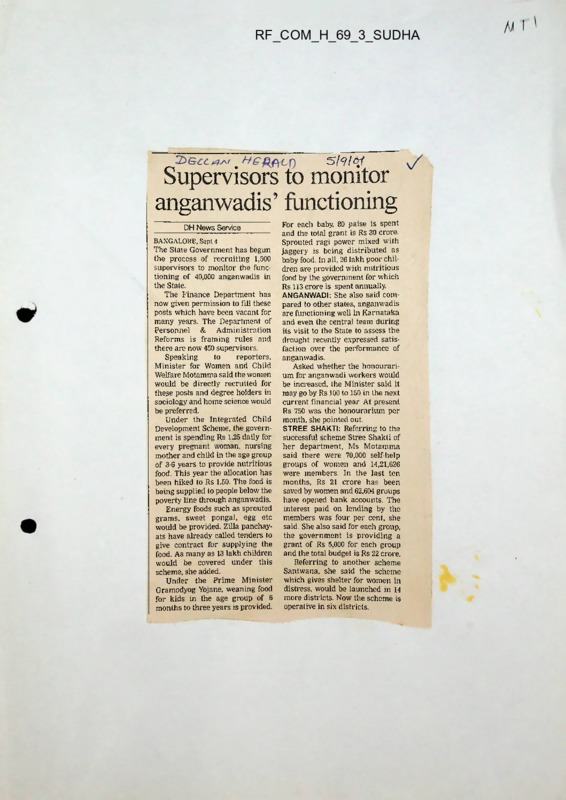
Supervisors to monitor
anganwadis’ functioning
PH News Service
BANGALORE, Sept 4
The State Government has begun
the process of recruiting 1,500
supervisors to monitor the func
tioning of 40,000 anganwadis in
the State.
The Finance Department has
now given permission to fill these
posts which have been vacant for
many years. The Department of
Personnel & Administration
Reforms is framing rules and
there are now 450 supervisors.
Speaking
to
reporters,
Minister for Women and Child
Welfare Motamma said the women
would be directly recruited for
these posts and degree holders in
sociology and home science would
be preferred.
Under the Integrated Child
Development Scheme, the govern
ment is spending Rs 1.25 daily for
every pregnant woman, nursing
mother and child in the age group
of 3-6 years to provide nutritious
food. This year the allocation has
been hiked to Rs 1.50. The food is
being supplied to people below the
poverty line through anganwadis.
Energy foods such as sprouted
grams, sweet pongal, egg etc
would be provided. Zilla panchayats have already called tenders to
give contract for supplying the
food. As many as 13 lakh children
would be covered under this
scheme, she added.
Under the Prime Minister
Gramodyog Yojane, weaning food
for kids in the age group of 6
months to three years is provided.
For each baby, 80 paise is spent
and the total grant is Rs 30 crore.
Sprouted ragi power mixed with
jaggery is being distributed as
baby food. In all, 26 lakh poor chil
dren are provided with nutritious
food by the government for which
Rs 113 crore is spent annually.
ANGANWADI: She also said com
pared to other states, anganwadis
are functioning well in Karnataka
and even the central team during
its visit to the State to assess the
drought recently expressed satis
faction over the performance of
anganwadis.
Asked whether the honourarium for anganwadi workers would
be increased, the Minister said it
may go by Rs 100 to 150 in the next
current financial year. At present
Rs 750 was the honourarium per
month, she pointed out.
STREE SHAKTI: Referring to the
successful scheme Stree Shakti of
her department, Ms Motamma
said there were 70,000 self-help
groups of women and 14,21,626
were members. In the last ten
months, Rs 21 crore has been
saved by women and 62,604 groups
have opened bank accounts. The
interest paid on lending by the
members was four per cent, she
said. She also said for each group,
the government is providing a
grant of Rs 5,000 for each group
and the total budget is Rs 22 crore.
Referring to another scheme
Santwana, she said the scheme
which gives shelter for women in
distress, would be launched in 14
more districts. Now the scheme is
operative in six districts.
NAME .AND .ADDRESS OF CDPO'S
(BANGALORE URBAN)
Smt, I’ushpalatha Rayar,
Cliild Development Officer,
No.39, End Floor, Corporation
Shopping Complex, JC Road,
Bangalore Central, Bangalore-560 002.
PH: 2234490
Sri. K.H. Shivaramegovvda,
Child Development Officer,
No. 51, End Floor, Corporation
Shopping Complex, JC Road,
Bangalore Central, Bangalore-560 002
PH: 2234490
Smt. B.S. Bharathi Devi,
Child Development Officer,
1265, NEG "A" Section,
Yclahanka, Bangalore (North),
Bangalore-560 064.
PH:- 8462513
Sri. C. Hanumanlharayappa,
Child Development Officer.
No. 19, E Floor, Vivekananda Colony,
JP Nagar post. Kanakapura Main Road.
Bangalore Sontlt, Bangalore-560 078.
PH:- 6713097
Smt. VccnaHarish,
Cliild Development Officer,
Sumangali Seva Ashram,
CholanaYakanahalli, R.T. Nagar Post,
Bangalore-560 032.
PH:- 3439190/3330499
EkXHick) 3orW
Loo3jofle,z;Kf
jSfc oa
10-00 - 1.-00
J a>e.®S djdQ, '3atv)( aurttf ;\xwr?o3cs dOcSoAjrJoat--
2.00 - 3,. 30
\
3'30 - 5/00
: wtjdra$
*
2^ ad
10/00 - 1^00
: 3ddt& C<oojd
2/00 - 3-30
: ddC^.3 xfDodjF^/djd
dOdodd
*
dododu
*3
Vd^d dLJddL^C? 1 Vd
Dpjd dc^dOOddo^.)^.
CJ Coddd c) C •
'‘t&j tfaodjf'd/djritfj-
: dud Gd, — da^
3«30 - 5-00
3*< Qd
9-30 - 10-00
!
10-30 - 11-15
!
11-15 - 11-30
etc) $Qdd7)dd
del £)p5cJ\_Tc)d
.
' : cy
^TcJ udi
11-30 - 1-00
•
1-00 - 2-00
: GTOU
2-00 - 5-00
!
cxfO^di-XTc)rJ
dvkJOCddOOxlX-XJc^dd)
^TDCidui.Uj,, ddco^OCXj’J cTcJ^dcxjcJd
——
£3?\Jc)£_d $
—’
i/DojyJD.^v 'TcJflvTi) C3^F
.jOdkJc)
v?)O<7
. (ujoduriv
ad
9-30 - 10/00
: destock) aijoJurtf tjfln rlaou
•10-00-11'15
: djv^V fttfdcartodu vSOCkiFujduritf udEi^vS
11-15 -11'30
: au
11-30 -1.-00
•
1-00-2-00
2-00-3-30
3-30—5'00
cS\Jxj
C’a'Lii-i^Odd
vc OddF v^/• JddV cjd -'O^
( dOdOtjOd0Od>J<J\^Cxj)
*dC'?.C‘d cidDcJd
1.....................
• r>.'»J<
CJDUcJ^rdr'-' O
*'Ud
•
cJcJUSJ^TScj
(vcJdt
*
vSOdOF^dj
\t »u>O
*
>\J
oCvK)^/ ’£>OO\J dflpj
cjCXjOO'U
*
ClOio ;’Jq^
c-3
: 2 ;
5^ 1)3
id’OO - i-CC :
33 US #3 3) o533£.tJ$fi
—
■
o5vjaes”So3o
—
wB^autf eekn?s.rifl yUv
—
sonrt330 8<ortj
>;
L.,00 - 2-00
:
^krep.a3 aoaru
2.00-3.15
:
FuTjUTIj ’ <TOO £)vc/ix) O'JvJDQ. c.’ix>O\J\J'0<TJ OOmoJ^Tc1Q>
3’15 - 3-30
:
g5fi<3CXk) aiiOO\Jf5tf c«V
3’30 - 5-00
:
33j<L» f-reu a3i)3 Ch5ju(i.J-'3oJj5„ sort 33? G; 3ao3oev?!rodjcJ
33
( 3oooConooOJO-JjJ ) •
"lili j.
6(5^ Ocj
*-:
u.SkSO.,
■'
iic.-oe
• . -13
10’00 - 11-30
i cjCJvJc)
11 ’30— !• 00
: rt>orp''joo'JS
*
1.G0 - 2’00
: ^J3e.3!3 aO33u
2.00 - 3-15
•
3-15 - 3-30
::au
3.30 - 5.00
•
c^r&Jr^.Aj •
^:5‘
rj3x_XJC13O3v) ^T3ri3<3)30c>*“
: ’
*3ri<T3
3U.
jdflvH)
30
•c
3-J\AJCT3OO\J tJ333cjr5oav
vf?>(X5Uf:"'i?3FO0U(J
: 3 7
eld LTD dvFDdF
7^g, aa
:
10-00 - 1 -00
sTi) gn> Ekjr> dr
n.'ioyt^nj'jaS'"
tlcrkjT) di)
ddFSjDg.djj.’u ivdtofl Nd(pNj?jiclS
*
dujdsi<fj •
^rorid&Njd uurtvu Jjgj, a3r •
i - oo -
•00
2 -oo -
•15
-
ajug.ud adDdj-
0—6
:
Atfrir’rt
do£krag.aj'DoJjJ„<lyjd
a^ddO Sd^orluUp,
C9u£)^t?$
3-15 - : -30
-
Srft
3-30 - ! •00
-
0—6 d^F dod^g.aJ'3odjJ„djd dj^^'u1 Stfdnfi
djjodjdOv-
dduodj
8 Ng. On
10-00 - 1-00
:
dujdiJvil'Jj
—
Svrotfaorto :torijc> i/FeorSra
—
GtJrtVj
—
e^ssodc) ne.SrStfj
iiarkro aoJjduritfj)
ayuat3vu
—
—
SOdoJj. : 20
1-00 - 1 •00
—
Ski7)g.aa acradj
2 -00 - f •00
—
fitfrjrarW Sg.^ododd 'aa^rog.dvOra dnrtjg) ntfSOtiritf
docVaOv, 3oCji Fkrouu tkng.ttJuU djc'ritfj •sgSn^a-
9 nc. On
10-00 - 1-00
:
dujcltJuritfj
—
djdo i.rod'joooF
—
iJDT-jritfj dJSJ, 3<iJ ng.
rVi?j
*
—
. ^1'70
NOdU^ix) xlvlddr-J0I
—
StfdrfloJj <sidrttfj"
acfddJ
1 -00 -
•00
■—
2-CO -
•00
::
d'Jdrrtrt fig.’^rtododd tsfljDgdvdr: 3c>njT> 5jc®^rog.d?;clrritf 3ocRj?0 •
—
uc>m?5u dvTOg.t'F',
SOflg.3 tA£>£r JttfVAj |
uldj
ijlJd'Jj
IQSe, OS
10-00-1-00
w>rtrt«J<
SujrnJSrtVj (?>Jrtn ®03)
—
Soft^rtVu
—
OSj^rt^j
—
pit iOOOO
—
GjOojUO
—
GUfitfO,
dOiO'VJO
—
3ot)^jf5
aO^do-
1-00-2-00
00
*
2
:
—5
00
*
oj
l
5
*
vffiVO
4
1
—
?pF5u^O<
—
Qj i!r u Of i V
—
&30jH V ^>OT)O0c>OC) v
CiM
ucC’q^JJ
>'J 30007)U$-
rtd &ODC'
cj0',-5 O^jO
—
\3_j'.S\J ojvDCirtDn
—
6K?-ofi ’! o00O0O
-
.
^JOt^GnJOC) v
coUTSVO
-KjJe^ OAIjO'ikJO^fVJ
ZoOUJ-'i VFjxJ^ ZJC.tJOE) v (?JO0q
—
rhJOro.gOJjrJO^ Oc.riODv)
lifts, aS
■
SDCkro&J .kx-kL, yTjJwtSsit,^ ftVSnftrt rtaOrtiliSrt'Jj-
io -oo — i -00 — -.Tdrji-i'vj
— OUSDo^v vjL'P.I'Ja
rl'jOwo-Op,
cxlj
— SJcoJCi 5jDo3rtVj
,
— ftvJOoft
■—~ jJClVU ■ ivJ'^O „
1-00 - 2-00
-
2-00 - 5-00
-
fr./TjSJ
*N
<
vOf'fVj
Fju
—
ftjiioflrf'.Aj
—
12 (\)^_ Ofj
("jo: j fijeofirttfj)
v,v SOS'ld SOSfj^
;jT.<r/SJeSF ■<-.;j-!'l-'S-'SO<
•
"tDOvTD
*
oOOkJdOv
njSo5.jDc.rt-
10-00 - 1-00 -
pj^Ovj
r>kj<) • \j
■.j
<-,-u-t.r5vo Wj •_■ -'■.0 •
1-00 - 2-00
-
^o-Deos aciDju-
2 -00 - 3-30
:
oOrnj;'- 7.:ort;ojDt,ort'Jfk)-4. mso5ji:e.n.'>
jaoi
*
-rtoOjDO
*
3-30 - 5-00
:
•J c y Oj <5o cdOT:fj5 £^O •
j oD^jD.ewtfdortV
1•
10-00 - 1-00
cTdCrOcjOuCjf c3
*JO ’a l^rVoiv'U^ i^^rJ -Of,, O^fO'JO
’5uO (A£j050’0<Lrt ’
1 ‘00 - 2-00
:
<J)O7)<cjr3 c)Ot)S5U
*
2-00 - 5-00
:
O^oOoriVpiOet i) v^cj vOT)Vo^oK^o
—
ZJVrbOOS'. J cdvu^OOOMV
(u’oTJcbn) ^rOT) Vo^rjjOo)
“
14ftg, OS
10-00 - 1-00
ftuvros ssEr3<joe.a<jJ:'j ftvsofifi ry^j sort-
1-00 - 2-00
2-00 - 5-00
7/(53 SGftoOxJOUl JXX|jC>: jO SjjQj>r1COtl cjD^J^eOvOtSV
SOSUTlC
g
*
15
03
9-30 - 1C-0C :
33jri_j trauotfad oddacjjfiocJjd^ dauaSuadF JXJfto
SoOfJo
10-00-11-15
(*>o3Co
33FS •
JrJVu •
dCddyOdd 3a3da3$
:
dduodd ■
11-15 -11-30 :
3oOvJT?3$ 33u
{;0ViJ*
11»3G- 1-CO
:
3t
1- CC—2-CC
:
3da<H3a OdaSd-
2-CC — 5-CC
:
cTaUaddadF 004O vDOOUf
*
3033jc^ OduaC-ddOt Jf-d •
16<gg 03
1C-CC — 1-CO :
dauadja3F &jJw33j< 3i*'3 cJ'J doJdaOCjd
tfdrarttf cidodja?_rt •
1-CC-2.CC
:
ftuatdda odadu-
2- 00-5-0C
:
1
da^jaed
-
da3\J7)OF
>
3?3U3 J^CxjiClp, o>3dC)<jcJ'. ■U..
*aCl
rt'u-j da Oda o-“jr>VSvJ4 ?ji
*iaO3<J3
.CJ-^gV
oc.3 —
33f •
#
17Se 03
9-30 — 1C-CC :
1C•Ct -11•3C
:
?r
.*6
£O^xJT) OvJ •
cort33c)GoJj:‘'„ CzfkroeOg rtadJc)
11-31 -1- CO :
,;.
*
rtjOpUOjJ
1• CC - 2-Ct :
<Jkra<tK3 a-craoj-
2-CC - 3-15
:
slaoJjoOOrt ^jciOvja
3-15—3-3C
:
Dsjodjd tn
* n dar.u (ojodcjoo
3- 3C-5-CC
:
*,
daoOjoOOf
:
u>£ daOd
^3 ^c?ad udv3ad3 dji’dfl, vauva'j?'
*
StSOVJ-
yC'J-
3^3o3 >~h>c>-
cajo,3j sPJi©?? edad-
darivja
183c 03
1C-C0- X.CC
y3 '-'rlaOv.
hVj
*
3o?j
i-CC —2-CC
2-CC -4-30
,
doOvjaOOurJdv^ o^daecirij
"tadda cS3dci
3Cj
*
•
<pda?_"33a 0‘daOij-
:
*
a
ljcjuj darkre
-rtad 3-jardo
*
cJrtn daoduoOOrt
19fle 03
9-30—1C-C0
:
odieO
S<oct»drjm ncrS'Jdd'i dadua Sno3 3r"iriV3d<
<vL 005" *
1C-CC-11 • se
darlda 3030 3dJfi^3*od\jv)d^
3^w<5(
ll -3C-1-CC
1• CC —2-CC
?)da«.ci?Ja odadj-
2- CC -3-15
303(^3ad 3C.03 DC
*
i
?’v^33dc^ SdaedOFjdv^
6
2-CC - 3-15
<vC0)^> U',’*
-
:
3'15 — 3-30
3-30 - 5-CO
saaaad n<5
claGi? fXOS OlGOd Ji'e.rS • ■
:
2Ci5e> os
9-30 - 1C.-CC :
v?a
daacc wasin'J aadoaddeft•
1C-C0- 11-15’:,
Sa*>0.^
.?
a^aaO'pdadUyOol.'vJo •
11115-11-30
:■
11.-30-1- CO
:
1 •(.(. —2 -CO
:
2-Cl - 3-30'
:
■3-30—5-00
:
SjjoJo-
daaodJOOOJJO.-W •
: ■.5jvA',?rO>r>.j.,i .'.aaod
,
*
(.Kr^T^A
tTs 5c?<V„'a •
ctor a —
213<C .OS.
9-30 - 1C-CC :
•
**
£,$
Cla-jOJaada-
10-00-11-3C
:
11•30- 1•CO
:
oaaco 6vTu<o
sfriu-jjaSo£$<_0 ikracri Of’ritjOjjO cra_^jra oockraasoaS-
1- 00-^2-00
:
S
*
ikrac.a
2-CC -3-15
:
acraao •
SaaoSodJod aouariad vaoJjSriVo-
-
rrzijvo;^
On_»'
tfacUradKS
riOrSoc Saae,rt-
3-15-3-30
:
t.’fj 0 {• N
3-3C—5-00
:
rJr. pjN
r-'dUOOU •
dUUCdOiJ^OCJUO:/dO *
22i?r On
10 -CO -11.-15 :
•11-15-11-30
11
-3C-1-CC
a'o'.j uojd ftoacd doc’driVu-
rjasuar {Sac
:
-u
:
<i< 'rjO auoododOioduo'jdo •
l-CC
—2-OC
:
yoaoad DCcJda-.
2-OC
-3-30
:
5ua<ri ckxjfWrt ffadnrt'j'j -darioa
3-30 -5-00’
:
r^o7‘auodvr',J„ aOdjoa u.% oSf-
9- 30— 11-30
:
dVdrrtodadUoi nodojso-.rj — joo'/j ac.w
*
1 1 -30 - 1 -00
:
3aaS cra^uaS
I- CO - 2'00
:
'5)Ot.< Lin adaaiu1
■.
Sana da-jdc Ooro.j
*
SfrStJUa-C'S
tfaodooDOrt o^w-
2onQ, OS
2
-CO - 3-30 :
I
%rfVMo.;
ijao
rtatiaOsacda-
3-30—5-OC
:
3aaS
otft' aacfi-
dariaa dCdnfloaa Oc^'-ra ?30jd
9-30 -11«3l
11-30-1-00
eort33a0 — uau3aarttfy„
1 -CO -2-00
&aae.«3 acradj-
2-CO —5-CC
3ua£ da^jaJ.
oaoJjoOd Jkra$o3jc)m fitfdortocU
aaraua®25i5< D3
9-30 —10-00
10-00-11.30
SjacW aP^d^ o'ladd dodoaOv—
rjorlsSJat>oJjo„
0O0SJ4 So^pkjaft-
11-30- 1-CO
orur’iojj 'a^aSritfa dodo^ aort ajat/odad a3u303
I
1- 00-2-CO
6jag.aaa odadj-
2-CO - 5-CC
ScW d-jad Srrat-iFrS'jorS djadd
G"iadd3u<
doduaoft26?5q, 03
10-00 -1-00
UftxJT)$ CjDFi'Jc)
1-CO - 2.00
^kJDQ^OjoJ 0
Mra-
0
*
OCTdcJU
2-00 -3-15
rjf3n5
gjUTic^F
<5\JoU_p
add 3o3<7 C'5.5#
3-15 -3-30
clc)C‘J
*
3•30 -5•00
<3o5c3 tJvJcJJjF
c3\JCaJ_p
*
HKW dOc 0 '-5,3
2 73g. 03
ajad-^ UjDoEJuj , djuaffriV
10-00 -11-15
Avacrt u^o'rbu'jadu^avoOj oaau^FSoouoiOci a3j
akraruaS;11-15 -11-30
11-30- 1-00
■_jj 0
aaoodu •
O^idi
SvTOoj
Sre.'3
#'jaVdv>a®odj
*
ajOcjcSfij
(
SjjaffrlV
oaaj^F5oJjaj<i. w$_,avjar'ja#
(daaoajdoo j a
1.00 -2-CO
2-00 -3-30
fwacwfa atfaak).
rid&u, sVadj ( uuOqoOl. , ScMKraVa^aftodj
du-jafiridj
as_, auatja#
(ajjotfjaoooajpjM)
3-3C- 5-00
cfcJitfatf^ duadtJSilv ad<5F-
28 Se, 03
10-00 -1-00
tfa^tjiaav KdaacrSe
1 -CO - 2-00
jp^ja<£2FJe> aoadj-
2 • CO — 5 • 0'0
dud a^j — r^oi^auodjft^.
o^aa catfScod,^ctJ-
?JwaacSjd sjfln dflF-
29 &, 03
•
10-00 -11-30
c?3cpa3r1 Vu
1 ooO'jrVJoVrOddVu,
O
ztaj3rit>fl aa;5,j •
11-30 -1-00
1-00
ajaaS^oou *
1^^^00030^
•
*_ra^.O30a^
c/\dO'5
-2-00
:
^ro<?33a acra3j-
2-00 - 3-30
:
0dH33c>eoJjJ„ e'tad Setaij'Frt3J<<■.tta3<>j3<J
3•30• - 5-00
. :
3»ja cua * •
fijao&oJvrau 3<j!pF- > ' ■
• .
_,
•ppepc e>s"5epi
:
(pp&rcpoopppoppp) p,?,ppeppPp pj^pop
:
00 •T - 0E - IT
0E- IT - SV n
ppep
:
•P3PVPJO
—
P^PPdpC
—
p^pppp
-
00’2 - 00-I
p^ppepppp pjppop
:
GVH - 00
01
*
•ppeppo?ep
':
01
*
00
- 0E
6
*
£0 “StfEE
• p's eppp
;
"S
*
00
•scopepp pqj
eppep Saepoepp pepp ^poe^n q^(? q"?q
:
OE-E - 00
* 2
• rpcpc pn'sepp
:
* 2 - 00
00
*
T
(PfZ-’nrpoopnpcrrp) jcppepp po^cppep ^.jepcepp jepr; ftpoe^^o
Q-?
:
•rporpp p?epp
:
OE-TT - ST
*
IT
•SPPjepp pnj
eppep jjcjiiponpc, gen? ^poe^ie
q"J(j
:
*
ST
IT - 00
* ’0T
- 0£
E
*
- 0E
*
IT
1
*
00
>S¥2E
• cX) p^p^cpswaeppopoj) ■
?pppopp eppep >pp^p,re?p “pprpr23opoe^
:
5
*
00
- OE-E
ppep
:
S
*
OE
- ST
£
*
• q'Sq p^p;aGP^WS<>ppopM
Fpppopp eppep f’ppfip'^fp “pppp'Tijppoe^
:
ST-E - 00
2
*
• ppepc pr’Sepi
:
2
*
00
- 00
*
I
• ipppppop’ Fc«ppo5cppwppe?)
ppocpeepp “pppo^TSeppo pc^coers rpnpp
:
1
*
00
- OE-TT
ppop; p p?epp . :
*
08
TT- ST
*
TT
' "v’.
• • j yppp^op ^ppppc.^ Pppq?ppeA
ppocppppp “pppoyp"Seppo yepp pen rpopP
:
TT*
ST
pp-ippcJep
{
00-0T — 0£
6
*
0T
*
00
^'J1 JirTEi
• Pf\prp'S,^ ^popCPP'SPP^p ppoeprppp
psu rpoeppcpp
:
:
poa£r,?c_p
—
SpSePfjr,
—
utx? jpeppenep
—
PAPrg7)£ pposcpp<j>ppei
;
*
* S - 0£
00
£
*
£
*
0£
- ST
£
*
ppoeppppp
:
£
*
ST
-
ppcpp P.p"Scp^
:
2
*
00
- 00 * T
(pptpppoopnpcppp) rpep pppojt'2
jppoe« po-pppco “/pposcppipppe-d ppoeppppp
:
*
00
T - 0£
*
nr:
:
0£ * TT -ST
TT
*
rpep pppoag^jppoe^
Qtpppoa “ppposppp'pppei^ ppoeppppp
:
*
ST
TT —00
0T
*
2 appepppp
:
00-0T - 0£
6
*
2
*
00
TI
PQ T'tfOE
0^5 »pppp §pppropptA ppocppnpp
I
~~ ■
-*■
*U
: j“dcvfi V\.‘
3
..L- . ’
- -_
30 — 5. *00 .
.,
*
?Sc)i|$(3rivu,
?
oSOcjvF
:
3o3 ftc.<3
33007)3 OC$
343c, 03
10.-00 - 11
15
*
15
*
11
- 11
30
*
:
30
*
11
- 1.
*
00 :
ao3 $c.t3 (dooododooooodfto)
*
i.
00 - 2
*
00 :
Cose. 33 adado
*
2
00 - 5
*
00 :
do3rttf
(4c3j doddFd)
353c, 03
9;* 30 - 10
00
*
7
3o&tf7) 30033 333<j3d„ 37)300 dUOdtJuritfdOej
COOSidOdO^, 5507)337)0 ^OOOOF)7?FOOOO 37)3^ •■
- 11
15
*
00
*
10
10
11
3
*
5-11
11 *
30
:
- 1 • 00 :
00 - 2,
*
00 :
2■ 00 - 5
00
*
:
1*
3 a ^OdO7)3O 37)300 37)j JF 3
rlot'o
Oo&tfa dood'? 0S3odo„ 3od-oa dModt3Sd)?3o<i'
doa&dodd^ uo33^DG ^aoooFSSFodod dadj,*.■_«,
3oac.33 acfi? 3o
*
A
3o4«7) dOOdsJodOdO^ Scj 003303S (35f)
,
*
363c, 03
00
*
10
— 1,
*
00 :
doAtfa 3ood^o0o 3$oow3o<£ dopo'o^S
.
*
aoadOT-oo (33f( dodOj Cosco *
„<)
" “
1 * 00 — 2? 00 : 'kjae.aS atfado
*
*
2
00 — 5
*
CO :
3ooCs? 3SoOo3o^, do^doaS
*
’
t
tf7),
*
3o
adaFCo
(floaco SmC.)
-
373e, 03
10,.CO - 11
30:
*
30
*
11
- 1*
*
1,
*
CO - 2
C3fi,_roc0^0o3
3j0l>f3 zjdu 3jc.Vr ofijc>e.u
rtVj ctartju 33J
)
*
3jcS3F3d
3cWttc>ocfj
yerioasjaSoJjSjQ
sojjodoJo trad,j3Qdj3J<i
0030303 atta3riV u3n 33f*
CO :
CO
:
2,: CO - 9
*
15 :
*
3
15 - 3
*
30 :
*
3
30- 5.
* 00
:
383c, 03
30
*
9
trou3oe.Vtvo3n odoae.23303)30
30003033. 37)ijl3d'7 3^03F3
*
c?ort337)0 tfaoJoFSSF—
:
$o3e.&3 acroOo.
*
nloJU'JCtt) OvJsJ
cJkJt^C.^
d $ c? ?r 0 nJuJOOUU •
*O3C.m^0 07)307) 330037)030 &<D;
,7
- 10
00
*
:
utc) ^OCt^DdU
1C-CC - 11.
*
15 :
r
Soz^TjSd <37>rto<) 33«o07)OdO B£(n33O^ 3f3ut3037)d
3 $33<j>riVo
*
16
*
11
- 1,1,
* 30 :
33O0d7)0JO GC.Srt'3'O
*
30
*
11
- *1.
*
00
*
l.
-
00 ;
2 * 00 :
*
2 * CO - 5
CO
Sotjct^O cJariOT) 33ood7)oOo B^ra&.dfioOOdcSotJab
c5 $ e5 J? rl \Aj. *
*
*
DCtBcjO
:
003337)0. StioJof^Sf 330037)030#
*
3e.3jr>70
*
:
SO3craa3F3
3C.3fie_^0
393q, a3
*
9,
30 — 10
00
*
1C‘CC - 1*
CO :
C_<-4^tcJrlcJD cJO^vXJCt'DO'JvJ
*Sy
#c)OO\JF
dv)
ritfskJci doyJaoa? dodo, ofloaefidoaS’
1’00—2’00: floae.tJKTD a eta du1
■
f
JkjaOM^d
dflOddNUti OdFOdUO^’
2’CO —5’00
*
40fl^ 03
9’30 —10’00:
dudCaddFS’
IC.’OC— 1-CO:
3 d^FS^od SCSo ■sckJd dj?
V
*
Odod urtn daodjoOOfl M"’
StfdrofloOjdUo!. dotda
1«CC— 2-cc:
$ja<ada aoadj’
2’00—5’00 :
aa/'d^dra daad^dxjdvj — dud adj ^da^O’
41fl< 03
9’30 —10’00:
*
aa^oJaado
IC.-OC —11-3C: dduudaodu afriSj Suo) ozjoojrtvo
*
11-30—1-CO : dduurraodo 34rS
*
00
1-
— 2-00 : ^uatada acradu-
00
2-
—4-OC
flua) doSe.3r!V3j<i dodjaOdua#’
: du&flcJuOfl u^FS rtarija daduaSi? ^aoJuFSjdurK'u-
4.-0C — 5-CC : dud adj •
423g, 03
—11’30: cofl nfle.0. u^da iro^os;rtVdm dn>n crjOdaodJ ara3odu3J<i
flfloduuaS1
11’30—1’00
: aa^os^ e^da wofl ??fle.Ofi doddFd’
00
*
10
I-CO—2’00
: flaatKda acradj-
2.CO —5’CC
: donradjtfaoodjao duflodudJej oyaododod uc.3 (3flr)
43flg, 03
9’30—IC’Ct : 3dflc.O *
£.03,33^
dod^flaa^doo?’
10’CO—11’15 : doflodo dadadcraddo^ dJdodaoo'ja
*
^a da c\jd v •
idadja flidjFysddo^
11’15—11’30 : dddpS urtn tJatkj’
30
*
11
1’CC
: dufloOxj da3ad0n?33Oc^ dutjodjaduc)?? cladda fl^doFu^ddu^
^adaCjaS’
1
1 ’00 —2’00
2-00—3’15
: fldaodda adadj
*
c0^ac.3£r5d dadaddraddo^ odOdodd^ ddjjrraooj
:
3 3ad_j •
15-3
3-
’30
3’30-5’00
: dado
: 5xjujou3dm aataFOddu^ 3fido&jaVOtfd)dddm doflodj dad^»
44fle, D,d
10’00-11’15 •
sj3
ruO2Ja
U’15-11-30 : cu
11’30-1 ’00 : £3 doan>$ &5ra (ajjodjdoodjjsjtkj)
1-CO -2-00
■ fldaQ,bid0 OOado•
2-00 -5-00
: addosra^
aaddrivo dadja 3ofle.drtV3J4 doddaoS
45fle, 03
10’00 —1,’C0 : **
advAjdaodo
ojujod ofljataflockj urtn OVjdr?S?
.. ae.cud0m aadddtf tAidofljaori (fkja<'u‘ 5„e.)
•*
* w
’’ ■• d-j du?-
»•
1 '.
2«CC ■—Cc ’
e
rJt(Jv.
'x6 $(; 03
IC-OC-l-CC :
3D<roc.^oJu33t3Jr%jU
1-CC - 2-CC :
fi3ae.a:3a a era do. •
2-CO - 5-CC :
3ao3c?q doa&aododo^. ySFdoadoov dadoa o(?5F
odofi oexoa?-
4
03
IC-OC-l-OC :
1. co -2•CC :
jj<)u3q?.V33j<. 3300000?-
2- CC- 5-OC
jjaufioctf CdoooOodoodooatSo)
*><
48c
!
Cj37} oc^o3o*
«-
03
9-3C -1C-CC :
003dB03FS-
IC-CC—11-15 :
3UJ5iJ5nV3J<i 303300 00.33333000304 OOjfjat333^)0
3yjarj3cj„ «od33aa tfc'OOjFTjSFojjtf Sc>3j-
11-15 -11-3C:
3a co
11-3C- 1• CC : cS’-.uS’.lvrtv'Suj 30y!-53uj e>orf339G>ocJj3J^ oJj|<ra<c«3
330 3jt)i\j3J„ C0rtr53afj 3aO5UFSSFO3j5 333,.
33a3v).
1-CC-2.CC
:
2.-CC - 5-CC 7 oort33aeo3j3xj<i 3Jcs^3Cjai<?3o-y3j (oysgS)
493e, 03
1C-CC-11 -15 :
3a3jfijcC.?3o.> sfoo-juaSj 3t>3c>_»3u 3vjaL\ja# 3<>3ua
030303?-
11-15 -11-31:
3 d $03vJ<) 3u
11-3C -1; CC:
3a a jo, rW3o<i stoOvKja? 3a3a_,3j Joatoa? dartua
030303? (3UJ0CO30O0UJ<-J3j)
1-CC - 2-CC :
^jae.w3a aoaaj.-
2-CC —5-CC
:
— 3<5jOV3’Jc^
cjAoOuOOv•
5C'3k, 03
9-3C —IC-CC :
3 o' ^}O3\_TS 3u •
10,.CO-11.-15 :
<so033acoddaaJddV 03Fdfc-
11.15-11.30 :
33Ck>
11•3G-1 • CO :
1- CC—2. CC :
2- CC—5-CC :
oort33aBodj>'„ d3aj53'7
&33e.w3a 03330
oofsA
( 3ododo30oddd^jcko
C3D03a3V3j< ydF doaCdaS-
513^ 03
IC-C'O-l-CC :
4,^30333 330 00303 00Dod030^ OdF0d3LJU0
033003030^ m3o50a?.n000?'
1-CC-2.CC :
2-CC-5-CCC 7
ikratada 03300.
52 Sc, 03
ic-cc -i-cc 7
S_,i003A? 330 ( 3030? 333000304 y3fr 303000?A<-3_,
daOdOF?^ 0033F33F0.
1• CO- 2 - 00 :
yO0C.30a 00300-
2; CO -5-CC :
•3c.3, 3aodoF?4 fie.33d
030jrtV3O,t oodooft-
aaddritfo darioa •add
1
13
I'
i.:'
• |
533c 030ocl
j lTsojjf (oo3337)C3Vu„)
663< 033333
6 73c 03
j
10-00 - 1-00
1 • 00 - d-00
gjUo^C^c)•
c8<$a acnjJj-
2- 00 - 3-15
33-15 - 3-30
33o0d7>odo ne.8StfurfiodO 330dj 0^3 ( 300030300 JOdcjCkjj
3-30 - f •00
!
0 OvKjf"
683< 03
10-00 - 11-15
330rt_, acto3 <300Od03Ood00g/)0)
11-15- 11-30
330037)030 acS
11-30 - 1 • 00
1 • CO - 2- 00
3303, ad7>3 (3joddu30oJjJ7Xjj)
odcdd-
3303_> 007)3 ( 300Od03Ood00-jdo)
2 • 00 - 3-15
3-15
- 3-30
v-tc) .$OOvTt) gSU •
3-30
- 5-CO
ddjrtj od7)3 (djjodjdoodjj-jdj)
693c, 03
Nc^UrlJ
10-00 - 11-15
11-15 - 11 -30
11-30 - 1
-CO
:
u)^Tc)o5
cu
33j3j 0ijn)3 ( 3jjoc1 JdooorJjJ)
1 • OC - 2-00
2- OC - 5-00 :
o)CjO'75\J
*
33j3j ltju atfi)3 oojdCJ'dd <u>oJjF<jdJC5d„
<borS33c>& rDoJjFtfSF
d-jsoJjaodoort
Cj'dci
•
70(\)\_ Oc5
•
10-00 - 1 -CO :
003337)3 l3)o0jf?;_;3j3^ ej3n o3v_rogtt3
1- .00 - 2-00
2 • Cb - 3-15
3j7)c.337) acfodj-
3- 15 - 3-30
3 • 30 - 5; CO
rxJc5vXJT)J
3d7)odJSoJj &vro3
aoaotf-
o
jJC-djcT^cSS 3’Udo 3ouo^ (djjoOjdOoOjjrjdj)
713g, 03
10-00 - 1-00
^g.3^Cd„3Udjcr?3 33<J3{3VJ-
1 • CO - 2-CO
(pkTcX^cucJc)
2- CO - 5-00
Sdig.'SodJ
g)CTc)g5J#
3vTOd3 •
72 3e, 03
10-00 - 1 -OC
3'Jdg.3oJj
1 • CO - 2-00
0O?)<<337)
2 . co - 5-00
od3<a 300oa_,odo 3307)dou-
3<J7)33
*7)3000
Prioritising Nutrition in the Health Department
Attitudinal changes towards the AWW
The local level Health staff will have to accord greater respect for the AWW She should not
be treated just as a poorly paid, inadequately trained ordinary village women Or be seen as merely
fulfilling the non-clinical responsibilities for a measly payment from the Health Department but as an
important ally with an intimate knowledge of local realities. Recognition that the very achievement
of lower 1MR & CMR is related to lowering malnutrition levels including mild & moderate levels
Today the PHC Doctors are largely involved in curative care, including theii pi ivale piactice,
and have little time or interest for public health concerns Such indifference needs to be changed by
motivating them to work as a member of a I earn (including ANM, LH V, AWW Supervisors and the
CDPO). Sector level meetings with the ICDS system need to be given greater emphasis From the
taluk, District and the State there will have to be greater expectation that the PHC Doctor give
attention to nutrition related activities. The earlier indifferent attitude is a legacy of the past when
for many decades Health Department was only preoccupied with Sterilisation activities In recent
years immunisation has been given prominence
But given the present determination of the
Government and of the top State Health functionaries, we are confident that the scope of the PHC
system will be widened to include Nutrition.
Measles Immunisation
Measles Immunisation Campaigns in Northern Districts if significant improvements of regular
coverage do not happen in the first year. (Given the continued shortage of over 100 ANMs possibly
upto even the year 2004 in Gulbarga District, two pulse campaigns in the pre-epidemic phase may
be required every year).
Detecting malnutrition in pre-school children not functionally covered by the AWW system (ie ,
children who do not come to the centre for regular feeding, particularly targeting identifying
unreached hamlets, left out thandas, scattered field huts)
Strengthening ICDS- Health Department linkages
This is not a new idea. This has been a concern for many years. In the initial years of the
ICDS-eighties there were links between a few Medical Colleges and the ICDS Projects Though in
the early nineties there has been a massive expansion of ICDS all over Karnataka, relatively little
effort had gone into building ICDS-Health partnership A major difficulty had been the disinterest
ofthe Health Department. Nutrition was seen as the piimary responsibility of the Women & Child
Department. For instance, in some years not even Iron and Vitamin-A was procured by the I lealth
Dept. Another obstacle has been the limited number of Supervisors in the ICDS
In Northern
Districts barely 10% of the positions are filled. Thus even the recent efforts taken by the senior
Health functionaries to organise joint training of the ANMs with Supervisors have little impact at the
District level. Fortunately, these limitations will no longer be a significant problem with Nutrition
becoming a priority within the Health Department and with the commitment of the WCD to recruit
Supervisors. Another welcome development is the initiation of the Border District Cluster Project
in selected areas of the Northern four Districts where there is increased interaction between the two
Departmentsand UNICEF. Positive lessons from this initiative which has just began to function will
inform the proposed partnership in this Project.
Ideally such a partnership will have to be built at all levels- from the Sector level at the PI 1C,
to the taluk, District and the State levels.
The following mechanisms will be adopted for
strengthening existing links and broadening the areas of cooperation
1.
Joint training of AWW, ANM along with TBAs and SHGs
2.
Joint communication endeavours
3.
Joint responsibility for identifying severe malnutrition and rehabilitation
4.
Joint house visits; updating records of children and pregnant women, and reaching out to the
unreached. Reaching the unreached includes- Out of school children- particularly adolescent
girls, and pre-school children of the urban poor, tribals, remote hamlets, garden houses and
where acuteupper caste-Dalit conflicts exists-Dalits. Note in so many ways in KarnatakaDalit, tribal children are less privileged- nutritional status, immunisation coverage, school
enrollment.
5.
Regular review meetings at the Taluk and District level
6.
Quarterly Meetings at the CEO level at the District to overcome persistent problems which
hinder cooperation.
Enhancing the credibility of routine data
Enhancing the credibility of routinely reported data from the Pl 1C such as pregnancies, bit ths,
infant deaths, immunisation, and child deaths. Non or Under-reporting particularly of infant deaths
needs to be be virtually eliminated. Annual check ups done randomly at the PHC level by a Project
Supervisory team will assist in making the system more responsive. One component of this project
is a pilot initiative to ensure complete registration. Lessons from this pilot will also help in improving
the completeness of vital events reporting in other parts of the State
Regular feedback on the monthly reports from the Taluk and District level downwards to the
PHC level should be ensured. Today, there is enormous pressure from the top to lower levels to fix
achievements. Any number of examples can be given. If the quality of health system data improves
it will have a salutary impact on the ICDS system also. Thus dependable data flow will have
cascading benefits even outside the Health Dept.
March 14. 2001
Sabu George
NUTRITION DETAILS-FIKST PAR I
Dear Thelma
Enclosed are write ups on the following sections
I.
Building Nutrition Competence
2.
Weaning food Strategies
3.
Educational Messages
4.
Sensitisation Workshops
5.
Communication Strategies
6.
Nutrition becoming a priority of Health Department by
Attitudinal changes
Strengthening Inter-Sectoral coordination between Health & ICDS
Enhancing the credibility of routinely reported data from the PHC
PLEASE NOTE: The outline provided for messages is only indicative
For instance educational
messages are many but a few are mentioned which are considered important Unless this is attempted
it is not possible to motivate a consensus. This has to be limited to few essential messages
It is
important that messages need to be consistent at various levels (mothers, set vice piovideis and
decision makers) and be identical in the different channels used lot communication Clarity on the
number and kind of messages will also help us to finalise the content of our “Nutrition education
package”. The focus on a few key items will help the Project to monitor changes in knowledge and
practices in the communities and give feedback relatively quickly about the inadequacies of the
training, outreach strategies and/or their implementation
Likewise, elements of Nutrition sensitisation workshop are outlined so that criticism of the
content, format and the likely expectations of this exercise becomes easier. The content might appear
simplistic but even at the CDPO level in the North, the understandingof knowledge & practice of
basic Nutrition is limited. This is not a reflection of the individuals but of a system which essentially
sees delivering food as a solution to malnutrition
The preoccupation with the logistics of food.
multiple number of schemes, a virtual absence of Supervisory level stall’, and several days of routine
meetings leave little time for innovative thinking let alone action
(Deliberately, these parts are not integrated into the already accepted (. 'hapter-7 into a bulky
document so that everybody knows what are the newly written parts and has a preliminary chance
to make comments and changes without having to go through all uhal has been agreed upon).
Printed in double space to give adequate space for comments.
Weaning food Intci'vciition (Section-7 2.3 c, p59 & 8 3 1, p65)
This is a significant activity which addresses the inadequate intake of complementary foods
in the age group 6 to 23 months. Note that there has hardly been any improvement in this practice
in Karnataka over the 6 years between NH IS 1 & 2.
The strategies are different for the 7 backward Districts and the rest of the State. For the rest
of the state only complementary food demonstrations will take place Funds will be provided for the
materials and organisation of the demonstations. The communities themselves will have to procure
food at their cost for the routine feeding
In each Taluk, every year 100 demonstrations will be
organised (an average of 8 per month). A resource manual for organisation of the Demonstration will
be prepared in consultation with Ms Padmasini, CFTRI & FN13, Bangalore
The successful
experience of CARE in Andhra where weaning food is prepared and sold in an entire taluk by
women’s groups will be studied and tried out as a pilot initiative
In the backward districts, weaning food for the age group 6 months to 17 months will be
initially supplied by the Project Every two weeks the ration will be provided to the mother at the
Anganwadi in a glass bottle. Each cliild will be provided food till the completion of 23 months of age
The cereal used will be ragi or jowar or wheat and the prepararation based on the recipe of
Padmasini’s. All children, including those not under the ICDS will be eventually covered In the first
year allocation is made so that an extra 10% more is covered Every subsequent year an additional
number of children as estimated by the local AWW will be covered. This weaning food will be
procured at the District level by tendering. Provision of weaning food is a convenient strategy to
reach out to individual mothers and to enhance the quality and quantity of complementary feeding
and motivating mothers to continue breastfeeding at least till two years
NUTRITION Messages
THEMES
Significance of Nutrition (maternal, fetal & adolescence). Complementary feeding. Hygiene
& Sanitation, Apt illness care and Breast feeding -
1.
Good Nutrition and care during the cliildhood particularly, in the first two years ensures optimal
growth and development of children.
2.
Home based traditional foods modified to a thick semi-solid consistency are good for the baby.
Baby needs all foods from six months viz, cereals, pulses, vegetables, particularly green leafy
vegetables, fruits, milk and milk products, oil, jaggery/sugar and if possible egg
3.
The baby from six months needs adequate and frequent feeding to meet the increasing demands
of growth. A one year old infant needs about half the amount of food that the mother eats
4.
Personal hygiene, food hygiene and environmental sanitation are essential for providing safe food
to the baby and protecting the baby from infections
5.
Seeking timely medical care for illness is important for keeping the baby healthy
6.
Good nutrition and health of adolescent girls even before pregnancy is important for the health
of the future generation
7.
Nutrition, Health & Education of the girl child deserve extra attention
8.
Good nutrition, health care and family support during pregnancy ensure the health of the mother
and the baby.
9.
Mother’s milk is best for the baby and it is all that the baby needs for the first six months of life.
Start breastfeeding immediately after birth to ensure feeding of Colustrum (mother’s first milk).
10.
Start complementary feeding at six months A growing baby needs other foods also besides
breast milk to meet the increasing needs But breastfeeding should continue upto two years
Null ition Competence (7.2.3- Nutrition Competence).
An outline of the elements (to be detailed after getting a consensus on this draft)
1.
Knowledge
Breast feeding (early initiation, preferably in the first hour, exclusive for 6 months and continue upto
2 years); Inadequate milk syndrome; Avoiding bottles;
Complementary feeding from 6 months to 23 months, feeding frequency; energy density, locally apt
foods, Measles immunisation, Vitamin-A drops every six months, Deworming-once a year,
Prophylaxix for iron deficiency anemia, Food handling. Environmental hygiene & sanitation; Dealing
with local food taboos; etc.,
2.
Practices
Dealing with diarrhea
Common illnesses (by SKK)
Use of drugs provided to AWW (by SKK)
Recognition of pallor by AWW for severe anemia and referral to the ANM
Bitot’s spots in children by AWW and referral to the Doctor
Apart from those related to items above,
3.
Ability to diagnose the immediate cause of malnutrition or growth faltering of a child and to
suggest practical steps to mothers to enhance growth and development Counseling skills need to
be strengthened.
4.
Communication abilities-
Particularly with officials, community leaders, elected representatives
5.
Weighing
Good weighing technique, safe handling of balances, Calibration at taluk level every 6 months
6.
Enhancing the quality and credibility of routinely reported information, particularly weights and
infant deaths (pregnancies, immunisation status of pregnant women and children) Ensuring adequate
coverage of all vulnerable children (if not why9) Rewards for locating severely malnourished children
(3 & 4 Grade), Incentives for AWW, ANM, Supervisors; even in the non-ICDS population in children
under 6 years of age. Regrettably today there are disincentives for reporting the true status A one
time amnesty is imperative for us to identify the high risk left outs The CDPOs and the PI 1C Doctors
will be given special orientation for the objective of this amnesty campaign Rewards will be given
to those who identify the maximum number of malnourished.
8. Categorisation of 80%+ as normals should stop Normals should only be those who are 90+ The
earlier cutoffs tend to minimise the seriousness of the malnutrition problem
Also a pait of the
potential improvements will also be not recognised (the proportion that will improve from 80-89
percent to 90+ over the project period).
9. Community based nutrition rehabilitation of severe malnutrition. Of course prevention is better
than rehabilitation. But for ethical reasons rehabilitation needs to be taken care for. In Karnataka
the greatest progress in nutrition has been the virtual disappearance of the most florid forms of severe
malnutrition like kwashiorkor. There have been halving of third grade Gomez children. But the fact
remains that the present levels are unacceptably high for any civilised society. Given the enormous
risk of mortality of the third Grade Gomez children we have to take care of them PI 1C Doctors,
ANMs, CDPOs need to oriented in this regard. A one day training should be organised at the PI IC
level. This will include the basic elements of Nutrition (as in sensitisation workshop) Emphasis on
the social aspects- getting the family and the community to have hope is essential to prevent relapse
Too often severe malnutrition is treated with expensive tonics and/or hospitalisation even when there
is no underlying medical problem, rather than with appropriate local foods; and patient feeding of an
apathetic child, whose parents have become desperate for a magic cure
The understanding of the
local cultural context which permits many kinds of quake remedies will facilitate better recover)' rates
Technical guidelines on rehabilitation will be distributed
Each case of severe malnutrition should
become the responsibility of the ANM and the ACDPO (if vacant then CDPO) be followed for upto
6/12 months (above 2 years/below 2) after improvement. Quarterly reviews of such cases including
a medical check and monthly weight profile need to reported to the District Nutrition Officer. To
ensure that any underlying medical problem is treated immediately a discretionary fund will be
provided to the CDPO to ensure speedy purchase of drugs (with the resurgence of drug resistant I B,
there has to be provision for pediatric dosages and a formal request has come from WCD) Also
there have been complaints from both the ICDS & Health from several Districts that there is no
adequate provision of funds for treatment at the local level
Vociferous demands for special wards at the taluk level, special staff for dealing with severe
malnutrition and even extra financial incentives for Doctors to treat malnutrition are strategies of
questionable effectiveness. Medicalisation of cases of severe malnutrition without any underlying
medical problem is not the solution
Apart from the fact that this will divert from the limited
resources presently available for prevention of malnutrition.
The Quantum of Training
Nutrition competence be achieved at different levels by:
1.
Orientation of District Nutrition Officers- First year: 2 weeks (1 week in the field) and later 2
days every year (Conducted by experienced Nutrition Consultants)
2.
Refresher Workshop for the District Assistant Directors & State Officials: 2 days ever,' year
(Conducted by experienced Nutrition Consultants)
3.
Upgradation of functioning Angawadi training institutions and N1PCCD: 1 week every year.
(Conducted by experienced Nutrition Consultants)
4.
Review with the CDPOs; 2 day workshop every year at the regional level in batches of 20.
Sensitisation Workshops for District Officers, I’anchayats,
Also Bklg Nutrition Capacity of existing women's groups (7.2.3 c)
Period- One day for Officers, Panchayats (One Workshop in every Taluk & at District level) And
repeated every year. For self-help Groups it will be 4 days in the first six months For SIIGDemonstration of weaning foods and organisation for food preparation will be carried out with the
Sensitisation Component. In groups of 20 women with up to 30 groups per taluk NOTE SI 1G
sensitisation is a major training endeavour and therefore may be organised by a NGO rather than by
the Department. If the Food preparation is separated from the Sensitisation, then the Sensitisation
part should be done by the Department- This will be a 2 day workshop rather than a 4 day. T he fust
review session will be held after 6 months and subsequent sessions will be held only once a year for
2 days each. The goal is to empower several hundred women in each taluk to make informed
decisions on nutrition, care and development of children These empowered women can serve as
nuclei for the formation of active community support groups which can assist the AWW and ANM
in their activities, especially in reaching out to those under two children who have been left out by
the AWW system. Note this is an alternate strategy rather than the ususal worker oriented and centre
based approach to better Nutrition & child development This would require much follow up and
enthusiasm on the pan of the District Nutrition Officer for this approach to be effective in a big way
at tiie District level. But the trouble is worth it as community involvement and ownership is high and
therefore the potential effectiveness can be greater than a Worker based in an Anganwadi
(Note: This is an outline-can be expanded after consensus)
Background & Goal
Tlie significance of Nutrition has hardly been understood by the decision makers For over 4
decades the entire administrative and development machinery was directed at achieving sterilisation
targets (after emergency solely on women) We need to have the same degree of enthusiasm for
Nutrition for Karnataka to achieve significant reduction in infant and child mortality over the next five
years. I have met an IAS CEO who wanted me to prescribe tonics as an intervention to ameliorate
malnutrition! The Raichur DC (again an IAS) did not even attend the recent Workshop on Nutrition
The sensitisation workshops will contribute to improved understanding of Nutrition which hopefully
will result in better growth and development of children
’ Content
Determinants of malnutrition (Care, Food related & Health related). Multi-dimensionality of the
nutrition is why it has not received priority of Health or other Departments The invisibility of the
malnutrition problem is itself a problem when it comes to raising societal aw areness As nearly 90%
of rural children are malnourished the societal perception is that poor nutritional status is natural
Severe malnutrition is only the tip of the “iceberg" Magnitude of malnutrition- Extent & Risk groups.
Functional Consequences of malnutrition. Poorer levels of nutritional status is directly related to
increased levels of child mortality. Consequences are inadequate, mental development and impaired
adult physical work capacity.
The relationship between improved child growth & survival to fertility. In all southern states there
has been a linear relationship between declining child mortality and fertility
Gender biases- Recognition of deliberate girl neglect as socially sanctioned violence; Intensification
of son preference in Karnataka
The proposed Nutrition Project highlights Prevention Strategies- Promotion of growth by avoidance
7
of growth faltering rather than rehabilitative, Strengthening existing good practices and modifying
harmful traditional (taboos)/ modern (bottles) practices
Existing Govt. Programmes-Taluk/District level procurement of weaning and AWW foods
Inter-sectoral coordination of Departments (ICDS, Health, Education) & Panchayats
Responsibilities of the Families and Communities to support and strengthen AWW etc
Involvement of NGOs, Self Help Groups
To have at least one mass event to highlight Nutrition in each Panchayat once a year.
Public recognition for one staff member in each Panchayat for exemplary contribution to improving
Nutrition.
Drawing Plan of actions (short and long term) including monitoring of inputs and assessment of the
adequacy of the interventions (quality, coverage, equity)
Periodic Follow up with a core group at each level- District, Taluk, Sector, Panchayat and village
To ensure quarterly reviews of specific components
Format
Interactive: Brief Presentations & Group discussions
Conducted by
District Nutrition Officer & Assistant Director with the CDPOs at the District and Taluk levels
At the Taluk level, the concerned AWW will also participate
Communication Strategics for the Project
Apart from direct personal communication between staff and Community:1.
Media (Radio, TV, films to be screened at village level)
2.
Local folk media groups, street theatre etc.
3.
Wall charts, posters, Counseling aids.
10
2. Wall writings, newsletters for AWW, SHG etc
3. Newspaper articles
4.
Unions & Associations of AWW & other Govt Staff
5.
Village level meetings at least once in a year organised by AWW, ANM etc
6.
Technical Guidelines for exclusive bf, apt complementary feeding. Nutrition rehabilitation,
adolescent girls and other focus areas to be distributed
Visit to Anganwadi Centres of ICDS
near Hanur of Kollegai Taluk.
The Anganwadi centre ofChamaraj Nagar District in Kollegai was visited on the 26th of March.
The main purpose was to observe the supplementary feeding programme in operation at the
Anganwadi the quantity served and the ability of the children to consume the served portion, as
well as the issues related to the preparation of the food. 1 am thankful to Dr. Sr. Aquinas and
Sr.Anice who welcomed us and made arrangements for me to visit the Centre during the
operation of the feeding programme. The Holy Cross Comprehensive Rural Health Project covers
this village which was visited, and they have women's groups, Self-help Groups and the women
trained under Women and Health Project.
The Village visited was K.Gundapura. This village has two Anganwadi centres and both the
centres were visited by me one at the time of the preparation of the food and serving of the same
to the children present. The other centre was visited to discuss with the worker her routine and
the support services available..This village comes under Basappana Dotti Panchyat.
Anganwadi 1 (Actually this is the second centre started after a lapse of some years after the first)
Anganwadi Worker
Helper
Smt Suguna
Smt Parvathi.
Though Sr.Anice and self reached the village at 10.30,giving time for the centre to start the
activities, the teacher had not turned up,but few of the children were there with vessels in their
hand clutched closely, to take the cooked food home.The children were moving and running and
the helper Parvathi was not able to manage or even start the programme with them, utilising the
time we enquired about the food that was cooked by the helper and the supply made to the centre.
In the meanwhile Smt Suguna arrived and she had some personal problems to reach on time from
about 3-4- km away. The information gathered from the teacher are as under.
The Food Supply:
The Centre is supplied with Bags of Poorvaka Ahara (Energy Food)
and Rice, The ready mix ahahra and the rice are to be served alternatively.
The lable on the bag reads that this was designed by CFTRI and the
composition of the Poorvaka Ahara is: Wheat, Groundnut cake ,Soy
Powder, Bengal gram dhall, Jaggery, with mineral mix and salt added. The
ratio with which these were mixed was not shown on the bag.This had
been produced by Agro-Kendra.
The nutrition Factor
100 g of this Ahara has 12-14 g Protein
and 350-380 Cal.
Rice is also supplied along with Palmolein Chillies Mustard salt.
-1Per month The following ration is supplied.
Poorvaka Ahahara 75 kg
Rice
oil palmolein
chillies (red)
Mustard
Salt
70 Kg.
3 pkts
1/2 kg
1/2 kg
2 kg.
The fuel supply was supposed to be the responsibility of the Panchayat
but this is not being met by the Panchayat.
Smt Suguna informed as that for some time she personally paid for the fuel and now
along with the ration 2 1/2 maunds of fuel is being supplied by the CDPO. Whether this
is the latest policy and not pursuade the Panchayat to take up the responsibility is not
clear
This monthly ration had been fixed based on the number to be fed.
No: of Children taken into account
No of pre-school Children 3-6yrs
1-3 yr children
below 2 yrs
Mothers Pregnant & lactating 8+4
Allowance of Food per head
Children
23
31
08
12/
Energy Food
80 g
Rice
60 g
Adults interestingly in this
category the worker and the
helper are included as additional
Energy Food
160 g
Rice
120
As per the number specified and the daily ration allowed
the food calculation comes to
Energy food required for 62 children and 14 adults per day comes to 7.200 kg
Per month of 24 days feeding days the Energy food requirement is for
12 days only (the other 12 days are for rice)
86.4 Kg
while the supply for these feeding days is in the order of
75.0 kg
Rice
As per the allowance of 60g the requirment per day
For 12 days Feeding programme
5.4 kg
64.8 kg
-3-
The shortage is not felt by the Worker as not all children attend the class every day and they can
easily adjust !.The design is to feed the children in the class and make them take the cooked food
for the sibling and another quantity if the mothers included. Mothers do not come to the centre
as they cannot and the children do take the food and some time the helper goes to the door
step and provides.
The actual observation of the children : Amongst the 20 and odd atleast 12 of them were
between 1-3 yrs and very few were the 3-6 yrs.Evidentally the mothers sent them to collect
the food. 1 was there when the rice bhath (rice chithra anna) was being prepared, rice
cooked and seasoned. Office had supplied new plates and glasses for the children to eat Yet
the children were clinging on to their vessel and eagerly waiting for the food to be served in the
vessel.The serving portion appeared to me as 40g of raw rice only.Even this portion was too
much for the children of 1-2 yrs. Children were advised to start eating after the serving and they
were pecking at the food perhaps keen in taking the food home.The teacher said that after serving
she would concentrate on record maintenance and children would ea by themselves Obviously
she does not find it necessary to observe them eating and the quantity they can consume. It is
the helper who gives the additional serving
The helper had prepared , according to her, 4 kg of rice for that particular day.
I requested the helper to prepare the laddu which she normally prepares with Energy food of the
quantity of 40 g (weighed from the store near by) The resultant product was in the size of cricket
ball. The taste was of mild sweet. The Workers informed that the mothers do not eat the energy
food and give it to the children when ever the child wanted at home. The mothers thought that
they could well if the centre supplied uncooked flour for them to make rotis, almost demanding
the supply of flour for the week. It is also doubtful whether the mothers do consume the rice or
again give it the children.
Suguna had maintained the records of supp;ly and it was upto 23rd of March.the following two
days were holidays. While we were observing the children we wanted her to teach and it was the
normal pattern of saying some rhymes and the children repeating.
Growth Charts of the children
A thick booklet had been supplied to the centre as per the
pattern ! doubt whether the purpose of the growth chart
had been explained to Anganwadi worker or not.lt
appeared like routine plotting of the reading. This centre
has no weighin scale but takes from the other one, which
is understandable.She first notes down the reading on a
notebook every month along with attendance. When time
permits she plotson the chart.She had no time to look at
the growth trend of the children.But this is done regularly
every month
I was aurprised to see the pencil marking on the chart. When I enquired the reason she said that
she was asked to do so so that these recording could be erased and make a clean chart for the new
entrant in the class. When I checked with the weight of the child and the child that was present
it was found that the child was a healthy child to start but constantly had been on the grade II
status. Suguna could not answer our question on as why the child lost the weight.She could only
-4-
say that the child was sick but now she was eating.. The growth Chart had no meaning for the
Anganwadi worker, as it really takes a lot of time and effort to weigh all the childrne with only
the helper to assist. The Children appeared to be anaemic and stunted growth could be seen in
some of the children. I could not stay there to see the quantity that the worker would be
distributing to the mothers, as it would mean spending another hour or two with the worker,
as mothers do not come to the centre.
There are many related issues to be discussed and this will be done after the report on the second
centre. In the meanwhile we met few of the women of the sangha and the expectant mother.
This discussion was too find out as to why the mothers rejected the Ahahar Mix. According to
the women the laddu is prepared with cold water and they would rather have the atta to be given
to prepare their own roti. I donot give much weightage to their remark as there would always
some complain or other but still whether this mix is suitable for the adults is to be questioned.
The name itself sugggests that it is weaning diet. Mothers keep their share and give it to the
children when ever they are hungry.This also means that the children do not get any whole some
food at home. Are we not defeating the purpose of feeding at the Institution ?
THE SECOND ANGANWADI CENTRE in the same village. Actually this is the original centre
and the first visited was started later, This centre is equipped with weighing scale and the teacher
is much more experienced.
Teacher
Nagalakskhmi
Helper
Gowramma
The attendance at the centre was not full as the day was after Ugadi.The children were very
cheerful and Nagalakshmi has good relationship with them Apart from the ration amout that the
centre gets it was a news to us that the PHC at Ramapura supplies the iron tabs to be given to
the children.The strip contained Folic acid and ferrous sulphate and the Vitamin A is in the form
of liquid and concentrated. The teacher regularly gives these to the children before the food is
served. I requested the teacher to weigh a child to see the calibrations and the method of
weighing.She has n hook to hang but some how manages., the children were fairly healthy
Nagalakshmi expressed full cooperation with the Healthe department. She is an expereinced
teacher and is confident about her work. When we returned to the first centre to observe the
children being served, Sr. Anice asked about the medicine supply. Then the teacher pulledout the
carton from the store. Obviously this is not being utilised by the teacher ..
There are many question that came as a result of this visit and these need to be discussed
carefully.The intention of the Government is quite obvious but lack of supervision and entire
dependence on the teacher need todiscussed.
CHILD HEALTH DEVELOPMENT AFTER ALMA ATA DECLARATION
P. CHANDRA *
Health development includes health care, essential non-specific measures like
nutrition, protected water supply, sanitation, education and economic development Primary
Health Care (PHC) is essential health care based on practical, scientifically sound and
socially acceptable methods. Community involvement, inter sectoral cooperation and
approaches to peripheralise health services are the three pillars on which PHC is being built
Implementing PHC successfully will improve health development. Human progress and
overall development lie in the progress of women and children and the realization of their
right. It should be realized that medicine of any sort plays a very minor role in improving the
health of the people- i.e their health is inextricably linked to under development and the
struggle against it. Problems of health development and under development are intimately
linked.
In the later half of last century important technological advances in medicine were
made. Vaccination against major diseases and therapy for infectious diseases and the
technical knowledge to prevent nutrition deprivation and diseases were available As a result
rapid decline in death rate has occurred. In spite of impressive progress in health picture, the
prevailing health and nutrition disparities were a cause for serious concern
Medical science realized that poverty related social conditions like poor sanitation and
housing were major causes of ill health Studies have shown that irrespective of medical
intervention health status improved remarkably when basic requirements of health were
available. The challenge was primarily a question of equal access to all. In 1978 for the first
time all the Governments of the world - DEMOCRACIES OR DICTATORSHIPS,
COMMUNISTS OR CAPITALISTS - accepted the principles of PHC officially and
promised to bring them into being in all nations within the next 22 years. This ALMA- ATA
DECLARATION did not accept that HEALTH FOR ALL is something that can just be
achieved. It accepted that HEALTH IS A FUNDAMENTAL HUMAN RIGHT It also
accepted that the gross inequalities in health status is unacceptable. It further declared that
people have the right and duty to participate individually and collectively in the planning and
implementation of their health care. HFA heralded the vision of a new and better future for
all human family.
India's commitment to universal health care precedes the Alma Ata Declaration by at
least three decades. The Bhore Committee report, which was Independent India's Charter on
Health, begins with the opening statement "No citizen should be denied an adequate quality
of health care merely because of his or her inability to pay for it". To fulfill her commitment
of Health For All, India evolved a National Health policy in 1983. To transfer all objectives
of Health For All, the policy laid down specific goals with quantifiable targets to be achieved.
This commitment did lead to some renewed attempt at achieving these goals India launched
Address given at the 38lh National Conference of Indian Academy of Pediatrics, Patna.
Bihar on 911' February 2001 for the Hony. Sure Cmde.Dr Shantilal C.Sheth Oration
Director (Rid. I. Institute of Social Pediatrics & Professor & Head Department of Pediatrics. Stanley Medical
College. Chcnnai-600 001.
ambitious campaigns for eradication of communicable diseases, infections and malnutrition.
Various policies and acts introduced earlier and later tried to augment augment efforts
(Table, i). The impact of all these interventions to improve health, particularly maternal and
child health has been large. Decline in vaccine preventable diseases and severe malnutrition
of this magnitudes have never been achieved in our setting and certainly not in an equivalent
period of time. Still there are disparities in health. So the achievements of the National Health
Policy needs critical analysis.
Table. i
Important Efforts Taken to Achieve Health For All
1977
1978
1979
1981
1983
1985
1992
1995
1996
WHO adopted the goal of Health For All by 2000 AD.
Re orientation of Medical Education (ROME) was launched
Parliament approved the Child Marriage Restraint (Amendment)
World Health Assembly endorsed the Declaration of Alma Ata on PHC
International water supply and sanitation decade 1981-1990.
The Air (Prevention and control of pollution) Act.
IMPACT India's action against avoidable disablement launched.
National Health Policy approved by parliament
A separate Department of Women and Child Development under the newly
created Ministry of Human Resource Development
Child Survival and Safe Motherhood Program (CSSM) launched.
The infant Milk Substitute, Feeding Bottles and Infant Foods Regulation
of Production, Supply and Distribution Act 1992.
ICDS renamed Integrated Mother and Child Development Services (IMCD)
Pulse Polio Immunization Launched.
Family planning program made target free.
Reproductive child health program introduced.
Pre natal Diagnostic technique (Regulation and Prevention of Misuse)
Act came into force from January 1996.
(Source Park's Text Book of PSM 15th edition page 609-610 1997)
PROGRESS IN MATERNAL AND CHILD HEALTH INDICATORS
Mortality rates and nutrition status are good indicators to measure the level of health
and nutrition care. This also helps in assessing the over all socioeconomic development.
A. Mortality in and around infancy.
1.
Perinatal mortality
Still births and deaths under the first week of life are combined in perinatal mortality.
because the factors responsible for these two types of deaths are often similar. Peri natal
mortality is not investigated like infant neonatal deaths. With declining infant mortality rate.
perinatal mortality is assuming importance as a yard stick of obstetric and pediatric care
before and around the time of birth. There is a wide variation in urban rural death rates. The
target is not achieved-the rate is 45/1000LB
TABLE, ii.
Peri-Natal Mortality Rate, 1981-1995
Urban
31.5
30.4
34.0
31.4
Year
1981
1985
1990
1995
Rural
58.6
52.4
51.7
48 0
Combined
54.6
48 1
48 4
45.0
Source: Sample Registration System, 1995
2.
Neonatal Mortality
Deaths occuring 28 days after birth is called neonatal mortality. Neonatal Mortality
contributes 50 to 55 % of IMR. Perinatal and neonatal deaths are largely the consequences of
inadequate and inappropriate care during pregnancy, during the crucial first few hours after
delivery. The causes of perinatal and neonatal mortality are multi factorial - Low Birth
Weight, Neo Natal Asphyxia, Birth Injury, Congenital Malformations and Infections. In India
Tetanus Neonatorum still accounts for neonatal deaths in some states. The rural rates are
almost double that of The high concentration in the early neo natal period suggests the need
to improve the maternal health
TABLE, iii
Neo-Natal Mortality Rate, 1981-1995
Year
1981
1985
1990
1995
Urban
38.5
33.3
30.9
29
Rural
75.6
66 6
57.4
52
Combined
69.9
60.1
52.5
48
Source: Sample Registration System, 1995
Infant Mortality
Deaths from birth to one year is called infant mortality. There was a decline in the eighties
and the decline is static in the last five years The decline is mainly due to medical care and
indicates that attempt needs to be addressed to endogenous and socio economic causes The
urban rural differences are obvious.ini 999 the urban rate was 44 and the rural was 74 being
much higher The low rates in urban areas are due to better medical care. The death among
girls is higher, indicating neglect of girl children. The current rate is unacceptably high. High
IMR is observed in infants born to very young and old mothers, Illiterate mothers, and those
with short birth spacing
TABLE, iv
Infant Mortality Rate, 1970-1999
Year
1970
1975
1980
1985
1990
1995
1999
Urban
90
84
63
59
50
48
44
Rural
136
151
124
107
86
80
75
Combined
129
140
114
97
80
74
70
Source: Sample Registration System, 1995,1999
Morbidity and Mortality Among Children
The common causes of illness are diarrhoel disorders, respirator.' infection and
malnutrition for the last two decades - vaccine preventable diseases registering a decline.
Severe malnutrition like kwashiorkor and blinding xerophtholmia have registered marked
reduction. Still under nutrition is highly prevalent 40 to 50% of under fives are
undernourished.
TABLE, v
Percentage of‘Severe and Moderate’ Forms of Malnutrition (1994)
State
Tamilnadu
Andhra
Kerala
Karnataka
Orissa
Madhya Pradesh
1-3 Years
Boys
33.4
52.7
25.9
55.2
53.2
67.3
3-5 Years
Boys
Girls
49.9
42.1
44.5
51.0
45.3
42.9
55.9
51.4
56.6
42.6
47.0
42.0
Girls
37.8
48.5
26.8
50.8
60.3
59.5
Source . National Nutrition Bureau, 1995
Anemia is prevalent among all the population in developing countries. Various estimates
*
reveal that the prevalence of anemia among different age groups varies from 50 to 90%.
>
4
TABLE, vi
Prevalence of Anaemia - Different Demographic Groups
Countries
Bangladesh
Bhutan
(1CN.1992)
India
(Seshadri.1996)
Maldives
(WEO.1996
Nepal
Pakistan
Pregnant
Women
(<llg/dl)
77
59
Prevalence of Anemia (%)
Lactating
Preschool
School
Women
Children
Children
(<llg/dl)
(<llg/dl)
(<llg/dl)
77
40-74
73
58
-
87
77-95
68
-
67
67
79
29-33
65-78
(<10g/dl)
Sri Lanka
39
45
Source : ROSA Publication No.5 UNICEF, SA November 1997
Adult
Women
(<12 g/dl)
70
-
50-90
-
82
62
-
68
68
58 _________
Adolescent Population:
20% of the population is adolescent age group. 90% of them are anemic. Under
nutrition and stunting and other illnesses are highly prevalent They are victims of child
labour, sexual assault and highly prone to drug addiction. Child population and women are
victims of silent emergency of malnutrition. 20 to25 % of births still occur among adolescent
girls with high incidence of complications and low birth weight.
Maternal Mortality
Matemal mortality is a neglected tragedy and is prevalent among the poor with the
least power and influence. India is one of the countries which has very high MMR.
According to SRS estimates, 1.1% of all deaths in the country in 1991 were due to maternal
causes. Based on these numbers, the estimated maternal deaths is 0.63/1000 women in the
reproductive age group of 14-44 or MMR of 3.4/1000 live births. Obstetric complications
like, bleeding of pregnancy and puerperium, abortion, toxemia, puerperial sepsis and
malposition are major causes. Non-obstetric causes particularly nutritional anemia accounts
for more than 30% of maternal deaths Recent observations have indicated that Rheumatic
Heart Diseases contributed to 0.5 to 1% of maternal deaths, needing aggressive preventive
programmes to prevent Acute Rheumatism. When mother dies during pregnancy, the child
has 17 fold increased risk of dying during the first six months of life.
There are wide variations between states - Bihar, Madhya Pradesh. Assam. Gujarat.
Orissa. Uttar Pradesh have very high Maternal Mortality and childhood mortality. These are
mainly due to female illiteracy. Maternal Malnutrition, inadequate obstetric care and bad
socio economic conditions
TABLE, vii
Maternal and Child Health Indicators In Some States
INFANT
MORTALITY
Kerala
16
MP
98
Bihar
67
Tamil Nadu
53
54
Punjab
72
ALL INDIA
Source : Sample Registration System, 1995
STATES
UNDER FIVE
MORTALITY
32
130
127
87
68
109
MATERNAL
MORTALITY
87
711
470
367
369
453
WHAT HAPPENED TO HEALTH FOR ALL BY 2000 AD IN INDIA?
For most villages and towns around the country and world not much has changed for
the better since 1978.The National Health Policy review is a review of broken promise. The
Indian Government stated at ALMA ATA, "we are now laying greater emphasis on Primary
Health Care in rural areas-on narrowing the gap between the village and the city and between
the "health haves" and "have nots". The new direction which we have given to our health
program seeks to take basic health care to the door steps of people in the villages". These
admirable sentiments and noble ideals were the solemn promises made by India. It implied
removing the obstacles to health. What are the obstacles for achieving HFA goals?
TABLE, viii
The Gap Between Health For All Targets and The Performance
Indicators
Status 1983
Target 2000
Status 1998
Infant Mortality Rate
104
<60
69
Under 5 Mortality Rate
140
<70
105
Peri Natal Mortality Rate
53
35
46
Crude Death Rate
12.5
9.0
9
Life expectancy
54
64
63
Low Birth weight (<2.5kg)
30
30
30
Maternal Mortality Rate
450
200
410
Crude Birth Rate
33.8
21
25
Total Fertility Rate
3.8
3.1
Immunization (BCG)
100%
79%
Immunization (DPT)
100%
73%
Immunization (Measles)
100%
66%
Pregnancy-TT
100%
80%
Trained Dai or Inst. Deliveries
100%
34%
Source: The National Health Policy, Sample Registration System 1993,1998
6
REASONS FOR FAILURE OF HEALTH FOR ALL
1.
MEDICALISATION OF HEALTH AND SELECTIVE PHC°
Diseases and deaths in the developed countries in the not-too distant past was strikingly
similar to that in most of underdeveloped world. Nutritional deficiency and infections played
an important part in high death rates specially among children. In the developed world
substantial reduction in deaths-85to90% occurred be fore the era of antibiotics and vaccines
by
1.
2.
3.
4.
5.
6
Protected water supply
Proper sewage disposal
Improved food and nutrition
Provision of safe milk.
Improved living condition
Universal education
Deaths of children under 15 years attributed to scarlet fever,
diphtheria, whooping cough and measles in England and Wales'
(Courtesy Office of Health Economics.)
Diarrhoea and dysentery: death rates at age 5 and over, England
and Wales 1848-1971. (From McKeown, The Modern Rise of
World Population, Edward Arnold, London, courtesy of author
and publishers.)
° Quoted from The Struggle for Health by David Sanders 1985 published by Mac Millan Education Ltd.
Decline in deaths was observed in air borne infections like diphtheria and respiratory
infection. Rapid decline was observed in water transmitted diseases Tuberculosis is
traditionally considered as a barometer of all aspects of health development. Anti TB
treatment has been available in India since 1944.India has a long and proud tradition in TB
research and demonstration project since 1950.In fact most of the therapeutic strategies
currently available and accepted globally have their roots in Indian research.
Decline in TB before drugs. (
Provincial Hospitals Trust.)
. Courtesy Nuffield
India has the saddest distinction of having the most cases of TB. The failure is due to
dependence on drugs and medical care and not on health development. Our Primary Health
care approaches failed to offer comprehensive health care. Many western donor institutions
argued that the comprehensive Primary Health Care is costly and unrealistic. To improve
health statistics high risk groups were targeted with selective PHC approaches. This selective
PHC stripped off its key concepts. This selective politically sanitized (and thus
unthreatening) PHC was reduced to few high priority technological interventions like GOBI
not determined by communities but by international health experts This selective PHC was
quietly embraced by national Governments, Health Ministries and many of the larger main
stream inter national organisations. The failure is due to health being treated as a simple
sector, the responsibility of health ministry and health professionals with the failure to
involve all sectors with mass citizenship participation as the main cause. Medicine of any sort
plays a very minor role in improving the health of people as their health is inextricably linked
to underdevelopment and the struggle against it.
Despite the dismal and deteriorating living conditions in many poor countries, a few
poor states have "succeeded in making impressive strides in improving their people's healthKerala in India and Cuba . Inspite of the economic backwardness. Kerala has made
remarkable achievements almost comparable to that of developed countries, spending
roughly about USS 10 per capita per year US spends roughly S3500 per capita per year
within the framework of constitution Kerala has a highly literate population with high female
Quoted front The Politics of Primary Health Care and Child Survival bv David Werner and David Sanders
published by HEALTH WRIGHTS 1997
8
literacy which has to be given due credit. The agrarian reforms that were implemented ended
the feudal relationship in agriculture and giving land to the tiller^ improved economic and
social living conditions of landless poor leading to the improvement of their health status. It
should be noted that Kerala has nurtured a political climate wherein the rights of the poor and
the under privileged have been upheld and fought for. One common thrust of all movements
was education and organisation of downtrodden people. There is remarkable reduction in the
rate of exploitation of the underprivileged in Kerala compared to other Indian states. The
public distribution system and universally available public health system has also contributed
to the high health status of people.
Cuba, with a low per capita income (GNP) has a significantly lower U5MR. Not only
are Cuba's levels of health, education, and overall social welfare superior to any other 'Third
World' country, but also in many ways they are equal, if not superior, to many of the
Northern 'developed' countries. For example, Cuba has an U5MR equal to that of Israel,
whose GNP is 10 times as high. And Cuba has a much higher child immunization rate than
the United States, whose GNP is 20 times as high. Indeed, for immunization of children
against measles and of pregnant women against neonatal tetanus, Cuba has the highest
coverage rates in the world (98%). Cuba has also placed strong emphasis on equal rights of
women, and has a higher enrollment ratio of girls to boys in high school than does the United
States. Even with its increasing economic difficulties due to loss of Soviet support and a
stiffer US embargo, Cuba has succeeded in making sure the basic needs of all people-and
especially the nutritional needs of children continue to be met. Cuba has managed, to date, to
sustain the high levels of health of its children in spite of a 50 percent decline in its economy
since the start of the 1990s The two case studies indicate that non medical interventions play
major role in improving health
2. MEDICAL EDUCATION NOT ORIENTED TO HOLISTIC HEALTH
The objective of Medical education is primarily to support the development of the
health of our nation, and hence it should be community-oriented. Unfortunately our medical
education is primarily hospital-based, specialization oriented and dependent on sophisticated
investigative procedures. The curriculum is overcrowded with factual information, which
inhibits the student from developing creative and critical thinking to solve problems. The
Edinburgh Declaration states "the aim of medical education is to produce doctors who will
promote the health of all people". It further states "Scientific research continues to bring rich
rewards but man needs more than science alone and it is the health needs of the human race
as a whole and of the whole person that medical education must affirm". The Declaration
suggested enlargement of the setting in which educational programs are conducted to include
all health resources of the community, not hospitals alone and to ensure that the curriculum
content reflects the national health priorities and availability of affordable resources. It also
emphasized the shift of training from passive to active learning. It is unfortunate that our
medical education does not follow the spirit of the Edinburgh Declaration
What Are the Obstacles?.
To become a reality. Primary Health Care demands a number of fundamental changes
in medical society. Such profound changes don’t come easily to medical society, from a
9
normal process cumulative learning They represent instead a revolution in thinking and
living.
The greatest resistance comes from the teachers themselves, both senior and junior,
who do not want change. Teachers express concern that if community orientation gets
priority, teaching has to be programmed beyond the four walls of hospitals and the medical
colleges. This would entail that the selection of students and teachers will have to be
restructured and reorganized, creating fear that the standards of education will suffer. They
have also a considerable vested social, political and personal financial interest to resist any
reform of the present system.
The students are never taught to imbibe the spirit of questioning, relevance,
innovation and social commitment in their pre-medical education They are denied an
education, which will give them better scope to meaningfully serve the people.
3.
DETERIATION IN PUBLIC SECTOR HEALTH SERVICES.
With Alma Ata declaration there has been a drastic expansion of community and
health infrastructure, nutrition intervention and personal spending large amount of resources.
Army of health, nutrition and welfare workers have received the necessary training for
implementation of programmes like CSSM and RCH and evaluation. Along with training
equipments for essential new bom care, emergency obstetric and critical care were supplied
in the last decade. Inspite of all these inputs, there is no impact on maternal morbidity and
mortality, high incidence low birth wt and under nutrition.
While Government health centres exist across the length and breadth of the country,
they have failed to provide the masses basic health care which the latter expect. A fairly
large investment in public sector health care is wasted due to improper organisation and lack
of accountability. While many doctors are sincere and committed to ethical and scientific
frame work of the profession and vocation, in to-day's increasingly corruption influenced
socio economic cultural political milieu, many are not. This is an increasing area of concern.
There is no regularisation of private practice of government doctors and health personnel.
The detailed plan of Bhore Committee was comprehensive designed to suit Indian conditions.
It sought to construct health infrastructure with additional resources with the objective of
making state health services available universally to all and would be run by full time salaried
staff.
io
TABLE .IX
Health Infrastructure Development In India 1951- 1997
1951
1961
1971
1981
1991
1
Medical
colleges
Allopaths
30
60
98
111
128
2
Out turn
Grads
1600
3400
10400
12170
12086
397
1396
3833
3139
p.Grads
3
Doctors
4
Nurses
5
Pharmaceutical
production
6
Hospitals
Allopaths
60840
83070
153000
266140
395600
All
Systems
156000
184606
450000
665340
920000
16550
35584
80620
150399
311235
Rs. in
billion
0.2
0.8
3
14.3
Total
2694
3054
3862
6805
%Rural
39
34
32
27
%Private
7
Hospital Beds
8
Dispensaries
562966
565700
60.5
160
(1999)
15097
31
664135
870161
348655
504538
%Rural
23
22
21
17
20
28
32
36
27431
28225
Total
6600
9406
12180
16745
%Rural
79
80
78
69
13
503950
115500
68
229634
% Private
459670
57
117000
1997
165
43
Total
%Private
1174
1995
43
60
61
Source : Quoted from Confronting Conimercialiation in Health Care - Authored and
Published by : National Coordination Committee, Jan Swasthya Sabha. May 2000.
11
4.
PRIVATISATION OF MEDICAL EDUCATION AND CARE
Medical education till recently was financed by State. Until the last decade the private
sector showed little interest and the entire burden of producing Doctors and Nurses was on
the state. But in recent years Private Medical Colleges and Nursing schools are increasing in
number rapidly without recognition by MCI & Nursing council (table ix). This trend has
been largely due to lack of any regulation on the growth of the private sector, and the large
demand of doctors in mid-east and western countries. It must be noted inspite of various
restrictions, out migration of allopathic doctors remain very high with about 4000 to 5000
doctors leaving annually which in today's price means loss of Rs.400 to 500 crores assuming
Rs. 10 Lakhs as the cost of production of doctor in public sector. Doctors under Homeopathy,
Aurvedic, Unani, Siddha etc. is largely in the private sectors in the very limited subsidiary in
the state. Even these doctors were largely produced for the private market. With the lack of
any regulation of medical practice most of them indulge in wholesale cross practice specially
Allopathy. In fact the Non Allopathic qualification is a via media for setting of the more
profitable practice of medicine. The medical care in the private sector has witnessed avery
rapid increase in the last decade and half making health care IN ACCESSIBLE TO THE
POOR.
The story about Nurses is little different from that of Doctors. Out migration is high
The demand for private sector in India is very small because the private hospitals and
Nursing homes do not follow any standard practice and prepare to employ nursing personnel
who are trained only as auxiliaries or worst still trained on the job
5.
DRUGS AND MEDICAL EQUIPMENTS INDUSTRIES AGGRESSIVE PROMOTION
India has one of the most progressive patent laws passed by the parliament in 1970.The major
feature of the Indian patent laws are that it is based on process patents rather than on product
patents. It is because of Indian Patent that India has become one of the very few countries in
the developing world that has attained near self sufficiency in essential drug production.
The turnover of drugs is more than 16 thousand crores and more than 90% of this
being in the private sector. The private drug sector has penetrated into remote rural areas and
has not deterred from using large unqualified segment of practitioners to expand its market
If someone has any information on private medical sector it is the pharmaceutical industry
Non-allopathic industry turnover is in 100 of crores and mostly in private practice For
patients and consumers the major concern is the rapid increase in drug price making Health
services more expensive. With the rapid growth of medical equipment industry in India the
cost of medical care is increasing rapidly The major impact of the WTO and TRIPS is in
the pharmaceutical sector, destroying a self reliant pharmaceutical sector. MNCs push their
drugs and equipments to the developing countries, making medical care very expensive and
un reachable for the poor.
12
6.
PRIVATE PRACTICE AND COMMERCIALISATION OF MEDICINE
In the first half of this century, the image of the general practitioner was family doctor
and family friend would come to homes, payment was flexible often differed few drugs
prescribed.
Today, due to fierce competition private practice is
> Threatened by numerous nursing homes and polyclinics.
> Swallowed up by corporate hospitals and insurance companies and for those who can not
pay or are drained of their money no treatment is offered. A very weak public sector fails
to take care of the poor.
A corporate hospital is run like an industry! It is run to maximise returns on investment
The number of people who need investigation will invariably be less than that needed to
break even-especially as more and more hospitals will open. Where there is a high return of
investment in any sector in a market economy, more units of that type develop. Globalization
has led to commercialization of medical care rapidly The pressure to bring income by
unethical means is much high in hospitals run for profit by non technical financiers.
7.
IRRATIONAL MEDICAL CARE
All types of irrational practices are rampant in India. The reasons are manifold One
is to de with the proliferation of a large number of drugs in the Indian market that are either
irrational or useless. With rapid developments in Science and Technology there has been an
explosion in the number of drugs, which are available in the market. A French study of 508
new chemical entities marketed in the world between 1975 and 1984 found 70% offered no
therapeutic improvement over existing products. The situation in India is no different and
probably worse, given the fact our Drug Control mechanisms are much more lax than in
developed countries.
As a consequence there are estimated 60,000 to 80,000 brands of various drugs
available in the Indian market. On the other hand the WHO lists a little over 270 drugs,
which can take care of an overwhelming majority (over 95%) of the health problems of a
country. A majority of the estimated 80,000 products in the market are either hazardous, of
irrational or useless. Another dangerous practice is that of making drugs available "over the
counter", i.e. directly by chemists, without a doctor's prescription.
All irrational practices continue to flourish because the five actors in this drama: the
government as a regulatory, the drug companies as producers of drugs, the doctors as
prescribers of drugs, the chemists as sellers of drugs, and the consumers as users of drugs, at
some level or the other do nor fulfil the required obligations and are unmindful of the
potential harm that inappropriate use of drugs can cause. Drugs can save lives, but their
inappropriats use of drugs can cause Drugs can save lives, but their inappropriate use can
also take lives. It is estimated that 20-30% of illnesses— especially in the aged and in
children are caused by use of drugs.
13
Irrational Drugs and Infectious Diseases:
Until quite recently there was a widespread feeling that the struggle against infectious
diseases was won. But tragically with optimism came a false sense of security, which has
helped many diseases to spread with alarming rapidity. Major diseases such as malaria and
tuberculosis are making a deadly comeback in many parts of the world. At the same time,
diseases such as plague, diphtheria, dengue, meningococcal meningitis, yellow fever, and
cholera have reappeared as public health threats in many countries, after many years of
decline.
Drug Resistance:
Resistance to antibiotics is a phenomenon common to both emerging and re-emerging
infections. Many well-known antibiotics are no longer effective against common infections
such as pneumonia, gonorrhoea and tuberculosis. Fewer new antibiotics are being released
on the market, partly because of the high cost of developing and licensing them and partly
because they have a potentially short life because of the development of resistance If the
arsenal of drugs against infectious diseases loses its power, the future for patients with even a
common infection will become more bleak.
8.
IRRATIONAL USE OF DIAGNOSTICS:
Irrational drug therapy as the basis, irrational use of diagnostics (including laboratory
tests of blood, urine, sputum, etc.; X-Rays; scans; etc.) may be defined as: "a diagnostic test
is irrationally used when the expected benefit is negligible or nil or when it is not worth the
potential harm or the cost".
While there is some awareness about irrational drug usage, almost no enough
attention has been focused on irrational use of diagnostics. If one realises that an irrational
use of diagnostics - an irrational CT-Scan is equivalent in wastage to about 100 bottles of an
irrational 'tonic', then the importance of rational use of diagnostics will be apparent.
9.
THE MARGINALIZED AND MIGRANT POPULATION:
The dislocation of populations due to migration necessitated by economic, political,
and armed conflict has a direct influence on health and well-being. Intolerance over ethnicity
and religion have divided communities and created war and destruction The tribals in areas
where mega dams are constructed are shelterless with total loss of income. Under the guise
progress they are made powerless and poor. Their rights have been totally denied
10.
THE NEW ECONOMIC POLICY AND HEALTH DEVELOPMENT *
One should understand what globalization is all about and how it affects the health of
the poor. The British colonized India. The motivation beyond doubt was greed Globalization
is another form of colonialism. In the post World War period the rich became richer and were
* Quoted from What Globalisation docs to Peoples Health. May 2000 - Authored and Published by National
Committee. Jan Swasthya Sabha
14
controlling the world economy. In 1973 the OPEC (Oil Producing Countries) suddenly hiked
their price. This was followed by a long period of crisis in all the rich countries characterized
by a slump in economic activity. There began an accumulation of money (or Capital - as
economists call it) on an unprecedented scale in a few hands. A major source of this
accumulation was due to the growing resources and influence of Multi National Corporations
(MNC's) including infant food industry. Another source of accumulation was the huge profits
made by oil producing countries, which they deposited into western capitalist banks A third
of capital accumulation was the increasing volumes of illicit or illegal incomes from crimes
of various kind ranging from drug smuggling and drug peddling to the plunder (by dictatorial
rulers and others from the ruling elite) of the wealth of developing countries.
Thus, the availability of "surplus" money in the global economy became enormous,
and it came at a stage when the economies of the developed countries were facing a slump
and were incapable of absorbing this money in production related activities. This produced
the impetus for the process of globalization, where avenues were sought, on one hand MNCs
to sell their products in developing countries, and on the other by capitalist banks to push
their money (in the form of loans) in developing countries. If both these objectives were to
be met the economies of the developing countries had to be prized open- to allow free flow
of goods manufactured by MNC's and to allow free flow of Capital from Western funding
institutions
One glaring effect of globalization has been the explosive growth of MNC's across
national borders. Capitalism identifies nations not as nations but as "markets' and countries
like India and China are the vast, untapped markets As a global slump in productive
activities creeps across the world, developed countries seek to expand their markets beyond
their own boundaries and the obvious targets are nations such as India, even if the majority in
these countries can barely make both ends meet.
The objective of opening up Third World economies to flow of Capital was pursued
relentlessly by two institutions set up by the Western capitalist countries after the Second
World War - IMF and World Bank. They claimed that their goal was aid development! They
directly control billions of dollars each year and indirectly even more. For the last 50 years
the IMF & the WB have had unchecked decision making powers over managing the "Third
World" debt. They have secured guaranteed flows of reserves from the South to the North.
Since 1947 the WB has made profit every year. Between 1980 & 1992 its net earnings rose
over 172% to over $1.6 billion.
Both the IMF & WB are structurally undemocratic. Voting power does not operate
on one vote one country but is determined by the amount of money in vested by each member
country. While more than 150 countries are members of the IMF five of them (USA, Britain,
Germany, France, Japan & Saudi Arabia) control 44% of the votes. The USA alone controls
19% of the vote. In the case of the WB, the 24 OECD countries control more than two thirds
of the votes. Clearly this gives the rich countries a great deal of power.
Third World countries had been hit hard by hike in oil prices in 1973. Further, in the
1970s developing countries faced increased economic problems as a result of unfair trade
Their economies were designed around the export of raw materials and agricultural products.
the price of which was manipulated on the world market by developed countries. Over the
15
last few decades the price of these commodities have declined sharply while the import of
manufactured goods produced in the highly industrialized countries has increased. Faced
with the twin crisis the developing countries were eager to borrow more and more money
from western banks, which, in turn, were only too happy to lend out more money and earn
interest on their oil money. The crisis hit when the global economy slumped further and the
interest rates for the money that was lent was hiked in the early 1980's.There were a number
of other reasons for their falling into the debt trap like trade deficits, failure of development
projects, often result of mismanagement and corruption.
External debt of developing countries, 1970-94.
Third World debt as share of Gross Domestic
Product 1970-93
The 'Third World' debt currently stands at approximately $1.3 trillion, which
represents 44% of the Gross National Product of all so-called developing countries,
combined. While India faced a debt crisis later than many other countries, in the late 1980s
and 1990's (IMF and other foreign banks). This is Rs. 4,000 for each man, woman and child
in India.
The ultimate result of the massive loans given by institutions like the World Bank and
the IMF has been a massive loss of capital from the poor countries to the rich countries in the
North - an estimated $50 billion in 1985 alone. In 1990 there was a net transfer of $156
billion from the "third world" to the developed countries. In other words, what is happening
is. as a result offending by the WB and the IMF, and the requirement to repay with interest,
there is a reverse flow from the developing countries to the developed countries, on a scale,
which is unprecedented.
Fig- 6
Just from me, the flow to the IMF
and WB in four years from 1986
to 1990 was 4.7 billion dollars!
16
The story does not stop here. In the face of the debt crisis banks and other financial
institutions saw the need to safeguard their own interests, i.e. to ensure that they get back the
money conditions on loans to "Third World" countries to ensure that there would be no
defaulting on their debt repayments. Stringent conditions were imposed on further loans.
Fig.7
I am the result of SAP. Everywhere,
there is increased malnutrition, infant
• mortality, unemployment & illiteracy.
Poverty has risen dramatically
UNICEF estimates that about half a million children
died in 1988 alone as a result of debt-induced
austerity measures.
In brief, the Structural Adjustment Program (SAP) was designed to:
1 Cut government spending - this means big cuts in health care, education and subsidies to
farmers and the poor
2. Privatize - state owned industries and services must be sold off to private corporations.
Often foreign multinationals are the buyers Many workers lose their jobs as government
industries close down. Services like transportation and power become more expensive.
3. Devalue the local currency - for example, in India the rupee should be worth less and less
compared to the American dollar. The World Bank and IMF demand this, so that what
the country exports is cheaper in the international market, help to pay back the loans. But
farmers and local industries get less for their goods. And prices of imports go up,
increasing poverty.
4. Export more- the country should export more to eam foreign dollars to pay back loans.
The agricultural sector should turn to commercial farming for the market and for export,
rather than food production for local consumption.
5. Open up to foreign multinational companies like Pepsi, Shell oil, Nike, Nestle, etc.
6 Reduce duties and tariffs on imports-in this way foreign multinationals can more easily
sell their products in a country like India. Local industries find it hard to compete with
cheaper imports.
SPECIFICALLY. IN THE HEALTH SECTOR IT MEANT:
r- A cut in the welfare investment, leading to gradual dismantling of the public health
services.
'r Introduction of service charges in public institutions, which has now making the services
inaccessible to the poor.
r Handing over the responsibility of health service to the private sector and undermining
the rationality of public health The private sector on the other hand focused only on
curative care. India for instance, was forced to reduce its public health expenditure in
health and to recover the cost of health services from its users by international banks
r The voluntary sector, which has also stepped in to provide health services is forced to
concentrate and prioritize only those areas where international aid is made available.
17
THE MARGINALIZED IN THE PRESENT SCENARIO:
The policies have been disastrous for the third world and more so for the poor in the
third world. After SAP, mal-distribution of global income has attained unacceptable levels.
During the period 1960-70 the poorest 20% received 2.3% of the global income. In 1990 they
received 1.3 of income A reduction by half. While consumption has steadily increased in the
industrial countries by about 2.3% annually over the past 25 years, the World's poorest 20%
live outside the consumption market. So Globalisation, WTO, SAP and others are making the
poor poorer in both developed and developing countries.
The number of people living in poverty
continues to grow as globalisation proceeds
along its inherently asymmetrical course :
expanding
markets
across
national
boundaries and increasing the incomes of a
relative few while further strangling the
lives of those without the resources to be
investors or the capabilities to benefit from
the global culture The majority are women
and children ,poor before, but even more so
now, as the two-tiered world economy
widens the gaps between rich and poor
countries and between rich and poor people
Structural Adjustment Policies:
Rescuing the Rich at the Expense of the Poor
-The State of the World's Children 2000
_ They no longer use bullets and ropes.
They use the World Bank and the IMF.
—Jesse Jackson
THE ROLE OF MEDICAL PROFESSION TO PROMTE HEALTH DEVELOPMENT
Paediatricians and physicians have to realise that they exist for serving the people, in
whose satisfaction and welfare alone the profession can survive They should have functional
code of ethics with accountability. They have a responsibility to address themselves
aggressively to the present and emerging problems.
As teachers they have a responsibility to train medical graduates paraprofessionals
and others to make the delivery of health care more efficient and effective. It is time to
reorganize themselves to take care of the community, the consumer, patient and people. The
need to motivate students to work with new categories of health care providers and allied
professional persons who can magnify and multiply the effectiveness of the work of
paediatricians and physicians. They have to look beyond health sector and establish
supportive linkages with education, health, agriculture, sanitation, communication and
comprehensive socio-economic development. They have to shift the main focus from drugs
and doctors to informed practice by the people for health promotion and disease prevention
18
As Administrators, the paediatricians have to play a multifaceted role to promote
health. They have to critically and objectively evaluate what is being done what can be done
and what should be done in managing program. Perceptions are changing in relation to
population growth. Lowering Birth Rate cannot be separated from improving nutrition and
health, education and socio-and economic improvement. They have to play a major role in
influencing policy makers including fund controlling politicians beurocrats and programme
executives aggressively address them about marginalizing the poor with various new policies.
They need to eliminate communication and information gap among all cadres of workers and
community to facilitates community participation.
The past century of the last millennium is called the century of the child. Because
pediatrics emerged as a medical specialty with increasing awareness that health problems
differ from that of adults. The present Century of the new millenium is a knowledge century
*ith respect for human rights. The sense of human rights must be imbibed by us. We have to
w
abide by all ethical principles. We have to respect sanctity of life but also the quality of life.
19
o
o
Co
fl)
3
Doslgn: Vlahwotih Sant
kihq
urn hi a n/u
ir. i/ rm'p’i.
TREATMENT OF SEVERE' ANAEMIA
Women vv.h haemoglobin levels
below 7g/di are considered to be
severely anaemic. Testing or
blood for haemoglobin.
concentration at field levels-is
neither considered safe nor
practical. therefore, as far as
possible, severely anaemic cases
should be icentified cn the basis
of clinical signs.. All health
workers should be trained to
identify sue.n anaemic cases.
Recommended therapeutic dose
for women in the reproductive
age group is one tablet (big) of
iron thrice daily for a minimum
of 100 days. This will provide
equivalent to 180 mg elemental
iron and 1500 pg folic acid per
day. in case of 100 mg
elemental folifer tablets.
recommenced dose is two
(big) tablets of iron daily for a
minimum of 100 days. Further,
cases of severe anaemia should
be referred to the PHC medical
officers for diagnosis of the
causative factors and treatment.
NATIONAL NUTRITIONAL
ANAEMIA CONTROL PROGRAMME
Nutritional anaemia is a serious
public health problem. Although
anaemia is widespread in the
country, it especially affects
women in the reproductive age
group and young children. It is
estimated that over 50 per cent of
pregnant women are anaemic.
Nutritional anaemia, due to iron
and folic acid deficiency, is di
rectly or indirectly responsible for
about 20% of maternal deaths
Anaemia is also a major contribu
tory cause of high incidence of
premature births, low birth weight
and perinatal mortality.
The National Nutritional anaemia
Control Programme aims at
significantly decreasing the
prevalence and incidence of
anaemia in women in reproductive
age group, especially pregnant
and lactating women, and
preschool children.
The
Programme focuses on the
fo 11 owing, strateg ies:
O
Promotion of regular consump
tion of foods rich in iron.
©
Provisions of iron and folate
supplements in the form of
tablets (folifer tablets) to the
“high risk” groups.
©
Identification and treatment of
severely anaemic cases.
The Programme is implemented
through the Primary Health
Centres and its sub-centres. The
Multiple Purpose Worker (F) and
other paramedicals working in the
Primary Health Centres are re
sponsible for the distribution of
iron tablets (adult and paediatric
doses) to pregnant and lactating
women, IUD users and children
aged 1 to 5 years.
The
functionaries of Integrated Child
Development Services (ICDS)
Programme,
under
the
Department of Women and Child
Development, assist in
the
distribution of iron tablets to
children and mothers in the ICDS
Blocks and for imparting education
to mothers on prevention of
nutritional anaemia. Department
of Food (Ministry of Food & Civil
Supplies) is responsible for
promoting consumption of iron rich
food. In addition, services of other
community level workers and
involvement of formal and nonformal education, media,
Horticultural Departments and
voluntary organisations is
recommended to be utilised for
the effective implementation of
the Programme.
PREVENTION OF
NUTRITIONAL ANAEMIA
(i) PROMOTING CONSUMPTION OF IRON RICH FOOD
©
o
o
Regular dietary intake of iron
and folic acid rich foods by
pregnant and lactating
mothers, adolescent girls
and children under 5 years
of age must be promoted.
The mothers attending
antenatal clinics,
immunisation sessions as
weli as women beneficiaries
in the ICDS Programme
should be made aware of
the importance of preventing
nutritional anaemia.
RECOMMENDED DOSES OF
IRON & FOLIC ACID SUPPLEMENTS
0
Pregnant Women - one big
(adult) tablet per day 100
days (each tablet containing
60 mg,TOO mg of elemental
iron and 500 ug folic acid).
These tablets should be
provided to women after the
first trimester of pregnancy.
o
Lactating women and IUD
acceptors - one big (adult)
tablet (containing 60 mg/100
mg of elemental iron and
500 pg folic acid) per day for
100 days.
o
Preschool children (1<5
years) - one paediatric
(small) tablet containing 20
mg. elemental Iron and
100 ug folic acid daily
for 100 days every year.
I
Regular consumption of iron
rich foods such as green
leafy vegetables
*,
cereals
such as wheat, ragi, jowar
and bajra, pulses (especially
sprouted pulses) and gur
(jaggery') must be promoted
widely. In addition, wherever
culturally and economically
feasible, consumption of
animal flesh foods such as
meat, liver, etc. must be
encouraged.
Green leafy vegetables ncn in iron: mus
tard leaves isarson ka sag?. Amaranth
(Chaulai sag; Colocasia eaves (Arvi ka
sac), Knol Knot greens (Ganth gobi ka
sag), Bengal gram greens (chana sag),
shepu or sowa. Turnip c*eens (shaigam
ka sag). Spinach' leaves (Paak)
Note: Tea inhibits absorption of
iron in stomach. Drinking tea
should be avoided within a few
hours of taking folifer tablets.
I:■ ■rh
o
o
For monitoring distribution
as wall as consumption of
folifer tablets by pregnant
and iactating women and
children 12-24 months, the
Mother Infant Immunization
Cards should be used. The
Growth Monitoring Cards
Registers used for
monitoring the growth of
preschool children under the
ICDS Programme, should be
used for recording and
monitoring the distribution of
folifer tablets to children 1-5
years.
In addition, records of under
fives and antenatal care
maintained under the MCH
services and ICDS
Programme, should be usee
for identifying beneficiaries
(pregnant and iactating
women, preschool children;
as well as for recording and
monitoring the distribution of
iron and folic acid
supplements.
6
©
Ensure incorporation of iron
doh foods such as green
leafy vegetables in the
weaning foods of infants.
o
Vitamin C (ascorbic Acid)
promotes absorption of iron.
Regular consumption vitamin
C rich food such as lemon,
crange, guava, amla, green
mango along with iron rich
food must be promoted.
©
For increasing availability of
iron rich foods, growing of
iron rich foods in home
gardens and consumption of
these must be promoted.
©
Tea inhibits absorption of iron
in the stomach. Advise a
reduced consumption of tea,
specially during pregnancy,
for improving the absorption
of iron and prevention of
anaemia.
(ii) PROMOTING CONSUMPTION OF IRON
AND FOLIC ACID SUPPLEMENTS
q
As a priority, all pregnant
women, irrespective of
haemoglobin levels, must
be provided with the
recommended dose of iron
and folic acid (foiifer)
supplements.
o
In addition, in case of
available remaining supply,
iron and folic acid
supplements must be
provided to lactating women
and IUD users.
a
Preschool children,
especially those in tribal
areas and ICDS blocks,
should be given on priority
the recommended dosage of
iron and folic acid
supplements.
e
The contact during
administration of tetanus
toxoid should be utilised
for distribution of foiifer
tablets to pregnant women.
Ensure every mother is
provided with complete
recommended dosage of
foiifer tablets during
pregnancy.
o
Wherever ICDS Programme
is in operation, Anganwadi
workers (AWWS). under the
supervision of multipurpose
workers, should distribute
foiifer tablets to pregnant
and factating mothers and
also to preschool children.
o
Mothers often accompany
their infants to the
immunization sessions.
Such ensured contact with
lactating mothers should be
used for handing over iron
supplements as well as
monitoring consumption of
the total dosage of tablets.
THE NATIONAL PROPHYLAXY PROGRAMME
FOR PREVENTION OF BLINDNESS DUE TO
TOMIN A DEFICIENCY
Vitamin A deficiency has been
recognized to be a major controllable
public health and nutritional prob
lem. An estimated 5-7% children in
India suffer from eye signs ofvitamin A
deficiency Recent evidence suggests
dtat even mild vitamin A deficiency
probably increases morbidity and
mortality in children, emphasising the
public health importance of this dis
order. National Prophylaxis Pro
gramme for Prevention of Blindness due to Vitamin A Deficiency aims at protecting
children 6 months-5 years at risk from vitamin A deficiency. The prophylaxis
Pogramme comprises a long term and a short term strategy. While the sort term
intervention focusses on administration of mega doses of vitamin A on periodic basis.
dietary improvement is the long term ultimate solution to the problem of vitamin A
deficiency.
The National Prophylaxis Programme for Prevention of Blindness due to
v itamin A Deficiency is implemented through the Primary Health Centres and its
‘ub-centres. The multipurpose worker (F) and other paramedicals working in the
Primary Health Centres are responsible for administering vitamin A concert trates to
children under 5 years and for imparting nutrition education. The services of
Integrated Child Development Services (1CDS) Programme, under the Department of
Women and Child Development, Ministry ofWelfere, is utilized for the distribution of
vitamin A to children in die ICDS Blocks and for the education of mothers on
prevention of vitamin A deficiency.
A PREXENTION OF VITAMIN A DEFICIENCY
i) PROMOTING CONSUMPTION OF VITAMIN A RJC -■
FOOD.
Designed by Apama Kayast.
0 Regular dietary intake of vitamin A rich foods by pregnant and lactating
mothers and by .children under 5 years of age must be promoted.
0 The mothers attending gntenatal clinics and immunisation session.- as well a5
mothers and chiidren enrolled in the 1CDS Programme must be made aware
of the imp inar.ee of preventing vitamin a deficiency.
0 Breastfeeding, including feeding of colostrum, must be encouraged.
o Feeding of locally j.aiiabie fl
■ ileguiar consumption <>■ dark green leafy,
.
j. i
.
r.
b Ji
„
J
- • - ‘
<U‘Li
carotene (precursor ofvitamin A)
ri ch food such as green leafy vege
tables and yellow and orange
vegetables and fruits like pumpkin.
carrots, papaya, mango, oranges
etc. along with cereal and pulse to
a weaning child must be pro-
' zr-t-is! it .e'it-gprotectsagainstAitarnif? A ..
ddieiencvv Gkiootiura....
is rich itivicaiBifca.- ■ . '.'v. ■ :•
noted widely. In addition, when
ever economically feasible. con
sumption of milk, cheese, paneer,
dahi (yoghurt). ghee, eggs, Irtr
etc. must be promoted.
'o ve dose oi’.iUO tyjOR.’tG.'d^anxs.Xfeli .
■fjc-nUis.i
\ ' e''7'
— six niijiidily dose of 200 000 iU io children -5
years of itge,
‘
" ■'
o For increasing availability of
vitamin A rich food, growing of
vitamin A rich foods in hente
gardens -and consumption of
these must be-promoted.
depdepey: ’
......
■ Trnd-mcnt ol:.i.,ifxroin A deBcieiu cases
single wal riose-of 200 OC'Q.?.Uofvifarni?t.A
.
,,p t:OeCi.u.one-fourjfzeefc ..
ii) ADMINISTERING MASSIVE DOSE OF VITAMIN A
o Unlike most other mlcronutrieGis, vitamin A Ls stored in the body for
...
1. should be stored in a cu'd
uirk room. Vitamin A solution
’-rapt at room tempera arc is
stable tor a minimum of one
■ itamin A solution boule nee
prolonged periods and hence
periodic administration of
massive dose ensures adequate
vitamin .A nutriture.
o Administration of massive dose of
vitamin A to pre-school children
at periodic intervals is a simple.
effective and most direct inter
vention strategy. This is a short
. term strategy.
o Under the massive dnse programme. every infant 6—11 months and
children 1-5 years is to be administeied vitamin A every 6 months.
Priority is to be given for coverage of children 6 months—3 years
since the highest prevalence of clinical signs of vitamin A deficiency
is reported in this age group. The recommended schedule is as
follows:
6-11 months
—
one dose of 100 000 IU
1-5 yrs
—
200 000 IU/6 months.
A cliild must receive a total of 9 oral doses of vitamin A by its fifth
birthday.
o The contact with an infant during administration of measles vaccine
between the age of 9-12 months is considered a practical time for
administering the vitamin A supplement—100 099 IL’ for infants.
° A camp approach may be used for administering vitamin A to children 1-3
years and 3-5 years. However, the DPT/OPV booster in mid-second year to a
child is a suitable time for the second dose of vitamin A (200 COO 11'
Ol&cj!-<auil iirjTTciaiS
Wherever. I CDS Programme is functioning. AWW
should be involved in the distribution and admini
stration of vitamin A.
o The Mother-Infant Immunisation Card should be
used to record and monitor the administration of
vitamin A dose to children under two years. The
Growth Monitoring Cards Registers used for
monitoring die growth of children under the
I CDS Programme, should be used for recording
and monitoring administration of vitamin A solu
tion till the age of five years.
j
® In addition. records of under-fives maintained under the MCH Senices and
the ICDS Programme, is recommended to be used for identifying is well as
monitoring children foradministration of a total of 9 oral doses of vitamin A
per child.
B. TREATMENT OF \TTAMIN A DEFICIENT
CHILDREN:
o Mild deficiency of vitamin A leads to night
blindness and conjunctival lesions, while
more severe deficiency results in comeal
damage. The term ‘Xerophthalmia' is used
to indicate
various types of eye lesions
that result from vitamin A deficiency.
progresses rapidly to keratomalacia
("wasting" of cornea) and blindness.
o .All children with clinical signs of
vitamin A deficiency must be treated
as early as posstoic.
o Infants and young children suffering from diarrhoea, measles or
acute respiratory infection must be monitored closely and
encouraged to consume vitamin A rich food. In case, early signs of
vitamin A deficiency are observed, the above treatment schedule
must be followed.
0 Vitamin A concentrate is available at primary health centres and sub health
centres in the form of flavoured syrup at a concentration of 100 000 lU/ml or
100 000 IU/ capsule.
lie completely reversed with vitamin A
therapy but in untreated cases it
« Xight blindness and conjunctival changes
f such as Bitot's spots) and corneal xerosis
ulceration are inclination for immediate
vitamin A supplementation. Cornea!
damage due to vitamin A deficiency
(changes in the normally clear central part
of the eye) threatens sight and is a medical
emergency
o Children with eye lesions must be treated immediately with vitamin A even if
they are being referred for special care.
C. CONCENTRATED VITAMIN A SOLUTION—
LMPORTANT GUIDELINES.
o Loss of lustre, haziness and dryness are
characteristics of corneal xerosis. This can
o Recurrent infections and parasitic infes
tations aggravate vitamin A deficiency.
absorption, storage and utilization of
vitamin A is adversely affected in such
conditions. Keratomalacia is often
preceded by an episode of diarrhoea or
respiratory infection. Measles is another
important contributory cause of vitamin A
deficiency and childhood blindness.
0 Treatment schedule is to administer 200 000 IU of vitamin A
immediately after diagnosis. This must be followed by another
dose of 200 000 IU 14 weeks later.
0 Vitamin A syrup should be administered using the 2 mJ. spoon dispenser
provided with each bottle of vitamin A A marked level full 2 ml spoon of
vitamin .A contains 200 000 IU vitamin A
Additionally, fixed dose vitamin A capsules (100 000 IU). are also being
supplied for infants. The content of the capsule should be squeezed gently and
completely into the mouth of the infant after snipping an end of the capsule
with a pair of scissors or a clean razor blade
G imail xerosis ulceration
ds ddiier Nutrition
id.: Causes of Malnutrition
1 he condition ot under-nutrition which manifests itself among large sections of the poor,
1 aiu> iilai !\ amongst women and children is (he physical expression of widespread poverty, the
heavy toll of diseases and chronic and persistent hunger. The high levels of illiteracy, their low
purchasing power and inadequate household food security, their insanitary living conditions with
poor housing, lack of safe water and sanitation facilities, the lack of regular employment and
income, the lew social and economic status of the women are all basic risk factors that result
iti adverse synergistic effect which creates a vicious cycle of poverty, malnutrition, ill-health and
V'' productivity (figure i).
One major component of child malnutrition is related to low birthweight.
Children born
underweight (less than 2500 gms.) arc nearly 30% of all births and they contribute to the levels
of malnutrition seen in the first year of life. A second major component of malnutrition is the
large pcreenlagc of children (27%) who were normal at one year of age and became
malnourished during the second year of life. After the second year of life there is hardly any
new addition to the group of malnourished children.
• he above two facts highlight the second set of intermediate and immediate risk factors that
cause malnutrition.
These are :
v
low age at marriage
v
low age at pregnancy and childbirth
maternal malnutrition and anaemia
<
inadequate breastfeeding and weaning practices
O
inadequate childfeeding and child care practices
v
high prevalence of childhood diseases
$
inadequate preventive and curative health care
57
figure i
Causes of Malnutrition
Mani festal ion
Malnutrition
Disease
Dietary Intake
Insufficient
Health Services &
Unhealthy Evironmenj
Inadequate Care
Cor Mothers
and Children
Inadequate
.Access to
Food
Immediate
Causes
Underlying
Causes
Inadequate Education
Resources & Control
Human, Economic &
Organization
Political and Ideological Superstructure
Basic
Causes
Economic Structure
Potential
Resources
58
■......
.......
--- —
...... '
--
10.2
Conceptual Framework
Among the lime major forms of malnutrition in an individual, (PEM, 11)1), Vitamin A deficiency
and Iron deficiency), anaemia is an outcome of complex, biological and social processors, as
summarized tn f igure j. Inadequate dietary intake and inadequate access to health services arc
major causes or determinants of malnutrition. The number of possible underlying causes are
almost endless and their inter-relationship complex.
All, however, reflect a particular
initialisation of resources in the past and the present. One way of grouping these causes is to
identify a set of outcome conditions necessary for adequate nutrition. Three such conditions can
be identified:
adequate access to food (household food security)
b)
adequate earc of children and women
c)
adequate access to preventive and basic health services together with a healthy
environment.
Household food security is defined as access to food, adequate in quality to fulfill all nutritional
requirements for all household members throughout the year. Adequate care of children and
women has only been recently fully recognised as having an important bearing on the nutrition
status of mother and children. ‘CARE’ refers to care-giving behaviour such as breastfeeding
practices and complimentary feeding practices, food and personal hygiene, diagnosing illnesses,
stimulating language and other cognitive capabilities and providing emotional support. Care also
"fees to the support that the family or the community provides to the members of (he family
and to behaviours within the household that determine (he allocation of food supply to members
of the household. Access to health services, together with a healthy environment is the third
necessary condition for good nutrition. Prenatal and post-natal care, immunization (particularly
against measles), ORT, distribution of micronutrient supplements, family planning and health
education arc all important services with great impact. The availability and control ot human
and economic resources at dilierent levels of society are the results of histoiical piocesscs in the
society. These processes can be seen as the basic causes of malnutrition.
59
10.3
Spectrum of activities having impact on nutrition
Food and Diet related
*
*
*
*
*
*
*
*
Promotion of exclusive breastfeeding and complementary feeding
Nutrition education
Supplementary nutrition
Improving nutritional status of Adolescent Girls
Universal consumption of iodised salt
Wide availability of low cost weaning foods
Fortification and enrichment of selected foods
Access to PDS by the poor
Health Care related
*
"
*
*
■'
Iron Folic Acid and Vitamin A supplementation to adolescent girls, expectant and nursing
mothers
Immunization against measles
Oral Rehydration Therapy for diarrhoea
Improved pre-natal and post-natal care
Raising the age of marriage to 21 years
-Spacing birth intervals to over three years
Environment related
*
*
*
Access to safe drinking water
Access to household sanitary latrines
Education on hygiene - Proper disposal of waste, garbage and waste water
Economic activity related
*
*
Income generation schemes for women and access to credit
Employers to provide adequate facilities for day care centre to infants of working mothers
Maternity leave and benefits
Education related
*
Education of women
Agriculture related
*
*
Self sufficiency in production of pulses and oil seeds and post harvest food conservation
Land reforms
Monitoring related
*
* •
Nutrition surveillance
Growth promotion and monitoring
,
61
11.
RECOMMENDA TIONS
Using the conceptual framework mentioned above and in the light of the findings, the following
measures are recommended for improving the nutrition status of the women and children in the
State of Karnataka.
General
\
1
11.
Better supervision, monitoring and the
I
i
vigorous implementation of various ongoing
health and nutrition programmes as well as other programmes aimed at poverty
alleviation and income generation, especially in the tribal areas, should receive top
priority.
11.2
Targetting food subsidies through PDS towards those living below the poverty line and
ptoper monitoring of the functions of PUS require due attention.
11.3
Education plays an important role in determining how resources tire being utilized to
Investment in education, particularly of the girl child
secure food, care and health.
would have long term impact because of the pivotal role in the future of her own family.
11.4
It has been widely established that women’s control over the household income needs to
be enhanced through initiating opportunitces for women’s employment.
Expansion of
women’s access to production oriented credit and development of the required institutions
must be pursued in this context.
SPECIFIC
Based on the findings of the study, following possible actions are suggested:
11.5.
Promotion of breast feeding
should receive priority in urban areas whereas
activities on promotion of timely introduction of proper supplementary feeding
62
slamld icceivv priotity in niral/lribal areas,
Early initiation of breast feeding,
exclusive breast feeding for first six months and the importance on the use of
colostrum in infant feeding is to be stressed. Also, importance of supplementary
feeding from four to six months as well as continued feeding during illness should
be stressed in our infant feeding messages.
Exclusive breast feeding for 4-6
months should be promoted as it helps combat diarrohea.
At the same time,
breast milk provides anti-bacterial activity in the infant’s gut, reducing the risk
of disease, if contaminants arc ingested. Breastfeeding should not be witheld
during illnesses, especially during fever and diarrohea.
11.6
Coverage of Vitamin A supplements in five doses for children below 3 years, provided
through the ongoing programme needs improvement through adequate supervision and
monitoring. Extra doses of supplements during measles outbreak are advocated in the
CSSM programme. This has been shown to be effective in reducing case fatality, further
infection and promoting recovery.
11.7
Incorporation of carotene rich food, green leafy vegetables need to be emphasized to
improve the dietary intake during various interventions anti deliberations.
1 i.X
Although distribution of IbA tablets was found to be satisfactory, (he compliance was not
good. This requires promotional effort.
1 iEatnily planning services need to be seen as multiple benefits for individual health and
nutrition. The health aspect of family planning needs to be adequately stressed through
ongoing programmes.
11.10 Tribal nutrition should receive top priority along with districts like Gulbarga or North
Karnataka area. Better supervision, and monitoring of the implementation of the various
ongoing nutrition and health programmes in these areas should be the strategy to achieve
the set goals in nutrition. For each nutrition intervention, a zone of high priority should
63
IL demarcated and all supervision of the particular programme should be focused on the
particular zone.
11.11 Obstetric care facilities need improvement in tribal areas.
Tribal health units
require strengthening.
11.12. The nutrition education component of 1CDS programmes/interventions related to Vitamin
A prophylaxis, anaemia prophylaxis and iodine deficiency disorders control should be
strengthened by establishing Nutrition Education and Demonstration Units in all districts,
while the present units should be strengthened. Linking first dose of Vitamin A with
measles immunization is the policy to boost the coverage of Vitamin A supplementation,
but proper implementation requires concentrated efforts.
11.13. The study strongly recommends effective implementation on tiie ban on sale of non
iodised saittbroughout the State, as it is clearly shown in the study that in the district
where there is a ban the flow of non-iodised salt is limited and consumption of iodised
salt is high. (Ban on entry and sale of non iodized salt lias been later imposed throughout
the State),
11.1-1. Nutrition Education programmes must be arranged to focus attention on:
-
Mixed cereal / millet diet
-
importance of pulses in the diet
-
Significance of milk, at least one cup a day
Strategies to glow green leafy vegetables and low cost yellow fruits, for adequate
intakes of Vitamin A.
11.15. The study emphasised the need to develop process indicators and impact indicators, which
will provide useful baseline information (Refer Anncxurc I).
64
r ’•
St/rjpcslcD Activities
In the light of the above recommendations, the following activities ate suggested for immediate
,a non and strengthening (he nutrition component of vmions ongoing, inlet ventions :
i.'.l
District Nutrition profile should be prepared for all (he Districts by conducting
stmilai tvpes ol smveys, District Action Plans should then be based on these
district profiles.
Thus (he area-wise prioritisation of Nutrition programmes call
be taken care of while implementing the Nutrition Policy. To start with, the three
rural districts covered in the present study can be taken up immediately for
preparing. District Action Plan.
12.2.
The sanctioned
posts of the present
District
Nutrition Education and
Demonstration Units (NEDU) should be filled and the staff should be trained with
the help of the State unit of (he Eood and Nutrition Board of Government of India
and Agricultural universities in conducting demonstration. The Nutrition Officer
of the NED Unit can be the ‘District Nodal Officer’ foi Nutrition Io assist (he
Distticl Health Officer. The NED Units should be provided with appropriate and
sufficient educational material and other equipments for 1EC activities.
The
Nutrition Officer of the NED Unit, along with a designated Officer from the
District Women and Child Development Office can form a small core group for
monitoring the nutrition activities in the District. The core group can conduct
District l evel workshops and periodically collect information on a few important
‘piocess indicators' for nutritional status for documentation.
12.3.
Simple uniform messages should be framed for prevention of the nutrition
problem most prevalent in the District.
They should be given wide publicity
through school debates, wall paintings and local media channels.
65
12.4.
AH elected Zilla Panchayat. Mandal Panchayat and Gram Panchayat members
should be kept informed about the Nutrition Programmes being implemented in
their areas through appropriate 1EC material in Kannada and their role can be
highlighted tor successful implementation and monitoring of these nutrition
,
12.5.
interventions. Community monitoring may be initiated in certain areas.
Tribal health units require special attention and strengthening, with appropriate
and relevant training as well as provision of IEC material so that (hey can
perform various activities similar to those of Nutrition Education and
Demonstration Units, in their respective areas.
66
St. Luke Health Centre
Aurad - B, P. O.
Gulbarga 585 316
Karnataka, India
Back ground:
It is now almost thirty years since this work has started in
this area. What had started as a relief program continued as a
mobile medical unit visiting remote villages which did not have
medical facilities available. Those days die mobile team consisted
of a doctor, two nurses, a social worker and driver used to visit
from Gulbarga city io the villages around taking care of under five,
pregnant women and primary domicile treatment.
hi 1993 a primary health centre was built and commissioned
at Aurad - B. On a 4 acre barren land. This centre lias OPD, Xray, laboratory, Operation and labour rooms, wards to
accommodate 15 patients and residential accommodation with
internal road, electricity, telephone and waler supply. As years
went by die barren land was converted into a thick lushly green
garden giving the appearance of a sanatorium with a beautiful
chapel. The centre is just on the state high way to Lidar from
Gulbarga exactly fifteen Kms on the road from Gulbarga. In these
years it has earned the name and reputation of a Christian mission
hospital and the tender loving care provided has attracted many
patients from f;n and wide. Every' ycsir there is an increase in
number of patients attending this hospital ( Vide Annual reports
enclosed ).
During these years this centre lias catered to many thousands
of the area and beyond. We mainly used to cater to the domiciliary
treatment, conducted and assisted many deliveries, taken care of
pregnant women, underfive, actively participated in the family
planning programme, control of Tuberculosis,
control of
blindness, many an awareness programme on health issues, school
health programmes, baby show's, Nutrition programmes, polio
residual paralysis control, etc. are few of the activities conducted
here, in addition to this we also conducted tailoring school for
women, school for disabled, propagation of Ayurveda and training
workshops for Ayurveda doctors. We also provide training for
Nursing students of both degree and diploma course in community
health. \ v iae Ai 11 luui icpoi t tor statistics ).
In these years we have been recognised as a strong and
sincere NGO in hetilth care. Government of India had given Rs.
380,000 as grant for family pltamiug programmes. We had also
received a grant of Rs. 60800 towards the propagation of Ayurveda.
From the state government we receive personnel and vaccine,
drugs for family planning etc. we are active facilitators for the
immunisation of under five, ANC programme and Family planning
programme. Government departments locally participate actively
with us in our programmes.
The past seven years were very fruitful years, there is a
strong bond developed with the community and the community is
demanding for more and more services from us. Because of this
faith and rdatior dr.
1 ••• 1 ***
•' -"d fix more health care
services we have the following plans for the future. The project
reports of each is attached for information and help.
1 Upgradation of the health centre.
Ikie to the limited bed and residential accommodation this
centre is not made complete use of its facilities. We have x-ray,
Laboratory, Operation room and labour room winch can cater the
requiranent of at least one hundred bed. A slight modification at
the OPD, and wards will enhance the utility and provision of
services. In a radius of about 50 krns we do not have a fully
equipped General hospital other than Gulbarga city. Gulbarga
hospitals are over crowded. Once this facility is available we can
provide specialist care in maternity.
General Medicine and
paediatrics Much are of high importance. Government of India or
Government of Karnataka in the next fifty or hundred years will
not be able to meet the demand on them. Further by this up
gradation I would like to see that this centre is made self supporting
by peoples participation in the form of peoples participatory health
care. Both the proposals are interrelated and will go side by side.
Huis two project proposals viz People’s participatory health care
and up gradation of health centre are enclosed.
2. Tuberculosis control programme.
This is a National Health Programme, but the load on
Government is too hear that they are calling NGOs like us to help
them in the program. From our experience it is found that 3 out of
ten chronic cough patients are suffering from infective tuberculosis
and one infectious patient can infect ten normal person. Thus we
know the magnitude of the problem. It is taking the shape of an
epidemic. We would like to bring our area at least tuberculosis
free. In this task Government will co-operate and contribute
effectively. A proposal is enclosed.
3. Medicinal and Aromatic plat farm.
Last year we have taken up a program to spread and
piopagtuc Ayurveda system of medicine. It was a government
aided project. 1 Au lug the program we learnt that Ayurveda is dying
due to non availability of medicinal plants, Ayurveda is cheap, very
effective in many chronic disorders, has no side effects, and this is
an indigenous science which needs to be rejuvenated Government
has agreed to give us five acres of land free of charge for the
purpose. Forest department lias promised to help us with seedlings
and plants and local agricultural university lias promised to help us
with Hie technical known how. Thus it is a joint and very vital
project proposal is enclosed.
4. Help age India project.
With the help of an NGO known as Ffelp Age India we are
planning to have a project where by we will have a cataract free
area. Provides a ray of hope for the older persons. We plan to
conduct about 400 cataract operations a year and die above NGO
will contribute a sum of 160,000 rupees towards this and we will
have a local contribution of 40,000 rupees.
5. School for the disabled.
REACH anodier NGO is helping us to establish a school for
the disabled. At present we have about 20 students and three
teachers. We do not have a separate budding for the purpose. This
is a need and a proposal is enclosed for the same.
6. Tailoring school
In the past years we have trained nearly 200 girls and women
in tadoiing skill and supplied 146 sewing machines to the trained.
A new project has to be started from next years.
Thus diis centre will be a very active centre witir all these
actives in the years to come. This centre is to be developed in to a
place where Hs people shall enter in awe and respect get relived of
their problems and sickness. This place should become simdar to
the ftonze serpent of the dessert where thousands may look up for
their health and well being May our Lord Almighty help us to
fulfil this vision to glorify His Name.
ST. LUKE HEALTH CENTRE.
St. Luke health centre started its work in 1972 as a relief work agency supplying
food for the draught affected Gulbarga in about 40 villages by a Swedish Nurse working
for the Hindustan Covenant Church, with its head quarters at Pune. When Miss. Jansson
started the work she found that ANC, PNC care and immunisation status at its low in these
village. Along with the feeding programme she started ANC, PNC care and immunisation
for under five in these villages.
In 1975 when she was leaving India Dr. Abraham was asked to take up the work
and the work took the form of a mobile medical unit doing preventive and curative health
care and the feeding programme. I am proud to say that immunisation for under five was
almost 70-80% in those days in our villages amidst protest and opposition.
In 1981 with an idea of having a base for the mobile medical unit four acre private
land was bought at Aurad and started planning for this Health Centre. It took ten years for
us to overcome the obstacles, one after the other and in 1991 the work for the centre
started.
1993 April this centre was commissioned as it stands today with 15 beds, labour
room, operation room, laboratory, x-ray and 0. P. D. block with all basic equipment’s,
furniture, staff quarters etc. for a cost of one crore ten lakhs of rupees. Whole of this
money came from Swedish International Development Agency.
The staff position al the centre are two doctors, one staff nurse, one community
health guide, one ANM, one lab and x-ray technician, one accountant, one electrician, one
driver, one MSW social worker and six class IV employees. In addition we have twenty
of Nursing students on rotation being posted from private College of Nursing for
community
‘t p-.-- •,-.±
U - —“nfr.g expense o the tune of 5 lakh
rupees per year comes from MCCS and is run by St. Luke Medical Society charitable
trust registered under the Bombay Public Trust Act with its head quarters at Pune.
When the land was bought there was no health facility between Gulbarga and
Kam alapur and the centre was planned to serve the rural poor free or on nominal charges
with the help of Govt. Today SI MS is trying its best to give charitable service since the
Present sei vices from the centre.
1. Q. P. D.
Daily OPD from Monday to Friday. 60 - 70 patients on an average attend the OPD
SCivivcs, iuppuiicu uy .viay anu Lauuiaiuiy, sci viCcS.
2. Tuberculosis Control Programme:
Tuberculosis is a poor man’s disease, patients coming to the centre is from
extremely poor classes. All patients with cough for a duration of two weeks or more are
investigated forT. B. so far we have diagnosed about 1000 patients. This amain cause of
anxiety. More and more patients come to this centre. But cannot afford for investigation
and treatment and they are hesitant to be transferred to any other centre.
3.
Maier mil lleallii Service.
Every Thursday is ANC day. Safe delivery service is available round the clock
with proper referral service.
4. Family planning service.
Every Tuesday we have family planning operation. Mini laprotomy Tubal ligation
is being done here. In the villages we promote IUD, CC, and Oral pills to the eligible
couples. We have successfully completed two programmes on family planning sponsored
by government of India costing Rs. 400000 which were very successful.
5. In patient care.
Patients are admitted round the clock on all days according to demand and taken
care. There are fifteen beds but most of the time twenty patients are admitted.
6. Mobile unit
One social worker, one ANM and one community health guide with Nursing
students conduct daily village visits. We visit 19 villages in rotation. 11 villages have
vuunuuiiiiy ncauu
yuiuuiccis wnu iiiumiui
me iicuim iuuiccs> ui uiu uuiiim unity. 111 tucsu
visits the team conducts health education, immunization and nutrition demonstration along
with propagation of family planning environmental sanitation with propagation of family
planning caviluniiiritia! sainttuiUM viv.
7.
1
school.
As a part of the women development programme a batch of twenty women are
enrolled for training of tailoring skill. 6 months training is provided and at the end of
training cadi iiuu tcccivc a sowing niavhniu in suppnii their living. A diploma holder is
appointed for training these students.
8. School for disabled.
With the help of REACH and NGO of Calcutta we are conducting regularly a
school for the disabled children about 15 children with different disabilities attend the
school and three teachers are trained to teach these children.
9. 24 hr. Ambulance Services.
Round the clock, an ambulance with driver is stand by at the centre for patients use
to the centre and for referral sendees.
In addition to these programmes we take up many different programmes like
farmers training, pastors training, Adolescent seminars, propagation of Ayurveda etc. at
this place at various times.
We have also established women’s self help groups in villages other than mahila
mandal (women’s association) and youth clubs.
We are a recognised NGO of health care service in the district and may be the only
Mission Centre in the three neighbouring districts. We try our best to put into action the
love and compassion of Christ to the poor and needy.
We are stationed in a 2 hectare plot on a hillside, on the state high way with
full of greenery and vegetation. A sanitoria appearance with the serenity of a retreat
centre.
Sheetl
Abstract of work done during the period of
1993 - 1999
I.
Patient Care.
Year Out patients
1993
1994
1995
1996
1997
1998
1999
II.
4654 9283
10400
10194
12057
11038
14364
Eye patients
Dental
Laborator X - rays
treated operated patients
Investigat expsed
335
76
247
420
41
473
94
216
473
236
738
32
235
254
816
181
5 405
375
194
44 1237
251
1868
321 90
19 423
2844
257
Family planning.
Year Tubectomy
1993 1994
1995
1996
1997
1998
1999
III.
Inpatients
Contrace[ 1 U D
condoms
1
7
1
10
1
8
285
319
54
53
107
299
303
631
Oral pills
2
20
83
144
101
230
Mother and child Health
year ANC
1993
1994
1995
1996
1997
1998
1999
Deliveries
56 78
79
95
307
~45?
478
DPT
Pollio
T. T.
-
30
42
81
73
77
104
175
267
531
1101
881
338
Page 1
Measles BCG
366
60 386
70 134 495
661
92 1028
200 176 1051
329
328
757
Sheetl
IV.
Grants & Projects
Year Government
1993 1994 1995 Sace grain
pogramme
1996 Small
Family norms
1997 Small family
Narms
Project
S ID A
MCCS
Rs. 100000 Rs. 150000
Project
-
Rs. 150000 Tailoring
school
170200
1998 RCH
Rs. 200000 Tailoring
school
CBPHC
170200
150400
1999 RCH
ISM
Rs. 200000 Tailoring
60800 school
CBPHC
Rs. 371600
Rs. 150400
*:
Paa
9
Draft dated 2 November, 2000
NUTRITION SITUATION IN KARNATAKA: PROGRESS
ACHIEVED& CHALLENGES AHEAD
written by Sabu M. George for HNP project;
ACHIEVEMENTS AND OPTIMISM FOR FURTHER PROGRESS
Karnataka has made progress in improving the health status of people as evidenced by
various indicators over the last 2-3 decades. There have been improvements in life expectancy,
declines in the rates of infant and child mortality, child malnutrition and in clinical Vitamin-A
deficiency. Birth rates have dropped dramatically. Though, the present TFR is higher than that of
TamilNadu or Kerala; the demographic transition in the state is of the same magnitude. As
Karnataka’s TFR was historically much higher than its Southern neighbours- one to one and half
child per women over half a century ago. Urban fertility rate in the state has already become less
than replacement levels.
There have been massive increase in primary school enrollments. Three years ago the state
appointed one lakh teachers. Childhood immunisation rates have increased over the last 5 years.
Poliomyelitis has been virtually eliminated from Karnataka. Just 3 cases occurred in 2000. This
year the Govt, appointed a Task Force on Health which has given Nutrition a priority. PHC system
is being strengthened by recruitment of Doctors. Training of ANMs to fill up the vacant positions
have commenced. Women & Child Dept, had in the last year recruited all the vacant positions of
CDPOs and ACDPOs and is determined to fill up the Supervisor positions in ICDS this year. The
pro-active role of the present Government is what gives us hope that the proposed strategies will be
implemented. The Government is not only taking a leadership role in Information Technology (IT)
but also keen on enhancing the Human development profile of the people. Due to the recent and
proposed investments in IT, the State GDP is expected to grow at 8% per annum for the next 10
years. Software exports are to double from the present 5500 crores over the next few years. We are
confident that the present Government is equally committed to improving the health status of the
people.
2
We begin wi th the analysis of the present situation and also make a comparative assessment
of the Karnataka’s achievements relative to TamilNadu. This comparison will enable us to
highlight how much more progress can be attained in Karnataka if Nutrition is given priority. The
major constraints are highlighted. The existing infrastructure for Nutrition is briefly described.
Children under the age of two years receive the highest priority. This review is followed by
strategies of intervention. Finally, the needs of the school aged children are also described.
THE SITUATION OF THE PRESCHOOL CHILD
Achievements in Child Survival and Nutritional Status
Infant Mortality Rate has dropped from above 90 to below 60 from the early seventies to
mid nineties (SeeTable-1) while Child Mortality; of children aged 1 to 4 years old decreased from
43.6 to 21.9 (SeeTable 2).
Weight forage is an indicator of under-weight. Over the last two decades levels of severe
and moderate malnutrition have come down (SeeTable-3). Xerophthalmia as reflected by Bitot’s
spots have also decreased (see Table-4).
But Progress is limited
But these achievements of the state in infant & child mortality; and in nutritional status are
modest when compared to the improvements in TamilNadu over the same period. Note that both
states started with similar baselines 3 decades ago but achievements in Karnataka have lagged
behind Tamil Nadu. Figure-1 reveals that the pace of decline in IMR in Karnataka has been slower.
Table-5 reveals that the Child mortality levels (1 to 4 years) in the nineties in Karnataka is only half
that ofTamilNadu. The nutritional deprivations in children are worse off in Karnataka (see Tablc6) as the fall in malnutrition levels have been more spectacular in TamilNadu.
This is not surprising as tire nutrition expenditure per child in Karnataka is among the lowest
in the country. Nutrition was not a priority of the Health Department. In TamilNadu thanks to
TINP Nutrition received priority. Further, the expansion of the 1CDS in Karnataka was more than
3
5 years behind TamilNadu. Though in Karnataka 1CDS projects exist in every taluk; the actual
coverage of children is not universal even in rural areas. Regrettably, the request for 6000 more
additional centres in rural areas made by the State to the Government of India 2 years ago was
rejected due to lack of funds. The ICDS coverage of urban areas is limited Today there are only
10 urban projects. The Supervision in ICDS has been inadequate due to non recruitment of
Supervisors for the past eight years (SeeLater).
Various independent surveys reveal that almost all children in Karnataka remain
malnourished. Barely 9% are normal as per the Gomez classification (see Table-3). That nearly
half of children suffer from moderate or severe levels of stunting (NFHS <-2 Z) is an indication of
how serious the nutrition problem remains despite some improvements at the extreme end over the
past 3 decades. Clinical Vitamin-A (Table-4), iron (Table-7) and iodine deficiencies needs to be
tackled. Thus, the classical micro-nutrient deficiencies persist despite an extensive network of rural
health infrastructure and a functioning State. There have been failures in recent years by the Health
Department to procure Iron and Vitamin-A. Therefore, the lack of supply to the Primary Health
Centres is one major reason why Iron and Vitamin-A deficiencies still occur with unacceptable
prevalences. Fortunately, this year the Health Department has made major initiatives to correct
these deficiencies in logistics.
The Constraints in Karnataka
1.
Regional Disparities
Karnataka is like India in its regional diversity. The Northern region of the state for
historical reasons have been very backward. For centuries these regions were under the control of
non-Kannadiga rulers and therefore these people did not benefit from the enlightened policies of the
erstwhile Mysore rulers. Following the formation of the state in 1956, major investments have been
made in Irrigation Projects on the rivers- Malaprabha, Ghataprabha, Krishna in North Karnataka.
And more recently on roads. But education, health and other aspects of development have suffered
4
relative neglect in Northern Karnataka. As the political representatives from this region had not
given adequate emphasis to social development. However, the present Government has made
several new initiatives in overcoming the past neglect. A separate Transport Corporation has been
Vj eCkV-
established and about 500 Community IT centres will be opened this^ New initiatives are being
attempted for initiating a special School Feeding programme and towards establishing a High Court
Bench in the North to meet the long standing aspirations of the people.
Data from the 1991 Census, National Nutrition Monitoring Bureau and the NFHS are
consistent in that the situation of the children in the North is the worst. For instance, Table-8 gives
the malnutrition levels; which reveals that the regional variations are marked. Therefore, this project
gives special emphasis to the Gulbarga region- the most backward part of Karnataka Immediate
improvement of the well being of children in this region is imperative for the State to come upto the
levels attained by TamilNadu. A Special Monitoring Cell is proposed for the Gulbarga region to
ensure the speedy implementation of this Project.
2.
Increasing gender disparity in Karnataka
Child sex ratios and Nutritional differentials
There have been drop in child sex ratios from 991 to 961 girls per thousand girls during the
intercensal years, 1961-1991. Most regrettably, the gender differentials in nutritional status against
girls have increased over the last two decades. Earlier boys were more malnourished at moderate
and severe levels while today girls are worse off by weight for age (see Tables-9). Height for age
data also indicates that girls are more severely stunted than boys (Table-10). Height for age is a
sensitive indicator of chronic malnutrition and therefore ideal to examine gender differentials in
nutrition.
Female feticide
Another reflection of the intensification of son preference is the increasing abuse of prenatal
sex determination for selective elimination of female fetuses. Ultrasound clinics in various parts of
5
the State are abusing this technique due to virtual lack of medical ethics in the medical profession.
The Health Department has now initiated steps to implement the 1994 National Law forbidding
prenatal sex determination. District level Appropriate Authorities will be created to monitor and
regulate ultrasound clinics.
Lack of Involvement ofMen in Contraception
Though use of contraception by families is high in Karntaka the entire burden is on women.
Sterilisation is by far the most common family planning method (>85%). In fact, NFFIS Surveys
indicate that the percent of women sterilisation has increased over the years 1992 to 1998; while
men’s sterilisation has come down. The percent of currently married women, 15 to 49 years,
sterilised has gone up from 41.2% to 51.5% while that of men fell from 1.5% to 0.7%. Scalpel free
vasectomy facilities needs to be widely established and vigorously promoted in Karnataka.
School dropouts
Enrollment of girls in primary schools have improved over the last five years. However,
dropouts in upper primary and high school are disproportionately girls. Gender discrimination is
obvious by tire fact that enrollment of boys outnumber girls by over 25% in classes 89"' and 10lh.
Violence against married women
Alarming number of suspicious deaths of recently married women occur in Karnataka. For
instance, Bangalore alone reports about 100 every month. The State has kept apart a special burns
ward which has recently been airconditioned.
To be fair to Karnataka this problem of gender discrimination is not particular to this State
only, but we have to benefit from the experiences ofTamilNadu. Despite, the successes ofTINP;
increasing gender disparities in children were not given adequate attention. Therefore, we in
Karnataka must aim to not only to reduce rates of malnutrition and child mortality but at the same
time ameliorate the increasing gender disparities between pre-school boys and girls in Karnataka.
Gender sensitisation of the Health Sector and the Society is imperative.
6
3,
The role of Panchayat Institutions in Nutrition
Karnataka has been a forerunner in establishing Panchayat institutions in India. Elections
have been at regular intervals. In the recent elections over 45% women elected as members.
Though decentralisation of governance is a great opportunity for improving the well being of
children, presently there are obstacles to the smooth functioning of Nutrition & Health Programmes.
We are pleased to note the World Bank’s recent endorsement of Panchayat institutions (henceforth
PRI) in development. It is a welcome change for the Bank which had long been used to providing
uniform prescriptions from Washington for a wide variety of issues whether macroeconomics or
population or health. We appreciate this ideological shift towards the best interests of the poor.
However, our anxieties about the current state of Karnataka PRI are for several reasons. Firstly, the
devolution of powers to the different tiers of Panchayats from the District to the lower levels have
been meagre, particularly financial powers. And given inadequate democratisation at the grassroots
in some parts of the state, particularly the North we have to be cautious. The lack of transparency
in decision making and mechanisms of accountability at the District and Taluk PRI needs to be kept
in mind.
To give one instance of the complexity of the involvement of Panchayats in the Nutrition
Sector- distribution of food. The money for food is disbursed by the State Government to the
District Panchayats. Ideally the District Panchayat should further devolve this fund to the Taluk
Panchayat. But we are informed that there are District Panchayats which do not do so as there are
profits to be made from centralised procurement of food and distribution to the Anganwadi centres
at the District level. Further, there are few taluks; most of them in the North where the Panchayats
divert this money to other sectors. Thus allocation for food becomes less and children are fed for
rv.
rw Ab
about half a month rather than every-day. That even the children’s daily food supplement which is
an entitlement rural people are well aware, and appreciate is denied because of the vested interests
of powerful Panchayat leaders in some taluks; is a reflection the power the ‘feudal’ bosses have over
7
helpless people.
However, we are hopeful in making the PRI institutions function more democratically, and
be made accountable to improve the health and nutritional status of the people; but it is a laborious
process.
We believe, the very act of seeking WB loans and the careful monitoring of the
implementation by the top Project functionaries; has the potential to contribute towards greater
accountability of the programmes at the grass roots and thereby empowering people at the village
level. This project will enable building the capacity of village and taluk Panchayat members to
handle the responsibilities of working with the Health and WCD. Presently though the Anganwadi
Centres and PHCs are under the control of local Panchayats, the lack of expertise of the Panchayat
members ensure that these technical Departments function with little accountability to Panchayats.
Further, given the feudal history of significant parts of Northern Karnataka we propose the
establishment of a special Monitoring Cell (SMC) in Gulbarga for this region.
STATUS ON IODINE DEFICIENCIES & NUTRITION RELATED ASPECTS
Iodide Deficiency
The estimates of Iodide deficiency are based on the physical size. Chickmagalur, Kodagu,
Dakshina & Uttara Kannada have more than 10% prevalence. This traditional measurement is
inadequate for several reasons. Urinary iodine estimation is the modern indicator. This is also very
important from a programmatic point of view. The implementation of iodised salt and its short term
impact can only be urinary iodine indicator. Therefore, we request funding to do a prevalence study
using urinary iodine in the entire state. Karnataka had made iodised salt compulsory in the 4 high
incidence Districts many years ago and had recently initiated compulsory iodisation of all salt. Thus
it is imperative to assess the progress of this scheme by using a responsive indicator so as to improve
the lacunae in the implementation.
Breastfeeding
f T"
Measles Immunisation J
p
x; 2)
9
ANMs. The recent steps being taken by the Health Department will ameliorate this problem.
Nutrition Goal
To improve the quality of existing nutrition related services, enhance their coverage,
emphasise care related nutrition interventions and ensure greater priority for nutrition so as to reduce
malnutrition and iron deficiency anemia; and achieve virtual elimination of Vitamin-A and iodide
deficiency over the project period.
Major Approach
Strategies for Intervention
1.
Strengthening ICDS
2.
Nutrition Sensitisation
—
Sensitising the Political leaders, Panchayats and District Administrators on Nutrition.
Karnataka is one of the few states who have implemented the Panchayat System. But building the
capacity of these local level institutions is essential for greater effectiveness and building up
ownership. The Staff of WCD & Health are unhappy as they resent one more source of control apart
from their own parent Departments. Further, the very nature of decentralisation results in many
more meetings at the District and Taluk levels which takes away time from project management.
Sensitisation will likely lessen the time the meetings consume.
3.
Alternative Approaches
Alternative approaches for Nutritional improvement of the under-two child:
Three
alternatives are suggested for increasing nutrition consciousness of the Society in the most backward
Gulbarga region where the rates of malnutrition is the highest.
3.1
Towards building Community Ownership of Nutrition. This is the most riskiest approach
as it involves with working with different kinds of groups in many villages. The groups will
enable mothers to provide better child care. Supporting and promoting breast feeding and
improving weaning are the two major tasks. Therefore the most challenging alternative.
10
Forming and sustaining groups in our highly divided, hierarchical, casteist and inegalitarian
societies in several thousand hamlets and villages is a laborious and time consuming effort.
Still it is worth attempting if the World Bank is willing to accept the grass root realities that
despite genuine efforts that this approach can fail in significant number of villages.
3.2
Appointment of Second Anganwadi Worker in Gulbarga Region who will visit homes of
every under-two child to promote nutrition related activities. The 2 worker model was
followed in tie first two TINP Projects. Of the three possible alternatives this is the easiest
to operationalise. There are again risks in this but this is a strategy most likely to function
in the largest number of villages during the Project period. In practical terms this will
double the present number of 7000 AWW in the Gulbarga region to 14,000.
3.3
Weaning Food Initiative. The objective here is to organise communities to prepare locally
acceptable, less bulky and calorie dense foods for weaning and facilitating changing
practices. This will be attempted using wherever pre-existing groups are functional. Mahila
Sanmakya, Credit groups including functional Stree Shakthi groups etc., will be involved.
The very selection criterion will result in that the better developed and more organised
villages in this region will disproportionately benefit from this initiative. This by itself is not
bad under tire most optimistic scenario the overall benefit in terms of improved nutrition and
child survival can exceed even that of the first strategy for the Region. But the major
concern here is that this may entirely focus on food production and distribution and may
neglect the care related aspects like breast feeding. Enhancing the understanding of the
significance ofweaning and enabling mothers to feed frequently weaning food is aft e-Tu
4.
Raising nutrition consciousness of the society by a new Information and communication
endeavour
5.
For ensuring smooth and timely project implementation- Separate Monitoring Cell for
Gulbarga
11
6.
Special Initiatives and Research Studies to assist in raising the effectiveness of the Project
interventions
Long term sustainability of the Project objectives
Enhancing nutritional status and reducing infant and child survival is done largely by a
process of raising the awareness of women, families & communities; and by improving the
functioning of the Health & Nutrition Sector. Once people become aware that malnutrition can be
ameliorated due to their own efforts then this knowledge gets transmitted by their own selves without
theinteiventionof the State or external donors. The better functioning of the Nutrition System can
itself raise the expectations of people for the acceptable minimal level of functioning Increased
utilisation of services like antenatal care, immunisation and other services of the Health & Nutrition
infrastructure particularly in backward Northern region will empower the communities to demand
that the Panchayats and State ensure universal coverage This is apart from the economic and social
benefits that improved nutritional status and child survival brings; which will catalyse further
improvements. The efforts to further raise the awareness of the significance of Nutrition will
continue to be done by the resources of the State. The likely project achievements in empowering
people will have its own momentum. An economically prospering state like Karnataka will continue
to invest in human development endeavours to meet the increased expectations of the people.
A sustained improvement in infant & child mortalities which is a direct outcome of the
project but will mostly be evident only after the project period is an important benefit in the five year
period immediately after the project The falling under-5 mortality rates and corresponding declines
in malnutrition levels particularly of the severe and moderate will have a direct impact on fertility
levels. The impact will be the greatest in Northern Karnataka where the TFR have been the highest.
The effects of lower fertility and improved child well being will have synergies which will likely
sustain the post project declines or at worst prevent the stagnation which is likely to happen in the
absence of this Project, in the following decade.
12
About gender, we have no delusions that in the short span of the Project that most of the
disparities will be eliminated. But greater gender consciousness of more women and men and that
of elected representatives particularly women will facilitate the process where age old prejudices of
our patriarchal society against women will continue to be challenged with greater vigour and
ameliorated.
FIELD VISIT TO GULBARGA: SECOND REPORT
Mission Medical Institutions
written in BangalJ ore, October 4, 2000
Sabu George
Dr Abraham on Missions and their Medical work in Gulbarga
American Methodist missionaries arrived in Gulbarga in early 1900s. The oldest mission
institution is the Boys School which is 105 years old Despite this long history most of the
Methodist Hospitals have closed down or virtually dead. The Yadgir Mission Hospital in
Gulbarga Dt and the Bidar Hospital are in their terminal stage.
Dr. Salenc, a CMC Alumnus (pre 1970) has an independent Society- Velmaganal Society
in Bidar town He is the solo Doctor there The Hindustan Covenant Church (HCC) was formed
for evangelical work among the Muslims. The services are in Urdu. The St Luke’s Health
Centre at Aurad is the healing ministry of HCC. HCC has one more Mission Hospital in the
adjacent Solapur District of Maharastra
Dr. Abraham came to Gulbarga in 1967 for MBBS He belongs to the third batch of the
HKE Medical College. His Professors included Maalaka Reddy and Sankar (past Gulbarga
Principal and presently Somaiya Medical College Principal). Dr. Abraham later did Hospital
Admin at Vellore and RCH at Upsaala Univ. He had served in Zimbabwe in 1984-88 as a
Missionary. There he was in charge of an entire District working with the Govt With the money
he made then built a house in Gulbarga town. His present monthly salary is 8000. Able to have a
car and maintain his family because his wife is a Professor in the local college and earns 26,000.
St. Luke Health Centre
Was established in 1972 for supplying food to 40 drought affected villages by a Swedish
Nurse, Miss. Jansson. Along with the feeding Programme, ANC, PNC and immunisation services
were provided. When she left India in 1975, Dr. Abraham took over. Initially there was a mobile
2
medical unit. Four acres of land was purchased in 1981 in Aurad to set up a base Hospital.
Finally, in 1993 with 1.1 crore SIDA aid a 15 bedded Hospital was built. Fie had 2 more Doctors
who recently left when they got PG admissions Now is looking for Doctors He is not sure of
the fate of his own Hospital after him.
Working in 25 villages of about 30,000 population in rural Gulbarga Taluk. Till last year
St. Luke’s was doing all the immunisations with their own Nurses. The Govt. Nurses merely took
the lists from St Luke. From this year, the immunisation is done jointly with the Govt. ANMs
In every village the ANMs and the AWW are given dates in advance. The women Student Nurses
(not men) from the local Nursing College are involved in Health Education in the mornings. He
said medical students are not involved in the work because he does not want to take the risk of
boys creating problems for the girl Nurses
Dr. Abraham himself lived in the village till recently. He used to come home only in the
weekend After his in-laws passed away and sons gone away, he comes home as his wife is alone
Only normal deliveries are done in the Hospital. He said if the PHCs were working properly then
his Centre need not exist at all. People come and ask him why not take over the PHCs as they are
not functioning properly.
The Campus is full of trees and stone buildings well maintained. A big Church is also
there. The Hospital OPD was clean and seemed well organised Despite the bandh the only two
staff living in the town came to work in time. The Chief Nurse came the previous night itself so
as not to miss work the following day. I was informed that the Medical work is secular and even
among the Staff there are non-Christians. I did not get a chance to find out from Dr. Abraham
about the secularness of the Medical work The Flospital had received money in the past from the
3
Govt, for RCH work. Presently, the Health Centre is funded by SIDA & Mission Covenant
Church of Sweden. He had contacted CMAI about funding for Sanitation work in the villages.
Community Health Work
There is a Social Worker who studied MSW from Gulbarga Univ. He has been working
for two years. He was very familiar with people in the villages. Even in the large village we
visited he knew where exactly the Harijan AWW was though it was nearly half a km away from
the road. When I examined the records of the outreach Programme, found it was difficult to
estimate IMR from the records as it was primarily meant to collect input data rather than to
estimate outcome indicators Further, in Abraham’s report on the medical centre, number of
immunisations delivered were given rather than percentage of children covered. The social
worker could not answer some questions about the past records. Dr. Abraham could not tell me
what the IMR was though he said it could be obtained from the records. When asked how
complete is the recording of births and deaths- it is complete. When asked how he knew it- Our
village workers monitor pregnancies. I doubt whether every birth outcome or almost all
pregnancies are registered. Dr Abraham acknowledged that not all children accept immunisations
as there is resistance.
There was a summary report for more than a year which had the following figures at the
Centre. 835 Deliveries, 530 Registered Births, just 17 infant deaths and measles immunisation of
377. The Social Worker could not distinguish between deliveries and registered births. The
summary statistics is revealing about the lack of systematic follow up despite a good
infrastructure and long standing community work. The immunisation Register did not have
measles immunisation. When asked about it I was shown a page where some names were
4
recorded. Does not appear an easy way to keep track of children needing measles vaccine.
My suspicion was confirmed later in my visit to villages In one of their villages after
many enquiries the AWW said that not all are immunised against measles. When asked why- the
AWW said the Nurse comes only to the sub centre at the beginning of the village After some
probing the AWW and one mother said people expect measles vaccine to be delivered home like
OPV in pulse. Then the social worker confirmed that in large villages their Nurses do not go
house to house. While in small villages they do so. It needs to be appreciated that the Social
Worker after this, fixed dates with the AWW so that in the next round the ANM and the Student
Nurses actually visit the Harijan hamlet so that coverage can be improved. How unlike the State
Health Director Dr Nagaraj who suggested that children can wait up to 1 year from 14 weeks
onwards so that ANMs can leisurely ensure the completion of immunisation (stated at the Oct 3
project planning meeting).
Also the fact of refusal of Measles vaccine after 2 decades of work in the Aurad villages
do not look plausible. An occasional child not accepting vaccine is possible but inadequate
coverage is merely a reflection of lack of attention to Measles.
Vitamin-A is distributed to children regularly If Govt does not have stocks they buy
from private sources.
Perception of the Govt, System
He said that the District TB Office does not give him drugs They expect him to send
patients. When these poor patients go to the town money is demanded. Therefore he himself
procures medicine from private sources and patients pay for them. This is not so in their Solapur
Mission Hospital which gets regularly free drugs from the Maharastra Govt He is furious with
5
the Karnataka Govt, since for the poor free TB drugs make a difference. The major problem he
sees in his Hospital is MDR TB At least two new sputum patients come to his OPD every day.
An average of 20 to 25 new patients come every day.
He says that the new regime for Malaria that is being followed in the District is unheard
of 2 BD, 2 days Chloroquine and 10 primaquine (5
2)
*
He gives 7.5 mg BD Primaquine for 15
days. He said that the Govt, is trying to make resistant malaria spread
Dr Abraham said that Leprosy is not a problem in his area. However, Dr. Maalaka Reddy
said in a recent press conference that Gulbarga is one of the few Districts where Leprosy persists
(Could it be that Leprosy is a problem in non-Abraham parts of Gulbarga?).
Dr. Abraham said after the Health Minister has taken charge the District Hospital is
functioning better However, he said that the Govt, Doctors merely consider the Govt, Hospital
as an asylum to dump their dying patients The Govt. Doctors just use the District Hospital to
further their own private practice. In any case he said the Minister will not do anything drastic to
make the Govt System to function well; as an astute politician like Reddy knows he cannot
antagonise a powerful section like Doctors. Nobody in the Govt, is bothered. Most of the Govt.
ANMs come from the town Like Doctors they do not stay in their Centres It is very sad going
to meet Govt, people. He no longer goes. The Assistant goes. He had a favourable opinion of
the DC. The DC is supportive of their work.
He had never heard of the UNICEF assisted Border District Programme. Though he has
been listed as a member of this Committee in the Gulbarga District Proposal. He has never
received any notice for meetings.
In the monthly meetings St. Luke workers participate with ANMs & AWW at the PHCs.
6
Other Aspects of St Luke Village work
They organise demonstration of the preparation of Hydbd mix. Once a month they have a
cultural event in the village for raising health awareness. The troupe comes from the town
School Health Check up is done regularly in all the village schools. The PHC Doctor
comes for it. They also follow up on the school drop outs. They obtain a list from the teachers
and visit homes. The Social Worker said more boys attend primary schools than girls. Boys
dropout to look after cattle while girls have the responsibility of looking after younger children.
More detailed info on dropouts was not available.
Dr. Abraham asserted that hygiene in his villages were better than others. The large
village I visited was as filthy as bad ones in Haryana. There are Baby shows every year for 2-3
villages. Prizes are given to the best babies. (Need to elicit more information on this kind of
cattle show). He felt that the children in his villages were better than other villages.
wak
In one village where the AWW was visiting once every month for last 2 to 6 months, the
Social Worker was unaware though their own contacts in the village knew it (previous RCH
worker) The Social Worker said that only for immunisation days cooperation is sought from the
AWW. This suggests that St. Luke’s has limited interaction with Govt, functionaries at the
village level apart from immunisation.
Conclusion
With a little external effort the Health Centre can systematically track progress in child
survival. Whether this is a priority for them I do not know With a regular group of Nursing
students (despite largely Malayalis) even nutrition impact can be enhanced. St Luke’s can be a
good source of Govt, info but provided effort is taken to interact more seriously. Dr. Abraham
7
did not know the DHO who is the first batch Gulbarga student (perhaps if I see him I will
recognise) indicates how isolated he is from the System. Such aloofness also mean that vested
interests can use him as was done for the Border Dt Project. How contended can we all become
in our splendid isolation from the bad Govt. System9 Perhaps CHC can attempt to wean
Abraham away from such a paradigm given that CHC itself has for the present given up
misgivings about working with the Govt Building local level partnerships in Gulbarga is as
important as forging global alliances. Gulbarga deserves as much priority as Geneva.
MINUTES OF THE MEETING HELD ON 07 MARCH 2001
AT THE OFFICE OF
THE COMMISSIONERATE OF PUBLIC INSTRUCTION ON
INTEGRATED HNP PROJECT
Mr. Vijay Bhaskar initiated the meeting by congratulating Dr Kurtakoti for the excellent
performance in the School Health Programme during the previous year.
Mr. Sanjay Kaul briefly touched upon the HNP project and CHC’s role in preparation of the
project proposal. He stated that the project was for about Rs 800 crores from the World Bank and
that a Project Preparation Grant had also been sanctioned. ThemainTocus was on pidcTLk Primary g
Health Care that should provide integrated services, and covefagimltiatives of other sectors. He
mentioned about the responsibility of the Dept of Health in provision of Nutrition through theZjj^jrgn.
ICDS scheme of WCD Dept and similar commitment to the health of the children in schools.) jUjJJT
While accepting the good efforts of the Chief Medical Inspector of schools and Dr Kurtakoti in
the School Health programme, especially where documentation is concerned, he still felt that the
school health programme was neglected. He commented that though the education dept, had
printed beautiful and useful health cards for the school children, these were not being filled up
while conducting the medical check up of children.
Also the school registers were not being
updated. The components of Health Education and Education of Adolescents, especially girls,
(Life skills/Sex education) was not being linked to the school health programme. There-was-net
much coordination between the Health Dept and Education Dept^’and-felt-that-this needed to be
~improvedi He emphasized that counselling of adolescents (or even post-pubertal girls) needed to
be intensified. He felt that the health gains of the ICDS programme, which covered children upto
6 years, should continue for the children in schools also.
Dr Kurtakoti briefly described the school health programme achievements and gave handouts.
He stated that 1-reijL 1998-99 only 25%
children had been medically examined and this has
steadily increased from more than 80% in 1999-2000 to 95.23% in 2000-2001. He stated that he
was convinced of the validity of the data as they were reflected by the DHOs. The medical
examination was carried out for children of I, IV and VII standards (once every 4 years), as per
the guidelines of the Government of India. He also stated that DT was given for I Std students
and booster dose of TT was given to Std IV and VII students and almost 79% coverage had been
achieved. About 22% of children have defects of which majority were dental and malnutrition/
He felt that most of these could be avoided by simple health education alone. He also submitted a
proposal for about Rs 55 crores for improving the implementation of the School Health
Programme. Regarding training of teachers, he stated that this depended on the budget received
by each district, which varied from Rs 80,000/- to one lakh per year.
Mr. T.M. Kumar was skeptical that such a large number of school children had been medically
examined and expressed doubts regarding the validity of the statistics presented. He was of the
view that only a campaign mode was suited for carrying out medical check ups. He also stated
that ideally 3 days of training
for teachers was required but only about one day training was
being given. Also modality for referral of school children to Taluk and District hospital needs to
be worked out.
'
. i
Mr. Vijay Bhaskar briefed about the UNICEF project in Mysore District where schools were
being provided water supply, toilets, sanitation and training of school teachers on Health and
Environment. He also stated that the department has approached NABARD for assistance for
toilets and water supply to all schools/
Mr. Sanjay Kaul stated that life skills training (including sex education) was required
adolescents and felt that NCERT had a good booklet on life skills with practical tips.
for
Dr. Kurtakoti commented that students in the schools could take up tree plantation and the other
batches could maintain the trees. He also felt that this would help in Nutrition education. He said
that all schools would be provided first aid kits.
Ms. Jalaja stated that more than 80% of girls in schools suffer from anaemia. Since there were
roughly 4 million school girls, mechanism should be worked out to deworm them once a year
and provide elemental
Iron weekly to them, as well as out of school girls.
She also felt that
small doses of Vitamin A could also be administered rather than the mega doses being given by
ICDS.
Dr. C.M. Francis felt that as malnutrition was more in boys than girls, this problem also needs
to be tackled. He cautioned about the dangers of excess Iron administration. He disagreed with
Dr;'Kurtakoti’s statistics (5%) and felt that malnutrition was a major problem in Karnataka.
Mr. T.M.Kumar was critical of nutrition education, as he felt that the ground reality was quite
different Fie stated that even in some places in Kolar district, no vegetables were available for
half the’year.
Ms. Jalaja explained that even in poor families green leafy vegetables were always available
Also nutrition education was necessary so that within their constraints they
could provide a
balanced diet to their school children.
Mr. T.M.Kumar expressed that as the text books for Std. I to V had already been revised, any
changes or incorporation of Health Education material would not be possible. Flowever,
textbooks for the other classes could be suitably modified.
Also the inside covers of the text
books could be used for printing Health Education messages. Fie felt that monitoring of school
health by school teachers needed to be strengthened and that DDPI or others should review this
regularly.
Mr. Sanjay Kaul clarified that the major part of the medical examination was done by the health
workers and only the children with defects were examined by Medical Officers. He projected the
requirement of mobility and also of referral of the school children. He also stated that additional
drugs would be catered for in the PHCs.
Mr. T.M.Kumar felt that there needs to be a curriculum review in the TCFI programme. Also
over 2 lakh teachers would require to be trained in the Block Resource Centres. Fie commented
about the success of 'chaitanya' (in-service 7 days training) which had a package that included
what ailments teachers can handle, which cases they should refer, and also covered disabilities.
autism, slow-learning, etc.
Mr. Sanjay Kaul also emphasized a tighter monitoring of the school health programme. He
requested the Education Department to work out the modalities of monitoring at District, Taluk
and Village level,
through DDPI, DPER and others.
He felt the necessity of feedback for
identifying discrepancy in data. He also felt the need for closer cooperation between Health and
Education departments and said that already he and the Commissioner Public Instruction were
issuing letters under their joint signatures. Also joint review meetings once a month (like with
the WCD department.) should be organised at all levels.
Dr. Thelma Narayan emphasized on the implementation mechanism. She felt the necessity of
proper training of teachers. ANMs and health workers (male), and screening of children on pre---------
1
"
I—
.
L-
iU<?
1
n
.1-
—’
n
- ■'
s
Dr. Sampath K. Krishnan suggested that out of school children could also be reached through
the schools if the teachers understood that the school was the focal point to reach all children in
the village (Dr. Ravi Narayan’s concept). This was readily accepted by all the participants who
j
felt that medical examination, deworming and distribution of Iron supplements could be carried
. ,v
out for all children in the villages (and not restricted to children within schools only).
Mr. Sanjay Kaul while agreeing to these suggestions wanted these to be budgeted for in the
HNP project.
He wanted CHC to meet with DPI (Primary Education) and Jt. Dtr. DSERT to
work out the finer details of the school health programme and also with Jt. Dtr. Nutrition
regarding the Iron supplements. He then closed the meeting after thanking all the participants for
a meaningful discussion.
03 <-W
jy.
Appendix 1
o-p
Date:
07 March 2001
Sl.No.
HNP Meeting in Department, of Public Instruction
Department
Name
1.
Mr. TM Vijay Bhaskar, IAS
Commissioner Public Instruction
2.
Mr. Sanjay Kaul, IAS
Commissioner Health & FW
3.
Mr. G.S. Hegde
DPI (Primary Edn.)
4.
Mr. T.M. Kumar
Jt. Director, DSERT
5.
Dr. S.B. Kurtakoti
Addl. Director (HET)
6.
Ms. Kiran Kamal Prasad
Jeevika, Bangalore
7.
Dr. Sabu George
CHC, Bangalore
8.
Dr. Jalaja Sundaram
Jt. Director (Nutrition)
9.
Dr. Thelma Narayan
CHC, Bangalore
10.
Dr. Pushpa Madjani
CM I
Dr. Sampath K. Krishnan
CHC, Bangalore
12.
Ms. S.N. Meera Devi
Principal, Bangalore Urban DIET
13.
Ms. B. Sushila
DDPI (Textbooks)
14.
Ms. Veena Naik
Sr. Lecturer
15.
Mr. M.R. Jagannatha
Sr. Jt. Dtr. DHERT
16.
Mr. H.S. Jayshankarmurthy
Sr Program Officer DPEP
17.
Dr. C.M. Francis
CHC, Bangalore
18.
Mr. S.T. Marulasiddappa
Jt. Director (I EC)
Urban
FIELD VISIT TO GULBARGA: THIRD REPORT
written in Bangalore, Dated October 5, 2000
Sabu George
Responsibilities at different levels of ICDS-WCD & related matters
NOTE. All these are what has been reported by the functionaries themselves in Gulbarga and
not picked up from Bangalore. This exercise took time; but it is essential to look at the
perceived job responsibilities in order to understand the constraints to proper functioning.
Assistant Director- WCD
Apart from ICDS, in charge of Correctional Homes, Women’s Welfare & Physically
handicapped. Because of the Panchayat system she has to spent at least 8 to 10 days in
attending meetings Apart from the routine meetings since the repair of Jeeps is sanctioned by
the Panchayats, she has to spend time pursuing jeep proposals to release maintenance money.
Note neither the Jeeps of the AD 'or that of the District ICDS Project Officer are on road. The
Programme Officer has been in Gulbarga since 1988 and for 5 months till recently was the
AD- In charge. For last two years she has not been able to get her Jeep repair sanctioned.
Presently, the AD has borrowed a Jeep from one of the rural CDPOs.
It is important to mention that the new AD has come from Hubli where she was at the
State Home for Women. For last 10 years she was away from the ICDS system. Not
surprisingly, senior CDPOs in the District privately say that she knows little about its present
functioning let alone about Gulbarga. Obviously, she did want to come to the field with me so
she assigned a rural CDPO to come with me on the following two days. Despite being new to
Gulbarga she asserted that measles coverage is good in the District as we do not see Measles
epidemics now! Either ignorance or not being honest. Whatever the case is, it reflects badly
on the senior staff of the ICDS system. (RCH Survey 1999 report measles immunisation was
barely 30%). I jjevgr found neither the Health nor AWWs give priority to measles
immunisation in any of the 3 taluks I visited.
I
2
I appreciate that both the AD & Programme Officer were very generous in highlighting
the difficulties caused by the Panchayat System (Wait for the next reports in this Gulbarga
series) Wish they could be equally candid and responsible about their own Dept
CDPO
Responsible for implementation of 12 to 13 programmes at the taluk apart from ICDS.
Note several of these do not get Budget allocations every year. But the sporadic functioning
of these dole out/loan schemes results in aggravation to the CDPO from the potential
beneficiaries.
I.
Manebelaku
Giving loans with 25% subsidy for self employment activities. Last year given 10
women (each 25,000 Rs).
2.
Udyogini
Loans with 40% subsidy for SC/ST women. Last year Banks gave no one as there was
no applicant (?)
3.
Adolescent Programme
This year there has been no implementation as no Budget. Expect to begin next
month 300 girls are covered. From 100 AW Centre 3 women.are selected of 11 to 15 years
of age. They get 3 days training. Health Dept. Officials also provide health education. For 6
months they are beneficiaries of the Centre. These girls are supposed to look after the AW
centre.
4.
Tricycles for physically handicapped
5.
Maternity allowance
500 Rs for Is1 and 2nd pregnancy. Below poverty line women are covered. This
allocation comes from the DC’s fund and money is sent by Money Order.
3
6.
Balika Samruddhi Yojana
Given to the first girl child only. 318 girls were given last year. 500 Rs. is given to the
mother as a post delivery grant.
7.
Namma Magalu, Namma Shakthi
Last year not given because LIC did not cooperate. This scheme was started in 1996-
7 to promote education of the girl child. In 1997-8 11 girls were given Subsequent years not
given. This is for families with a maximum of 3 children. Either the mother or father has to
get sterilised. The beneficiary is a girl child. For the year 2000-1, girls born in 1993-4 are
eligible 2500 Rs. is deposited in LIC. The following amounts are paid as Dividend per year.
Finally, at age 18 Rs. 4010 is given The girl is supposed to go to school till 18 years and get
married only after 18 Thus the total payout=8400.
8.
After 6 to 9 years
-200
10 to 13 years
-300
14 to 17 years
-400
Rural girl children attendance scholarship
To encourage girls to pursue education and improve their educational level. The girls
get the money every month thru the Head Master From 5th to 7lh is 25 Rs., and from 8'h to
10th 50gs.
A
9.
Jagruthi scheme
This is only in 2 taluks in Gulbarga. Girls aged 15 to 18 are covered. To create
awareness among adolescent girls about health, hygiene, nutrition, family welfare, child care
and home management. 31 girls were covered. Health officials spent 3 to 4 days on
instruction. The girls learn of the services of the AW Centre. Help AWW in village surveys
of school dropouts. Motivate them to return to schools. A ladies cycle is given for continuing
4
education. (In the CDPO store I found several new ladies cycles). After 1 year give Rs. 1000
NS Certificate and a First Aid kit.
10.
Navajivan
Only for widows. Not given this year.
11.
Adhara Scheme for physically handicapped
This is for 3 persons per Taluka. 6000 Rs and steel material for 6000 Rs is given to set
up a small shop.
Further, in Chincholi taluk 4 camps for handicapped were organised 1725
handicapped participated. Hearing aids, artificial limbs etc. were provided
12 Devadasi Remarriage Scheme
Rs. 10,000 is given to each pair. Last year 1 girl was to be given but no Budget.
A Senior CDPO mentioned that the Labour Dept, has given them additional
responsibility as “Child Labour Inspector”. They have to survey children working in
hazardous and non-hazardous occupations. The job is to reduce child labour and give children
the benefit of going to school.
The CDPOs have to attend mandatorily large number of meetings.
1.
3rd is Accountants meeting of the WCD.
2.
5,h is the Karn. Devlp. Programme Meeting at the Taluk Panchayat.
3.
7th is the District level review meeting of WCDVHealth
4.
Sometimes Zilla Panchayat calls them for Social Justice Meetings
5.
Taluk Panchayat Meetings. In fact the CDPO was at one such meeting when I went to
the CDPO’s Office at 11.00 AM.
6.
For four days in end of the month there are Sector level meetings at each PHC (There
could be more than 10 PHCs in each Taluk).
5
7.
Sakshratha meeting
The CDPO rightly said that they do not know who they are accountable to. WCD,
Panchayat or the DC? Last month the Deputy Commissioner directed him to do a Survey of
bonded labour in 25 villages
AWW
The following were elicited from a group of 3 Workers after even the CDPO
intervened. Immunisation, Home visits, Weighing, Pregnant women education, cleanliness of
children, Preschool education, Balika Samruddhi Yojana, Namma Magalu, Namma Shakthi,
Maternity Benefit scheme, Stree Shakthi, Family Planning, Electoral voters card (1 day),
Leprosy Survey, Cataract Survey, Issuing Ration Cards (Green & Red).
Conclusion
Note of the 112 ICDS Supervisor positions a mere 12 are filled up in Gulbarga
District. Seven of the 15 sanctioned ACDPOs are vacant. Given the large number of
schemes^innumerable meetings where will the CDPO get time to supervise even the
functioning of several hundred Anganwadis let alone think of improving the nutritional status
of children. Certainly giving out money gives the CDPO more prestige and rewards than
improving the physical well being of children.
The promotional avenues in WCD needs to be reorganised. ICDS should be kept
apart as a separate cadre. Pre-school children deserve significant priority and therefore should
not be mixed up with Correctional and other streams within WCD. This suggestion if
considered will assist in giving Nutrition a priority in WCD.
<f 2.
N
O s
2
—---- l~iy
AdLsvx.
AC-TIV6
I l^/o L v£A1£
i^ATior^
?\1T
Nco'r
OF
M£i|CAi-
l£<;
tjoi-uesE^
NUcU.
lrJf=/?ASTXuorcz/se
■-
3.
Mop
1EG
VI. SYMPOSIUM AND WORKSHOP ON ZINC
Symposium and Workshop on Zinc and Health in South Asia This workshop was conducted m Dhaka, Bangaladesh organised by ICDDR, B: Centre for
Health and Population Research and co-sponsored by UNICEF and the Sparkman Centre of the
University of Alabama-Birmingham, USA
Scientists, planners, and policy makers reviewed
recent research on the relationship of zinc intake/supplementation to child health and nutrition,
defined the implications of the findings for programs and policies, and developed recommendations
for future research.
Research finduigs from both published and as yet unpublished studies were presented on
the role of zinc in the treatment of acute and persistent diarrhea, the prevention of diarrhea and
pneumonia, the treatment of severe protein energy malnutrition and other outcomes.
Several studies (Bangladesh, India, Indonesia) produced convincing evidence that zinc
supplementation of children with acute diarrhea reduced diarrhea severity and the evolution to
prolonged diarrhea (i.e , lasting longer than 7 days).
Studies on tlie role of zinc to prevent childhood diarrhea and pneumonia (Bangaladesh,
India) revealed benefit only in children who were malnourished or older titan 12 months.
In view
of findings from Latin America suggesting wider benefit, tlie south Asian results perhaps indicate
zinc has greatest benefit in older and more malnourished children, although one study (Bangladesh)
suggested a worse outcome of severely malnourished children using a higher dose of zinc. Neither
long duration (Bangladesh) nor short-duration (Pakistan) supplementation of undernourished
children had any effect on growth.
One study (India) reported a positive effect on the level of
child’s activity and, together with previous reports from other regions, suggests a positive impact
on childhood development and cognitive function with zinc supplementation.
Safety issues of zinc supplementation were reviewed and tire potential for adverse effects
of zinc on copper nutriture and immune function, especially in malnourished children or with
chronic use, was agreed to been an area where more information is needed.
The group ultimately recommended tlie following :
1.
Children with persistent diarrhea (duration >=14 days) and all severely malnourished
children (i.e. < - 3Z score weight for age) should be treated with zinc during tlie course
of illness; 20 mg elemental zinc daily was felt to be appropriate.
2.
Although children with acute diarrhea also benefit from zinc supplementation, further
studies related to effectiveness, cost and practical feasibility are needed before a
general recommendation can be made
3.
At this pouit, it was concluded that large-scale intervention programs in populations
for disease prevention could not be recommended.
4.
Zinc should not be promoted as a “magic cure” for acute watery diarrhea.
Although
efforts to improve zinc intake may have a role in programs to manage diarrheal
16
Q.N.L., KIISDP, IV Issue Oct-Dec 98
disease, care must be taken to avoid promoting zinc supplements as a new wonder
drug Ways to optimise zinc intake would need to be part of a combined approach to
diarrhea treatment and prevention that includes promotion of oral rehydration solution,
general nutritional therapy and advice (breastfeeding, appropriate refeeding), and
sanitation (hand washing, proper disposal of excrement)
Source : Volume - 35, December- 98(Indian Pediatrics), Page. No: 1193
17
Q.N.L, KHSDP, IV Issue Oa-Dec 98
STRENGTHENING NUTRITION INTERVENTION IN THE ICDS
PROGRAMME WITH WORLD BANK ASSISTANCE.
1. GOALS:
«>■ To further improve the nutrition and health status of the people of Karnataka with an
emphasis on the marginalised sectors of society, such as women, children under two
years and SC/ST by strengthening nutrition interventions through ICDS.
To strengthen the functioning of ICDS with community participation including NGO
and private sector involvement.
***
To focus on equity, with quality of services, making explicit efforts to nurture and
increase motivation of ICDS staff.
To work within a time frame, with regular reviews and transparency in functioning.
2. VALUES:
The underlying values will be equity, ethics, accountability, concern and respect for
people, democratic functioning, respect for local knowledge and culture in nutrition.
These will set the tone or the ethos for implementation. Reviews will need to consider
how much these have been internalized and what difficulties are faced in these aspects.
3. GUIDING PRINCIPLES FOR IMPLEMENTA TION:
a. Integration - moving from vertical programmes to horizontal integration of services
at district & state level. More specifically health, nutrition and population services to
be integrated.
b. Phased decentralization - moving towards district level planning and management,
using information from Anganwadis through nutritional surveillance. This will allow
for responsiveness to local problems, with scope for innovativeness and initiative by
district and sub-district personnel.
c.
Building partnerships
i.
By intersectoral linkages between and within departments
ii.
With NGOs for participation in planning, implementation and
evaluation.
iii.
With the private sector for participation in state health and nutritional
plans for provision of quality services.
iv.
With peoples organisation by providing free access to information and
encouraging feedback.
v.
With other sectors like education,
Development and Panchayati Raj.
PDS,
Agriculture,
Rural
vi.
Social inclusiveness, particularly of excluded groups with their active
vii.
involvement in all levels of services.
Community participation and involvement at all levels ofplanning
viii. Gender sensitivity - across all levels.
4. OBJECTIVES :
The general objectives for a six-year period (2001-2007) are outlined below. Indicators
will be developed regarding achievement of objectives. The Logical Framework Analysis
will be used for identifying means, resources, activities, persons responsible and time
frames.
Problems are deeply embedded in social structures, therefore the choice of objectives is
based on needs, the likelihood of a nutrition intervention making an impact; and cost
effectiveness, given the available resources.
The objectives are :
4.1 Public Health & Nutrition Care
4.1.1. Improve nutritional levels, particularly of children (focussing on under
two’s), adolescents and women, by reduction of undernutrition and nutritional
deficiencies, such as Vit. A, Iron and Iodine. The growth differentials between
boys and girls needs to be reduced.
4.1.2. Improve health of school age going children and adolescents through a mix
of medical, nutrition, health promotional and educational efforts.
4.1.3. Health Promotion <& Empoyverment, particularly of women and young people
through sharing of information and health promotion activities enabling people
to make healthier choices and to demand better health and nutrition services.
4.1.4. Redress Regional Imbalances & Disparities. Actively work to reduce
regional imbalances.
4.1.5. Improve nutrition access to women and SC/ST communities
4.2
Partnerships
4.2.1
Develop specific functioning mechanisms at local district and state levels for
better intersectoral coordination.
4.2.2
Strengthen capacity of Panchayati Raj and Nagarpalika Institutions for
greater responsibilities and roles in nutrition. Active efforts to involve elected
women representatives will be made.
4.2.3
Evolve mechanisms for involvement of the private sector at different levels
with quality assurance. Work actively with the NGO/voluntary sector.
4.2.4
Promote and support locally available food stuffs based on the existing dietary
patterns.
- 3-
5. EXPECTED OUTCOMES:
5.1 Quantitative indicators of improved nutrition status:
Table 1 : Specific goals to be achieved over the next six years:
1.
Life expectancy at birth in years
71 for women, 70 for men
2.
Crude birth rate
17/1000
3.
Crude death rate
7/1000
4.
Infant mortality rate
25/1000
5.
Under - five mortality rate
< 35/1000
6.
Maternal mortality rate
< 199/100,000 live births
7.
Nutrition status of children
Progressive improvement planned
Severe undemutrition
<0.5%
Moderate undemutrition
10%
Mild undemutrition
60%
Normal
> 30%
8.
Anaemia among women
<20%
9.
Anaemia among children
<40%
10.
Newborns with low birth weight < 2500 gms
10%
5.2 Qualitative Indicators :
External cum internal reviews will be conducted using qualitative research methods.
They could focus on:
a) Mechanisms for community involvement at local, district and State level.
Participation of all sections of society.
b)
Linkages with Gram Panchayats and Zilla Parishads.
c)
People’s feedback and perspectives on functioning of Anganwadis. This
would include staff attitudes, payment systems and quality of services.
Feedback to include the views of women / SC/ST and the poor.
d)
Reduction in regional disparities.
e)
Feedback from Anganwadi workers, helpers, supervisors, ACDPO's,
CDPO's regarding working conditions, job satisfaction, continuing
education, feeling of self worth.
5.3. System Indicators :
a.
b.
c.
d.
e.
f.
Staff position including vacancies.
Condition of Anganwadis buildings
Supply systems for nutrition supplements
Transport - vehicles, drivers, POL.
Utilisation of 1CDS services
Availability of functioning weighing scales.
STRATEGIES
These will be developed further using a consultative and evidence based approach.
6.1. Nutrition
Nutrition, which is a basic determinant of health status, has been grossly neglected
by the health sector in Karnataka so far. Recent data from NFHS II and NNMB
provides evidence of a high level of under nutrition among pre-school children in
Karnataka. Though there have been some improvements in the levels of severe
malnutrition there has been persistence of moderate and mild levels of malnutrition
However, the nutritional improvements in Karnataka over the last 2 decades have
been far less than that observed in TamilNadu. Therefore nutrition is taken up as
a priority with specific interventions by the health sector, and with intersectoral
linkages with the Departments of Women and Child Development, Public
Distribution System & Civil Supplies, Agriculture, Rural Development, Panchayati
Raj & Education. The health system needs to be accountable for the poor
nutritional status of the population.
6.2. Broad strategies include:
Growth monitoring, health check up, therapeutic feeding of under nourished
children, pregnant and lactating women. Improved coverage of and quality of
ante-natal services and enhancing outreach of services to disadvantaged regions
and groups are planned. Major focus is on under two children. Effective
communication to enable mothers and communities to provide better child care by
focusing on feeding practices will be attempted. The nutrition component will be
strengthened by creating a Nutrition specialist at the District level. Finally steps
to involve NGOs, elected women representatives, panchayat officials and others in
the “District Facilitation Unit” so as to improve the functioning and to create a
greater sense of ownership of the programme will be attempted.
6.3. Specific strategies
Child Nutrition particularly of under-twos, from the period of conception, is of
highest priority. The strategy aims at reaching the under two years of age
children. Presently, this most vulnerable segment is largely missed out. Our
objective is to prevent onset of malnutrition rather than to wait till the child
becomes malnourished.
This will be possible by either enhancing the existing Anganwadi Workers’s salary
or to have one additional “Community Nutrition Volunteer” (CNV) for each
Anganwadi. The volunteer who will be paid a modest honorarium will primarily
carry out outreach activities at the homes of mothers and children. These
volunteers will educate mothers to enable them to provide better child care.
Closer collaborative mechanisms between departments of Health, Women and
Child Development and Panchayats particularly at the local level in the functioning
of Anganwadis (AWs).
Vacancies of Anganwadi Supervisors to be filled urgently (currently there are
approx. 660 in position out of 2000 posts to cover the existing 40,000
Anganwadis). Their training is limited, though the training initiatives in 1999
have started to remedy this.
Rapid turnover and transfers of CDPOs are noted. The same person to be in a
taluk for at least 3 years. Only women should be appointed as CDPOs
henceforth.
Need for persons with nutrition training and experience at senior positions at
state and district levels. At the District level a District Nutrition Officer will be
appointed. This officer (preferably a woman, Masters in Nutrition) who will be
responsible for regularly upgrading the nutrition knowledge and practices of the
CDPOs, ACDPOs, Supervisors and Anganwadi workers.
Involvement of Gram Panchayats and monitoring decentralization to ensure
that the poor have access and benefit optimally.
The strategies for under two children include mothers education and
supplementary feeding in areas of need.
Micronutrients like Iron supplementation for children, adolescent girls, women
and men when required. Vit. A supplementation and Iodine where required.
Regular deworming.
The importance of the PDS in providing food & nutrition security for the
poor.
Health & Nutrition Education Communication strategies to promote crucial
nutrition messages related to feeding and care will be developed. Various media
such as television, radio, print, posters, booklets, folk media and wall writings will
be utilised to promote messages on weaning, breast feeding, oral rehydration etc.
Popular awareness of the causes and the prevailing extent of malnutrition will be
disseminated.
Special efforts to identify the lacunae in interpersonal counseling skills of
Anganwadi workers and remedial training programmes will be undertaken.
Innovative approaches in particular communities will be documented and
publicized so as to motivate similar successes elsewhere.
Education regarding nutrition at all levels of the health, WCD and education
systems. Nutrition education as part of health promotion.
Finally it must be remembered that good nutrition is an entitlement, as
Amartya Sen calls it, with the need for adequate income or purchasing power to
buy food, or the means to grow food, or goods to exchange for food. Therefore
land reforms, employment creation, and income levels are critical to improve
nutrition.
~G-
Nutrition Promotion & Empowerment training for Leaders of women's groups,
from Mahila Samakhya, agricultural women's sanghas, DWCRA, NGO women's
groups.
Reach out to the community using different methods of communication from
interpersonal modes, mass communication through Jathas and street plays
Nutrition Surveillance Though Taluk level data is routinely reported to the State
there is little use of this information for action at lower levels. Presently, given the
shortage of functioning weighing scales, the limited supervision and inadequate
coverage of under two children the quality of the data is not adequate or reliable.
Remedial action to improve this will be taken. The weighing skills of workers will
be improved where necessary. Monitoring capability at several levels-Taluk,
District and the State have to be improved. The long term objective is to develop
a nutritional surveillance system for active intervention so as to ameliorate the
slipping of children into moderate and severe stages of malnutrition. Of course for
ethical reasons the rehabilitation of severely malnourished children who are at
exceptional risk of death will also be carefully watched. Non-reporting of any
moderately or severely malnourished children to the centre or inability to be
weighed needs to be acted upon.
A system of checking the functioning of weighing scales will be established at the
District level. Routine calibration of all weighing scales will have to be
undertaken at least once every year and necessary repairs will be undertaken.
Specific efforts will be made to reduce Regional disparities by strengthening
infrastructure, personnel and other inputs. This will cut across most strategies.
Special efforts will be made to identify tribal related problems so as to take
remedial actions
6.4. Health system, issues, training and management :
Human Resource Development is the core thrust of this project. Orientation
courses, in-service training, continuing education and skill development through
'UDISHA' (existing WB aided training programme of ICDS) will make the 1CDS
a more effective organisation.
Management Development by strengthening management capacity at all levels
through training
Procurement and supplies systems to be modernized and made transparent.
6.5. Partnerships
Intersectoral co-ordination This will be actively attempted with Dept, of
Women & Child Development, Education, Rural Development and Panchayat Raj,
PDS, Agriculture, Social Welfare Board etc at the state, district and Anganwadi
level for the success of the ICDS.
- 7-
District Facilitation Unit A key individual in this Unit will be the District
Nutrition Officer. An important function will be to improve the intersectoral
coordination between the Health WCD and other Departments to ensure the
optimal functioning of the ICDS system. The District Officer though appointed by
the Health Department will be positioned in the District ICDS Office. The tenure
of the District Nutrition Officer will be in the same District for the entire project
period and is non-transferable. Joint training and even supervision of health and
Nutrition staff will be carried out.
The District Facilitation Unit primary
responsibility will be to enhance the coverage and quality of the Anganwadi
services. The District ICDS Officer and the Nutrition Officer will be members and
responsible for organizing monthly meetings with other District level Department
officials. The unique feature of this Unit is that it will have representation from
credible local NGOs and public spirited individuals who will be involved in various
activities to promote awareness of the significance of nutrition. Presently, the
ICDS system is perceived to be only a feeding programme. The importance of
other aspects like breast feeding, care, improved sanitation, hygiene, measles
immunisation, deworming, Vitamin-A and Iron supplementation will be emphasised.
Social mobilisation for improved nutrition of all children will be the goal. The
District Facilitation Unit has an important role to play in the long term
sustainability of the project even after the external Bank funding stops.
Traditionally schools were maintained by community contributions in villages.
Efforts along with sensitised elected panchayat members will be launched for
supporting Anganwadi workers and improving the Anganwadi infrastructure.
The proposed micro-credit programme (Stree Shakti) where AWWs have
responsibility will be another potential source of support in order to reach out to all
families to ameliorate growth faltering and thus lessen malnutrition.
State Coordinating Unit in Health Dept, under the Health Commissioner with
the primary purpose to give Nutrition adequate prominence in the Health Sector.
This will be responsible for the overall coordination at the State level with the
various associated Departments. Inclusion of appropriate nutrition messages in the
various 1EC programmes of RCH etc. will thus be ensured.
Karnataka has been successful in bringing about a relatively steady decline in underfive mortality. However, significant improvements in nutritional status of pre
school children is imperative to ensure that the pace of decline in mortality does not
slow down over the coming decade. The project also aims to improve the quality
of life and reduce morbidity by improving nutritional status of children. This is
particularly important in Northern Districts where child mortality still remains the
highest. (One major cause is unacceptably high levels of malnutrition). A rapid
decline in the child mortality levels in the North is the quickest way to ensure a
speedy demographic transition to below replacement levels for the whole state.
- 8 -
6.7. Empowerment of members
Panchayati Raj institutions (PRIs) are mandated constitutionally to form part of
governance structures for effective nutrition & health care. To enable and equip
members to play an effective role, empowerment training of newly elected
representatives of PRIs for nutrition may be conducted by the DWCD in
collaboration with other agencies
7. BUDGET
Tentative costing for nutrition component of World Bank aid for HNP project
Improving nutrition levels
@r
Investment costs
30.0 Cr.
Recurrent costs
40.0 Cr.
Total
70.0 G-
PRIVILEGED COMMUNICATION
Not to be circulated or quoted
Bagalkot visit continued
Observations about Doctors and Health
The ‘new’ Doctor from Udipi has been newly appointed by KHDSP. He had completed
MS about 6 months ago and was working in a North Kerala private Hospital. This was the first
time in recent history that Doctors did not have to bribe to join the Govt. Service. Earlier, he was
asked 6 lakhs as bribe when he was selected for an Ophthalmology post in a Govt. Medical
College in Bangalore. The ESI job he got demanded 2 lakhs.
He came thrice in three weeks to Bagalkot to join. The first time the PHC which the
DHO said was vacant had a Doctor. The second vacant PHC which he went that day had a
Doctor who was already transferred to the Health Minister’s Constituency in Gulbarga. The new
Doctor was advised the transferred Doctor not to join here. Following which the DHO asked the
new Doctor to come next week. The second week he came the DHO was considerate in giving
him time to see if he could go and explore the possibility of finding a vacancy in his home
District. He claimed that his father in law has good connections with the Health Minister. But
the advice from Bangalore was first to join and then the transfer could be arranged. Thus this
third visit to Bagalkot. The PHC we visited was functioning despite the holiday due to the exCMs death. Several nurses and staff were on duty at 11.30 am when we reached. The in-charge
Doctor was expected to come. (In fact three hours later I saw him operating).
The nurses said there was shortage of water in the PHC quarters. (The village people said
there was always water in the village and I saw a huge overhead tank. Sometimes the pump
fails). The Doctors quarters was partly occupied by a Nurse who promised to vacate when he
joins. But the new Doctor said not to vacate- “At least I can get hot food. My rich wife, the only
daughter of a famous Bangalore restaurant chain would never come and stay under such
conditions”.
This new Doctor then left to see the other PHC which he was asked to go so as to make
the choice.
The old Doctor whom I met in the remote PHC close to the Border is an exceptional
Govt. Doctor. Unusual in that he worked for 3 years with a NGO- IDS in Dharwar. Later he
spent 15 years with ACC in remote places in Maharastra and Bihar. Now has been a contract
Doctor for more than 4 years. He said he came back to Karntaka because he had land. His son
was staying in the town with his parents to go to College. He had taken over this PHC 2 days
ago. When I met him at about 3pm, he was in the Main Village with a Taluk Health Official.
They had just finished a talk on RCH to the Panchayat members.
The Doctor’s quarters was in a dilapidated state and therefore he could not move in. But
he is confident that it will be repaired soon. There is no other Doctor in the vicinity of the group
of 5 villages or so and therefore the Panchayat is also determined. The 16 km road from
Highway is in bad shape.
The old Doctor said that the previous Doctor came only for 2 hours. The young
Pediatrician had his own clinic in the taluk Headquarters. Despite complaints from the people he
did not bother to stay at the Centre. This Pediatrician opted for a new PHC which had no
building, quarters so that he could continue his private practice smoothly in the Taluk HQ. Was
informed that these days there is tremendous pressure on the DHO from the top to make Doctors
stay at the PHC. Previously, when a Doctor was the top State Authority, he never enforced the
rules. Now that an IAS Officer is in charge of Medical Doctors rules are being followed.
STILL MORE ON BAGALKOT VISIT
Sabu George,
(Written in Trivandrum & Bangalore) Final draft dated August 26, 2000
FOOD, POLIO AND OPTIMISM
Pulse Polio in Bagalkot
In June & July 2 more rounds of pulse were undertaken in 10 Districts because of one polio
case in Bagalkot. This was the only one in the whole of South India so far in the year 2000. My
conclusion is that it was not done well (Have evidence).
Another case of AFP in the Raichur border village was been discovered two weeks ago (and
later in Bangalore was informed that it was not polio). Learnt of the arrival of foreign WHO visitors
to oversee polio eradication efforts in Belgaum and Gulbarga. Wasting public money by throwing
it on excess vaccine and white overseers is sad and not safe(Vaccine induced polio). This of course
does not absolve the failure of the Health Dept, and the civil society to properly cover all
unimmunised children. In the strategy of pulse flooding the children and the country with vaccine
there is an implicit presumption that reaching everyone everywhere is not necessary. Hope that God
is merciful enough to forgive such human follies, otherwise we are in for more rounds and the target
of eradication keeps being extended. Yes, there has been a remarkable decline of Polio cases in
Karnataka over the last 3 years; but at what cost? and of undermining the regular immunisation
coverage. Not surprising for a vertical programme dictated by International donors and meekly
followed. What a sad reflection on the health system and on ourselves!
ICDS Food
Hi-energy food not popular as per AWW and CDPOs. People perceive that it causes
diarrhea. The perception was that it is bulky for young children is correct. In Badami taluk, the
CDPO said that rice from the PDS was delayed and therefore for 3 months Hienergy food is being
distributed. In Hunkund taluk the Statistician who was in the Office told me that there was no delay
in getting the PDS stocks. They have several hundred kilos in stock.
A CDPO said that rice is what the people like. But the lack of caloric density was pointed
out by the CDPO. Was informed that the ICDS Director Muniappa prefers rice but he is unaware
of the effort involved in cooking. The Helper could spent up to 2 hours to forage for firewood. 3
years ago good food was given-ready to eat Powder-Upma. This was discontinued. Another official
said many years ago CSB (Corn soy blend) was provided-but discontinued as it was expensive.
There was consistent demand for an alternate to Hi-energy stuff.
Food has been a great source of aggravation for the staff.
Food is the major problem highlighted in relation to Anganwadis. That such a progressive and
functioning state like Karnataka has not cared to do so reflects very badly on the state.
Acknowledged that in general pregnant and lactating mothers do not get the food they are supposed
to. Older children eat up these rations is what I am told by one source.
Conclusion
There have been surprises, like a sincere CDPO asking me why the Dept, cannot provide
bathroom scales like in the PHC. She was unaware that regular monitoring of pre-school children
with such imprecise balances is not useful. I have seen this practice in some AW centres outside
Karnataka. Another shock was when a CDPO suggested instead of providing food for children let
the state give parents money. We perhaps do not understand the fury of the people for the inability
of the State to ensure continuous feeding.
The possibility that nutrition education can facilitate better growth of impoverished children
of socially backward families appears limited. There is so much preoccupation with food and its
regular delivery, that just like the masses; even the senior District officials seem to believe; that food
is the primary solution to the malnutrition problem. This perhaps should have been expected given
little refresher training; the poverty of Nutrition expertise at Bangalore- within the Dept, or in
N1PCCD and the priority given to the well being of children by the Government.
This visit to Bagalkot and the earlier experiences there have convinced me that there are
number of officials in the Karnataka Govt. Depts.- PHC Doctors, CDPOs and Anganwadi workers,
Taluk Health officials who are doing a good job despite constraints. Many of us despite our concern
for the poor would not have the courage or resilience to continue to serve under the prevailing
conditions should be kept in mind. The very fact that 250 Anganwadi workers were overseen by the
CDPO herself (14 supervisory posts including both the ACDPOs vacant for more than 3 years) is
admirable. I was surprised to hear from 2 Doctors that there were just 2 medical officers positions
were vacant in the District. And that too, one was caused by the accidental death (motor-cycle) of
a young Surgeon the previous month. If this assertion is true than the Doctor vacancies that we hear
in the media is exaggerated.
On the heavy rainy day I visited Hungund PHC, I was informed that the Taluk Health
Educator had gone away to a far away village for a talk on RCH. The staff even told me that I will
find him on the road reluming on his motorcycle. I was suspicious but did find him in that remote
village three hours later. He was very knowledgeable about the whole taluk and seemed to be
genuinely concerned with his work. Deeply impressed that he bothered to come so far on bad roads
in heavy rains on his motorcycle. That even on a Holiday (due to ex-CM death) I could meet the
DHO at the office in the morning, find a PHC with many patients, staff and a Doctor; suggest the
functioning of the Health system may not be that bad as it is made out to be.
Therefore, even if there is indifference by some at the State level we have an obligation to
the malnourished children to attempt to do whatever we can to improve the system. We do have to
be seen by lower level people of taking up their problems at the state level. Thus we will have to
earn- on despite the distress caused (to ourselves) by working with the system. No promises that
elimination of malnutrition will take place by the end of the project but that the state can make a
difference to the survival and well being of tens of thousands of seriously affected children.
Therefore, we have to strive to get Health and WCD to give Nutrition a greater priority. Though our
children's nutritional problems have remained largely the same over the last two decades but
Nutrition knowledge (particularly on the consequences of malnutrition), practice and therefore the
paradigm of nutrition interventions have all undergone changes. This needs to be shared (and our
understanding deepened with appropriate actions at the local levels) with the ICDS system starting
from the top with the WCD Secretary & ICDS Director. Even later for some reason if we do not
make much of a difference to our children’s status despite our genuine efforts; at least we would be
true to our consciences. Far too often in the NGO sector, we have been criticising and advising the
Government but not working with them for the betterment of our poor.
I am sure that 1 could learn more about possibilities of improvement if better rapport and trust
with the concerned District, taluk and village level officials; and communities are developed. This
needs more time and field visits. Some responsiveness from the State level to at least one of the real
field problems would also help.
Email : klisdpJs'giasbgOl.vsnl.net.in
ARVIND G. RISBUD, ias.
Karnataka Health Systems Development Project,
1st Floor, Public Health Institute Building,
Seshadri Road, Bangalore - 560 001.
Project Administrator &
Ex-Officio Special Secretary to Government
Health and Family Welfare Department
KIISDI7PA/QM-44/2000
Dear
28:8:2000
V’ v-j» j I -re (
KHSDP recently organised a workshop for Doctors and para-medical staff of 13
districts in the areas of Blood Bank, Maternity care and Equipment maintenance for the
purpose of enhancing quality of services towards the ISO 9002 level. There was an
enthusiastic participation by about 40 people over two days.
A significant pointer during the workshop came from those handling
Maternity care services in Government hospitals. The most commonly noted features
as agreed in the workshop indicate :
* Maternity care is the single largest type of services delivered in a hospital
* The period of care made available in the hospital covers a significant portion
but not the entire period of maternity care which is needed by the expectant
mother
* The most commonly occuring crisis point in any hospital delivering
maternity care relates to availability of blood
* The most commonly noted feature is maternal anaemia which necessitates
the holding of large amounts of blood
Assured quality of maternity care in hospital becomes much simpler to support if
the expectant mothers are assured of health care support even before they enter the
hospital sub-system of maternity care.
I am writing this letter to you in the light of the fact that a DPR is being
developed for Karnataka in Health , Nutrition and Population under KHSDP funding by
the CHC, Bangalore. It would be appropriate to mark this issue for special emphasis. In
practical terms it would mean that the role of the ANM would have to be highlighted
sufficiently for awareness courses, distribution of IFA tablets-Z-monltbnng /appropriate ——
interventions which reduce conditions of anaemia and thereby help in larger number
of normal deliveries which can then be carried out at expectable levels of quality of
services. I believe that such an emphasis would be viable in terms of quantification ,
Bench Marking and evaluation in area specific terms.
v-.j,il
Sri. Sanjay Kaul, IAS
Commissioner
_ I , Directorate of Health & Family Welfare Services,
ct K
' Anand Rao Circle
Bangalore - 9
Yours sincerely,
<
WHERE DO WE STAND?
Printed on September 17. 2000 after several days of reflection
Sabu George
Major Concern
Are we all willing to wag our tails so that the Health Commissioner can get the 500
crores for the Dept, with the “least acrimony" on the mere assurance that the Project is going
to give Nutrition a priority ? Rather, should we not growl fiercely that under two child
A-W
’
~
———
Nutrition is beine sidelined so as to meet the immediate requirements of(he Dept. Thus the
well being of tomorrow’s adults will be sacrificed given the continued nutritional neglect of
under-2 children in Karnataka.
The Context
My brief discussions with Dr. Peter Heywood. World Bank at Delhi in early Sept, and
Mr. Sanjay Kaul. IAS on Sept. 14 are troubling (see below). Of course the past interactions
with the Commissioner at meetings and the ideological predilections of the Bank can not be
ignored. Further, the latest draft of the Project allocates a mere 30 crores w.hich Thelma
"
jiWf
AVuao-'. 3357 GCGTWZZTij r-WZ
agrees is inadequate for Nutrition.
' r
Peter Hex wood's radical!sin
Gave me 15 minutes without appointment on my second visit to the Bank. Spent
probably 20 minutes talking. On Monday morning at the first visit, the World Bank reception
would not even let me make a call to anyone.
Peter:- Since Karnataka finances are in doldrums the CM needs to be given realistic
proposals. The second AW Worker is not possible. The TINP model is not replicable. It is
expensive and 70% IDA rant would never be provided at all. Even acknowledged that TINP
by .hook or crook was det ermined to show success.
Therefore, we sb
Id think differently. Feeding has had no nutritional impact. (1
objected - one purpose of ood was a means to reach out to families and not an end in itself).
■
ICDS does not work. Scrap the present ICDS which caters primarily to above two. Let the
new ICDS only look after under two children.
Peter did not appear to be up to date on TINP nutritional impact. Surprised that he
was unaware of the NNMB data. Peter's radical comments do not deserve a response. Yes.
given the Bank's indifference to the developing world and to the poor: Peter might well be
rewarded handsomely for destroying what the Bank presently trumpets as the World's largest
lending programme in Nutrition (ICDS).
Commissioner Sanjav I<auI’s thoughts
Do not worry about the present ICDS. Look at the Task Force's suggestion on fbodWCD will not even accept it. Then how are we going to carry them along with our new
proposal. If we propose to linker with ICDS then the Bank will use it to want studies and
demand proof of nutritional impact of our proposals. The finance Dept will not accept the
second AW Worker. We can give an extra 25 paise per child per day from some other source
to WCD. Do not be emotional about nutrition. WCD fell that they were being attacked. The
tribal situation can be given priority in this Project. We will call other Nutrition experts who
can advice us to streng'
My response'. W.
n the existing ICDS programme.
should I not be passionate about children and nutrition. Certainly.
I would have joined the AS or the Bank iff had believed that these bureaucracies would have
improved the growth at
survival of our children. Giving importance to tribals only is not
adequate. Too small a’
oo scattered to have an overall impact on state levels.
The Commissio:
merely wants “some" strengthening of the ICDS. Please note that
the overall impact on cl
Iren’s nutritional status of such strengthening would be minimal.
This can give the Dept:
.'iter public image and reduce severe malnutrition under the most
optimistic scenario. Bi
tay have only little impact, if any on moderate levels. Therefore.
we have to ask for far i
. ■ than mere “strengthening" otherwise we are not doing justice to
the under mo children.
Am 1 uncompromising? What is the basis of mv choice?
I am willing to con promise on the nature of the Food. ie.. accept rice. This is to take
the WCD along. It will deprive calories of children, burden the Helper and perhaps facilitate
greater diversion. (We cannot ignore the impression that people like it). However. 1 will be
most happy if all of you could get WCD to accept something more caloric dense than rice and
curry’.
My compromise will send a message to the system that there are other components to
improving Nutritional status of children than food. There is too much preoccupation with
food and its delivery today in the ICDS.
Knowing that more than 60% of pre-school children are condemned to experience
serious stunting in their childhood, and their functional consequences: it is unethical to go
with the Commissioner’s present position. What if the Finance Dept, or the Bank are going
to be unhappy with the second worker and its financial implications? If necessary, we should
strive to attempt to convin ■ even the political masters about the significance of under-two.
We can try it as a pilot in cieor two Northern Districts.
Gandhiji used to say think of the poor when we have to make choices. Our joining
with the Govt, on the HN ? Project was on the premise that we will be able to take care the
interests of the poor and li
neglected (which STEM would not have done). 1 believe, it is
time that we take a stand (irmly on under-2 Nutrition. Ask for a second worker who will visit
homes. If we do not take : tnds then we are on a slippery slope slowly but inevitably drifting
towards the Commission 's agenda.
FIELD VISIT TO GULBARGA- PRELIMINARY REPORT
written in Gulbarga & Bangalore:
Sabu George
dated September 30. 2000
Expectation from Gulbarga visit
Spent 5.5 days over Sep 24 to Sep 28 in Gulbarga. Need to mention that the outcome
from Gulbarga will be limited by the fact that this is my first visit to the District. Unlike
Bagalkot. where I had the benefit of three months of prior contacts and knowledge. Further had
the generosity of the Sugar Mill resources (transport and human). The credibility of the Sugar
Mill being in interested in health related matters and had provided additional resources to the
Govt, was helpful. The hours spent with two Doctors in the jeep did not happen in this District.
The findings from this first ever visit to Gulbarga is largely dependant on what the Govt.
sources chose to share with me. Note that 1 can capture only what was translated to me in
English. What transpired in Kannada among the officials was obviously Greek to me.
Nevertheless, the cooperation from WCD sources in travel was generous. Thankfully, the Guide
CDPO knew English well and therefore saved time. The first field day the Jeep was available
from 8.30 AM to 8 PM. The second field day despite being a holiday- sacred Dassera Amavassi.
the WCD Dept, did provide me a jeep and a CDPO. The only reasonable request they made was
that they could come only at 9.30 AM and wanted to be back by 4 to 5 pm (we returned by
5.20pm). Mercifully. I had total freedom to choose the taluks and villages to visit.
Prior Contacts Established in Gulbarga
Had established contact with an old acquaintance who is an IAS officer in Gulbarga
(Young Idealist- henceforth YI). He is the only NLSU1 alumnus who has joined the IAS. He
was selected to IAS this year and Gulbarga is his first posting and had spent about six weeks
there. Through another friend who studied Nursing and did her community posting in St. Luke
i«i
■ '“if
r
, —'
a-
U. oJ A
Centre, Aurad, in rural Gulbarga came to know of Dr. Abraham a Christian Mission Doctor.
Thelma asked me to contact Dr. Shoba at CMA1. Thru Dr. Benjamin learnt that Shoba knew
nobod}' and Dr. Sukan Singh only Dr. Abraham in Gulbarga.
Places visited and people met
The first day was Sunday. Arrived at 4AM in Gulbarga Rly stn from Delhi (via
Secunderabad). Slept till 10.30 as was tired after a miserable 7 hour train journey-with a onefifth of a seat in the unreserved Compartment (including a 2 hour delay due to engine breakdown
enroute. 1 wanted to save time to reach Gulbarga fastest. I had a reservation till Raichur from
Delhi but from Raichur had to traverse back so chose to get down at Secunderabad). Though a
Sunday met people in the morning and afternoon. After washing clothes in morning went in
search of YI. Met the Young Idealist, YI, who was staying at the Deputy Commissioner’s house.
Planned the following 3 days. Decided to meet the Deputy Commissioner on Monday morning.
A lunch invitation from an Assistant Commissioner was declined as I wanted to meet Dr.
Abraham. Met Dr. Abraham at his house. Spent nearly 2.5 hours. Returned at 6.10 pm to the
Hotel. The evening dinner with YI was canceled when the latter knew of a music concert.
Understandably. Daler Mehendi (Punjabi Bhangra King) could not be missed by his lonely wife
in boring Gulbarga town. On subsequent days had a lunch and a dinner with them.
Monday morning met the Deputy Commissioner and CEO of Gulbarga. Note that official
days begin only after 10.30AM. No effort was taken to meet the Divisional Commissioner of
Gulbarga, the highest bureaucrat as he is very busy. A large number of disciplinary actions
against officials have to be taken by the Divisional Commissioner. This nice senior officer had
barely 5 minutes for the newly appointed YI. While his head was buried in the files he asked
why the YI should have even thought of joining the IAS!
Before lunch met the Assistant Director. WCD and the Programme Officer, ICDS of
Gulbarga & one CDPO of urban Gulbarga. After lunch went to the DHO’s Office. The DHO
went away with the Health Minister Malakka Reddy to Bidar where all the Govt. Doctors are on
strike following the assault on a Govt. Doctor while working in a private Clinic. Met briefly the
DHO in charge-lhe District Training College Principal. Spent time with junior level officials as
the RCH and Family Welfare Doctors in charge were in Bangalore for Training. Was at the
DHO’s office till 6 PM.
On Tuesday the WCD Jeep along with the rural Gulbarga taluk CDPO came to DC’s
house at 8.30 AM. 1 reached there before 8.40 and we left after YI instructed that tomorrow also
the Jeep be provided for half a day despite being a holiday. Left for Chincholi which is the North
Eastern taluk adjacent to Andhra. Met the Chincholi CDPO at his Office. Went to one village
and met 3 of the 4 AWWs living there. Finally visited a PHC, 30 km away from the Chincholi
town at the edge of Andhra. None of the two Doctors were there but spoke to the LHV. Later
we met the Lady Doctor while returning to Chincholi on the road. Flad a conversation on the
road. Efforts to meet the taluk Medical Officer on return to the taluk town after 5.30 pm were
unsuccessful though we went to several of his favourite places in the town. We returned after 8
PM to Gulbarga.
On Wednesday morning we met the ACDPO and the CDPO of Aland taluk at Gulbarga
itself. Though. 1 did not want them to come with me to Aland, my Guide wanted the CDPO to
come. Aland is the North Western taluk of Gulbarga and is adjacent to Maharastra. At Aland
town I wanted to visit the CDPO Office but the CDPO said he did not have the key. I did not
want to insist because it was a Government Holiday. Went to a village towards the Maharastra
border. Met the Anganwadi worker. Subsequently went to the local PHC seven Km away and
s
met the "Amazing Surgeon" (A£). Returned back at 5.30 pm to Gulbarga.
On Wednesday evening had Dinner with Dr. Abraham and he was kind to drop me at his
rural Hospital at 10 pm in the night. Because I did not want to take any chances as Thursday was
"Rajkumar Bandh”. The hospital is in Aurad village on the Gulbarga Hyderabad road about 15
km away in rural Gulbarga taluk. Slept at the Hospital Campus. On Thursday morning visited
two PHCs which were towards the Bidar border in the Northern part of Gulbarga District.
Visited two villages both away from the Main Road, one on the Western side of the taluk and
another on the Eastern edge. Returned back at 5.30 pm and left at 6 pm for the Gulbarga
Railway Station. The Social Worker accompanied me the whole day. To one village 4 student
3rd year Diploma Nurses (3 month posting) also came.
Rationale for the places chosen
At St. Lukes obviously I was limited to choose among the 18 villages where they were
working.
The far away taluks were selected among the 10 taluks of Gulbarga based on what I learnt
about the relative backwardness from many sources I met on the first two days. The southern
taluks are agriculturally prosperous because of Irrigation projects. Krishna river is the Southern
boundary of the District. The Southern taluks also benefits from river Bhima. I was also
informed that the senior Govt officials and even UNICEF confined their visits to the rural
Gulbarga taluk which is adjoining to the city. The only exception was when UNICEF Farah
visited Aland taluk but there again the decision appeared to be based on the closest village to
rural Gulbarga taluk.
Note that both the Anganwadi centres I had visited in the taluks of Chincholi and Aland
were never visited by anybody from outside Gulbarga over the last one to two decades. Once in
one village an official had come from Audit side.
In Gulbarga there are a total of 10 rural and 1 urban ICDS Projects. Obviously my
priority was rural. Note only a part of the total urban population of Gulbarga city is covered by
the Urban project.
Expenses Incurred
As there are 6 Ministers from Gulbarga the IB is always full with their ‘sidies’. 1 arrived
at 4AM and that was not the time to go to the IB. Later, twice I asked the YI for place but this
was not acted on. So I stayed in a Hotel near the DC’s Bunglow. The WCD also told me that
they often cannot get place in IB when people from Bangalore come for training. The Health
Dept. Staff s first response to Sanjay Kaul’s letter was that they neither had vehicles nor
accommodation. The In-charge DHO appeared least interested even in talking to me. Two days
used the WCD Jeep and the third field day used St Luke Health Centre Jeep. The travel to
Gulbarga from Delhi was largely met from non-CHC sources.
FIELD VISIT TO GULBARGA- FOURTH REPORT
Observations on the Primary Health Care System
written in Bangalore & Trivandrum
dated October 15, 2000
Sabu George
The Welcome from District Health Officials
The newly appointed DHO, Dr. Sunkad was absent on Monday afternoon as he had gone
away with the Health Minister to Bidar. The DHO belongs to the first batch of Gulbarga Medical
College. I got the impression that his surgical abilities and long service in various taluk Hospitals
have made him well known among the people.
Neither the Acting DHO (Principal of the Dt. Training College) nor his officials wanted
to see me. The Commissioner of Health’s letter was of little help. It caused displeasure.
Immediately after reading the letter his assistants said that they neither had jeep nor
accommodation. The Acting DHO said there were no problems or gaps in the Health SystemOnly the people needed education! And this too after my insistence that I needed his views. 90%
of PHC have their own buildings in the District. After some time the DHO’s sidies said that the
money allotted for transportation for each PHC Rs. 750 was woefully inadequate and it should
be doubled. All the PHCs should be provided with jeeps. At present, only some Taluks have
Ambulance. Then, I was referred to a Junior Statistical Officer for information.
I had to wait for about half an hour as the First Meeting of the District Panchayat
Committee on Health & Education after the recent Panchayat elections was going on. Several
politicians and the Deputy Secretary attended. The urinal inside the large Building was stinking
and was dilapidated.
The view from the DHO’s Office
However, the Statistical Officer was patient and sat till 6 PM answering all my queries.
He gave me the Report on Staff vacancies. I was also able to get a copy of the UN’CEF
supported Border District Proposal for Gulbarga. Earlier, the Health Commissioner in Bangalore
told me that there was not much money in it but provided some TA/DA flexibility. Dr. Nagaraj,
2
Acting Director, could not give me the proposal as somebody “ineffective” was in charge! In
Gulbarga only the Action Plan has been prepared. Action is still awaited. Dr. Muley, a Retired
Govt. Doctor based in Bidar is the Gulbarga District Consultant.
The Gulbarga Statistician could not explain a table on child deaths in the Report. He
could not tell me how many Sub-centres had no ANMs. Only that there was a total of 201 ANM
vacancies in the District (total =543). I was informed that the ANM vacancies have been
increasing over the past few years due to transfers away from Gulbarga, retirements and
promotions.
100 PHCs are functioning in the District and 17 CHCs. Five PHCs are not
functional. Informed that the staffing in the rural Gulbarga taluk is much better than that in the
other taluks. This is also the case in ICDS and other Govt. Depts. The difference between the
centre and the periphery of the District is not surprising. Learnt that the Health Minister
sometimes visits the PHCs in the District.
That a large number of PHC Doctors are not staying at the PHC was told by a variety of
sources. The last two recruitment efforts were not effective in filling the vacancies as most of
the selected candidates refused to join.
Presently, 72 Doctor positions are vacant of the
sanctioned 258. Of the 40 selected for Gulbarga by the KHDSP only 10 Doctors joined. I was
unable to find out how many PHCs had no Doctor. Asked but not provided.
Visit to PHCs
I went to a total of 4 PHCs in 3 taluks. The 2 PHCs in the Aland and Chincholi were
randomly selected. The criterion of selection was described in the first report. Ln rural Gulbarga
I was limited to Dr. Abraham’s villages.
In both the remote Taluks the PHC was functioning the day I visited. Incredibly, on the
sacred Amavasi Dassera the PHC was full of people at Aland. The Amazing Surgeon (AS) was
seeing patients and getting ready for Surgery. On the day of “RajKumar Bandh” neither of the
3
two Doctors had come for work when I visited after 10AM in the rural Gulbarga taluk. At least
in one of the PHC many other staff including LHV were present. A few patients were already
seen, hi the other PHC only the peon was there. Buses were running from the Gulbarga town.
I myself saw several buses on the Highway while going to and coming from the PHCs. Note that
both the PHCs were on the main Gulbarga Hyderabad Highway. There did not appear to be any
effect of the Bandh in the town. Two staff of the St. Luke Health Centre came in time at 9AM
by regular buses from the City. Thus, it seems that both the PHC Doctors were having a holiday
on the pretext of the Bandh. Two of the 4 PHCs had more than one Doctor. Note that the PHC
male Doctor of the Chincholi taluk PHC is also the Doctor in charge of another border PHC
which had no Doctor. But in rural Gulbarga PHC the second one was in a separate PSU
(Peripheral Service Unit).
Only 1 of the 4 PHC had a Jeep. This was reportedly not in working condition. Only 1
has a new building. Two had quarters for the Doctor. Though both were reported to be in bad
condition. In one place the staff were complaining that even the Doors have fallen down. They
have to accept the company of stray dogs which intrude in the night. A fear was expressed that
the buildings are in virtual danger of collapse. Only the new PHC had running water, hi fact
they have even a separate bore pump though the Main Water tank of the big village was in front
of tlie PHC. All the other three did not have running water, hi one case their only source- Hand
pump is shared by many and often mal-functions. Then the PHC has to depend on another hand
pump farther away. Two PHC did not have a boundary wall. This was a felt need. In one case
apprehension was expressed that if no wall will be constructed than private people might
encroach on the PHC land. Two of the 4 PHC buildings themselves had major leaks.
The AS complained that he had been asking for quarters for many years. Even when the
local villager was the District ZP President he could not get his need sanctioned. He lives in the
4
PHC itself. The examination room becomes the bedroom in the night. He has converted the
adjacent room into an attached bathroom. The roof of this room is leaking and a part of the wall
is open as some of the window has fallen. While talking to the Doctor, I saw a rat running in and
out of the wooden wall cupboard through a hole at the bottom.
hi the Chincholi taluk PHC even the autoclave was not functioning. Only tubectomies
and laproscopies are done in this PHC. A large number of sterilisations are carried out and the
sterilised instruments are brought from the Taluk Hospital 30 Km away. No cesareans are done.
About 6 deliveries a month take place. There were 8 tubectomies done the day 1 visited. About
70 had come to the OPD that day, the LHV said. The CDPO did not know how many PHCs had
no Doctors. He said it is there in the monthly report. I wanted a copy but could not get one.
hi Aland Taluk the CDPO informed me that of the 13 PHCs only 6 have Doctors. Only
3 of the 6 stay at the PHC Quarters the rest are in the City.
That both the rural Gulbarga PHCs had the full complement of their ANMs while both
the peripheral ones had vacancies was to be expected following the briefing from Gulbarga HQ.
hi Aland Taluk PHC 2 of the 5 and in the Chincholi taluk PHC 3 of the 5 ANM positions are
vacant. The LHV was there in Chincholi for last 2.5 years while in Aland had just joined. There
was no Block Health Educator or Compounder in the Chincholi PHC. Only 2 of the 5 Male
workers are working.
The Lady Doctor (LD)
Only one of the 4 PHCs 1 visited had a Lady Doctor. In Chincholi Taluk PHC there was
one Lady Doctor in addition to the Male Doctor. However, the lady was staying in the PHC
Quarters while the male Doctor commuted from Chincholi town. The Muslim Lady is on
contract appointment for more than 2 years. Alumnus of Gulbarga Medical College. The PHC
I visited was on the edge of the border with Andhra (1 km away). The Chincholi town was 30
5
km and the nearest referral Taluk Hospital was Zahirabad 25 km away in Andhra. The nearest
District Hospital is Bidar, 60 Km away.
Note that it take nearly 6 hours to come by bus from Gulbarga town to this border PHC.
Because of this, the Lady Doctor purchased a Scooter. While going towards the PHC the LD
was seen in the scooter going towards Chincholi. Three hours later and after our village visit and
return from the PHC we met the LD again on scooter (driven by a man). This time I got down
from the Jeep and managed to talk to the LD on the road. She impressed me as a determined
woman who has survived and continued to work despite odds. She said when she joined she had
no desire to stay on. She was wiling away time to go foreign.
But those plans did not
materialise. She is continuing because the Govt, will regularise contract appointments. (Later
I learnt that her Engineer husband was then working in the Gulf. But subsequently, her husband
has started business in Gulbarga town). She was very disappointed with the lack of support from
the Govt. In this remote area there was no way that;
villages nestled in the forests miles away could be visited without transport. She repeatedly
asked for transfers. The Govt, should not post Ladies in PHCs where there are no vehicles. 1
consider this as a reasonable request. Particularly in rural contexts where men taluk officials
rarely share their vehicles with ladies, (hi a later report I shall give the example of the CDPO
who was not cooperative. Note otherwise he appeared to be dynamic). She said she was staying
in the Quarters despite facing a lot of complaints from the people round the clock.
With much
sadness she said that nobody can understand the difficulties faced by a Lady Medical Officer
living as the only Doctor in the Quarters. However, she was very pleased with her practice. 80
to 100 patients come to the OPD every day. Other sources informed me that she was especially
popular with women in this remote corner of the State.
The Amazing Surgeon (AS)
6
This Doctor has been in the Aland taluk PHC for last 3 years. He has been totally
crippled since a lamenectomy in NIMHANS in 1980. He has a cathether always connected for
urine. Does Surgery while sitting. He is a class mate of the DHO at the Gulbarga Medical
College. He was among the first Doctors to do lot of sterilisation camps. So far he has done
about 8 to 10 thousand tubectomies so far.
He had served as a Doctor in many Taluks. He said he has a great reputation in the local
areas and therefore incredibly busy with Surgeries. Every Wednesday he does Surgeries. At least
10 tubectomies, 10-15 hydrocoeals, hernias. He starts at 6 AM and continue in most weeks past
midnight into early morning. Apart from surgeries he gets about 50 to 60 out-patients every day.
Only on Sundays he goes to the town to be with his family. His children are studying there.
He says the Govt, expects Doctors to perform without providing adequate equipment at
the PHC level. He also pointed out that this becomes a pretext for young Doctors for not doing
work. The number of PHCs has increased over the last 2 decades. Earlier on there were just 2
PHCs per taluk while each had 23-24 sub centres.
Regrettably, due to the lower level
commitment of the new generation of Doctors the desired benefit of the PHC expansion has not
reached the common man.
The present generator has been repaired five times. He wants a new Generator as he
often has to operate using a Gas petromax or torchlight. Presently, there are 7 tubectomy sets.
He needs another 10 to 15 more surgical sets. The other request he has is to do some basic
maintenance of the building- roof, rebuild broken windows and repair flooring. He wants an
independent tube well and running water. Reelectrification has to be done as the wiring has worn
out. He said Beds are required for patients but will not ask as the Govt, will never provide them.
Immunisation
At the District HQ was informed that every Thursday was the Immunisation day. The
7
field realities were different in the villages visited. (See in the forthcoming Report of Gulbarga
visit- 1 prefer to put immunisation in the ICDS part). A new immunisation drive for urban areas
was initiated. For instance in Gulbarga city every 3ld Friday there is an endeavour to undertake
immunisation. Since I did not look at urban areas in this visit cannot comment on this claim.
To confirm -what this special 3rd Friday venture attempts which is not done on the regular
Thursday immunisation day?
Given that pulse polio was run as a vertical programme by the Karnataka Health Dept.
it was not shocking to find pulse polio vaccine being delivered to a village where no routine
immunisation had ever occurred for last 3 years (neither children nor pregnant women). The
ANM position was vacant. The substitute appointed by the Taluk Medical Officer works at the
Taluk Hospital. The concerned PHC Doctor was aware of this. He said that the in charge ANM
probably neither works at the taluk Flospital nor goes to the sub-centre. Let alone measles, even
routine immunisation had a lower proirity than pulse. What a misplaced set of priorities? We
were constantly assured that pulse would result in increasing overall vaccine coverages. What
we are consistently seeing is that the immediate imperative of polio eradication getting an
overwhelming priority over improving routine coverages. Without strengthening routine system
and reaching out to the unreached we will not be able educate the people on immunisation and
empower the community to demand or obtain these services. This is a major failure of the RCH
services in Karnataka. Such misdirected priorities on polio eradication may be understandable
in states like Bihar or UP where there is little governance but certainly not in Karnataka. This
policy failure in our state needs to be highlighted. Campaign strategies are expensive and can
never be a substitute for creating informed communities all over the state.
Need to emphasise that I am not questioning the imperative for polio eradication but the
way the operational strategy is not being used to optimally strengthen the routine immunisation
8
system. Dr. Nagaraj is very proud of the achievement of pulse in Karnataka but this needs to
tempered with the recognition of the lost opportunities.
Otherwise, we will be deluding
ourselves. The international donors do not care about the strategic mistakes and anyway they like
Dr. Nagaraj will only take credit.
Conclusion
Not everything was bad in Gulbarga. Right from the Commissioner onwards many
people in the Govt, kept repeating over the last few months that everything is bad there (not just
Health). Yes, there were several examples of dysfunctioning. Immunisation and particularly
measles does not receive enough priority though every PHC Doctor I met said that they are
covering everybody! But it was heartening to find once again in another District few exemplary
persons who are making a difference by working in the much maligned Govt. System in the most
backward part of Karnataka. The barrenness of the NGO sector is obvious particularly with
regard to health and children. The failure of Christian Mission Hospitals to thrive is deplorable.
The lack of leadership in the Indian Churches and limited commitment to the poor in most of
their medical institutions over the last 30 years is well known. Their failure to instill a sense of
mission in young medical students to serve the rural disadvantaged is unforgivable. Therefore,
there is no alternative to the Government in this part of Karnataka. 1 believe, our challenge is to
do everything possible to improve the functioning of the Govt. System and to assist sincere staff;
and support isolated institutions like St. Luke’s. Rural Gulbarga deserves CHC’s priority for
action. The District should not just remain an object of intellectual discussions on Primary
Health Care.
The Gulbarga challenge is formidable. Plow will the Doctor vacancies be filled? Having
an ambitious Health Minister from Gulbarga does not seem to help the District PHCs. Certainly
the filling of ANM vacancies in the sub-centres will make a difference. This is a good beginning
9
to make. Locating sincere Doctors working in the remote parts of the District is another step....
If the facility survey does not provide authentic information on the state of the PHC Doctors
Quarters in Gulbarga than it is worth doing a separate Survey for the District. Otherwise, Doctors
cannot be held accountable to stay in those PHCs where buildings are available. I could not
obtain info on how many PHC did not have Quarters.
Ethics & Field Visits
Certainly the knowledge from our visits will inform the forthcoming HNP proposal. In
the long run if the Bank is willing then it will benefit the people at large. But ethically we also
have an obligation to ensure that the Commissioner of Health needs to be informed of some of
the urgent needs expressed by the PHC Staff. Some of them may be attended to without any
major decisions or allocation of resources. It is unethical for us to hunt for problems in the
Health System in far away places without making a reasonable effort to put them up for
consideration in Bangalore City. Ultimately, it is not a matter of our personal credibility but that
of the leadership of the Health Dept. In any bureaucratic structure problems just keep growing
because of callousness, limited resources, inertia, and sometimes lack of awareness of superior
officials who have the power to make a difference. Such would naturally exist in the farthest
District away from Bangalore. This para is to ensure that we should not be seen as accomplices
of the inertia and/or inaction of the System, particularly given all our busy preoccupations in the
name of the poor.
Comments on Tara’s proposal Zinc should be excluded.
Her work on ARF(Amylase Rich Foods) is definitely inspiring but she herself
recommended that it should be made locally (rather than factory made). E.g. of
Rajasthan.
Cost of her micro-nutrient and ARF package more than doubles the cost of the
Nutritional supplement. So anyone would prefer to provide double the quantity of
Nutritional supplement instead.
Correction of calorie gap and protein gap needs to be tackled first and only then
micronutrients assume importance.
The ARF has to be mixed with Rice power/Ragi powder etc. hence supply of rice as
grain from PDS may have to be modified.
Most of Tara’s studies seem biased. I am of the opinion that by just monitoring the
functioning of few Anganwadi’s (without any supplementation)! the nutrition status
of the children will improve due to more efficient functioning of the Anganwadis
(Hawthorne effect).
Her study on providing micronutrients to tea plantation workers showed compliance
less than 60% (only 600 workers). How does compliance improve in a large district.
From my feedback from visits to few Anganwadi’s, the AWW’s themselves stated
that attendance during energy food distribution days was much less than during
regular food days. I feel mothers and children naturally prefer their staple diet (can
be fortified) rather than some odd looking and tasting preparation/mix.
De-worming of children and adults every six months is a must.
Selection of districts to be rationalized as per the real need and not convenience.
The programme should be for all under 2 years children and not be discriminatory.
The sustainability of food fortification Vs change in the dietary habits of mothers and
children should also be considered.
Even a half-boiled egg a day would work out cheaper than adding micronutrients
ARF to the existing nutritional supplement, and be much more effective for
improving malnutrition, (also more tastier).
Monitoring of the pilot projects should be carried out by a neutral group and not Tara
Consultancy Services.
Non availability of growth charts and weighing scales would be a major problem in
monitoring the success of any nutrition programme.
JSA WORKSHOP ON
Go
Y)
GtC-
CAMPAIGN MATERIAL PREPARATION FOR NHA-II
NSK, Bangalore
24,h and 25th February, 2006
Draft Programme Schedule
Day-1 : 24th Feb. 2006_______________________________
Topic
Time
10.00 am - 11.30 am Round of brainstorming on NHA-II process to
contextualise the use and dissemination of the
campaign material (including approximate calendar
of preparatory activities for National Assembly)
11.30 am to 1.00 pm Discussion on • Topics for campaign booklets
• Sub-teams to draft booklets on various topics
• Editing team to finalise booklets
1.00 pm - 1.45 pm
LUNCH
1.45 pm - 4.00 pm
Continuation of morning discussion; detailing of
issues related to some of the booklets e.g.
1. Revisiting Primary Health Care (suggested
initial presentation: Thelma)
2. Access to health for the marginalised and
vulnerable; (suggested initial
presentation: Sarojini / Vandana)
Discussion on JSA strategy for WHO-CSDH
4.00 pm - 6.00 pm
activities
Reporting on transition of PHM Global Secretariat
6.00 pm - 7.00 pm
and related issues concerning JSA
Day-2 : 25th Feb. 2006
Topic
Time
Discussion on JSA National presentation and
9.30 am - 10.30 am
strategy regarding 4th March NHRC Review
10.30 am - 1.30 pm
1.30 pm - 2.15 pm
2.15 pm - 5 pm
Detailing of issues to be covered in various booklets
-continued (names are of suggested initial
presenters):
3. Globalisation and its impact on Health (Amit)
4. Right to Health Care (Abhay)
5. Private Medical Care and Regulation; Access to
essential Drugs (Anant /Amitava I Amit)
6. Emerging issues and Challenges in
Health (Ekbal)
LUNCH
• Printing and publication, finances for
booklets
• Development of graphics, cartoons and
diagrams for the booklets
• Exploring the idea of JSA News Bulletin
******
Facilitator / Presenter
Chair for morning
Sessions: B.Ekbal
Facilitation: Thelma
Facilitation: Vandana
Chair for afternoon
Sessions: Ravi Narayan
Facilitation: Veena
Facilitation: Amit
Facilitation: Ravi
Narayan
Facilitator 1 Presenter
Chair for morning
Sessions: Mohan
Facilitation: Abhay
Facilitation: Sarojini
Chair for afternoon
Session: Mira
Facilitation: Amitava
‘Defending’ people’s Health
in the era of globalisation
Key themes for booklets
• Threats and assaults on the RTH: Globalisation is
injurious to health
• Crisis of the Indian health system
• Defend the Right to health for various sections of
the Indian people!
• New and emerging issues
impacting on the RTH
• Promote the determinants of the RTH!
• Health and Health care for all is possible!
The People’s Health Plan
1
Threats and assaults to people’s health
Corporate-led Globalisation is injurious to
health- Amit, Mohan
•
•
•
•
•
•
•
•
•
•
•
•
•
What do we mean by globalisation?
Imperialist / hegemonic globalisation
IMF, W Bank, WTO (wrt health)
Multinational corporations (wrt health)
Neo liberal Macro economic policies (CMH critique)
World Bank projects and prescriptions
International donor agencies and institutions; impact of
vertical programmes, consultancy organisations
Privatisation and PPPs (PHM critique)
WTO, Patents, GATS
Medical tourism
Changing role of UN agencies
Migration of H professionals, brain drain
Impact of LPG on key health determinants incl. food
security, water, livelihood
Crisis of the Indian health system
Denial of Right to health care
A. Crisis of health system
Thelma, Anant, Abhay, Sundar, Ritu priya
• Health policy and vertical programmes - RCH2, NACP, TB, Malaria
• Weakening and fragmentation of PHS, state public health budgets;
governance issues and corruption
• Decentralisation and P Raj (Ekbal)
• Concerns about NHRM
• Unregulated, irrational proliferation of Private medical sector
• PPPs and semi-privatisation
• Issue of health care financing and Private medical insurance and
loans; user fees
• Population policy (Sarojini, Mohan)
• Health research issues (Mohan, Ravi)
• Health personnel incl. education (Ravi)
• Traditional I alternative systems and their crisis,
commercialisation
B.lrrationality and exploitative nature of Drug industry; diagnostics
and devices - separate booklet
• Amitava , Ekbal, Chinu, Amit, Mira
2
Defend the Right to health for various
sections of the people
•
•
•
•
•
•
•
•
•
•
•
•
•
A) Women’s Health - separate booklet (incl. population, women
workers,) - Sarojini, Mira, Veena
B) Children’s Health - separate booklet - Vandana
C)???-Joe
Workers Health (agri, non-agri,...)
Health for persons with mental health problems - Naidu
Health in context of HIV-AIDS - Sunil
Health for Dalit communities - Premdas
Health for Adivasi communities Health for displaced communities - Sr. Prabha
Health for urban poor - Chander
People with disabilities - Naidu
Elderly people - Mira
Sexual minorities - Sama
New and emerging issues
impacting on People’s Health
*
Ekbal, SAMA team, Anant, Sandhya Srinivasan
• New vaccines and medical technologies
Hepatitis-B vaccine
Intradermal rabies vaccine
Polio eradication
• New reproductive (incl contraceptive) and genetic technologies;
ethical issues
• Sex selective abortions and declining sex ratio
• C section and hysterectomy
• Surveillance, new epidemics
• Communication, new technologies
• Regulation
• Conflict and Communalism
* Mainly for health professionals, activists with health background
3
Promote the determinants of the RTH!
Amit
• Food security and nutrition (PDS, rural
impoverishment & agriculture, droughts, commercial
farming)
(Veena + Vandana; consult Madhura, Sainath, Mohan)
• Environment and technology (DSF, CHC/CHESS)
• Water and other public utilities (roads, power,
education) (DSF)
• Livelihood, employment conditions and
displacement
• Social exclusion (Sarojini, Premdas)
• Conflict and militarisation (Jaya Velankar, Renu)
• Culture of consumerism; tobacco, alcohol etc. (Ekbal)
Health and Health care for all is possible!
The People’s Health Plan
Sundar, Ekbal, Abhay, Mira
• A healthy model of development to replace unhealthy
development
• A system for universal access to free health care strengthening public health system, bringing the private
medical sector under the public umbrella
• Financing health care for all (Ravi Duggal)
• Revisiting and revitalising PHC as an approach
• Appropriate health care models; people’s participation
and decentralised planning
• Restructuring Health professional education
• Towards a people oriented drug policy
4
Reflecting on JSA campaigns
CHC team
Overarching issues
• Globalisation
• Class
• Gender
• Caste
• Health as a human right
• Appropriate health care
• People oriented alternatives, positive
experiences, action plan
AN UPDATED PEOPLE’S HEALTH
CHARTER -
5
Letter to Hota seeking information, related to
implementation of the
NHRC National Action Plan:
1. What action has been taken regarding enacting of a
National Public Health Services Act or similar
legislation, to delineate the health rights of citizens?
At least have Health rights of citizens related to the
Public health system been clearly delineated, whether
as part of NRHM or otherwise?
2. Steps to recognise health rights of special sections
3. Increase in central budgetary provision for health
4. National Clinical establishments regulation act
5. Operational guidelines on essential drugs
6. Reversal of all coercive population control measures
(JSY)
7. Central health services Monitoring and consultative
committee
8. Sectoral health services monitoring committees
9. Restructuring of MCI
10. Incorporation of Health rights and Community based
monitoring in all aspects of NRHM
URGENT ATTN FOR THELMA
Subject: URGENT ATTN FOR THELMA
Date: Mon, 21 Aug 2000 02:32:16 +0530
From: "Sabu George" <sabumg@vsnl.com>
To: "thelma" <sochara@vsnl.com>
For THELMA from Sabu
FIELD VISIT TO BAGALKOT IN AUGUST
written in Bangalore and Trivandrum
Draft as of August 20 night; (remaining parts are being edited)
Objective of the Visit
Spent 4 days in Bagalkot_.Dlstrict, Aug 8-11. Arrived at 10 am on Tuesday at
the Sugar Mill and left at 3.15 pm on Friday. The original purpose was to
discuss on the continuation of the pulse polio work which I had initiated
last year in the two taluks of Mudhol & Jamkhandi with the Govt, and
Godavari Sugar Mill. Also to assess the progress of June and July rounds of
Pulse Polio; (following the only case of Polio in South India in 2000 in
Bagalkot Dt). Thelma had asked me to look at the ICDS system when informed
of my visit to Bagalkot. I promised to go to the most backward taluks. So
specially went to Badami & Hunkund taluks. I also append my interactions
with the Doctors as it is relevant to our Health project with the Govt.
People met
Met Bagalkot DHO & several non-medical officials in 4 taluks. Attempts to
meet 2 Taluk Chief Medical Officers were unsuccessful.
In one taluk, the
Doctor at 12 noon had already left for his private Nursing home. The Taluk
Medical Officer in the second taluk at 11.45 AM had left 15 to 60 minutes
before our arrival for tour duty! Spoke to one PHC doctor each in 2 taluks.
Tried to meet the CDPOs of 3 taluks. Talked to the CDPO of 1 taluk at home
as it was holiday due to Nigilanjappa death. The 2nd CDPO was not at home
at 3pm on a working day.
In my earlier visits to Bagalkot had met this lady
many"times in Jamkhandi and she been the CDPO for over 6 years. The CDPO of
the 3rd taluk whom I wanted to see was not at office at 12 noon as he had
gone out. Met 3 AWWs + 4 helpers in one village of Badami Taluk. Note that
the several hours in jeep travel was optimised wherever possible. When the
DHO asked a "new" Doctor to take a bus go and see a vacant PHC in remote
Badami Taluk; I took the Doctor as I was going there. Another Doctor
("old") was given a lift to his home from the PHC near Raichur (2 hours
away). This old Doctor had taken charge of this PHC 2 days ago. He was
earlier the second medical Officer in another PHC in the same taluk.
One of the CDPO's I met was just transferred to take as the District in
Charge. She was to have taken charge in Bagalkot that morning but because
of the sudden State holiday she was at home.
She had served for 6 years as
CDPO. In Hunkund taluk the present CDPO has been there for just 2 days. He
comes from another District. His previous two predecessors in the taluk had
just served only for one year each.
Attempts over 20 minutes in rains to talk to several village women in the
fields of the remote village bordering Raichur in Hunkund was not successful
though I had a Sugar Mill official as interpreter. Had to abandon as the
return journey in heavy rains on the 26 km bad road to the nearest Highway
was not considered safe.
It eventually took us more than 5 hours of non
stop drive to return to the Factory from this distant village (arrived
9.30pm).
ICDS RELATED COMMENTS (excluding food)
Anganwadi Centres and Worker Responsibilities
The village in Badami taluk I visited had 4 AW centres.
Two of the four
centres were running out of temples. The first AW worker was not in the
village. Some informants told me she lived in the Badami town. Though
other AWWs I met in another centre said she lived in the same village.
in
Badami, only 10 to 15 of the 256 centres have out of village workers
according to the CDPO. The AW centre functioning time is 9.30 AM to' 1.00
PM. The AWWs are expected to do other work after 1PM.
The AWWs told me that they have lot of censuses to do. .24 Registers to be
kept. They are asked to reduce dropouts in schools (though not on school
committees). Attempts to get a listing of all the jobs were not fully
successful. Partly because the interpreter was my driver, whose English was
only a little better than my Kannada. I spent more than 2 hours in the
village. Needed more time to elicit these details. But I gave priority to
meet the CDPO who stayed one hour away from this village in the town.
Felt
1 of 3
URGENT ATTN FOR THELMA
meeting the CDPO was important as she was a local person and served for 6
years as the CDPO. Being a lady whom I never met did not want to visit her
in the evening so left the village after 2.00pm towards the town.
Learnt that in Badami taluk there was no problem with the Panchayats paying
for firewood, unlike that of some other taluks in Bagalkot. The CDPO said
there is an order from the RDP Dept, to the Panchayats to release Rs. 50 per
week (?) .
AWW Relationship with Panchayats, Workers Unions, Bribes and Others
AWW do not like to be associated with the Gram Panchayat as they will
become ensnared in the local politics. In Badami taluk all the AWWs
reportedly belong to Basavaraj's Union. They pay per month Rs 2 as
membership fees. Two workers paid a bribe of 20,000 in 1996 to Department
people to get their jobs. However they do not have to pay bribes to the
CDPO for their salaries. I had heard of such complaints in North India.
AWW said communities were unwilling to assist them.
For instance, the
Dept, asked them to raise money locally, for some function to be held in an
adjacent District. The villagers were not willing to contribute to their
travel. Their expectation was that it was the Governments obligation.
There are several Private and Govt. Institutions training Anganwadis in the
state and not all of them do a satisfactory job as per a CDPO.
Inade_quacy_of_Supervison: Staffing
The acute absence of Supervisors is well known. It is particularly intense
in the Northern Districts. One Bagalkot taluk had only one Supervisor for
nearly 300 AWW. Another taluk with over 250 centres had both the 2 ACDPO
positions vacant and not even one Supervisor for last 3 years. Hunkundu
which is the largest taluk in Bagalkot has 245 sanctioned AW centres of
which 240 are functioning. There is just one Supervisor. Both the ACDPO
positions are filled.
CDPO Responsibilities and Training etc.
The CDPO is supposed to be an administrator, nutritionist, pre-school
educator etc. A CDPO wanted at least at the District level, a Nutrition
expert. Like there is a Health Educator in every PHC. Particularly, as
preschool education has received some attention from the ICDS in Karnataka.
This suggestion needs to be taken seriously as the eligibility of being a
CDPO is broad- Home Science, Social Work etc. These syllabi does not
provide adequate learning on pre- school child nutrition. The first
training after selection does attempt to remedy this. Note that refresher
training is also limited. One CDPO reported that over the last 10 years was
asked to attend only two refresher training sessions. The last one training
provided was several years ago. This CDPO had heard of the new Udisha
Training but nothing as yet is visible.
TK^’CDPO had twice organised training for women panchayat members for 2
days.
Found later these members had a better understanding of the system.
The CDPO/ACDPO is supposed to have a jeep.
In one taluk there is only one
of the two sanctioned jeeps.
From several taluks I had complaints that it
easily takes 3 months to repair the jeeps. Even when a taluk has more than
one vehicle, it is not uncommon to have both the vehicles non functional.
The repair money comes from the Dept, to the Gram Panchayat through the ZP.
Thus sanction of repair and getting it done takes time. The District
Officer of ICDS in Bagalkot has no Jeep. Apparently this is the problem of
new Districts as UNICEF has stopped supply of Jeeps. Note that this is
contrary to what the Dept, told Krishnan.
Weighing Balances
The taluk which I asked about balances has 256 centres. In 1985, 120 were
provided with Salter balances. Today only 50% are working. 60 balances are
used for weighing children in the 256 centres. Note though Salters are
rugged the chance that the springs of the 60 functioning balances being
dependable is most unlikely. Only calibration with standard weights can
confirm this. Such kind of attention when even adequate number of balances
exists is most unlikely. In my 4 years of work with over 20 Salters, just
one Spring remained robust for more than a year. Undependability of the
springs to function properly gets exacerbated if they are going to be
transported around from place to place. Thus attained weights will be
severely affected if the Springs are not behaving truly.
Please note this pathetic situation of balances is unlikely to be specific
to the taluk which I visited. Few months ago, I was informed about shortage
in another taluk. The Dept, informed Dr. Krishnan only 700 centres of the
40,000+ AW centres did not have balances. My impression is that in Bagalkot
District alone there could be more than 500 centres without balances (My
. eJ e : Gzr> '
2 of 3
><U
bcl
e
URGENT ATTN FOR THELMA
inference may not be correct but certainly far more accurate than the claim
that only 700 balances are needed for the whole state!).
The existing balances have only 250 gram sub-divisions and therefore
monthly Growth Monitoring for children aged above one will not make much
sense. The Dept, told Dr. Krishnan that new charts with 100 gram
subdivisions are being printed. No point in providing colourful 100 gram
growth charts if the balances have 250g sub divisions.
I do not believe in the routine monthly Growth Monitoring of all children.
But my concern is about the monthly figures of malnutrition status each AW
centre reports every month. The malnutrition levels coming from District
level consolidation seemed suspect. Now given the hopeless situation about
the shortage of weighing balances my cynicism about the credibility of
routine reports has only increased. Note we have evaluations done by
Bandits like MODE which classify nutritional status of children in Karnataka
based on monitoring data!
Educational Materials, Toys and Communication media
One CDPO informed me that no Posters have been supplied at all for many
years. What little is exhibited at the Office was obtained several years
ago when the CDPO had gone for refresher training. Booklets on various
matters should be supplied. There was a suggestion to organise wall
writings on Nutrition in the villages. Another was that Nutrition messages
be publicised in the media as AIDS or population. Just like the population
Clock on the DoorDarshan nutrition messages should be advertised.
There was demand for more toys.
Presently only 1 set of toys are provided
per centre. Require at least 2 or 3 sets as there are more than 50 above-3
children who come to the centre. Want one playground in urban areas for
several centres. Today the entire pre-school education is done within the
centre. Outdoors can also be used for education. I was informed that in
the famous tourist torn of Badami (also a taluk HQ) there is not even one
park.
Finally in urban areas or large villages where there are several AWWs the
main functions like feeding, preschool education, etc can be assigned to one
particular AWW rather than each AWW doing all the tasks. This will help in
doing justice to all the responsibilities.
EXPENSES AND EXTENT OF FIELD VISITS
The sugar Factory is located at the edge of Bagalkot district bordering
Belgaum. Badami and Hunkund are on the opposite end of the Bagalkot
District bordering Raichur and Koppal.
Note none of the travel related expenses for the 13 hour field visit each
day to Badami and Hunkund taluks respectively; or the 5 hour field visit on
the first day to the neighbouring taluk Medical Offices in Mudhol &
Jamkhandi have been charged to CHC. The travel to and from Bagalkot
District has also not been reimbursed from CHC (including the travel to be
in Bangalore on Aug 12-14 and then to Trivandrum).
• I ’RGENT ATTENTION
Subject: URGENT ATTENTION
Date: Fri, 18 Aug 2000 00:27:26 +0530
From: "Sabu George" <sabumg@vsnl.com>
To: "thelma" <sochara@vsnl.com>
/l/T M
COMMENTS ON Dr. TARA GOPALDAS's NUTRITION PROPOSAL
Sabu George, MA (Johns Hopkins), Ph. D (Cornell)
August 17, 2000
NOTE: This draft follows a 3 hour discussion with Prof. Tara Gopaldas
(henceforth Tara for brevity).
I strongly recommend that Karnataka ICDS
system should seriously attempt to use amylase (ARE) to enhance caloric
density and improve the availability of nutrients of the food given to
children. Dr. Gopaldas has done pioneering work over a decade to highlight
the potential nutritional benefits of this traditional practice.
In this note, regret that I am unable to cite sections or page numbers from
Tara's original proposal; as she said it was prepared for the donor MI
(Micronutrient International); and therefore a copy could not be given.
This detailed note is prepared in the hope that it will facilitate a healthy
discussion on what is best for the well being of our children given the
resources which are likely to be available.
I divide my comments under two
broad headings: Positive and Negative; ie., which are desirable and; others
which either violates the present public policy consensus in the country or
disagree with the suggestions as not in the best interests of children.
2. POSITIVE ASPECTS
2.1 Focus on under two children and Nutrition
The proposal brings a welcome focus to Nutrition in Karnataka.
For too
long Population has received a disproportionate interest.
There is
attention to the under two children which has long been neglected in
Karnataka as in most other states. The recommendations to strengthen the
ICDS system by filling up vacancies and enhancing training is well known to
the Department but needs to be dealt with greater urgency.
2.2 Use of Amylase
The bulkiness of the existing energy food has been highlighted to us from
the Field by ICDS workers.
There is considerable unhappiness about the
acceptability of the :Energy food" presently distributed. The use of
amylase to "liquefy" the bulky food shoul^ be tried out. Whether the
amylase should be in a prepackaged form can be considered.
2.3 Deworming of school children
Strongly support deworming of children aged 1 to 5 years with Albendazole
every 6 months.
If procured from manufacturers like "LOCOST" rather then
SKBeecham costs can be reduced.
Deworming along with hygiene education and
provision of safe drinking water will reduce the worm loads in children and
thereby reduce transmission.
3 NEGATIVE ASPECTS
First the major concerns are mentioned and finally the minor concerns.
3.0 MAJOR CONCERNS
Tara's proposal has a disproportionate focus on fortification.
Miconutrient cocktail including Zinc for under-2 children, Vitamin-C
fortified drink for women and universal fortification of milk with Vitamin-A
are the major proposals.
Further, there are extremely negative
recommendations that no Health and Nutrition Education is required beyond
getting parents educated on feeding the Ready to eat supplement. Most
regrettably, Tara wants ICDS services to be denied to children of older
mothers.
Thus these proposals are radical departures from the existing ICDS
programme.
Such a narrow focus on fortification undermines attention to the
persistence of childhood malnutrition in Karnataka.
Overall improvements in
nutritional status of children in Karnataka have been very modest,
r
Emerging
problems in Karnataka like intensification of gender differentials in
malnutrition are not even recognised let alone dealt with.
Thus, Tara's
"rationale” for such a top down technological intervention to solve the
nutritional problem needs to be carefully examined.
URGENT ATTENTION
3.1 Providing Zinc and other micronutrients on the pretext of meeting RDA
Including Zinc and other micronutrients along with Amylase in a packet
under the guise of meeting ICMR RDA is untenable. ROA is only
recommendatory, therefore to selectively include Zinc and other nutrients is
not fair. This arbitrary inclusion of Zinc violates the existing consensus
on Zinc, which does not recommend universal supplementation of Zinc for all
children. Therefore, Zinc as a nutritional supplement for all children
should not be permitted presently. The very fact that only micronutrients
are selectively being included while ignoring the large unmet need for
calories raises concern about Tara's intent itself.
For instance, the
Energy Food supplied by the Karnataka Agro meets a significant part of the
calories, proteins and certain micronutirents. The food is not fortified so
that all the micronutrient RDAs are met. Already there is a formal
commitment in ICDS to provide Iron and Vitamin-A.
Thus there is no need to
supply any prepackaged nutrients along with Amylase. The present budgetary
allocation is Rs 1.25 per child for food. According to Tara, the per packet
cost of Amylase and Micronutrients is Rs. Two. One natural question that
comes -Is it not wise to spend Rs. 2 on more food rather than on a packet of
micronutrients? Only a randomised study in Karnataka can provide us with
the actual nutritional benefit and the cost of the incremental benefit of
the packet of micronutrients. Without such answers it would not be wise for
the Karnataka Government to agree to the present proposal.
3.2 Lack of critical analysis of nutrition data
Though the project report seems voluminous and gathers data from NFHS-1,2,
NNMB; critical analysis of the data is lacking. A selective use of data
just to push the micronutrient agenda is apparent.
To give one example: the
report ignores the increasing son preference in Karnataka.
The Karnataka
Human Development Report acknowledges that there is strong preference for
sons in the State. Certainly micronutrients and food fortification cannot
be a solution to the increasing discrimination against the girl child in
Karnataka (girls are breast fed for lesser time, weaning foods are
introduced earlier for boys, increasing popularity of female feticide etc.).
Two decades ago boys were most malnourished but today girls are more
moderately and severely malnourished.
This is why we cannot ignore the
imperative of health education to ameliorate the neglect of girl child.
The
claim that only education to prepare (ready to eat)
RTE food is enough and
no other kind of HNE is untenable. Educational approaches have a role and
can address a lot of concerns which a narrow technological approach as
micronutrients fail to solve.
3.3 Denial of ICDS services to children of older mothers (more than 24
years)
This recommendation needs to be rejected out rightly as this is coercive
and violates the Beijing Spirit. Tara ignores the considerable reduction of
fertility that has occurred in Karnataka.
Tara's proposed approach without actually involving people or empowering
them to address their children's problems is paternalistic and goes against
the prevailing development paradigm.
4 Suggestion for modification of Tara's proposal
In the interests of Karnataka's children, I hope, Dr. Tara Gopaldas; will
use her longstanding association and clout with IDRC/MI to get the pilot
study funded which will examine the benefit of (micronutrients+Amylase)
packet Vs Amylase with the existing supplementation of Iron and Vitamin-A.
Thus half of the over 7000 Anganwadis be randomly asigned to one of the two
treatments.
Such a pilot study will demonstrate under the real programme
conditions, and given the actual preexisting nutritional deprivations of
children; the overall benefit of the micronutrient cocktail.
5. MINOR CONCERNS
5.1 Use of adolescent girls as volunteers
Tara's proposal of using 5 adolescent girls per Anganwadi to do
"Education" of the ready to eat food is exploitative.
The alternative is to
hire one extra worker with the same money paid for five "volunteers".
5.2
Choice of Districts
Tara says the following 4 districts were chosen by the Government- Raichur
Gulbarga, Tumkur & Chickmagalur.
Tara actually wanted urban or rural
URGENT ATTENTION
3.1 Providing Zinc and other micronutrients on the pretext of meeting RDA
Including Zinc and other micronutrients along with Amylase in a packet
under the guise of meeting ICMR RDA is untenable. RDA is only
recommendatory, therefore to selectively include Zinc and other nutrients is
not fair.
This arbitrary inclusion of Zinc violates the existing consensus
on Zinc, which does not recommend universal supplementation of Zinc for all
children. Therefore, Zinc as a nutritional supplement for all children
should not be permitted presently.
The very fact that only micronutrients
are selectively being included while ignoring the large unmet need for
calories raises concern about Tara’s intent itself.
For instance, the
Energy Food supplied by the Karnataka Agro meets a significant part of the
calories, proteins and certain micronutirents. The food is not fortified so
that all the micronutrient RDAs are met. Already there is a formal
commitment in ICDS to provide Iron and Vitamin-A.
Thus there is no need to
supply any prepackaged nutrients along with Amylase.
The present budgetary
allocation is Rs 1.25 per child for food. According to Tara, the per packet
cost of Amylase and Micronutrients is Rs. Two. One natural question that
comes -Is it not wise to spend Rs. 2 on more food rather than on a packet of
micronutrients? Only a randomised study in Karnataka can provide us with
the actual nutritional benefit and the cost of the incremental benefit of
the packet of micronutrients. Without such answers it would not be wise for
the Karnataka Government to agree to the present proposal.
3.2 Lack of critical analysis of nutrition data
Though the project report seems voluminous and gathers data from NFHS-1,2,
NNMB; critical analysis of the data is lacking. A selective use of data
just to push the micronutrient agenda is apparent. To give one example: the
report ignores the increasing son preference in Karnataka. The Karnataka
Human Development Report acknowledges that there is strong preference for
sons in the State. Certainly micronutrients and food fortification cannot
be a solution to the increasing discrimination against the girl child in
Karnataka (girls are breast fed for lesser time, weaning foods are
introduced earlier for boys, increasing popularity of female feticide etc.).
Two decades ago boys were most malnourished but today girls are more
moderately and severely malnourished.
This is why we cannot ignore the
imperative of health education to ameliorate the neglect of girl child.
The
claim that only education to prepare (ready to eat)
RTE food is enough and
no other kind of HNE is untenable.
Educational approaches haxre a role and
can address a lot of concerns which a narrow technological approach as
micronutrients fail to solve.
3.3 Denial of ICDS services to children of older mothers (more than 24
years)
This recommendation needs to be rejected out rightly as this is coercive
and violates the Beijing Spirit. Tara ignores the considerable reduction of
fertility that has occurred in Karnataka.
Tara's proposed approach without actually involving people or empowering
them to address their children's problems is paternalistic and goes against
the prevailing development paradigm.
4 Suggestion for modification of Tara's proposal
In the interests of Karnataka's children, I hope, Dr. Tara Gopaldas; will
use her longstanding association and clout with IDRC/MI to get the pilot
study funded which will examine the benefit of (micronutrients+Amylase)
packet Vs Amylase with the existing supplementation of Iron and Vitamin-A.
Thus half of the over 7000 Anganwadis be randomly asigned to one of the two
treatments.
Such a pilot study will demonstrate under the real programme
conditions, and given the actual preexisting nutritional deprivations of
children; the overall benefit of the micronutrient cocktail.
5. MINOR CONCERNS
5.1 Use of adolescent girls as volunteers
Tara's proposal of using 5 adolescent girls per Anganwadi to do
"Education" of the ready to eat food is exploitative.
The alternative is to
hire one extra worker with the same money paid for five "volunteers".
5.2 Choice of Districts
Tara says the following 4 districts were chosen by the Government- Raichur
Gulbarga, Tumkur & Chickmagalur.
Tara actually wanted urban or rural
L-
CHAPTER 19
Equity, integration
and empowerment
In this span of twenty-three years since we came to Jamkhed, many
changes have taken place. The harsh realities of life where there is
poverty, lack of knowledge, superstition, fear and injustice have been
brought home to us over and over again. The present programme ar
CRHP bears little semblance to the small project we originally planned
at Johns Hopkins School of Hygiene and Public Health. Through the
years we practised and worked in Jamkhed, we learned to build on
successes and turn failures and crisis situations into opportunities for
improvement and correction. We share with you some of the lessons
we learned.
The perceptions of poor and marginalised people are different from
those of the elite and educated.
Health is not a priority as marginalised people struggle for survival.
The basic necessities of life such as food, water and shelter are more
important priorities. Lack of these important necessities contributes
to more than 50 per cent morbidity and mortality in poorer com
munities. It is necessary for health professionals to acknowledge these
needs and convert them into health programmes for nutrition, provi
sion of safe drinking water and clean environment.
Academic and project planners often set the reduction of infant
mortality as a goal. How do village people perceive infant death? In
1970, infant mortality in the CRHP area was over 176 per 1000
births. With a birth rate of 40, approximately 8 infant deaths oc
curred in a year in villages for every 1000 population. Six out of
these eight deaths often occurred among the poor and marginalised.
Although the death of male children is mourned, the death of the
female children may even be welcomed! Unless attitudes towards girls
changes, conscious or unconscious neglect of the female child, female
246
r
infanticide and female feticide will continue to be a factor in high
infant mortality rates. Social injustice and the status of women and
children need to be addressed as well.
It is not hard technology but often social action that improves health.
CRHP does not have a sophisticated pediatric unit. Infant mortality
has been reduced because of better nutrition, cleaner environment,
better status of women and community participation. The birth rate
fell because communities realised that female children are as precious
as male children. The status of women has been raised by empower
ing them with skills, knowledge and income generating programmes.
Availability and promotion of different methods of family planning
to already knowledgeable communities have motivated couples to
practise family planning.
The input of social sciences in primary health care must be emphasised.
Medical workers must recognise the role of social science in primary
health care. Social inputs are necessary to organise communities to
deal with social injustices such as caste and class structures and the
status of women and children. The practice of social medicine has a
greater impact on rural health than do technical inputs such as injec
tions, medicines and expensive diagnostic procedures. At CRHP, mobile
teams and grass roots workers spend over 50 per cent of their time
on learning the social aspects of health. The health worker should
have an intimate knowledge of the community and how to cope with
the problems of poverty.
Health education should be related to the resources and culture.
The knowledge shared with the people should be appropriate to the
resources and culture of the community. Middle-class lifestyle should
not overlap on scientific facts. For example, commercially prepared
baby foods or infant formulae should not be advocated to take the
place of scientifically proven superior breast milk.
Rural communities are capable of planning and maintaining their own
health.
Rural communities around Jamkhed acquired skills to collect and analyse
health information and support health workers. They can contribute
to health care substantially provided:
a. They are taken seriously and not treated as ignorant people. Vil
lage people’s ideas need to be taken seriously. They speak out of
experience in adverse conditions. CRHP staff entrusted health services
to the people and got them involved in different health programmes.
247
The attitude of superiority was replaced by a feeling of equality
and working towards a common goal..
b. Medical knowledge and procedures are demystified.
Medicine needs to be demystified and knowledge should be shared
freely with people so they can attain and maintain good health.
CRHP demystified surgical procedures like Caesarian sections and
sterilisation operations by inviting people into the operating room
and explaining the different procedures. This kind of demonstration
removed many misconceptions about sterilisation and delivery of the
placenta. Knowledge is freely shared at all levels of care.
Self-confidence must be promoted at all levels of the health team.
The process of enabling, developing and empowering others and sharing
knowledge and skills can only occur if the facilitators, health profes
sionals and the team have developed self-confidence and self-esteem.
Hierarchical attitudes have to be replaced by a team spirit and equality.
The realisation that knowledge not only gives power, but that sharing
knowledge also increases self esteem is important in the development
of a team spirit. Health workers who were nobodies gain status as
they successfully provide useful services to the community. Self esteem
has to be developed to the extent that the facilitator is ready to receive,
enjoy and synthesise the ideas of the group (group/co-workers/partners)
and to return those ideas to the group as recognisably their own, so
that the creativity is theirs.
Community participation does not mean confrontation.
Indian villages have a tradition of inequality and exploitation of the
poor and marginalised people. As these marginalised groups are em
powered, efforts at reconciliation and cooperation among different
groups are emphasised. Since health is dependent on the village com
munity as a whole, it involves interconnected aspects of life which
the individual often can affect only when there is cooperation among
the members of the community for the benefit of all. Health is then
a fundamental reason for community involvement and also provides
a reason for community involvement and cooperation which every
one can easily see as valid. Small events which cannot be manipu
lated or theorised, can lead cumulatively, to profound changes in society,
such as changes in collectively held beliefs which previously limited
the abilities of people to act on their own behalf for their own benefit.
Accepting treatment for snakebite and exposing the devrushis are but
a few examples. This, coupled with continuous dialogue on issues
such as the caste system, providing women with opportunities to improve
248
their socioeconomic conditions, and the inculcation of values of respect
helped communities to come together. Confrontation only, alienates
and drives communities apart, leading to hatred and violence and
away from a state of positive health.
Taking advantage of community enthusiasm leads to progress.
Community interest waxes and wanes. When the leaders of Jamkhed
showed their enthusiasm to have a health programme, the oppor
tunity was seized and the project was started promptly and decisively
before the enthusiasm could wane. Crisis situations such as drought
were turned into opportunities for gaining the confidence of the com
munity by responding to needs for food and water.
It is essential to train grass root workers who are culturally accept
able, available and accessible.
Health is influenced by socioeconomic factors, many of which are
well knit into the social fabric of the society. It is only persons from
within the community who can really understand the practices and
beliefs that exist within the community. Only a person from the com
munity is readily available and accessible at all times at a cost the
community can afford. CRHP took a bold step in training illiterate
village women as health workers. The very limitation of reading skills
led to the system of continuous weekly training and support which
has resulted in their learning progressively more and more skills and
thereby keeping them motivated.
Planning needs to be flexible.
When people are involved in planning and implementing their pro
grammes, flexibility and innovations are needed. Constant review and
evaluation led to changes in the programme. When ever failures were
noticed immediate corrective measures could be instituted. The failure
of the ANM to be the link in promotive and preventive programmes
led to the development of the village health worker. This flexibility is
important for the success of health programmes.
There should be a balance between curative, promotive and preven
tive health services.
Poor communities have a large backlog of morbidity and disease.
People look for solutions for their immediate medical problems. It is
necessary to have curative services to respond to this need. These
curative services increase the credibility of the health professional.
They also can act as a springboard to introduce preventive programmes.
Jamkhed had many patients with tetanus. Successfully treating these
249
patients led to the acceptance of tetanus toxoid immunisation.
Primary health care needs the support of secondary and tertiary services.
A good support system in the form of secondary and tertiary care is
necessary. The village health worker must have the confidence that
she can approach a secondary or tertiary care centre for help when
needed. Preventive programmes will be effective only if backed up
with appropriate support programmes. Antenatal care without a back
up service for Caesarian section will soon lose all credibility. It is
important to have a good onward referral service to tertiary care
hospitals in the city. From time to we have referred village people
for open heart surgery and other specialised services.
Scientific knowledge must be applied to develop technology appro
priate to the needs and resources of the community.
Poverty and isolation of the village people make it difficult to prac
tise expensive sophisticated technology. The delivery pack used by
the VHW ensures that sufficient sterile technique during delivery is
eliminating infant and maternal infection. This pack is inexpensive
and can be used by any mother in the village. The Jaipur foot is
another example of a simple prosthesis based on the life-style of the
people.
Accept the slow pace of development.
Professionals and donors want quick results. The pace in the village
is slow. Poor people weigh all options before choosing a particular
course of action. Patience is needed as people take their time in de
cision making. However, when communities do show enthusiasm it
is necessary to act promptly.
The primary health care approach is dynamic and encompasses a wide
range of health activities.
It is not limited to mother and child health programmes, family plan
ning or nutrition programmes or immunisation. Priorities will depend
on the needs of the people. In successful programmes the priorities
do not remain the same. As immunisation and good nutrition be
come universal, village people are addressing issues such as cancer
and diabetes. At CRHP, through the PHC approach, communities
are involved in physical, social and economic rehabilitation of per
sons with leprosy and tuberculosis. They are addressing the issue of
HIV/AIDS and cancer. In the national context, problems such as lep
rosy seem enormous and unsurmountable. However, when these prob
lems are reduced to the smallest community unit they become
250
manageable. In a village perhaps only three or four persons have
tuberculosis or leprosy that needs special care. Communities when
motivated can take care of these problems.
Role of non-governmental organisations.
The government should have the basic responsibility of providing basic
services. However, non-governmental agencies have an important role
in primary health care. The success of PHC depends to a large extent
on community participation. It is difficult to elicit this participation,
particularly from those who need the services most, namely, the poor
and marginalised. NGOs are in a position to act as the interface
between the government and the people, training and empowering
people so they can become co-partners with the government in PHC
activities.
The PHC approach calls for a multi-sectoral approach to health
and development. The NGO can act as catalyst in bringing these
different sectors of development together at the grass roots level.
The NGO is in a position to be flexible and should be innova
tive. Apart from countries like China and Cuba, the components of
the Alma Ata declaration were mainly tried out by NGOs in micro
level projects around the world. NGOs should not merely replace the
government activities by acting as contractors for the government.
Rather they should complement the government’s activities.
The problems in rural areas are so vast and the government has
such meagre resources, and therefore there is little possibility of du
plicating rhe government activities. The NGO should not be perceived
as working in competition with the government.
Integration.
One of the most important aspects of CRHP has been the develop
ment of totally integrated services. Not only have the preventive and
curative health services been totally integrated, but non-medical in
tervention and social and economic aspects of development also have
been well integrated into all the programmes. Doctors, nurses, para
medical workers, social workers and others work together as a team.
They are trained together and learn to respect each other. Hierarchy
has been replaced by a sense of belonging to a team. Learning to
share with each other becomes the climate. Undergirding this con
tinuous training is the development of values of service, sharing knowl
edge, respecting each other and concern for other members as equal
partners. Trust in each other and an optimistic attitude toward fel
low village people have helped communities to accept each other and
form strong cohesive groups.
251
Equity in health care.
Equity implies that every man, woman and child, no matter where he
or she lives, has the right to enjoy good health and deserves to have
access to health services. Equity then means to seek out those who
are poor, forgotten, marginalised, wherever they are. CRHP works
with the 50 per cent of people in the rural communities who live
below the poverty line. Health teams ensure that the Dalits, women,
widows, nomadic tribes and those shunned as criminal tribes are sought
out. CRHP has made sure that the infrastructure and facilities created
to serve these groups are not snatched away from them. The drink
ing water tube wells were placed in the Dalit section of the village so
that the Dalits would have access to the well.
Empowerment.
Primary health care means empowerment. Human beings, regardless
of their station in life have innate unlimited potential within them
selves. People, have been empowered through a process of discovery,
experimentation, trial and error, rerouting when necessary, and by
being non-dogmatic in sharing values and skills. Rural communities
have been empowered through information, training, and imparting
medical, economic, and social skills. Communities are empowered by
way of organisation of farmers’ clubs and Mahila Vikas Mandals.
Through these processes individuals and communities have gained in
self-esteem and self-confidence and have realised that they have jhe
capacity within themselves to determine their own lives.
Looking to the future.
For the past four years we have not been actively involved in the
PHC work at Jamkhed. While we spent two years at Johns Hopkins
School of Hygiene and Public Health in Baltimore, writing this book
not only did the work continue, but the project expanded to a tribal
area over 200 km distant from Jamkhed. Groups of village men and
women from Jamkhed went to Bhandardara, stayed with the village
people, observed their customs and organised Mahila Vikas’Mandals
as well as identifying village health workers. Yamunabai and other
village health workers went and stayed in the Bhandardara villages
to help with the organisation and training. Of her experience Yamunabai
says, ‘The tribal people are very poor and they live in thatched huts.
They are friendly and they invited us to stay with them and share
what they had. It was difficult for me because there was no water
and there was filth and flies all around. Almost every family had
scabies and skin infections. We had no choice; we had to stay in the
overcrowded huts. I, a Brahmin, have never eaten meat. The only
252
food they had was dried fish and rice. The odour of the fish soon
overcame me and I could hardly keep the rice down. Then I remem
bered that once upon a time we too had filth in our village and
there was scabies. All of us from Jamkhed determined to first get rid
of the scabies just as we had done in Jamkhed. Water had to be
fetched from a long distance. This did not deter us. We worked with
the people and in three months we got rid of the scabies. We encour
aged the women to be involved in health activities, identified and
trained women to become village health workers. Despite the physical
hardships it was a rewarding experience.’
With a minimum staff of doctor, social worker, ANM and para
medical workers, together with village volunteers, the primary health
programme has progressed rapidly in the Bhandardara area.
In India, many NGOs have successful primary health care pro
grammes. There are. also many examples of similar experiences around
the world.
Recently we have had opportunities to visit and share our experi
ences with marginalised communities in several countries in Latin
America and Africa. We have been met with enthusiasm as people in
these communities perceive that these principles of PHC can be applied
to their own situations.
Despite these successes, medical education continues to emphasise
training medical graduates in more and more highly specialised areas
of medicine. There is little emphasis on addressing the basic health
problems of the poor and marginalised people who form more than
50 per cent of our country. There is a need for workers to be trained
in community based primary health care.
Encouraged by the sustainability of its approach at Jamkhed, CRHP
wishes to share its experiences with those interested in the health of
marginalised people. Village people also agreed to participate in new
training activities. An institute for training in community based pri
mary health care is underway. The unique feature of this institute is
that 50 per cent of the training will be given by the village people
themselves.
As we have had opportunities to travel and to share these prin
ciples and our experiences, a number of people, especially those in
more ‘developed’ regions and countries, have said to us, ‘But Dr Arole,
but Mabelle, but Raj, you make it sound easy. Surely there have
been crises that were hard for you personally to face, times when
you doubted strength to go on?’
Yes, of course there have been such times. Perhaps the gifts of
our own particular temperaments and the support we have had always
for each other lead us to make less of these difficulties (such as seasons
253
of drought) than others may feel. We began with a hope, a vision,
that has continued to sustain us. But most importantly, we have learned
over and over that empowerment is not a one-way process. It is not
that we, that one set of people ‘provide’ empowerment for others
who receive it. Rather, like water from a well dug in a fortunate
spot, the power flows in many directions and sustains those who may
set the process in motion as well as thosedisempowered for such a
long time. It is a dynamic process which once set in motion trans
forms us, persons and communities.
So from the beginning, we ourselves have been given power by
the very processes and people involved in realising the vision. We
have firmly come to believe that through a process of recognising
and sharing the resources and potential of everyone, communities claim
their right to health. Only people empowered and empowering others
for the common good can find and keep the respect, cooperation
and peace so much needed in this world.
254
URGENT ATTENTION
Bangalore. My feeling is that we have to focus on where the greatest need
is; and not what is convenient for the Consultants or donors to visit.
Regional disparity is a major problem in Karnataka because of historical
legacy and positive discrimination in favour of the Northern Districts is
Karnataka Government policy.
Therefore, Bellary and Koppal are more
deserving than Tumkur or Chickmagalur.
He-n-UX
T"i-<
Hl 5,
Vie Double Burden: Emerging Epidemics and Persistent Problems
/J T
2
The Double Burden:
Emerging Epidemics
and Persistent Problems
Q / he 20th century revolution in health - and the consequent demographic transi1 tion - lead inexorably to major changes in the pattern of disease. Tins epidemio
logical transition results in a major shift in causes of death and disability from infectious
diseases to noncommunicable diseases (1)
As a result of the epidemiological transition, to continue the example of Chile presented
in Chapter 1, the distribution ot causesol death in 1999 differs markedly from the distribu
tion ot causes ot death in 1909, as shown in Figure 2.1 (2). Not only have the major causes
ot death changed, but the average age of death has been steadily using. The resulting new
epidemics ot noncommunicable disease and injuries challenge the finances and capacities
of health systems.
Despite the long list of successes in health achieved globally dunng the 20th century,
the balance sheet is indelibly stained by the avoidable burden of disease and malnutrition
that the world's disadvantaged populations continue to bear. Some analysts have charac
terized a world ol incomplete epidemiological transition, in which epidemiologically polar
ized sub-populations have been left behind (.3). Reducing the burden of that inequality is a
pnoritv in international health. Furthermore, it can be done - the means already exist.
Figure 2.1 Distribution of deaths by cause for two cohorts from Chile, 1909 and 1999
1909
Estimates for 1999
Respiratory infections
35.1%
Sources: 1909 data Preston SH, KeyfitzN, Schoen R, Causes oldeatniUle tables lor national poouiations. New York and London, Seminar Press. 1972.
1999 data: Estimates based on data born the WHO Mortality Database
Tiie World Health Repnr
Health policy-makers in the early decades of the 21st century will thus need to address
a double burden of disease: first, the emerging epidemics of noncommunicable diseases
and injuries, which are becoming more prevalent in industrialized and developing coun
tries alike, and second, some major infectious diseases which survived the 20th century -
part of the unfinished health agenda.This chapter describes this double burden of disease.
It points to the availability of cost-effective interventions that make it possible to complete
substantially the unfinished agenda in the first decade of the 21st century. Health systems
development - discussed in the next chapter - must focus on delivering these interventions
for the poor.
Emerging Epidemics of
NONCOMMUNICABLE DISEASE.' AXES iNIUKIES
The next two decades will see dramatic changes in the health needs of the world's
populations. In the developing regions, noncommunicable diseases such as depression
and heart disease are fast replacing the traditional enemies, in particular infectious diseases
and malnutrition, as the leading causes of disability' and premature death. Injuries, both
intentional and unintentional, are also growing in importance and bv 2020 could rival in
fectious diseases worldwide as a source of ill-health (1) The rapidity of change will pose
serious challenges to health care systems and force difficult decisions about the allocation
of scarce resources.
To provide a valid basis for such difficult health policy decisions, there is a great need for
the development of reliable and consistent data on the health status of populations world
wide. Further, as The world health report has argued before (4.5), a new approach to measur
ing health status needs to be implemented, one that quantifies not merely the number of
Figure 2.2 The emerging cnauenges: DALYs attributable to noncommunicable diseases in low and middle income countries,
estimates for 1998
Other cardiovascular
Inflammatory
23%
Rheumatic
Alcohol depenaence
Bipolar depression
11%
10%
,t heart disease
heart disease
Psychoses
Lung
Stomach
12%
11%
9%
Breast
Obsessive-compulsive
Unipolar
disorders
major depression
8%
38%
6%
Stroke;
Ischaemic
29% :
• heart disease
Other neuropsychiatric
24%
35%
' . conditions
''10%
;
diseases'
10%'
12%
Other
cancers
53%
Leukaemia
6% ..
Cardiovascular
Neuropsychiatric
Liver
-■
Cancers
5%.
Injuries
16%
59%
Source: Annex Table 3.
WHO 99038
Other diseases
The Double Burden: Emerging Epidemics mid Persistent Problems
deaths but also the impact of premature death and disability on populations, and which
combines them into a single unit of measurement. Several such measures have been devel
oped in different countries, many of them being variants of the so-called Quality-Adjusted
Life Year (QALY), which is principally used to measure gains from interventions. In con
trast, the Disability-Adjusted Life Year (DALY) is a measure of the burden of disease.
DALYs express years of life lost to premature death and years lived with a disability,
adjusted for the seventy of the disability. One DALY is one lost year of healthy life. A “prema
ture" death is defined as one that occurs before the age to which the dying person could
have expected to survive if he or she was a member of a standardized model population
with a life expectancy at birth equal to that of the world's longest-surviving population,
Japan. Disease burden is, in effect, the gap between a population's actual health status and
some reference status.
The initial assessment of global disease burden using DALYs was prepared in 1993 for
the World Bank (6) in collaboration with WHO. Subsequently revisions and extensive docu
mentation of disease burden for the year 1990 have been published (1). In this report,
disease burden has been quantified using “standard DALYs", calculated according to the
methods described in earlier work on the burden of disease fl). This report provides new
estimates of disease burden for the year 1998.
\i >\v. Wi.Ml XICAf.l I. DIMlASE.s
In 1998, an estimated 43% of all DALYs globally were attributable to noncommunicable
diseases, in low and middle income countnes the figure was 39%, while in high income
countries it was 81%. Among these diseases, the following took a particularly heavy toll
(see Figure 2.2):
•
neuropsychiatric conditions, accounting for 10% of the burden of disease measured in
DALYs in low and middle income countries and 23% of DALYs in high income coun
tries;
• cardiovascular diseases, responsible for 10% of DALYs in low and middle income coun
tries and 18% of DALYs in high income countries;
•
malignant neoplasms (cancers), which caused 5% ot DALYs in low and middle income
countries and 15% in high income countries.
One of the most surprising results of using a measure of disease burden which incorpo
rates time lived with disability' is the magnitude it ascribes to the burden of neuropsychiat
ric conditions. Because of the limited mortalitv consequences, this burden was previously
underestimated. As shown in Box 2.1, a large proportion of the burden of disease resulting
from neuropsychiatric conditions is attributable to unipolar major depression, which was
the leading cause of disability' globally in 1990. The disease burden resulting from depres
sion is estimated to be increasing both in developing and developed regions. Alcohol use is
also quantified as a major cause of disease burden, particularly for adult men. It is the
leading cause of disability for men in the developed regions and the fourth leading cause in
developing regions.
These findings also highlight the “hidden epidemic of cardiovascular disease" (7). Within
cardiovascular diseases (CVD), which collectively are responsible for about one in eight
DALYs globally, ischaemic heart disease and cerebrovascular disease (stroke) are the most
significant conditions. It has been estimated that ischaemic heart disease will be the largest
single cause of disease burden globally by the year 2020 (1). Box 2.2 discusses in more detail
the nature of cardiovascular diseases in the Eastern Mediterranean Region. Substantive
Tn: W'nrhl Health Her......
evidence suggests that current programmes for CAT) risk factor prevention and low-cost
case management offer feasible, cost-effective ways to reduce CVD mortality and disability
in populations both in developed and developing countries (S). Implementation of such
programmes should be a prionty for health polity-makers as the burden of CVD rises in all
socioeconomic groups and inflicts major human and economic costs on societies
The third largest cause of disease burden within noncommunicable conditions is can
cer. Cancers are responsible for a large proportion of years of life lost and years lived with
disability. Among cancers, the most significant cause of disease burden is lung cancer, which
is projected to become ever more prevalent over the next few decades, if current smoking
trends continue.Tobacco is a major risk factor for several other noncommunicable diseases
as well. As discussed in detail in Chapter 5, tobacco control is one of the major public health
pnonties for the 21st centurv.
Noncommunicable diseases are expected to account tor an increasing share of disease
burden, rising from 43% in 1998 to 73% bv 2020, assuming a continuation of recent down
ward trends in overall mortality (which have vet to be realized in China and elsewhere) (9).
The expected increase is likelv to be particularly rapid in developing countries. In India,
deaths from noncommunicable causes are projected to almost double from about -1.5 mil
lion in 1998 to about 8 million a vear in 2020.
The steep projected increase in the burden of noncommunicable diseases worldwide -
the epidemiological transition - is largely driven bv population ageing, augmented bv the
rapidly increasing numbers of people who are at present exposed to tobacco and other risk
factors, such as obesity, physical inactivity and heavy alcohol consumption.This increase in
noncommunicable diseases induced by changes in age distribution poses significant prob
lems. Health systems must adjust to deal effectively and efficient Iv with the globally chang-
box 2.1 Inc risinti Durden oi neuropsvchiatric disorders
Disease priorities change dramascaliy as measurement of disease buraen shifts from simple mortality
indicators to indicators that incorpo
rate disability Neuropsychiatric con
ditions have been ignored for a long
time as they are absent from cause
of death lists.However.when disease
burden measurement indudestime
lived with a disability, several of the
neuropsychiatric disorders become
leading causes of disease burden
worldwide.
Annex Table 3 reports that 11% of
theglobal burden of disease in 1998
was attributable to neuropsychiatric
conditions.in high income countries,
one out of every four DALYs was lost
to a neuropsychiatric condition,
while in low and middle income
countries this group of conditions
was responsible for one out of ten
DALYs
Of me ten leading causes of disease
burden in young adults (in the 15-44
year age group) four were neuropsy
chiatric conditions. More specifically,
unipolar maior depression was the
fourth leading cause of overall disease
burden in 1990, while in adults aged
15-44 years it was the leading cause
of DALYs. both in high income and in
low and middle income countries. Al
cohol dependence, bipolar disorder,
and schizophrenia were among the
leading causes of disease buroen in
this age group in 1998.
Great attention needs to ty paid to
the growing needs of populations in
Rank of selected conditions among all causes of disease burden.
estimates for 1998
Rank in cause-list
Disease or injury
Unipolar major depression
Alcohol dependence
Bipolar disorder
Psychoses
Obsessive-compulsive disorder
Dementia
Drug dependence
Panic disorder
Epilepsy
Source: Annex Table 3.
World
4
17
18
22
28
33
41
44
47
High
Low and
income
middle income
countries
countries
2
4
14
12
18
9
17
29
34
4
20
19
24
27
41
45
48
46
the area of mental health.As shown
in the table,neuropsychiatric conditipns are among the leading causes
of disability and burden. Psychiatric
disorders are frequently a consider
able dram on health resources as a
consequence of being misunder
stood, misdiagnosed or improperly
treated. With proper budgetary
planning and allocation of resources,
introducing an effective mental
health programme into primary
health care can reduce overall health
costs. Mental health care, unlike
many other areasof health,does not
generally demand costly technol
ogy; rather, it requires the sensitive
deployment of personnel who have
been properly trained in the use of
relatively inexpensive drugs and
psychological support skills on an
outpatient basis.
The Double Burden; Emerging Epidemics mid Persistent Problems
17
ing nature of illness, and health policy-makers will be challenged to find the most cost-
effective uses of their limited resources to control the rising epidemics of noncommunicable
diseases. In contrast to the limited number of conditions responsible for most of the excess
disease burden among the poor, policy-makers will need to develop systems capable of
responding to an enormous variety of conditions as the epidemiological transition ma
tures.
At the same time, health policy-makers will need to respond to the unexpectedly per
sistent inequalities in health status within countries.This is a problem that affects disadvan
taged populations in developed and developing countries alike. Traditionally, the focus of
global health policy has been on the less developed nations. Recent studies have revealed
surprisingly large inequalities within developed nations, and they highlight the need for
policies that focus on disadvantaged populations throughout the world. Box 2.3 summa
rizes some of the findings of national studies on inequalities in the USA and the UK.
l.\'It.'Rifs
Injuries, intentional and unintentional, are a large and neglected health problem in all
regions, accounting for 16% of the global burden of disease in 1998. Figure 2.3 shows the
major categories of injuries responsible for most of the burden. Road traffic accidents were
the ninth leading cause of disease burden globally in 1998, fifth in the high income coun
tries and tenth in the low and middle income countries. For adult men aged 15-44, road
traffic accidents are the biggest cause of ill-health and premature death worldwide, and the
second biggest in developing countries.Tire burden from road traffic accidents is projected
to increase globally, and particularly in developing countries. In sub-Saharan Africa, partly
because of the projected reduction of the burden from infectious diseases, injuries (prima
rily road traffic accidents, war and violence) are expected to account for a large proportion
of ill-health.
Recent figures for homicides, suicides and traffic accident deaths for countnes in the
Amencas show that these rank as the mam causes of death and disability. Every year, close
to 120 000 people are killed, 55 000 commit suicide, and 126 000 die in traffic accidents
in the .Americas (10). At least 12 countnes have homicide rates above 10 per 100 000
inhabitants.
Sox 2.2 Cardiovascular diseases in the Eastern Meoiterranean
The countries of the Eastern Medi
terranean are going through an epi
demiological transition, leaving
many of them with the double bur
den of infectious and noncommuni
cable diseases. The ageing of the
population, progressive urbaniza
tion, and changes in nutritional hab
its and lifestyles all contribute to the
occurrence of cardiovascular dis
eases.
Although age-specific mortality
rates are declining, the risk factors for
cardiovascular diseases are more
prevalent than before. Diets have a
higher fat content; there are over 17
million people with diabetes and a fur
ther 17 million with impaired glucose
tolerance; smoking is widespread es
pecially among younger people; and
physical activity is insufficient.Prevention has the potential to reduce mor
tality further.
Mortality data are inadequate in
many countries of the Eastern Medi
terranean, but available information
Contributed by the WHO Regional Office for the Eastern Mediterranean.
shows that coronary heart disease is
increasing as a cause of hospital ad
mission and is being seen at younger
ages than before. Hypertension has
been reported to affect more than
20% of adults, but it is estimated that
more than half of the cases are not di
agnosed.
Community-based intervention
programmes have been shown to be
effective in promoting healthy life
styles and reducing the incidence of
cardiovasculardiseases.WHO is there
fore working with countries to es
tablish pilot projects to provide in
formation on risk factors and to
promote healthy lifestyles with re
gard to tobacco use,diet and physi
cal activity. Special emphasis is
placed on inculcating good habits in
children and adolescents. Efforts are
made to involve local groups and
community decision-makers, so as ■
to mobilize the community and en
sure that people are able to follow
healthier lifestyles.
Violence and self-inflicted injuries (including suicide) are a major public health concern
because of their increasing significance within the global disease burden. Injuries primarily
affect the younger age groups and often result in disabling conditions. In higher income
countries, road traffic accidents and self-inflicted injuries were among the ten leading causes
of disease burden in 1998 as measured in DALYs. In less developed countries, road traffic
accidents were the most significant cause of injuries, ranking eleventh among the most
important causes of lost years of healthy life. War, violence and self-inflicted injuries were
all among the leading twenty causes of such loss in those countries. Intentional injuries
primarily affect young adults, with males in the age group of 15-34 years bearing a particu
larly large proportion of the burden.
Domestic violence, especially against women, is not always reflected in physical injury
but may be apparent in psvchological sequelae.Traditional!)’, violence has been classified as
intentional injur)’. While it is clearly important to recognize violence as a cause of injur)-,
Figure 2.3 Tne emerging cnalienaes: DALYs attributable to imuries in low ana middle income countrie
estimates for 1998
Box 2.3 Heaitn inequalities in tne USA and the UK
Tne use of national life expectancy
at birth as a measure of health and
well-being of a population places
the United States among the betteroff countries. National life expect
ancy hasbeen rising steadily for both
men and women in the last half of
the century. National life expectancy
is an aggregate measure and masks
the remarkable vanation that is ob
served within the nation.The results
from the on-going study on the bur
den of disease and injury in the USA
have shown that at the county level,
the range in life expectancy is simi
lar to the range observed across all
countries. The range in life expect
ancy between females in Steams,Min
nesota and males in Bennett, Jackson,
Mellette, Shannon, Todd and
Washabaugh counties. South Dakota,
is 22.48 years. This range becomes
even wider - 41.3 years - when race
specific life expectancy across counties
is calculated. This difference of 41.3
years corresponds to 90% of the glo
bal range from the population with the
lowest life expectancy (males in Sierra
Leone) to the population with the
highest (females in Japan).
The USA has been reasonably suc
cessful at reducing the inequalities in
absolute terms (not relative terms) in
child and adolescent mortality as com
pared to the range in mortality ob
served between the established mar
ket economies and sub-Saharan Africa.
On the other hand, the USA has been
much less successful in reducing in
equalities in adult male and to a lesser
but substantial extent adult female
mortality.While the focus of most pub
lic health analysis remains health con
ditions in children and the elderly,the
largest inequalities in the USA relative
to the rest of the world are found in
adult male and adult female health
conditions.
Large health inequalities have also
been reported in the UK. Last year an
independent inquiry set up by the Brit
SountevMurray CJL etaU/Sprarems ofmorro/fty by county ondrace: l965-194t.CainbridgeMA.Harva rd Center for Population and Development
Studies. 1998 (US Burden of Disease and Injury Monograph Series).
Report ofthe Independent Inquiry into inequalities in Health. London, lhe Stationery Office, 1998.
ish government reviewed the evi
dence on inequalities in health in
England.The report published in No
vember 1998 states that although
average mortality rates have fallen
in the last 50 years, unacceptable
inequalities in health have persisted.
The report identified three crucial
approachesiall policies likely to have
an impact on health should be
evaluated in terms of their impact
on health inequalities; a high prior
ity should be given to the health of
families with children; and further
steps should be taken to reduce in
come inequalities and improve the
living standards of poor households.
The Double Burden: Emerging Epidemics ami Persistent Problems
particularly among women where the connection may not always be evident, the health
consequences also need to be understood. So too does the different nature of the violence
experienced by men, women and children.
Globally, injuries are responsible for one in six years lived with disability. Injuries have,
nevertheless, often been a neglected area of public health policy. More attention there
fore needs to be focused on dealing with the growing problem of injuries - through more
comprehensive prevention, improved emergency and treatment services, and better
rehabilitation.
Persistent Problems of
Infectious Diseases and Maternal
and Child Disability and Mortality
Despite the extraordinary advances of the 20th centurv, a significant component of the
burden of illness globally still remains attributable to infectious diseases, undernutrition
and complications of childbirth.These conditions arepnmanly concentrated in the poorest
countries, and within those countries they disproportionately afflict populations that are
living in poverty.The residual concentration of infectious diseases afflicting the poor is trulv
an avoidable burden, because inexpensive and effective tools exist to deal with much of it.
In fact, it mostly results from relatively few conditions.
The disproportionate share of the burden of disease on the poor is demonstrated in
Table 2.1 and Figure 2.4, based on analyses reported in Annex Table 7. Within countries, the
disadvantaged fare much worse as measured by several health indicators than the betteroff. Those living in absolute poverty, compared with those who are not poor, are estimated
to have a five times higher probability of death between birth and the age of 5 years, and a
2.5 times higher probability of death between the ages of 15 and 59 years. Overall, the poor
fare worse than the better-off in society on all health indicators studied. Figure 2.4 demon
strates the distinctly different distributions across countries of health indicators for the poor
and the non-poor. It clearly shows that the non-poor have a much higher overall health
level than the poor.
These data illustrate another critical point. Some countries attain far better health con
ditions for their poor people than others. Poor children in China have less than a third of
the nsk of dying before their fifth birthday than comparably poor children in the United
Table 2.1 Health status of the poor versus the non-poor in selected countries, around 1990
Country
Percentage of
Probability of dying per 1000
Prevalence of
population
between birth
between ages 15
in absolute
and age 5, females
and 59, females
poverty^
Non-poor
Poor:non-poor
Non poor
ratio
Aggregate3
Poor:non-poor
tuberculosis
Non-poor
ratio
Poor:non-poor
ratio
38
4.8
92
4.3
23
2.6
7
83
34
12.3
2
80
3.8
Chile
15
China
22
28
6.6
35
11.0
13
Ecuador
8
45
4.9
107
4.4
25
1.8
India
53
40
4.3
84
3.7
28
2.5
Kenya
50
41
3.8
131
38
20
2.6
Malaysia
6
10
15.0
99
5.1
13
3.2
* Poverty is defined as income per capita of less than or equal to S1 per day, expressed in dollars adjusted for purchasing power.
3 The aggregate estimate refers to all countnes listed in Annex Table 7
See ExDlanatory Notes to tne Statistical Annex for an explanation of the methods used to derive the estimates.
Source: Annex Table 7.
Tr.' World Health kct'—-: l:-r-
Republic ofTanzania. Poverty is not an insurmountable barrier to better health when poli
cies are right. This further illustrates that much of the burden on the poor is unnecessary.
THI UNFINISHED AGENDA
The populations of developing countries and particularly the disadvantaged groups within
those countries remain in the early stages of the epidemiological transition, where infec
tious diseases are still the major cause of death. Figure 2.5 depicts the distribution of deaths
in low and middle income countries in 1998. It illustrates the five major childhood condi
tions which are responsible for 21% of all deaths in low and middle income countries:
diarrhoea, acute respiratory infections, malaria, measles and perinatal conditions. Almost
all DALYs from these five conditions occur m developing countries. Less than 1 % are reg
istered in high income countries. It is noteworthy that most of the DALYs among infants
and voung children are attributable to a limited number of conditions for which either
preventive or curative interventions exist.This report will argue, in Chapter 3, that a priority
for health systems development is to achieve effective delivery' of these interventions, which
are delineated below.
Immunization programmes have yielded the most significant changes in child health in
the last few decades. Although some vaccines represent the most cost-effective public health
intervention of all, the world does not use them enough. At least 2 million children still die
each vear from diseases for which vaccines are available at low cost. Similarly, for diarrhoeal
disease, there exists a simple, inexpensive anil effective intervention: oral rehvdration therapy
Diarrhoeal diseases and pneumonia together account tor a high proportion oi deaths of
children in developing countries. In several developing countries, therefore, diarrhoeal dis
ease control programmes have been merged with a simplified approach, promoted bvWHO,
to detecting acute respiratory infections (primarily pneumonia).
In adults, maternal conditions. IIIV/AJDS and tuberculosis are the three major causes of
disease burden in developing regions, as depicted in Figure 2.5.1bgcther, they accounted
for 7% of all DALYs in 1998. Among maternal conditions, obstructed labour, sepsis and
unsafe abortion were among the ten leading causes of death and disability among women
aged 15-44 years in developing countries in 1998.The burden of maternal conditions has
been hard to quantity because of the lack of reliable data. But it is a major public health
problem and represents a major and unnecessary' burden for which police'-makers should
increasingly be held accountable.
Figure 2.-5 Distribution of the probability of death, selected countries, around 1990
Probability of death between ages 15 and 59, females
Source: Annex Table 7.
E?
Non-poor
Poor
The Double Burden: Emerging Epidemics and Persistent Problems
21
The persisting and evolving challenges
Despite the successful eradication of smallpox and the control of several infectious dis
eases in the 20th century, there remain some significant threats that are particularly chal
lenging because of the changing nature of the disease pattern and the ways it manifests
itself in populations. A clear example is malaria. Public health efforts in the last four dec
ades have been remarkably effective in reducing the burden of malaria in South-East Asia
and Latin America. Despite this achievement, malaria remains a major public health prob
lem, particularly in Africa (see Annex Table 8). Malaria has been named as one of WHO's
top priorities. Chapter 4 provides a detailed overview of the problem and the WHO ap
proach to it.
Malaria, along with HIV/AIDS and tuberculosis, can be classified among a group of
diseases for which control efforts are being jeopardized by microbial evolution. This prob
lem is described in Box 2.4. Figure 2.5 demonstrates that a large proportion of the deaths
occurring between the ages of 15 and 59 years in low and middle income countries can be
attnbutcd to HIV and tuberculosis. Effective and cost-effective strategies for controlling
tuberculosis exist; but standard treatment regimens require six or more months of chemo
therapy and rely on well-organized services to achieve high rates of adherence. The inter
action of HIV and tuberculosis is also an important public health matter, as individuals who
are infected with both are more likelv to die from tuberculosis than from other infections.
During the period of active tuberculosis infection, they may transmit the infection to previ-
ouslv uninfected contacts. Because HIV infection is projected to increase over the coming
decade, the burden from tuberculosis may also increase unless there are energetic efforts to
extend the reach of existing control measures with proven effectiveness and cost-effective-
fioure 2.5 DALYs attributable to conditions in the unfinished aqenua in low and middle income
countries, estimates lor 1998
tuberculosis
Maternal
22%
conditions
Perinatal
25%
conditions
26%
Malaria
Measles
13%
10%
Diarrhoea
24% .•
Source: Annex table 3.
ness, as well as to invest in the development of new tools for tuberculosis control. The
tuberculosis situation in the Western Pacific Region is descnbed in Box 2.5.
The challenge posed by these persisting and evolving conditions is that tools to control
them have either not been developed or, if available, are not used effectively or, in some
cases, are becoming increasingly ineffective (11). As examined in more detail in Box 2.4,
antimicrobial resistance is a worrying phenomenon since it could have great adverse effects
on the control and treatment of diseases such as pneumonia, tuberculosis and malaria.
These conditions emphasize the need, as discussed further in Chapter 3, for health systems
to invest m research and development strategies to come up with cost-effective tools to
control the remaining threats trom infectious diseases.
Increases in international air travel, trade - particularly the food trade - and tourism
mean that disease-producing organisms, the deadly as well as the commonplace, can be
transported rapidly from one continent to another (4). This trend may threaten interna
tional public health securitv. although so tar the consequences have remained quantita-
tivelv unimportant.To counter anv such threat, the global surveillance of infectious diseases
is being improved through an international information network.This should make it pos
sible to recognize outbreaks raster.
TH! A\ .’I'
BURD:
»! I )I Xi ’.V
The most significant fact about the unnecessary burden is that it is concentrated on a
few conditions, most of which are avoidable. There are many vaccines, drugs and clinical
algonthms that if employed globally would lead to a dramatic reduction in the burden ol
infectious diseases. Figure 2.6 illustrates the links between infant mortality rates and per
capita income in some of the most populous low and middle income countries.The coun
tries that are above the curve in 1990 are low and middle income countries which had a
higher infant mortality rate than expected, given their average income per capita. Their
distance above the curve indicates potential reductions tn mortality, i.e. the gains that would
box 2.4 bi it ronin i evoiutio: - ti
continually changing threat of infectious disease
Resistance of disease-causing or
ganisms to antimicrobial drugs and
other agents has become a great
public health concern worldwide.lt
is having a deadly impact on the
control of diseases such as tuberculosis,malana,cholera,dysenteryand
pneumonia.
Antimicrobial resistance is not a
new, nor a surprising problem, but it
has worsened in the last decade. All
bacteria possess an inherent flexibil
ity that enables them, sooner or later
to evolve genes that render them
resistanttoanyantimicrobial.By kill
ing susceptible bacteria, an antimicrobial provides selective pressures
that favour overgrowth of bacteria
carrying a gene that confers resistance.The continuous use of antimi
crobial agents encourages the
multiplication and spread of resist
ant strains.
The result is that drugs which cost
tens of millions of dollars to produce,
and take perhaps 10 years to reach
the market, are only effective for a
limited time period. Examples ofdiseases whose agents have demon
strated drug resistance include
tuberculosis, malaria, gonorrhoea
and typhoid fever.
In the case of tuberculosis, poor
presenbing practices or poor patient
compliance with treatment have led
to the development of strains of
Mycobacterium tuberculosis which are
resistant to the available drugs.Malaria
presents a double resistance problem
resistance of me Plasmodium parasites,
which cause the disease, to a nt imalarial drugs. and resistance of theAnophe/es mosquitoes, the vectors of the
disease, to insecticides. Pneumococci
and Haemophilus influenzae, the most
common bacteria causing acute res
piratory infections in children,are be
coming more resistant to drugs. More
than 90% of Staphylococcus aureus
strains and about 40% of pneumo
cocci strains are resistant to penicillin.
In the USA,antibiotic-resistant bac
teria generate costs of a minimum
of S4 billion to $5 billion yearly;these
costs are likely to be much higher in
developing countries
Answenng questions concerning
the use of antibiotics in food produc
tion, emphasizing ways to prolong
the effectiveness of existing antibi
otics, pursuing key areas of basic
research and seeking incentives
for developing new antibiotics, and
exploring legal and regulatory
mechanisms in key areas of need are
priorities that need to be addressed
by policy-makers.
Source: Harrison PF, Lederberg J (edst.Anomiaobiolresistance:Issues and options. Institute of Medicine.Washington DC, National Academy Press, 1998.
■
Double Burden: Emerging Ei'idemics and Persistent Problems
result from their joining the curve. That the infant mortality rate in low and middle income
countries is higher in the most populous countries suggests the importance of focused
international assistance. Health systems need to provide the existing, cost-effective inter
ventions to these populations so that the countries that are currently lagging behind can
join the curve.
Immunization is the greatest public health success story' in history (12).The basic vaccines
are available to combat the six major diseases in children (measles, tetanus, pertussis, tu
berculosis, poliomyelitis and diphtheria). Immunization coverage falls far short of 100%,
and it is the world's poorest and most vulnerable children who remain unreached.
Poliomyelitis is an example of a disease for which eradication is possible.The only rea
son for the existence of remaining cases is insufficient coverage. WHO is committed to
Figure 2.6 infant mortality rate related to income
100
Bangladesh
Nigeria •
IMR in the most highly
® Pakistan
*
populous countries far
• ■ India
exceeds predicted levels.
r . Indonesia
Turkey
r
China
* Brazil
*’
Islamic
Mexico
Republic
of Iran
:s
0
0
1000
2 000
3 000
4 000
5 000
6000
7 000
8000
9000
10000
GDP per capita, adiusted for purchasing power
(in 1985 international dollars)
Note: for explanation of the curve relating IMR to income, see note to Figure 1.4
3ox 2.5 Tuberculosis in me Western Pacific
The notified cases of tuberculosis
in theWestern Pacific Region in 1996
represented 25% of the global total.
mainly because expansion of the
WHO tuberculosis control strategy,
particularly in China, improved case
management and brought many
more cases under treatment. There
were 2.16 million estimated new
cases in 1997, and the average case
fatality rate was 20%. Coinfection
with HIV is still low in the Region as
a whole, but those who are coinfec
ted with tuberculosis and HIV may
reach 26 per 100 000 population by
2000. WHO has been collaborating
dosely in the establishment of sur
veillance of HIV infection among tu
berculosis patients in Cambodia. Malaysia.and Viet Nam.
Data from 21 countries and areas in
the Region show that the majority of
cases occurred during the productive
years of life. Delayed diagnosis or par
tial treatment often lead to long
standing lung disability and job loss,
causing socioeconomic hardship. Un
treated or inadequately treated tuber
culosis patients spread the infection to
others, especially in crowded and poor
communities.Children aged 5-9 years
living in urban slums in the Philippines
showed more than twice the preva
lence rate of infection for the general
Contributed by me WHO Regional Office for theWestern Pacific
urban population: 39% of them were
infected with the disease.
Tuberculosis ignores national
boundaries. In Australia, Hong Kong
(China), Malaysia and Singapore, the
numbers of tuberculosis cases have
not decreased for several years be
cause of the increased or continued
detection of new tuberculosis patients
among immigrants.
The directly observed treatment,
short course (DOTS) strategy was in
troduced in the Western Pacific in the
early 1990s and is now used in 28
countries and areas; 35% of tubercu
losis cases are treated with DOTS,and
55% of the total population have ac
cess to the strategy.ln China,a DOTS
programme supported by theWorld
Bank is being implemented with
WHO collaboration in 13 provinces.
The programme has so far achieved
a cure rate of over90%and is acces
sible to 560 million people In Cam
bodia. more than 90% of district
health facilities are using DOTS as a
routine strategy.ln the Philippines,
a new approach using DOTS began
in three provinces in 1996, in col
laboration with WHO, raising the
cure rate from 60% to 80%. DOTS
will be accessible to more than half
of the total population in the coun
try by the end of 1999.
eliminating poliomyelitis cases by the year 2000. As is shown in Figure 2.7, there have been
remarkable reductions in the geographical spread of the disease since 1988. The last case
caused by wild poliovirus in the Western hemisphere occurred in Junin, Peru, on 23 August
1991. The last case in WHO's Western Rtcific Region was recorded in March 1997 near
Phnom Penh in Cambodia WHO has just initiated a “final stretch” effort with the goal of
stopping transmission globally by December 2000, of certifying this achievement by 2005
and of stopping immunization by 2010. The eradication effort illustrates two important
points. First, partnerships with nongovernmental organizations can be very productive:
Rotarv International has made major commitments to polio eradication and its influence
with local leaders plus financial contributions (about USS 500 million) have been critical to
success. Second, propcrlv designed, highly goal-oriented programmes can contribute im
portantly to health systems development
WHO is also involved with the provision of interventions against several other infec
tious diseases. The Integrated Management ot Childhood Illness is a group of preventive
and curative interventions. The strategy focuses on pneumonia, diarrhoea, measles, ma
laria and malnutntion, as these account for 70% of all childhood deaths globally, but it also
addresses other senous infections (for example, meningitis), other causes of febrile disease
(for example, dengue) and other associated problems (such as eve problems associated
with measles or vitamin A deficiency, and ear intections). Preventive interventions includ
ing immunization, support for breastfeeding and other nutrition counselling are also em
phasized.
Other similar initiatives are in different stages of development and implementation. For
tuberculosis, the “directly observed treatment, short course" (DOTS) intervention has been
Figure 2.7 Reductions in wild oohovirus transmission between 1988 and 1998
Vic Double Burden: Emerging Epidemics and Persistent Problems
shown to be highly cost-effective (see Box 2.6).Tuberculosis is highly concentrated in poor
subgroups of populations, as indicated in Table 2.1. Prevalence of tuberculosis is estimated
to be almost four times higher in populations living below the poverty line than in the
better-off.The adult lung health initiative has grown out of the tuberculosis control activi
ties of WHO, recognizing that only a small proportion of adults presenting with a cough
have tuberculosis and that adequate treatment or advice should be provided to individuals
with other lung diseases.The initiative offers an integrated approach to detecting and treating
tuberculosis, asthma and chronic obstructive lung disease.
Maternal mortality’ risks, which are highly concentrated in developing countries, are
also to a large extent preventable and avoidable.The mother-baby package aims to reduce
mortality and disability associated with maternal reproductive health, the risks of delivery
for both mother and child, and the first weeks of life.
At the end of the 20th century, it is unacceptable that women continue to suffer and die
as a result of complications related to pregnancy and childbirth. The enormous disparities
in levels of maternal mortality' and morbidity between rich and poor are a continuing af
front. The evidence of what works to reduce maternal mortality already exists. The inter
ventions needed are cost-effective. Expanding health system coverage is required: women
must have access to skilled assistance during pregnancy and childbirth, and they must be
able to reach a functioning health care facility when complications arise.
Box 2.6Tuberculosis and the "Stop TB"Initiative
Tuberculosis was one of the chief
causes of death in northern Europe
and the Amencas until about 1900
Mortalityratesgraduallyfell because
of improved living conditions and
the advent of effective chemo
therapy, but tne disease persisted in
developing countries, where it
causes some 25% of preventable
mortality among young people. It is
still a leading killer of young women
worldwide.About 1.8 billion people
are infected with the tuberculosis
baciilus.and the tuberculosis burden
wiil grow with an expanding global
population. Inappropriate or inad
equate tuberculosis treatment fur
ther increases transmission. So do
such assaults on the health of the
poor as hunger, civil disturbances
and. most importantly, HIV which
alone will account for some 14% of
global cases by the year 2000.
Because tuberculosis predomi
nantly hits young adults, its social
and economic consequences are
among thegreatestofany infectious
disease.Almost all cases are in coun
tries least able financially to mount
an effective response. In countnes
where resources are generally sufficient. their poorallocationand ineffec
tive use often result in treatmentwhich fails to cure almost all patients.
Theseconditions explain the evolution
of multidrug-resistant strains of tuber
culosis.
Since 1989, WHO has encapsulated
current best practice for tuberculosis
case-finding and treatment into the
DOTS (directly observed treatment.
short course) strategy and. together
with the World Bank and Harvard Uni
versity, has shown it to be one of the
most cost-effective health interventionsavailable.Over lOOcountnesnow
accept DOTS as a standard approach.
and over 1 million patients have been
treated with it since 1990. Global
surveillance systems have been estab
lished and the spread of drug resist
ance is being charted.
But progress is too slow, mainly be
cause of the lack of political will and
commitment withinanumberofhigh
prevalence countnes to broaden the
deployment of the strategy to all who
need it. The "Stop TB' initiative arose
from discussion of these constraints
between representatives of several of
the high burden countries which ac
count for 80% of the global epidemic,
the International Union against Tuber
culosis and Lung Disease, the Royal
Netherlands Tuberculosis Association,
the American Lung Association, the
American Thoracic Society, the US
Centers for Disease Control and Pre
vention, the World Bank and WHO.
WHO aims to expand significantly this
global coalition and to increase invest
ment in tuberculosis control, in order
to attain the Stop TB goal of reducing
the tuberculosis disease burden.
The Stop TB initiative will focus on
four products to accomplish its objec
tives.
• A global action plan to guide and
accelerate coordinated responses to
tuberculosis control internationally,
regionally and nationally. It will
offer an analytical framework and
recommendations for immediate
action in high burden countries and
particular settings, such as areas
significantly affected by multidrug
resistant strains of tuberculosis.
• A global tuberculosis drug facility to
provide universal access to high
quality Fixed Dose Combination
preparations of anti-tuberculosis
drugs and to ensure coordinated
international arrangements for
their financing, procurement and
supply, quality control and distri
bution.
A global research agenda to ad
dress short-term operational con
straints and the development of
new diagnostic agents.drugs and
vaccines It will facilitate collabo
ration on research capacity
strengthening in lowmcome.high
prevalence countries; expansion
of appropriate policy-relevant
health systems research, control
and treatment of multidrug
resistant tuberculosis; and the
development of new tools.
A global charter for advocacy and
commitment to enable endemic
countries and their partners to
declare renewed commitment
and agreement on specific steps
to be taken. It will generate in
creased international attention to
t uberculosis.Specific performance
targetswill enable the monitoring
and reporting of progress.
Syndromic treatment of sexually transmitted infections is another example of defining
best practices in the face of resource constraints. Box 2.7 describes successful interventions
to stop HIV transmission in Thailand and elsewhere in South-East Asia.
Rationalization of drug use and development of drug supply systems can similarly be
aided by clearly defined standard guidelines where first and second line drugs for each
level are specified. Revision of the regulations on who can use which drugs is often needed.
For example, an injection of quinine for severe malana or chloramphenicol for severe pneu
monia, pnor to referral to a higher level in the health system, mav be life saving. But health
staff at first-level facilities mav not be authorized to use injectable drugs or the drugs mav
be supplied regularly only to hospitals. Policies may need to be changed to accommodate
broader use of certain drugs tor defined purposes.
In addition to the disease-specific interventions and control programmes which are
available, there is also a need to deal with a significant risk factor for disease, malnutrition,
which is primarily concentrated in the world's poorest and most disadvantaged populations.
Malnutrition is estimated to be the single most important risk factor for disease, being
responsible for 16% of the global burden in 1995, measured in DALYs ('ll. Malnutrition,
either in the form of protein-energy malnutrition or micronutnent malnutrition, primarily
of iron, vitamin A and iodine, often contributes to premature death, poor health, blindness,
growth stunting, mental retardation, learning disabilities and low work capacity (1.3,14)
Protein-energy malnutrition, as indicated bv slow or incomplete physical growth is, how
ever, as much a consequence of disease as a cause. Infection mav, in many environments,
contribute more to malnutrition than dietary inadequacy. 1 lence disease control is impor
tant for reducing the malnutrition burden.
Box 2.7 HIV/AIDS control in South-East Asia: the challenge of expandino successful programmes
The human immunodeficiency vi
ms (HIV) was slower to emerge in
South-East Asia than in other carts
of the world, but it is now a senous
public health problem and a threat
to development. The first patient
with AIDS was reported in 1984 from
Thailand, since when a total of
92 391 cases of the disease have
been reported up to 1 July 1997,
mostly from Thailand, India and
Myanmar. However, because of un
der-reporting and under-diagnosis
the reported cases only reflea a pro
portion of the true problem.UNAIDS
and WHO estimate that there are
currently more than 55 million peo
ple in WHO's South-East Asia Region
(which includes India) who are in
fected with HIV -18% of the global
total.ln 1998 alone there were esti
mated to be 1.2 million new infec
tions in the Region. Heterosexual
transmission may spread the virus
from high-risk groups to the general
population.
National authorities in the Region
are responding to the pandemic with
urgency.They have developed strate
gic plans and are implementing a va
riety of control measures, as the
following examples show.
• Thailand's 100% condom use pro
gramme has received worldwide
attention. Its effectiveness can be
assessed by the declining HIV inci
dence among military recrui ts: fro m
3.6%in 1993to2 ,1%in 1995.Atthe
same time,sexually transmined dis
eases are at a lower rate than ever
before.
• In Calcutta, India, the Sonagachi
health care and education projea
among sex workers has become a
model for successful peer education;
HIV prevalence remains low and
sexually transmitted diseases are
declining.
Contributed by the WHO Regional Office for South-East Asia.
• Needle exchange programmes and
community-based treatment ap
proaches for injecting drug users in
Myanmar and Nepal have been ef
fective in bringing about behav
ioural change and reducing HIV
infection rates.
WHO continues to provide techni
cal, material and logistical support to
national programmes for AIDS preven
tion and the control of sexually trans
mitted diseases,through the Regional
Office in New Delhi and in selected
countries.WHO collaborates with the
World Bank and with UNAIDS - of
which it is a cosponsor - in assisting
national programmes and in carrying
out intercountry and regional activi
ties.
The integration of care of sexually
transmitted diseases into the general
health services is considered a priority
in the region, necessitating the train-
inqofpnmarycareworkers.managers and private practitioners. WHO
and UNAIDS provide support togovernments in order to monitor the
trends of the HIV/AIDS pandemic
through surveillance, to promote
research,to ensure safe blood trans
fusions, and to strengthen labora
tory diagnostic services. Other
priority interventions include case
management capacity building,
health promotion and education,
and the planning of comprehensive
careandcounsellingfor people with
AIDS orinfeaed with HIV.
Evidence shows that intervention
can succeed. Augmented political,
financial and technical support is
required to make sure that interven
tions are delivered where they are
needed.
The Double Burden: Emerging Epidemics and Persistent Problems
Interventions to reduce micronutrient malnutrition are likely to prove particularly costeffective. Programmes can include four strategies - supplementation, fortification, food
based approaches leading to dietary diversification, and complementary public health control
measures - to the degree appropriate and feasible (O.The long-term goal of intervention
should be to shift emphasis away from supplementation towards a combination of food
fortification - universal salt iodization or iron-fortified flour, for example - and dietary di
versification.
In conclusion, the double burden of disease defines the complexity of the problems
health systems must address. The two elements of the double burden differ markedly tn
their implications for policy.Tire unfinished agenda deals with a limited number of condi
tions, highly concentrated on the poor and for most of which extremely cost-effective inter
ventions are available.This burden on the poor is, indeed, an unnecessary' one that targeted
programmes can alleviate. Epidemiological transition, on the other hand, generates epide
miological diversity.This aspect of the double burden involves large numbers of conditions
potentiallv affecting everyone, although here again the poor suffer more. Interventions -
whether preventive or curative - are less likely to be decisive, although there are important
exceptions, such as tobacco control discussed in Chapter 5. Health systems must be able to
respond flexibly to this diversity.
1.
Murray CJL, Lopez AD (cds). The global burden ofdisease: A comprehensive assessment of mortality and
disability from diseases, injuries. and risk factors in 1990 and projected to 2020. Cambridge, I larvard School
ot Public I lealth on behalf of the World I lealth Organization and’Hie World Bank, 1996 (Global Bur
den of Disease and Injur,' Series,Void).
2.
Preston SH, Keyfitz N, Schoen R. Causes of death: Life tables for national populations. New York and
London, Seminar Press, 1972.
3
Frank J et ai. I lealth transition in middle-income countries: new challenges tor health care. Health
policy and planning, 1989, 4(1): 29-39.
4
rhe world health report 1996 - Fighting disease, fostering development. Geneva, World Health Organiza
tion, 19%.
5. The world health report 1998 - Life in the 21st century: A vision for all. Geneva, World Health ()rganization, 1998.
h. World development report 1993 - Investing m health. New York, Oxford University Press for The World
Bank. 1993.
7. Editorial.The hidden epidemic of cardiovascular disease The Lancet. 1998,352(9143): 1795.
8.
Howson CP, Reddy KS, Ryan TJ, Bale JR (eds). Control of cardiovascular diseases in developing coun
tries. Research, development and institutional strengthening. Institute of Medicine. Washington DC, Na
tional Academv Press, 1998.
9.
Investing m health research and development. Report of the Ad I loc Committee on Health Research Relating to
Future Intervention Options. Geneva, World Health Organization, 1996 (document WHO/TDR/Gen/
96.1).
10.
Health situation in the Americas: Basic indicators 1998. Washington, PAHO/WHO, 1998 (document PAHO/
HDP/HDA/98.U1).
11.
12.
Harrison PF, Lederberg J (eds). Antimicrobial resistance: Issues and options. Institute of Medicine. Wash
ington DC, National Academy Press, 1998.
Henderson RH. Immunization: going the extra mile. In: The progress ofnations 1998. NewYork, UNICEF,
1998.
13. Howson CP, Kennedy ET, Horwitz A (cds). Prevention ofmicronutrient deficiencies: Toolsfor policymakers
and public health workers. Institute of Medicine. Washington DC, .National Academy Press, 1998.
14. WHO global database on child growth and malnutrition. Geneva, World Health Organization, 1997 (docu
ment WHO/NUT/97.4).
KACH - 2000
INTEGRATED MANAGEMENT OF CHILDHOOD ILLNESS
Material as downloaded from internet
1MC1 a joint WHO/UNICEF initiative
Every year, about 12 million children die before reaching their fifth birthday. Over 70% of these deaths, the
vast majority occurring in the developing world, are due to acute respiratory infections, diarrhoeal diseases,
malaria, measles and malnutrition, often in combination.
In the past decade, major progress has been made to reduce and contain childhood mortality and morbidity
through universal childhood immunization, control of diarrhoeal diseases and acute respiratory infections,
nutrition programmes (including breast-feeding promotion) and through implementation of other primary health
care activities. In spite of this progress, major challenges remain, as mortality rates are still unacceptably
^igh, especially in the sub-Saharan Africa and South Asia.
In keeping with the Convention on the Rights of the Child, every child has the right to, inter alia, access to care
for the most prevalent causes of illness and death, as well as the measures to prevent them.
What is IMCI?
Integrated Management of Childhood Illness (IMCI) is a strategy for reducing the mortality and morbidity
associated with the major causes of childhood illness. Its development by WHO and UNICEF started in 1992.
It was decided to initially focus on improving care at the first level health facilities where millions of children
arrive sick each day, most of them with one or more of the major causes of illness and death. A set of generic
guidelines for management of childhood illness at this level was completed in 1996 and is now starting to be
used as the basis for introducing this component of IMCI in countries. These generic materials cannot be
used without substantial adaptation at country level, based on the country-specific situation.
The current focus is on improving the quality of care of children at first-level health facilities (health centres
and outpatient services) in both rural and urban areas through the use of standardized procedures and on
integrated approach to health care. The curative component of IMCI is adapted to address the most common
life-threatening conditions for children in each country focusing on diarrhoea, pneumonia, measles and malaria
(where applicable) as well as the management of severe malnutrition and nutrition counseling. IMCI incorporates
simple life-saving technologies promoted by WHO and UNICEF, such as ORT, into a more comprehensive
approach which addresses not only individual diseases but the sick child as a whole. IMCI also has health
promoting and preventive elements including: reducing missed opportunities for immunization, breast-feeding
and other nutritional counselling, vitamin A and iron supplementation, and treatment of helminth infestations.
It should be noted that all children, not only sick children, should be targeted with these preventive and
promotive interventions. IMCI pays particular attention to improving the communication and counselling skills
of health workers.
XIV ANNUAL CONFERENCE OF KACH • 20
^-=-_
KACH - 20001 ~ ~
_
-----
The IMCI strategy, therefore, seeks to reduce childhood mortality and morbidity by adopting a broad and
cross-cutting approach with the following components:
improving case management skills of health workers through the provision of guidelines on integrated
-
management of childhood illness, adapted to the local context, and activities to promote their use;
improving the health system by:
-
ensuring the availability of essential drugs and other supplies
-
improving organization of work at the health facility level
-
improving monitoring and supervision; and
improving family and community practices through education of mothers, fathers, other child care
takers and members of the community with focus on: health seeking behaviour, compliance, care at
home and on overall health promotion.
Implementation principles
IMCI is not a vertical programme. It is an integrated strategy that incorporates many of the elements of
diarrhoeal disease and ARI control programmes and some of the child-oriented aspects of malaria control,
nutrition and other related programmes. It also depends on the effective functioning of the EPI and essential
drugs programmes. It demands and facilitates an active collaboration between all of these existing programmes.
It is an important step toward improving the quality of care of sick children within the primary health care
context.
IMCI implementation involves a combination of focused appropriate technical guidance and problem-soiving
at district and health facility levels around issues affecting service delivery. The latter must involve the district
level health staff, first-level health workers and members of the communities they serve. In this way, IMCI can
contribute to capacity building at district and local levels while revitalizing the health services to improve
primary health care services for children.
A number of principles underlie and should guide the implementation of the IMCI strategy:
-
Is based on a rights approach to access to good quality child care;
-
Adopts an integrated and holistic approach to child care;
-
Addresses the leading causes of childhood morbidity and mortality;
-
Requires adaptation to the local and country situation, taking into account epidemiology, policies,
infrastructure and capacity (including human resources);
-
Builds upon existing child health services/programmes;
-
Strengthens elements of the health system needed to deliver IMCI;
-
Improves health worker communication with communities and support outreach services;
-
Encourages local and national ownership and institutional capacity building; and
-
Aims to ensure active household/community participation in IMCI implementation, monitoring and
evaluation.
■J XIV ANNUAL CONFERENCE OF KACH » 21 L
;
KACH - 2000
Introduction of IMCI into countries
The first step in the introduction of IMCI in a country is a thorough orientation of all relevant stakeholders as
to what this strategy entails. This process seeks consensus on the priority problems to be addressed, based
on the country specific situation, and on how to proceed with implementation of the integrated approach and
a statement of national commitment to the strategy.
Following a decision to work towards integration of management of childhood illness, the first step is to define
standard guidelines for care specifically tailored to the country. Sometimes aspects of this will need to be
modified for different regions of a country. A convenient and cost-effective way of achieving this step is to
start with the generic WHO/UNICEF guidelines and adapt them. This adaptation process must involve
programme managers of all relevant sections of the ministry of health as well as relevant partners from other
relevant sectors/institutions, paediatricians and their professional associations, NGOs and potential partners
in funding and technical support.
It provides the opportunity to review policies and practices related to child health care and to revise them in a
way that allows integration and avoids contradiction. An important component is the development of food and
feeding guidelines that are practical and appropriate to families, taking into account local feeding practices
and needs. The process of adaptation requires active consensus building and takes time but yields guidelines
appropriate to the context and ensures a sense of ownership of those involved, an essential factor in their
subsequent use. Once adapted guidelines are available, the process of modifying the materials of the generic
WHO/UNICEF training course for first-level health workers can be undertaken relatively easily.
In parallel with the process of adapting the case management guidelines, it is essential to start planning for
the introduction of the IMCI approach. Hence, an IMCI implementation plan that addresses the various elements,
including a training plan, should be developed. Consideration must also be given to factors enabling trained
health workers to apply their skills, including the availability of the necessary essential drugs and supplies.
Experience to date
Globally, more than 35 countries have expressed an interest in IMCI. In the countries that have taken an early
lead in implementing IMCI, locally-adapted guidelines on management of childhood illness have already
been developed in ten countries (Bolivia, Dominican Republic, Eucador, Indonesia, Nepal, Peru, Philippines,
Tanzania, Uganda, Zambia) and in six of these the first round of training at district level has been carried out.
This early experience has demonstrated the feasibility of the approach, provided encouraging evidence of
improved care and identified important issues that will need to be addressed in expanding beyond a few
districts.
Early experience with IMCI implementation has underlined the importance of involving all stakeholders in the
process of consensus building. It has also highlighted the importance of national capacity building and the
'
I XIV ANNUAL CONFERENCE OF KACH . 22 I
■=
KACH - 2000
identification of local, national and external resources and institutions to support the introduction, and expansion
of the coverage, of IMCI activities.
IMCI and CDD/ARI
As IMCI activities expand in countries, it is anticipated that single disease programmes focused on childhood
diarrhoea (CDD) and ARI will be phased out. It is important, however, that support to these programmes
continue in countries and districts where IMCI is not yet implemented so as not to lose the considerable gains
already made.
In those countries where IMCI implementation has not yet started, efforts should be made toward greater
integration in the planning and implementation (including training) of CDD and ARI programmes. Such
integration will enable countries to be in a better position to implement IMCI. As part of this early preparatory
phase, policy makers and programme managers should strengthen the foundation for IMCI introduction by
addressing key issues such as improving the availability of essential drugs, organization of services and on
going support for preventive and promotive child health action including communication activities for CDD,
ARI and other programmes.
IMCI and Quality assurance
The overall potential impact of IMCI is the reduction of mortality, as well as morbidity and suffering, through
assuring children=s access to quality health care in health facilities and improved correct case management
at home, in addition to improved preventive and promotive health action. IMCI has potential to contribute to
quality assurance through:
-
the setting of standards and procedures depending on the local situation;
-
the improvement of health worker skills and knowledge and promotion of technical quality of care
through use of better procedures and improved communication with mothers and other caretakers;
-
the improvement of the organization of work at the health facility level through participatory problem
solving techniques;
-
the improvement of supervision and monitoring in order to improve standards of care through quality
control techniques; and
-
monitoring user satisfaction.
Communication in support of IMCI
Considerable effort has been invested over the last decade by UNICEF and WHO to develop information,
education and communication materials, approaches and activities related to the individual health conditions
addressed by the IMCI approach. These remain valid and their continued use is important. Nevertheless, as
countries move towards greater integration and review and, where necessary, revise their policies, it will be
necessary to develop appropriate messages and materials compatible with the new integrated guidelines.
XIV ANNUAL CONFERENCE OF KACH © 23
KACH - 2000
These should include advice on health promoting behaviour, early home care for illness, appropriate care
seeking and compliance with treatment advice. Communication strategies to address these concerns and to
accelerate household/community based action will be further developed by WHO and UNICEF for adaptation
at country level.
IMCI in relation to equity and child rights
No child should leave a health facility with a common but life-threatening condition undiagnosed and/or
untreated. Fortunately, this does not happen frequently in developed countries. Yet it is a widespread daily
occurrence in the less developed countries. This is a gross inequity that must be addressed; the fact that we
know well how to address this problem increases the moral imperative to do so as a matter of priority. Hence,
the training of health workers in order to improve their skills, including communication and counseling skills,
and to enable them to improve the quality of care provided to children as well as effective communication with
mothers, other child-care takers and community is essential. Further, every effort should be made to reach
the difficult-to-reach children.
Partnerships for IMCI
From its outset, the IMCI approach has been a joint WHO/UNICEF initiative. It quickly attracted the attention
of the World Bank. In a recent World Development Report, IMCI was recognized as one of the most cost-
effective components of a package of essential clinical and public health services, in fact, the one likely to
have the greatest overall impact on the global burden of disease. The World Bank, as well as some development
assistance agencies, are now working to include IMCI in selected country programmes focused in areas such
as child health, early childhood development, improving the quality of health services and health system
reform. IMCI is already receiving the financial support of a number of governments through their development
assistance agencies, both for global activities and in individual countries.
At country level, as mentioned above, essential and productive partnerships have been established involving
government departments, universities, NGOs, community-based organizations and development agencies,
as well as WHO and UNICEF.
Monitoring progress
Indicators for monitoring progress in the implementation of IMCI are now under development by WHO and
UNICEF, in consultation with countries that have started implementing 1MCL
XIV ANNUAL CONFERENCE OF KACH • 24
-------
~
=|KACH- 2000j------ ---------------------------------- --------
Why an integrated approach to management of the sick child ?
Every year some 12 million children die before they reach their fifth birthday, many of them during the first
year of life. Seven in every 10 of these child deaths are due to diarrhoea, pneumonia, measles, malaria or
malnutrition - and often to a combination of these conditions. Every day, millions of parents seek health care
fortheir children, taking them to hospitals, health centres, pharmacists, community health care providers and
traditional healers. At least three out of four of these children are suffering from one of these five conditions.
Because there is considerable overlap in the signs and symptoms of several of the major childhood diseases,
a single diagnosis for a sick child is often inappropriate. Focusing on the most apparent problem may lead to
an associated, and potentially life-threatening, condition being overlooked. Treating the child may be
complicated too by the need to combine therapy for several conditions.
What are the advantages of this approach?
Integrated management of the sick child leads to more accurate identification of illnesses in outpatient settings,
ensures more appropriate and, where possible, combined treatment of all the major illnesses and speeds up
referral of severely ill children. Health workers are trained in how to communicate key health messages to
mothers, thus helping them understand how best to ensure the health of their children.
This situation argues for child health programmes that address not single diseases but the sick child as a
whole. A lot has been learned from disease-specific control programmes in the past 15 years. The challenge
is to combine these lessons into a single more efficient and effective approach to managing childhood illness.
A number of programmes in WHO and UNICEF have responded to this challenge by developing an approach
now referred to as integrated management of the sick child. Already a number of other agencies, institutions
and individuals are contributing to this initiative.
Evidence from surveys of health worker performance and of management of illness in the home suggest that,
in both these areas, improvements can be made that are likely to reduce mortality significantly. As potentially
fatal illnesses in children are often brought to the attention of health workers at first-level health facilities, the
initiative for integrated management of the sick child is focusing first on improving their performance through
training and support. At the same time work has started on approaches to changing family behaviour in
relation to sick children including when and where families seek care outside the home.
The approach gives attention to prevention of childhood disease as well as to treatment. It emphasizes the
importance of immunization, vitamin A supplementation if necessary, and improved infant feeding, including
exclusive breastfeeding.
Integrated management of the sick child means efficiency in training, and in the supervision and management
of outpatient health facilities. Wastage of resources is reduced because children are treated with the most
cost-effective intervention for their condition. The approach avoids the duplication of effort that may occur in
a series of separate disease control programmes.
----- M XIV ANNUAL CONFERENCE OF KACH « 25 !■
------------
KACH - 2000
According to the World Bank’s World Development Report 1993, management of the sick child is the intervention
likely to have the greatest impact in reducing the global burden of disease. This approach alone is calculated
to be able to prevent 14% of that burden in low-income countries. According to the same report, management
of the sick child ranks among the most cost-effective health interventions in both low-income and middle
income countries.
Why integrated management of the sick child is a priority?
The health system and the services it delivers should:
address major health problems
respond to the demands of the population
have a significant impact on health status
address prevention as well as cure
cost effective
improve equity
Integrated management of the sick child meets all of these criteria.
Addressing a major health problem:
Pneumonia, diarrhoea, measles, malaria and malnutrition together account for 7 out of 10 of the 33,000
deaths that occur daily among the children of the developing world.
Responding to a demand:
Every day millions of parents take their children for care to hospitals and health centres, pharmacists and
community health care providers. At least 3 out of 4 of these sick children is suffering one of these five
conditions.
Impact on health status:
The World Bank's World Development Report 1993, "Investing in Health" identified management of the sick
child as the intervention likely to have the greatest impact on the global burden of disease, potentially averting
14% of that burden in low income countries or more than twice the amount averted by the next most effective
intervention, childhood immunization.
Prevention as well as cure:
While management of the sick child focuses on treatment. It also provides the opportunity for, and emphasizes,
the two most important preventive interventions for child health: immunization and improved nutrition, especially
breastfeeding.
'
'
-———-I XIV ANNUAL CONFERENCE OF KACH « 26 I
■-
■------
—
--
|KACH-2000p
Cost-effectiveness:
The same World Bank report ranked management of the sick child among the 10 most cost-effective
interventions in both low and middle income countries. Inappropriate management of childhood disease is
wasteful of scarce resources, for example, intravenous fluids and antibiotics. Control programmes specific to
a single disease have been effective but can be inefficient because of duplication of effort. Integrated
management of the sick child addresses both of these concerns and should result eventually in cost-saving
although an initial increased investment will be needed for training and reorganization.
Improving equity:
Virtually all children of the developed world and most well-off children in the developing world have ready
access to the simple affordable treatments needed to protect them from death due to these five diseases.
However, most children of the developing world do not have access to this life saving care. Given that this is
one aspect of inequity which can be addressed immediately, with proven, inexpensive interventions, it should
not be addressed as a matter of urgency.
What tools are being developed?
Case management guidelines
Integrated outpatient management of the sick child at the first-level health facility has been described on four
wallcharts which will also be available in booklet form. These guidelines are based on experience to date and
on the findings of some focused research studies. The charts are titled, respectively:
_ Assess and classify the sick child age 2 months up to 5 years
_ Treat the child
_ Counsel the mother
_ Assess, classify and treat the sick young infant age 1 week up to 2 months.
The guidelines focus on detecting and managing the most common potentially fatal illnesses and associated
conditions. They do not attempt to cover all childhood illnesses.
The assessment process uses a colour-coded triage system with which many health workers are already
familiar through use of the WHO case management guidelines for'diarrhoea and acute respiratory infections
(ARI).
This procedure classifies each illness according to whether it required:
- urgent referral,
- specific medical treatment and advice, or
- simple advice on home management.
— -
XIV ANNUAL CONFERENCE OF KACH • 27 tz~ '
KACH - 2000
The first step in the process is to look for non-specific danger signs that indicate the child is severely ill and
needs urgent referral. Following this, for all children, the health worker asks questions about four main presenting
symptoms.
The child presenting with cough or difficult breathing is handled according to the previous WHO/ARI
management charts. The illness is classified as "severe pneumonia or other very serious disease" (requiring
referral), "pneumonia" or "cough and cold".
A child presenting with diarrhoea is managed according to the already widely used WHO diarrhoea management
charts. The child's dehydration status is classified, as persistent diarrhoea and dysentery if present. Treatment
is defined accordingly.
If fever is among the presenting complaints, a classification of "severe febrile illness" indicates that urgent
referral is needed. Depending on the other symptoms present and the risk of malaria, this disease may be
diagnosed. Fever may also be the starting point for a classification of measles with or without complications.
Mastoiditis and chronic or acute ear infection are the classifications that can be made from the examination of
an ear problem.
In addition to these classifications based on presenting symptoms, nutritional status is assessed for all children.
Severe malnutrition or severe anaemia indicate the need for referral while less severe deficiencies result in
treatment and/or advice in the health facility.
Each child's immunization status is also checked and vaccinations given as needed.
Finally the health worker is reminded to assess and treat any other problems detected.
Management of childhood illness : a training course
The case management guidelines constitute the technical core of a training course that has been developed
for first-level health facility workers. This course consists of a set of six training modules for participants, still
photo exercises, video film and detailed instructions for the course director and course facilitators. It emphasizes
hands-on practice of the skills taught.
A pretest of the course in Gondar, Ethiopia, in August 1994, followed by several weeks of observation of the
trained health workers, yielded very promising results. A complete field test of the materials is planned for
February-March 1995 in Arusha, Tanzania. It is anticipated that the course will be available in mid-1995.
A guide to local adaptation of the training materials is also in preparation. This will include guidance on
modification of such things as foods and fluids to be included when counselling the mother, antimicrobials of
choice in a particular epidemiological context, and other policy decisions.
XIV ANNUAL CONFERENCE OF KACH • 28
KACH - 2000
On-the-job training in management of drug supplies
Guidelines for conducting a training workshop followed by supervised practice in the place of work have been
developed in collaboration with BASICS to help health workers better manage the drugs essential for
management of sick children. They will be field tested in Africa in the second quarter of 1995 and are expected
to be ready for use by July 1995.
Other materials under development
Two other sets of guidelines - on improving health workers' performance and on assessing and changing
family behaviours related to care for sick children - are being developed with the help of specialists in these
areas.
As many sick children require referral to a hospital, a further training course is being developed on inpatient
case management of the sick child.
Work has also begun on a survey manual for assessing health worker performance, based on those already
available for diarrhoea and ARI. Guidelines for introducing the integrated approach in countries are also
being put together.
Research on the management of the sick child
Research is an essential component of all programmes to reduce mortality and morbidity in children. Several
research studies have already been carried out to provide information for finalizing the four sick child case
management charts. These include evaluation of the Assess and classify chart in Gambia and Kenya, and
studies on the clinical predictors of anaemia in India and Malawi. The studies have led to modification or
validation of the following aspects of the protocol:
_the clinical signs for classifying children as requiring antimalarials in low-risk areas have been refined;
the clinical signs for classifying children as having severe anaemia requiring referral have been improved
for greater specificity;
detection of fever by touch was shown to be sufficiently sensitive and specific to justify the recommendation
to "feel the child for fever" if no thermometer is available;
visible severe wasting was found to be adequate to detect most children with very low weight-for-height for
referral to hospital;
the rate of referral and antibiotic use with the revised protocol were found to be acceptable.
A multicentre study on persistent diarrhoea in Bangladesh, India, Mexico, Pakistan, Peru and Viet Nam has
provided important findings that have been used to update the recommendations for management of persistent
diarrhoea.
_
—--------
—
-
~-[kach - 2000~|
...... ..............-
Findings from a study on pneumonia, sepsis and meningitis in Ethiopia, Gambia, Papua New Guinea and the
Philippines have also been used to complete the recommendations for diagnosis and treatment in young
infants.
WHO has drawn up a list of future research priorities related to management of the sick child. In addition to
improving the detection and treatment of the five major illnesses, areas where more information is needed
include:
detection and management of anaemia and meningitis
nutritional management
management specific to the sick young infant
reasons why mothers do not seek health care for sick children
identification of high-risk children
adequacy of clinical management in first-level health facilities.
While much research is concerned with biomedical questions, there is also a need for further behavioural
research on, for example, communication with mothers, including the adaptation of advice on feeding to local
conditions.
Research has been carried out by a number of collaborating institutions and coordinated by the WHO Division
of Diarrhoeal and Acute Respiratory Disease Control and the WHO Special Programme for Research and
Training in Tropical Diseases. In 1993 and 1994 a series of consultations were organized to obtain expert
advice on various topics, to review research findings and to redefine research priorities. Two research and
development coordination meetings have also been held with participation of a wide range of current or
potential collaborators.
Plans for implementation
The concept of the integrated approach to childhood illness has been welcomed by many countries. In some
it will fit well into reorganizations of health service management that are already under way. In others,
organizational changes or clearly defined collaborative arrangements between existing disease-specific
programmes will be needed.
WHO, UNICEF and their collaborative partners will work with countries to help adapt the new materials to the
country context, to plan how implementation of activities can best be managed and to evaluate the experience.
Particularly close monitoring of initial experience will be carried out in a small number of countries.
Collaborating partners
Many institutions are collaborating in this initiative as listed in the attached table.
I XIV ANNUAL CONFERENCE OF KACH • 30 I
•
=
KACH - 2000
Bilateral aid agencies from many countries, the World Bank, UNDP and UNICEF are supporting these efforts
through their funding of WHO Programmes. Funds specifically designated for this initiative have been provided
to WHO by the Governments of Norway and Switzerland and by the US Agency for International Development.
Collaborating institutions
In addition to the Ministries of Health in countries where activities related to integrated management of the
sick child have been carried out, the following institutions have collaborated:
World Health Organization
-Division of Diarrhoeal and Acute Respiratory Disease Control (CDR)
-Division of Communicable Diseases (CDS)
-Division of Control of Tropical Diseases (CTD)
-Action Programme on Essential Drugs (DAP)
-Global Programme for Vaccines (GPV)
-Maternal and Child Health and Family Planning (MCH)
-Nutrition (NUT)
_Oral Health (ORH)
-Programme for the Prevention of Blindness (PBL)
-Special Programme for Research and Training in Tropical Diseases (TDR)
World Bank
-Department of Population, Health and Nutrition
UNICEF
-Child Survival Unit
-Bamako Initiative Unit
Other institutions
-Ethiopia:
Addis Ababa University
Gondar Medical College
_The Gambia:
Medical Research Council
Jtaly:
Istituto "Burlo Garofalo"
XIV ANNUAL CONFERENCE OF KACH • 31
KACH - 2000 ...........
_Kenya:
Kenya Medical Research Institute
Wellcome Trust
_South Africa:
The South African Institute for Medical Research
University of Cape Town
-Tanzania:
Tanzanian Food and Nutrition Unit
_UK:
Cambridge University
London School of Hygiene and Tropical Medicine
Liverpool School of Tropica! Medicine
Medical Research Council
Save the Children Fund
University of Edinburgh
_USA:
Academy for Educational Development, USAID/SARA
Center for Disease Control and Prevention
Johns Hopkins University, USAID/Child Survival Project
Harvard Institute for International Development, USAID/ADDR
Michigan State University
The Partnershiop for Child Health Care, Inc., USAID/ BASICS
University of Colorado
University Research Corporation, USAID/Quality Assurance Project
XIV ANNUAL CONFERENCE OF KACH > 32 k
j;.
.:
KACH - 2000
The management of childhood illness in developing countries: Rationale for
an integrated strategy
Introduction
Every year some 11 million children in developing countries die before they reach their fifth birthday, many
during the first year of life. Seven in ten of these deaths are due to acute respiratory infections (mostly
pneumonia), diarrhoea, measles, malaria or malnutrition - and often to a combination of these conditions (see
figure 1). In addition, at least three out of four episodes of childhood illness are caused by one of these five
conditions, and every day millions of parents seek health care for sick children, taking them to hospitals,
health centres, pharmacists, community health care providers and traditional healers. Projections based on
the global burden of disease analysis completed in 1996 indicate that these conditions will continue to be
major contributors to child deaths in the year 2020, unless significantly greater efforts are made to control
them.
The evidence that a large proportion of childhood morbidity and mortality in the developing world is caused by
just five conditions does not in itself argue for an integrated approach to the management of childhood illness.
However, most sick children present with signs and symptoms related to more than one of these conditions
and this overlap means that a single diagnosis may be neither possible nor appropriate (see figure 2).Treatment
of childhood illness may also be complicated by the need to combine therapy for several conditions. An
integrated approach to managing sick children is, therefore, indicated as is the need for child health programmes
to go beyond single diseases and address the overall health of a child.
Much has been learned from disease-specific control programmes in the past 15 years. The current challenge
is to apply the lessons from these programmes to strategies that promote coordination and, where appropriate,
greater integration of activities in order to improve the prevention and management of childhood illness. The
WHO Division of Child Health and Development (CHD), in collaboration with ten other WHO programmes
and UNICEF, has responded to this challenge by developing the Integrated Management of Childhood Illness
(IMCI) strategy. While many agencies, institutions and individuals are contributing to the initiative, WHO/CHD
is responsible for overseeing the development, implementation, and monitoring of IMCI materials and activities.
The IMCI strategy
The strategy combines improved management of childhood illness with aspects of nutrition, immunization,
and several other important influences on child health, including maternal health (see figure 3). Using a set of
interventions for the integrated treatment and prevention of major childhood illnesses, the IMCI strategy aims
to reduce death and the frequency and severity of illness and disability, and to contribute to improved growth
and development. This set of interventions aims to improve practices in both health facilities and in the home
(see figure 4).
?.
•
-zZZT^zdXIV ANNUAL CONFERENCE OF KACH » 33 I
KACH - 2000
Interventions
The core intervention is integrated case management of the five most important causes of childhood deaths
- acute respiratory infections (ARI), diarrhoea, measles, malaria and malnutrition - and of common associated
conditions.
In individual countries, the combination of interventions that makes up IMCI may be modified to include other
important conditions for which effective treatment and/or preventive practices have been identified. The main
interventions of the global IMCI strategy may evolve, as new findings from analysis of the global burden of
childhood disease and from child health research become available.
Components
Implementation of the IMCI strategy in countries involves the following three components:
© Improvements in the case management skills of health staff through the provision of locally adapted
guidelines on integrated management of childhood illness and activities to promote their use.
o Improvements in the health system required for effective management of childhood illness.
o Improvements in family and community practices.
These components will be supported by programme planning, including the selection of indicators and the
setting of targets, and by evaluation.
Benefits of the IMCI strategy
In health facilities, the IMCI strategy promotes the accurate identification of childhood illnesses in outpatient
settings, ensures appropriate combined treatment of all major illnesses, strengthens the counselling of
caretakers and the provision of preventive services, and speeds up the referral of severely ill children. The
strategy also aims to improve the quality of care of sick children at the referral level. In the home setting, it
promotes appropriate careseeking behaviours, improved nutrition and preventive care, and the correct
implementation of prescribed care. The benefits of the IMCI strategy are summarised in Box 1.
^^=========^^=^ XIV ANNUAL CONFERENCE OF KACH • 34
KACH - 2000
Box 1
Benefits of Integrated Management of Childhood Illness (IMCI)
The IMCI strategy:
Addresses major health problems - The strategy systematically addresses the most important causes of
childhood death and illness.
Responds to demand - Every day millions of parents take their sick children to hospitals and health
centres, pharmacists and community health care providers. At least three out of four of these children
suffer from one of the five conditions that are the focus of IMCI.
Is likely to have a major impact on health status - The 1993 World Bank World Development Report,
Investing in Health, estimated integrated management of childhood illness to be the group of interventions
with the potential to have the greatest impact on the global burden of disease.
Promotes prevention as well as cure - In addition to its focus on treatment, it also provides the opportunity
for, and emphasizes, important preventive interventions such as immunization and improved infant and
child nutrition, including breastfeeding.
Is cost-effective - Investing in Health ranked IMCI among the 10 most cost-effective interventions in both
low- and middie-income countries.
Promotes cost saving - Inappropriate management of childhood illness wastes scarce resources. Although
increased investment will be needed initially for training and reorganization, the IMCI strategy will result in
cost savings.
Improves equity - While nearly all children in the developed world have ready access to simple and
affordable preventive and curative care which protects them from death due to ARI, diarrhoea, measles,
malaria and malnutrition, millions of children in the developing world do not have access to this same life
saving care. The IMCI strategy addresses this inequity in global health care.
The relationship of IMCI with other technical programmes
The IMCI strategy promotes a number of interventions and areas of activity, such as immunization, vitamin A
supplementation and drug supply management, that are managed by other technical programmes
(see figure 5). IMCI management in countries will not involve taking on responsibility for these other
programmes, but will seek to ensure that activities are well coordinated and effectively implemented in order
to contribute to IMCI. Examples of what IMCI can offer to other programmes and what it requires from them
are given in table 1. in all countries, the collaboration of all relevant programmes is essential for the development
and endorsement of the IMCI clinical guidelines and for their promotion and use.
XIV ANNUAL CONFERENCE OF KACH • 35 U-r.= - —
■
^KACH-2000
Table 1
The IMCI approach in relation to other technical programmes
Note: In all countries, the collaboration of all relevant programmes is essential for the
development and endorsement of the IMCI clinical guidelines and in their promotion and use.
Programme
CDD/ARI
What IMCI needs
What IMCI offers
more effective case management
o
combined CDD/ARI activities
o greater emphasis on nutrition aspects
o
as a step toward IMCI
0
of diarrhoea case management
Malaria
o
improved case management for
o
EPI
Nutrition
o
promotion of bednets
o
case management of measles
o
avoidance of missed opportunities
vaccination policies compatible
o
encouragement of routine vaccination
with IMCI
o
opportunity to review/develop
e
o
practical child feeding advice
o
Maternal and
counselling on breastfeeding and
vaccine availability and
collaboration in developing
feeding advice
o
micronutrient, breasfeeding
complementary feeding
and complementary feeding
®
treatment of malnourished children
policies compatible with IMCI
0
vitamin A, iron supplementation
•
treatment of helminths
•
breastfeeding counselling
perinatal health
•
•
•
week of life compatible with
infants
IMCI
opportunity to enquire about the
•
clear policy on drugs for childhood
•
availability of essential drugs
for IMCI (including prereferral
rationalization of drug use (including
decreased use of antibiotics)
clear guidance on available
maternal health services
illness
•
guidelines for illness in first
case management for sick young
mother's health and provide services
Essential drugs
policy on antimalarial drugs
compatible with IMCI
children
injectable drugs)
•
drug use policies compatible
with IMCI
XIV ANNUAL CONFERENCE OF KACH • 36 —
------ i-
....
■
KACH - 2060]- ■ -
...
•
. ==
IMCI and health system reform
In many developing countries some type of reform of the health system is underway, often involving
decentralization of management, including responsibilities for training and drug supplies. The emphasis in
IMCI implementation on capacity building at district level is compatible with, and can contribute to, this aspect
of health system reform. Another aspect of health system reform being promoted in some countries is "essential
services" or a minimum package of activities and there is a strong rationale for including IMCI in such an
approach. IMCI can also strengthen other aspects of reform such as improving the quality of care and improving
cost-effectiveness.
Regardless of the approach taken by a country to health system reform, it is important that IMCI be explicitly
discussed early in the process and included in plans, especially plans for capacity building at district level.
Conclusion
The IMCI strategy clearly focuses on the diseases of childhood that cause the greatest burden, globally, while
allowing for the content to be adapted to individual country needs. An integrated approach is needed because
of overlap in the signs and symptoms of the major diseases and because it is important to treat the child as a
whole, not simply the most apparent disease. The strategy involves not only curative care interventions but
also those to promote healthy growth and prevent diseases. Often, these too are aimed at more than one
disease.
Effective IMCI requires action at different levels of the health service and in the home and the community.
Through improving the coordination and quality of services provided by existing child health programmes, the
IMCI strategy will increase the effectiveness of care and at the same time reduce costs. It offers a model for
improving one aspect of service delivery that could be applied to other aspects of health care. Finally, IMCI
has the potential to make a major contribution to health system reform and, because it is one of the essential
components of health services, should be taken into account early in the reform process.
-
■ '■
- .. XIV ANNUAL CONFERENCE OF KACH • 37
■
KACH - 2000
IMC1 in the Community:
Improving family and community practices in support of child health and
development
Introduction
Success in reducing childhood mortality will not be achieved solely through the availability of health services
with well-trained personnel. Success also depends on what families provide - adequate nutrition and care,
appropriate responses to illness, including seeking medical care when children need it, and the correct
implementation of prescribed treatment. Expanding on experiences in ARI and.CDD programmes, CHD is
increasing its efforts to strengthen the ability of families and their communities to raise healthy children.
CURRENT ACTIVITIES
Improving family practices through the sick child visit
Face-to-face communication between health workers and caretakers who bring a sick child to a health facility
provides an important opportunity for promoting child health in the home. Home care advice is an integral part
of case management and during sick child visits, health workers instruct mothers on how to give home
treatments. During such visits health workers also assess feeding practices, including breastfeeding and
giving complementary foods, and help mothers solve feeding problems. An evaluation of nutritional counselling
is being conducted to identify how to improve this important component of the sick child visit. Health workers
also provide advice about signs to enable caretakers to recognize when they need to bring the sick child
back. To ensure that caretakers can remember instructions, health workers select the most important messages,
verify the caretaker's understanding of what they should do by asking checking questions and observing as
the caretaker demonstrates how to give prescribed treatments.
Communication skills are, therefore, emphasized throughout the IMCI course for first-level health workers.
Using local terms and phrases that are common in the community increases the ability of health workers to
communicate effectively with caretakers. Using a locally adapted counselling card also facilitates
communication. The Adaptation Guide for IMCI training materials provides instructions on how to make the
counselling card more appropriate to the communities in which IMCI is implemented. In particular it suggests
how to identify local terms to communicate important signs of illness, especially those used to advise mothers
on when to seek care, and how to identify feeding recommendations that are culturally acceptable in the
community, as well as nutritionally adequate. In some countries mothers will be able to take the cards home
to remind them about these important messages.
Improving breastfeeding practices through early interventions with mothers
Good nutrition is critical for healthy growth and reducing mortality from disease. IMCI recommendations
support good nutrition through the promotion of exclusive breastfeeding initiated immediately after birth and
extending for four to six months. Mothers are encouraged to continue breastfeeding as the infant matures,
while adding nutritionally appropriate complementary foods.
In addition to the IMCI training course for first-level health workers, CHD has developed the Breastfeeding
==| XIV ANNUAL CONFERENCE OF KACH « 38 fc.------
„
=
KACH - 2000
Counselling: A Training Course for maternity staff and other health workers. The course trains health workers
to assist mothers in initiating breastfeeding and improving their skills in feeding the child. It stresses the
importance of support groups as a means of providing ongoing help to breastfeeding mothers in the community.
Health workers also learn how to help mothers be more responsive in general to the needs of their new
infants and develop the skills to provide better care through the early years of the child's growth and
development. An evaluation of the course has demonstrated its ability to achieve lasting improvements in the
knowledge and practices of breastfeeding counsellors.
Other methods of improving family practices
IMCI includes other interventions to help families provide better care. During the planning process, family
needs and resources are considered in the development of guidelines. For example, availability and cost are
reviewed when selecting drugs, in addition to their effectiveness in treating illness. Where it is possible to
choose and provide paediatric formulations, it is easier for families to give correct doses.
In planning and implementing IMCI, communication materials (e.g. radio messages and written materials) in
current use need to be reviewed to ensure that they are consistent with the messages delivered through the
sick child visit. As new messages are developed, they can be strengthened by using information available
from IMCI activities, including local feeding recommendations and the terms understood by mothers. Existing
CDD and ARI tools for collecting information and designing communication interventions can be used in IMCI
activities when countries have identified a need for specific actions with respect to household management of
diarrhoeal diseases or acute respiratory infections.
FUTURE ACTIVITIES
Helping countries to develop community interventions
Expanding the implementation of IMCI will mean working with the communities, as well as through the health
facilities, to reach more families. Many children who need care are not brought to a health facility and the
caretakers of those who are may only have brief contact with the health worker. New channels for promoting
child health, therefore, are required.
To assist countries to expand IMCI activities beyond health facilities, CHD is developing a guide, Selecting
and Designing Interventions to Improve Family Practices, which describes a systematic process for choosing
effective interventions and implementing them at community level.
This practical guide indicates how countries can organise local information from a variety of sources and use
this information to identify current family practices related to a range of potential health risks and the factors
that influence them. It then shows how this information can be used to select and design specific interventions.
Facilitated by a trained person, the guide can be used by members of a planning team with diverse experiences,
in implementing health programmes (e.g. programme managers, health workers, and communication
specialists), in conducting research (e.g. nutritionists and social scientists), and in working in communities
(e.g. from NGOs and schools). The guide will also direct the planning team to the use of technical manuals
that provide assistance with planning, testing, carrying out and evaluating the specific interventions selected
■ -■
.
.----------- XIV ANNUAL CONFERENCE OF KACH • 39 k ■
-
--------
-
-
|KACH-2000|-
-
by the team. To produce messages and use mass communication channels for example, planning teams can
use the WHO/UNICEF/USAID Radio Guide. Technical manuals will be gathered from a variety of sources
and will cover a range of activities, for example, provision of health education, counselling family members,
and improving the design of products, packaging, and communication materials. CHD will also work on the
development of new manuals for interventions for which there are no existing materials, and it js anticipated
that a technical manual will be produced based on the results of a current project on careseeking (see below).
Improving specific family practices
Work began in 1996 to examine the rationale and feasibility of initiating intervention research aimed at improving
careseeking for acute illness in infants and young children. As a first step in this potentially important area for
household behaviour change, CHD reviewed the evidence concerning the following questions:
1.
What is the nature and extent of problems in careseeking, and what is the evidence that family behaviours
with respect to careseeking contribute significantly to infant and young child mortality and morbidity?
2.
Is there sufficient knowledge about the determinants of careseeking to allow interventions aimed explicitly
at this behaviour to be designed?
3.
Is there evidence that careseeking behaviours can be changed?
The findings showed that:
1.
Scientific documentation of the extent to which initial delays in careseeking affect mortality is very limited,
but there is considerable evidence that families do not always make the best decisions with respect to
the utilization of health care services.
2.
In general, the determinants of careseeking have been well described, although there is greater knowledge
about household decisions on where to seek care than about initial decisions concerning when to seek
help.
3.
Interventions aimed specifically at improving careseeking for sick children have not been rigorously
evaluated, but changing patterns of health service utilization indicate that these behaviours can be
changed.
CHD is currently undertaking a project to develop and evaluate culturally appropriate interventions to improve
family care-seeking. Research on family and community practices will also continue to evaluate current
activities and identify additional ways to improve home care. For example, evaluation studies in China and
Viet Nam have shown that using local illness terms improves caretakers' recall and understanding of the
importance of signs that the child needs medical attention. The results of a recently completed review on child
growth and development will be used in the design of an approach to interventions to promote physical and
psychological growth, and research on community-based nutrition interventions will strengthen IMCl nutrition
counselling efforts.
XIV ANNUAL CONFERENCE OF KACH • 40
Nutrition : An Overview of Research Findings
Adequate nutrition for all is among the most obvious priorities of total
development. Malnutrition impairs development and malnourished children are ata
greater risk of survival than healthy ones. To combat the problem of malnutrition
and to further reduce the incidence of mortality and morbidity among the vulnerable
sections of society, an integrated multisectoral approach has been adopted by the
Government by introducing ICDS programme.
NUTRITION
An Overview of Research Findings
Abstracts of Research Studies
The nutrition component of the package of services offered under ICDS includes
i supplementary nutrition, nutrition and health education and prophylaxis against
■ nutritional anaemia and vitamin A deficiency. The scheme provides supplementary
i nutrition to needy children and to expectant and nursing mothers from low-income
, families for 300 days in a year. The aim is to supplement thenutritional intake by 300
calories and 8-10 g of protein for children; 600 calories and.20g protein for severely
malnourished children and 500 calories and 20-25 g protein for expectant and
nursing mothers. The cost of supplementary nutrition for children, severely
malnourished children and expectant and nursing mothers per day is 0.75 p. Rs. 1.25
and Rs. 1.05
*
respectively. In fact the major share of the total cost of an ICDS project
is claimed by supplementary nutrition, which is Rs. 0.75 million per rural or urban
project and Rs. 0.67 million per tribal project, (Krishnamurthy, 1983).
With the expansion of ICDS projects from 33 in 1975 to 1,952 in 1988, the number
>f children receiving supplementary nutrition had increased from 1.63 lakhs
October 1975) to 104.19 lakhs (December 1988), and that of expectant and nursing
nothers had increased from 4.73 lakhs (March 1983) to 19.96 lakhs (December
**
1988).
The studies reported in this section have assessed the nutritional status,of children
rom various angles. Though quantitatively the research conducted on this
omponent of ICDS is quite adequate, still many areas have not been studied. For
sample, the information related to food and nutrient intake is limited. Prabhakara
1984) and Singhal (1981) found that there was an adequate intake of all the nutrients
xcept vitamin A in ICDS areas. Joshi (1977) reported that the intakeof protein was
pw. In the study conducted by Jyoti Kumari (1985) the dietary intake of children
wealed a caloric gap of 400-500 and adequate intake of protein.
Nutritional status of children is an excellent indicator of their survival. Many
isearchers have reported the prevalence of malnutrition and a large number of
udies assessed the-nutritional status of children in ICDS areas by incidence ofalnutrition in. different grades. The research findings revealed that ICDS has
lurce:
j1
j
.
rypajunent-VoE
an-1 Child Development. Miuhtn, of Human .RiOT
.
‘
l^nm-t of Women
and Chdd
- Developracnt-NCTT.Delhi.
India. Mirit^Human R«oume
Developtnert. Status Rep°r* ofclhc IeDS- December, 1988.
.
■
.
■■
. ...
■: illustralesthe.
,
'
>edjiireducing
the incidence
of. malnutritionanmany.areas.
Fig.5
tageimprovement in the nutritional status of children in ICDS blocks. On the ■_
ther hand few studies reported h igh incidence ofniildand moderate PEM. About 30
rer’cent children were suffering from chronic malnutrition resulting in stunted
i , growth Uyoti Kumari, 1985) The low nutritional status of children was also
I.'^'z observed-in a study by Tarun Kumar (1983) where 49 per cent children were identified
J ; at risk, requiring special intervention. Prabhu .(1985) also identified 81 per cent
FIGURE-5
PERCENTAGE IMPROVEMENT IN THE
NUTRITIONAL STATUS OF PRE-SCHOOL
CHILDREN COVERED UNDER ICDS
malnourished children according to Gomez classification. In the studies conducted
by Sunderlal (1977) and Bhandari (1979), not much improvement was observed in the
nutritional status of children, though the decline in the incidence of severe
malnutrition was one per cent or less.
■
I. Sunder Lal, 1978. II. Sunder Lal, 1980. III. Sunder Lal,1980.
IV. Kushwaha, 1981. V. Singal, 1981. VI. Patel, 1982.
VII. Tandon, 1982. VIII. Bapat, 1983. IX. Bhandari. X. Mandowara.
8 "
gw;:.
■
•
(LZSlXJaiche;,. 19S4i. Al>oul37per <Entchildren inan ICDSareaancl45.3percent in
; vs;
■
''A
■
dost of the studies reported that die nutritional status of children wasasseystxl by *
ng itidices like weight-Ior-age, wight-foriheigh't,height-for-ageand''Weghtx 100non-ICDS had haemoglobin level of less than 11 g (Sinha, 1984).
ighl2. The indices found to be more suitable for male a’nd female children.•wereVitamin A deficiency vas the leading cause for nutritional blindness in Tamil
*
100/Height1'* 5 respectively (Rao,; 1985).
Nadu: However, there had been a rapid decline in the prevalence of Xerophthalmia g•yvagbtxlOO/Hcight1-'’ and Weight
According to Jakher (1984). weight-for-height and height-for-agecombination wasa
oxer a period of two years due to the impact of ICDS Programme (Chandra, 1984:
k'5 sensitive measure for detecting malnutrition, but as per Desai's study (1984), wrightChopdar, 1977).
ih&' iof-age parameter should be used (or screening severely malnourished children. They
Inanothet study, it was reported that more than 50 per cent adults, adolescents and A .' should be furtherexamined using weight-for-height parameter and those found to be
school-going children were suffering from varying degrees of goitre. The iodine
• severely malnourished should be considered for therapeutic nutrition. Mehendale
content in drinking water was found to be less than 3 Ug/L with a mean value of 0.9
-0^82) was also of the view that nutriuonal grading by weight-for-age could help in
UgZL (Rao. 1985)'
\
, detecting malnourished children who did not have visible symptoms of marasmus or
.’ .kwashiorkor. In another stud) by Desai (1981), weight-for-height was preferred in
In ICDS blot ksntalnutrition and its causes are entrenched in society. Malnutrition
:
assessment of PEM where stunung was common as it did not lead to over-diagnosis
was attributed to factors like ]X>orsocio-economic conditions, inadequate health and
of PEM.
nutrition education, faulty weaning practices, lack of ante-natal care, low birth
weight, repealed pregnancies, superstitions and beliefs, large-sized families and 5.’: The nutritional status of children was also assessed by using Child Bangle (Sunder
insanitation (Chopdar, 1977; Bapat, 1983). Ninety-seven per cent malnourished
-ylal. 1979) and Thinness Chart (Chopdar, 1981). Child Bangle was considered as a
children belonged to deprived environment'as measured by PDS. Ninety per cent had "
quick screening device for detecting severely malnourished children. The bangle test
ven [X>or home stimulation; their homes provided least stimulation tn terms of the
was assessed as a simple, age independent, time saving device which could be
availability of toys, games and reading material and provision ol affection and
convenicmh used by community health workers and AWWs to monitor feeding
warmth (Jyot: Kuniari. 1985). Of the background variables, literacy of parents,
^programmes in the absence of growth charts and weighing scales. The Thinness
occupation and jx-r capita income of rhe family had a marked influence on the
t.-Ghan was as effective as the Weight Chart in assessing malnourished children. It was
nutritional status of < hildren (Jakher. 1984).
. inost effective in areas where a large portion of the child population had stunted
■
s
B
■growth. It was considered an effective tool for screening acute malnutrition rather
The role of related variables in enhancing die impact of supplementary nutrition
f Tlhan for monitoring growth.
indicated that taste is an important factor and influences the quantity of supplement
consumed as unpalatable supplements were partially consumed (Patel, 1982). Other
■t'Some studies had invesugated the techniques of managing malnourished
related factors weie brought to light by Soundarajan's study (1985). The nutritional
-children. Domiciliary monitoring and management of severely malnourished
status of pre-school children improvedand their level of haemoglobin increased after
tiifSrildren by AWWs in a rural setting was found to be effective (Sunder Lal, 1980). The
deworming and on introducing supplementary nutrition and iron therapy.
i
!
*
to
cost of domiciliarv management of a malnourished child was Rs. 36as against
Regular intake of therapeutic nutrition helped in treating severely malnourished vyfd:Rs.T 1029 in hospitals. ViHage level management of severely malnourished children
AWWs and ANMs was found to be less expensive. (Tandon, 1982; Patel, 1982).
children. The incidence of severe malnutrition and morbidity declined in many - "
cases; maximum improvement -was seen in children who had received therapeutic :A: fihe nutritional status of expectant and nursing mothers was assessed in very- few
nutrition for 50-80 per cent of prescribed days. Malnutrition was reduced by 60 per
_ - /studies although
„ itl isan
isan accepted
accepted fact
fact that
that the
the percentage
percentage of
of malnourished
malnourished women
women in
in
cent due to regular and steady supply of therapeutic nutrition (Mandowara).
group is quite high. In the study by Durge (1979) the values of anthropometric
‘^v^this
•rasgroup
Breast-feeding, weaning atan early age and complete protection by immunization ^g'^.Jneasuremcnts indicated chronic malnutrition among the expectant mothers. It was
were identified as important determinants of nutritional status and helped in J \ -found that 75 per cent expectant mothers showed signs of nutritional deficiency; 93
jer,rent were anaemic and had inadequate intake of food rich in minerals and
protecting children against nutritional deficiency diseases as well (Kamla, 1985). g
Mathur (1983) also observed drat IMR among breast-fed and weaned infants was -/ . . yitamins. Tandon (1978) reported that the distribution of nutritional supplement to
comparatively low. Khanna further concluded that in a majority of malnourished |'i- . ;■ -expectant and nursing mothers significantly improved. In the study conducted by
'.i4s^opaldas (1987) efforts were made to formulate a recipe for low-cost, culturally
children, poor growth and development was due to prolonged breast-feeding beyond
six months of age and faulty weaning practices, which resulted in inadequate intake ; , J ’acceptable maternal
for expectant and
lliaieiliat food
toon supplement
SUppicliwin -vauu nursing mothers.
muuieis. Biscuits
nxstuttS
Per cent fenugreek powder were prepared. Fenugreek imparted hitler taste to
- of protein and calories. However, the infant-feeding practices in an ICDS area were
—'vthefbiscuits
for
y piscuits and
and hence
hence were
were unacceptable
uriacceptaoie to
to children.
children, They
lhey were
were recommended
recom
better than those in a non-ICDS area (Ananthakrishnan, 1984). Grand mothersand
.ugmumg niuur
and nursing mothers because of their therapeutic properties.
J parents/in-laws played a significant role in advising mothers regarding
infantstarted breast- Zi
.
feeding practices. Breast-feeding was universal but some mothers
t
conclusion, nutrition component has been studied extensively covering a few
1...U a«..
----- l.___ | T
feeding twotto six hours after birth and some as late as the sixth
day. Child care
and
. important areas like nutritional status of children, management of severe
feeding practices wereaffected bymodier's education, socio-economic statusand size Ke ^..Innutrition,infant feeding practices, etc., but still there are research gaps. Thereisa
/rec:.-
—v A
Wrr
r hildren (0-6 vears) suffering from various grades of
The percentage of children t
r
in (he research studies, is given in
malnutrition in a few ICD8 biocw.
Table 1.1.
Table 1.1
Nutritional status of children in ICDS blocks
Nutritional Grades
Author
Year
An Sge (rend was observed in the incidence of malnutrition in few studies. The new
boms were found to be below WHO reference standards on all parameters (Chopdar,
1979). Further, the age group (7-24) months seemed to be the most vulnerable group
(Behera, 1977). A few researchers reported that maximum malnutrition was
prevalent in the age group 0-3 years. (Chopdar, 1977; Sunderlal, 1976;Singhal. 1981;
Seth. 1976: Behera, 1977). Mandowaia reported that a majority of malnourished
Children were under two years of age followed by the 3-6 years age group. The
incidence of malnutrition was also high in children with the birth order of four and
hoove (Bansal, 1978).
Grade H
Grade HI
Grade 1V.
A few studies related to malnutrition threw light on rural-urban differentials and
kex-differences. The prevalence of severe malnutrition was highest among rural
Children (75.3%) followed by tribal (63.2%) and urban children- (57.6%), (Tandon,
9.6
12.0
7.8
5.8
h 982). Seventy-eight per cent malnourished children belonged to low castes and 64
27.8
32.0
28.7
34.0
(—...................
1978
3-4 years
' 4-5 years
5-6 years
54.4
60.3
85.3
36.9
32.7
11.9
7.1
53
2.8
0.5
1.1
0.0
35.3
6.7
23.9
31.9
Kushwaha (1.3)
18.2
10.2
Sunder Lal (1-1)
*
Normal
Grade 1
12.7
1976
Joshi (3.1)
1977
Bansal (33)
1978
Ellahabadi. Sunder Lal (35)
1981
o.o
0.0
7.9
2.0
47.0
Narmada (3.5)
1982
Keth, 1977) also revealed that the physical parameters of male children were higher
than those of female. The incidence of severe PEM m female children was almost
Eouble as compared to male children because of negligenceandsodo-cultural factors
(Desai, 1980). Devadas (1983) also found prevalence of PEM to the extent 20 per cent
Imong female children and 14.5 per cent among male. Kamalanathan (1984) was of
[he view that percentage of female children (53%) suffering from malnutrition was
■igher than that of male children (38%).
_______ 66.4 ____..__
■—
Ketker (8)
1982
her cent to high castes (Jakher, 1984).
I Research studies (Behera, 1977; Chopdar, 1979; Mandowara; Gupta, S.B., 1982;
1.8 ..
................
(-■
43
Krishnamunhy (8)
19t‘
80.7
Sunder Lal (3.3)
1983
Kamlanathan (3.1)
28.4
45.9
Kubde (8)
1985
. udani(33)-■
Nair (8) .
27.1
43.0'
23.6
0.6
t---
1.5
17-2
24.1
■ .Malnutrition predisposes children to infection and impairs the body’s defence
■echanism. Malnourished children have much higher mortality and morbidity
■tes. The fact that the health status of severely malnourished children is poor and
■cidence of diseases is high among them was corroborated by a study conducted by
■andon (1982). Most of the children with severe malnutrition had one or more
•ociated illnesses; diarrhoea being the most common one. Udani (1978) also
^served that prevalence of illnesses was much more in severely malnourished
®tldren. Malnutrition as one of the causes of infant mortality had been reported in
4.9
Prabhakara (3.1)
1984
Roy (13)
1984
0.0
45.0
55.0
1984
Jakher (1-1)
1984
0.1
14.6
■ Interesting seasonal variations were reported by Patel (1982) and Sunder Lal
■980). The incidence of severe malnutrition was maximum from June to October as
Bis was the period of incidence of malaria, skin infections, diarrhoeal diseases and
■her illnesses.
85
4.1
yearch studies conducted by Jugal Kishore (1983), Sunder Lal (1983), Tandon
•83) and Thakur (1984).
•The prevalence of nutritional deficiencies among children was attributed to
yilonged breast-feeding with delayed introduction ofpdor quality supplements
®irun Kumar, 1983). Clinical signs of nutritional deficiency were detected among
,®5 per cent children, the most common being anaemia, followed by PEM,
•taminosis and vitamin B-complexdeficiency. Jbshi(1977)reponedthatinspiteof
Betving vitamin and mineral supplements, 3QpercentchiIdren wereanaemicand
MP61 cent had vitamin A deficiency.•
j^naetma was the major nutritional deficiency observed in 38T per cent children. .
;Wwed by angular, stomatitis(fi.7%Vroniunctiyaf
I
Immunization : An Overview of Research Findings
' The age old saying—prevention is better than cure—applies so very aptly to the
immunization of young children and expectant mothers. While ensuring good
— health bv way of proper nutrition, reducing the incidence of disease is equally
important. Hence, the provision of immunization services is the other important injbsiih component under [CDS. safeguarding the health of beneficiaries against
•s’vaccine preventablediseases. Immunization is the most economical and cost-effective
■ rjf all the health interventions and thus.an important component of health services,
i- particularly the ones directed towards children and'mothers. The challenge of the
decade is to build up as comprehensive vaccination system for immunizing each
/beneficiary. The National Health Policy, also aims at universal immunization ol
djjiildren and expectant mothers against preven table diseases by 2000 A.D., as a part of
■(he overall strategy for improving the child, survival rate..
; ' In ICDS projects, immunization of children and expectant mothers is carried out
by PHC Urban health unit -nd its subordinate health infrastructure. Children arc
’/Vaccinated against preventable childhood diseases, like poliomyelitis, diptheria,
jrpertussis, tetanus, tuberculosis and measles. Expectant mothers are immunized
against tetanus.
Immunization programmes are easy to provide and evaluate but require careful
.planning, effective management, proper execution by trained functionaries and
^optimal-use of available resources.
t
The research conducted on immunization, is. limited. Immunization coverage or
’ .status of ICDS beneficiaries has been reported, in- manyastudies included in this
/document. Under this, section, studies exclusively related to immunization or vaccine
..preventable diseases and their incidence and. prevalence are reviewed.
p. The inc idence ofrvaccine preventable diseases-varies with the immunization
/^overage. The higher the coverage, the lower is-the incidence rateandviceversa. The
' incidenc e qf these diseases was definitely effi the decline in IUDS project areas as the
^immunization status of children had improved significantly (Subrahmanyan!,
; 1985; Santhanakrishnan, 1985; and Mandowara). There was also an improvement
..jn the immunization services provided in anganwadis. Devadasi1988) found that 78
i to 90 per cent children had been immunized in an ICDS block. lite immunization
j coverage ol the target population as reported in many studies, may lx-seen in Table 2.1.
M1/
109
fn [de stuh‘cS inducted by Khanna (1983) and Kanthimathi, it was found that
,. jo [XT cent mothers adhered to the immunization schedule. The reasons for non4 jhrtence were ignorance, indifferent attitude, lack of awareness regarding
Table 2.1
Immunization coverage in ICDS blocks
Author
Immunization coverage
Year of
study
BCG
DPT
OPV
Smail Pox-
Children ( %)
■
J
Only few research studies had reported the prevalence of various vaccine
p^ventable diseases in ICDS projects. High prevalence rate of any of these six
■ ' diseases is a sure indication of poor coverage of beneficiaries which may be due to
I?; non-acceptance of the vaccine, lack of community participation, superstitions, poor
91.0 «
87.0
/
implementation of the programme, etc.
L ‘ Measles vaccine was willingly accepted and was considered to be safe and effective
40.0
— '•’’S
24.4
30.4.
f
(Basu. 1982). The parents were cooperative and differences in their socio-economic
L- status and literacy level did not seem to affect the acceptance of measles
—
92.77 J
Chopdar (7.2)
*
1977
—
80.0
—
Joshi (3.5)
1977
—
16.2
0.1
Ellahabadi.
Sunder Lal (3.5)
1978
22.4
42.8
11.0
Bansal (3.5)
1978
—
32.0
14.6
Sunder Lal (7.3)
1981
61.0
41.0
Kushwaha (7.3)
1981
31.7
63.0
Deb (7.6)
1982
66.4
86.5
'
—
NR ,;.3
Ketker (8)
1982
2:7
5.0
11.0
— In
Khanolkar (3.5)
1982
73.5
—
63.5
100.0
Prabhakara (3.5)
1984
89.6
10.5
—
— ’■:s8
Chakladar (7.1)
1984
41.6
68.0
66.4
Kubde (8)
1985
48.7
45.5
45.2
— ‘j?
__ -
Subramanyam (7.6)
1987
100,0
100.0
100.0
65.0 -
.
All children fully immunized
Kamal ana than (3.5)
K immunization scheduleand medical advice, non-availability of vaccines, fearof side
-■
effects, inconvenient timingsand long distances to be travelled by mothers forgetting
U "their children immunized.
Raina (10)
—
—
32.0
—
—
Bawaskar (Rural) (10)
—
38.9
29.9
30.6
— $1
Bawaskar (Urban) (10)a
—
40.2
45.3
46.3
~ si
Nair (8)
—
67.2
41.3
12.4
• Numbers in parentheses are as per the Lisi ol Classified Research Studies.
’..3
In some ICDS blocks information and education regarding immunization wai
imparted by medical and paramedical personnel but it was not effective. Mani
AWWs, by and large, had fair to poor knowledge about the immunization schedule
Padmanabhan (1985) observed that private practitioners were more effective it
advising parents regarding the immunization schedule and the services provides
were much better. The parents and grandparents were more knowledgeablt
regarding immunization in an ICDS block than those in a non-ICDS block
Kanthimathi also reported that most of the mothers lacked information regardint
the severity of vaccine preventable diseases and methods of prevendng them, w
immunization. About 90 per cent mothers were aware of the primary doses; a
immunization but only 50 per cent knew about the booster doses.
Incomplete immunization is as good as notbeing immunized. It has been obseriflij
that'the immunization coverage is generally quite good for the first dose of vaccinia
hutgradually forsubsequentdoses the number of beneficiaries decreases. Patel (1980
found that almost two-thirds children droppedout during the third dose of polio ahi
triple antigen because of febrile reactions following the injection.
sjj
f..
t
immunization programme (Subramanyam, 1984). The incidence of measles was low
in an ICDS area and measles vaccine efficacy rate was 81 per cent (Mazumdar). Basu
(1982) also reported high morbidity among children not vaccinated against measles.
|‘ .
In a few cases, side effects due to administration of measles vaccine were noticed.
KK Basu (1982) observed that after the measles vaccine was administered about 16 per
f
cent children were reporter1 to have developed fever, bronchopneumonia and
diarrhoea. Subramanyam (1984) observed maximum reactions in children in the age
f.; group 17-20 months, followed by those in the 13-16 months age group. The
F
reactions were more among malnourished and female children.
EPolio is the leading cause of lameness in children. In India, the prevalence rate of
F
poliomyelitis was comparatively lower in an ICDS area (2/1000) than in a non-ICDS
Eh:.-, area (4/1000). Pulse immunization against polio was found to be effective as it
s. ensured herd immunity. Due to this, the coverage was over 85 per cent as it created
I" awareness among parents and health workers: gave doctors, medical students and
|
paramedical staff first-hand information about field conditions and helped them in
t: establishing rapport between the mothers and the health workers (Santhana| . krishnan, 1985).
|/
fn another study conducted by Vidya Prakash (1985) it was found that the
S:
I;
1:7
IV
prevalence rate of poliomyelitis was 7.9 per 1000 children. Most of the children
contracted the disease between 7-18 months of age. After the launching of the polio
immunization campaign the incidence of poliomyelitis was redded from 1.05 per
1000 in 1979-81 to 0.59 per 1000 in 1982-84.
L
|
dhe approach of mass immunization through organized camps was reported to be
successful in the case of tuberculosis as well (Kanthimathi).
Ki . dherc is not much research data available from these studies to assess the
E
immunization coverage of expectant mothers against tetanus. Annual survey reports
■ ; . °f CTC, All MS do report that there is an increase in the immunization coverage of
j: expectant mothers. Deb (1982) and Sunderlal(198I)observed that 78 per cent and 47
J 5 per cent expectant mothers were immunized agiinst tetanus in. ICDS blocks
■|
respectively. Gupta (1978) reported that the edveragpof expectant mothers was better
in rural areas (46%) than in the urban slums (33%).
Feasibility of ar tanwwlii"'
in the *
'
* .Wa^h?zrt Ztasu, Kuh1-1
W<Wp:
<:(?<• . ■
rbr rntmTlUr'*'’
iCrfbex*A»r.
= \ Otic
.
:
lhe samn:;’
.-.T,u.'.
Mallis, nunrz
pTOup. 5l.~ :
Yinjrai group vl_
toward reaede:.
children.
.
'
C-piSOUCS 01
.uaW.:
xi jweasits sia?. _
children '''
•<ciS £G_
ar?’ ;6.2
...-. r.ieasxc;
.ilidt-
..
-c-c.:.
.. .. :
. tie [qQq
. ■ ; -:S sh-..
Health : An Overview of Research Findings
Health is a prerequisite as well as an integral part of human development and
.. . neglecting health component in development can lead to deterioration in the
environment affecting all aspects of the quality of life. India is committed to attain
' die goal of Health for All by the year 2000 A.D. through the universal provision of a
• compreliensive primary health care service with focus on mother and child as a single
biological and social unit.
yens aims at enhancing the child survival rate by improving the nutritional and
■■ health status of children and expectant and nursing mothers through a package of
services including health care. Health component of ICDS comprises health checkup, referral services, immunization and nutrition and health education. Health
""check-up of the beneficiaries includes health care of children under six years of age,
antenatal care of expectant mothers and post-natal care of nursing mothers. The
.various health services provided for children bv AWWs and PHC staff include
■ regular health check-up. recording of weight, immunization, detection of
; malnutrition, treatment of diarrhoea, deworming, etc.
,f
A review of the reported research work on health component of ICDS indicates that
y it has been extensively surveyed, but very few studies have assessed the health status
- completely. The important indicators of health status include items relating to
■ functional abilities and quality of life and may be classified as mortality indicators,
morbidity indicators, utilization of health care services, indicators of social and
mental health and indicators of quality of life. To assess die health status of ICDS
" beneficiaries an attempt has been made to collate the findings on the health
: indicators available from the studies classified under various secuons.
Mortality Status : Mortality indicators are one of the most important health
indicators. In most of the developing countries, infant and childhood mortality can
be reduced with low-cost-interventions like growth surveillance of small children,
■ ’ oral rehydration therapy, breast-feeding, better weaning practices, food supplements,
.immunization and family planning. Mortality is measured quantitatively through
death rate, infant mortality rate, age-specific childhood mortality, still birth,
■-‘expectation of life, maternal mortality rate, etc.
Many researchers have reported mortality rates in ICDS blocks and have.trj
■
identify the causes leading to infant and early childhood mortality. The birth
death rate and infant mortality rate in a few ICDS blocks were as given ji
following table.
■3
.
-5
Table 3.1
Birth rate
Author
Year
Sunder La! (3.3)
*
1983
mortality status in ICDS block
LS
Birth
rate
31.5
Aswath (3.3)
1984
23.4
Kamala (3.3)
1984
15.6
Suri (3.3)
1985
Death
rate
Hl
IMR
25.0
2.8
59.7
8.0
96.0
Swami Saran (3.5)
1985
86.0
26.8
However, in another ICDS block IMR was found to be low in the sample covered,
but it was mainly due to poor reporting, ignorance and illiteracy prevailing in the
area (Aswath, 1984).
*
0.
0.
XO c
Subrahmanyam (3.5)
1985
Mandowara (3.3)
Ml
iozT
40.7
Sunder Lal (3.4)
1985
Janardhan Reddy (3J)
1985
Malnutrition had been reported as the major cause of infant mortality in studies
conducted by Jugal Kishore (1983), Sunderlal (1983), Tandon (1983) and Thakur
(1984). The other common causes of infant mortality were fever, respiratory
infections, diarrhoea, prematurity and pneumonia (Sunder Lal, 1983; Aswath, 1984;
Subrahainanyam. 1985:'Swami Saran, 1985). High IMR was also due to non
utilization of referral services by mothers as they were reluctant to hospitalize their
infants suffering from malnutrition and measles. But in spite of this the perinatal
□nd infant mortality had decreased in ICDS blocks due to good antenatal care,
referral of high-risk pregnancy cases to hospitals, surveillance of morbidity in
infants, etc. (Kamla. 19841.
'
L1
Morbidity Status : Morbidity indicators are preferred to mortality as the latter do not
55.3
(0-3 months)
8.7
• Numbers in parentheses are as per the List of Classified Research
95.-4
Age-specific mortality reported in few studies was found to be closely associated
with poor living and environmental conditions. In the age group 1-3 years, the
mortality rate reported by Subramanvam (1980) was 20 per thousand live births
whereas according to Sunder Lal (1983) it.was 16.3 per thousand live births and was
almost double (8.1) the mortality rate of children in the age group 3-6 years. The
various diseases leading to early childhood mortality were fever, prematurity,
diarrhoea, respiratorv infections, tetanus, accidents, severe malnutrition and gastro
intestinal infections (Sunder Lal, 1983; Seth, 1979).
?
202.5
’
estimate the sickness load and disability that precedes death. In many chronic
condiuons of low fatality, mortality statistics are not of much use and one has to
depend on morbidity statistics. Morbidity is measured in terms of persons who are ill,
episodes of sickness and duration of sickness. The trequency of the indicators of
illness is estimated in terms of incidence and prevalence rates.
Studies.
In an ICDS block, 50 per cent of the total deaths were of infants only (Aswa
1984), the maximum being in the first month of life (Subrahmanyam, 1985). Abe
38 percent infants died on the first day of birth (Swami Saran, 1985)and51 perce
during the neonatal period (Mandowara). The causes of death in neonatal peril
were asphyxia-neonatorum, septicaemia, (Mandowara) respiratory disorders. It
birth weight and jaundice (Kamla, 1984) whereas post-neonatal deaths were due.
■■
v.
.
The childhood diseases prevalent in ICDS blocks were affected by innumerable
social, cultural and biological factors. The data available from the studies in relation
to the incidence and prevalence of diseases was inadequate and not reported in a
systematic manner. The studies related to diarrhoeal diseases and worm infestations
have been reviewed separately in this section.
pregnancy wastage, failure to identify high-risk pregnancies and their inadeq
Many children suffered from more than one illness simultaneously or remained
. sick at one time oc the other. (Sunder Lal, 1985; Bansal. 1978; Subrahmanyam. 1985).
i?
It was observed that 54 per cent diseases led to loss of weight among infants; the
. maximum being due to diarrhoea (Swami Saran, 1985). The frequent occurrence of
-diseases also led to retarded growth (Sunder Lal, 1985). Interesting seasonal
variations were also observed in the morbidity pattern. The incidence of diseases was
. high during summer and rainy seasons (Ellahabadi, 1978; Subrahmanyam, 1985).
«
The common causes of morbidity among neonates were diarrhoea, jaundice, fever
|
and cordsepsis (Nasir, 1986) whereas-among pre-school children malnutrition was
management and maternal problems such as anaemia, pre-eclamptic toxaa
antepartum and haemorrhage and hyperpyrexia (Mohapatra, 1981).
£
the major factor responsible for mortality and morbidity followed by gastro£.' ■ intestinal and respiratory infections (Seth, 1979).
pneumoria, diarrhoea, (Mandowara), gastroenteritis, respiratory disorders, fev
fever/fits, low birth weight, malnutrition, measles, brain fever, jaunaiceand choli
(Kamla, 1984).
The perinatal mortality rate was found to be 80.4. High perinatal loss was found
the maternal age group below 20 years and above 34 years amongst primly ?
mothers beyond fourth para and those who did not receive any antenatal
Perinatal mortality was directly related to twin pregnancy, prematurity, prev
vj
44
On the other hand the most common diseases prevalent among children were
malnutrition, diarrhoea, respiratory infections, viral fever, gastro-intestinal
!$■.
disorders, followed by skin infections, worm infestations, anaemia, vitamin A
I V ■
etc. Table 3.2 gives the causes of childhood morbidity as reported in
’■
The incidence of morbidity was influenced by nutritional status, .iteracy rate, age,
’•
mpupation, and birth order (Ellahabadi, 1978). The episodes of sickness per
Kf^ed between 1.0 to 7.0 in ICDS blocks. There were certain age-specific
* Lntions in the morbidity pattern. The duration and incidence o sic ness was
Maximum among infants and more among children in the age group -- years t an
L 2-3
,
i
niarrhoeal diseases : Diarrhoea is one of the important components tn t e comp ex
\-cb of childhood ill-health and a major health problem especially amo g
; • Swlow five vears of age. Diarrhoeal diseases and malnutrition are inextrtca y in
■ ias major causal factors contributing to childhood mortality. Diarrhoea aggravates
c. malnutrition, and which itself is a contributing cause to the high number o ea s^
associated with diarrhoea during childhood.
In ICDS blocks, detection and treatment of diarrhoeal diseases by promoting use of
. ORS >s one.of the services provided under the health component. The research data
ci available highlights the fact that diarrhoea is prevalent in ICDS blocks and is the
r major factor for high morbidity. The maximum number of diarrhoeal diseases were
£• prevalent tn a village where a majority of the population belonged to Scheduled
|l&stes and Scheduled Tribes (Vasundhra, 1984). The incidence and fatality due to
Table 3.2
■
Mdiarrhoea was higher in infants than children in theage group 1-3 years (Sunder Lal,
||1985). The various factors associated with diarrhoea were teething, weaning,
^.unhygienic dietary practices, eating heavy food and change of seasons (Sunder Lal,
^1983).
j ! Expenence. shows that food should not be withheld from infants and children with
g,acute diarrhoea. However, the beliefs and taboos prevalent in the community do
• ( impose certain restrictions on the diet of children suffering from diarrhoea as well as
j tk.atof nursing mothers. Mothers preferred to give small quantities of cold and easily
^ digestible foods like khichri, curd, banana, wheat porridge, etc. to the children and
?■ avoided roti, milk, buttermilk and fried foods. Nursing mothers were not allowed to
ii eat pulses, vegetables, groundnuts, beans.etc. (Sunder Lal, 1983).
AWWs play a crucial role in disseminating knowledge about ORS and in. the
/management of diarrhoea at the village level. It was reported that 95 per cent children
suffering from diarrhoea were managed by AWWs. As mothers need to be actively
| involved in the treatment of diarrhoea, they were advised by AWWs regarding
j. practices to be carried out during the episodes of diarrhoea (Sunder Lal, 1985). Asa
result, a significant improvement was observed in their knowledge and attitude
regarding management of diarrhoea (Vasundhra, 1984). About 17 per cent cases of
^.diarrhoea were managed by mothers. In the treatment of diarrhoea, 25 per cent
mothers utilized ORS packets, 42.5 per cent preferred home-made salt and sugar
soluuon and 63.8 per cent gave plenty of fluids. Only 24.4 per cent mothers used
L herbal and allopathic medicines (Sunder Lal, 1985). A significant reduction in the
S' number of diarrhoea cases was observed in an ICDSblock; the percentage of children
j suffenng from;the disease decreased from 263 to 73 over a period of one year during
! ?- which ICDS programme was being implemented.
In sum, diarrhoea is both an infection and a nutrition problem. To malar
rehydration effective, there is a need to bring about a change in the attfi
behaviour and practices of not only mothers but also of health functionaries
specialists with the help of sound communication and mass media prograrnfl
may also involve nutrient enrichment of the electrolyte solution, promotitjj
breast-feeding, sound feeding practices during diarrhoea and improvements
personal and household hygiene, water and sanitation. There is a need to haven
exhaustive research on beliefs and taboos prevalent in society related to diam
management. Accurate statistics related to prevalence of diarrhoeal diseases, rail
impact of ORT, etc. are also needed to prevent a large number of deaths due.tq
disease.
Worm Infestations : Prevalence of worm infestations is attributed to poor pereo
hygiene, unsatisfactory environmental sanitation, faulty food habits,;_n
availability of clean water, poor health education, etc.
1®
The findings of the research studies available revealed that the prevalent.
Ascariasis infestation was the highest followed by roundworms. EnterM
vermicularis, Strongyloides stercoralis, Ankylostoma duodenale and Ascariasisu
Enterobius vermicularis. Some of the children were also suffering from moretj
A\VWs in [CDS blocks are also responsible for early detection of disabilities among
children. ICDS scheme provides immunization to protect the children from half a
docen diseases which lead to various types of handicap.
The available research studies related to childhood disabilities are limited. These
have reported the prevalence of one type of disability or the other in a few ICDS
' blocks. The prevalence of disability in an ICDS block was 12.8/1000 children, the
maximum being in the age group 2-3 years and among male children (Chawla).
About 1 5 per cent children were found to be handicapped in an ICDS project area
(t'dam. 1978). In another study 53 children were identified as physically
handicaoped (Kamla, 1982). Among the various types of physical disabilities,
orthopaedic disability was maximum (77.7%) followed by speech (7.2%), visual (6.7%)
and hearing (2.4%) (Chawla). Nearly 76 per cent of the disabilities were acquired and
? 24 percent were congenital. However, leprosy was prevalent among children to the
S extent of one in 2,000 (Chandra P., 1984); the prevalence rate among rural children
; was 22.9 per thousand and that among the urban 23 per thousand (Rao, 1981). Only
02 per cent children and youth were identified as mentally handicapped. The cases of
mild mental handicap and scholastic backwardness were not included in the sample
surveved.
The major causes of physical disabilities were poverty and ignorance (Chawla) and
that of mental handicap were birth-anoxia, encephalitis, Down’s syndrome,
one kind of worm infestation. Roundworm and T. Trichura infestations is
maximum in double infection and roundworm. T. Trichura and hookwt,
infestations were found in triple infection (Prabhakara, 1984; Aswath,li
Narmada, 1982; Khobragade, 1982).
;
Age and sex-wise differences in the incidence of worm infestations were:;;,
reported; it was maximum among male children and those in the age group 4-6^«
Triple infection was not seen in children below the age of four years (Aswath, 198
However, according to Khobragade (19^2), maximum worm infestations wereutO.
(
microcephaly and cretinism (Mathur. 1982).
Experts are of the view that a large number of children not immunized become
disabled, usually for life, through brain damage, paralysis, stunted growth, deafness,
blindness, etc. ICDS lays special emphasis on immunization of children. In an ICDS
project, mass immunization was found to be effective in reducing the incidence of
•-■aM
poliomvelitis.
Parents education and involvement is important in implementing any welfare
The prevalence of parasitic infestations was high among children from lajtj
families, low socio-economic status group and having poor environmeni
ix programme for handicapped children. Mathur (1982) observed that parents were
ineither aware of special schools for mentally handicapped children nor were they
age group 5-10 years (24.1%) and minimum in 10-15 years (17.1%).
sanitation. It was also more among children who were non-vegetarian. bare food
(58%), were using well water and not using latrine facilities (51.9%) (Khobragafl
1982; Aswath, 1983; Prabhakara. 1984).
advised to educate their children or give them any vocational training.
Childhood disabilities : At present, disability of one kind or the other afflicts a larg
percentage of children. In sheer size, the challenge of disabilities is next onijM
poverty. But when one thinks of the high per capita cost of institutional facilities®
f
Tehal Kohli (1983) evolved a portage training programme for developmentally
handicapped infants. The training had a positive impact on the Development
Quotient of the infants and on bringing about a change in the attitude of the parents
towards their handicapped infants. All the mothers were satisfied with the portage
service as they found it quite helpful. It was found that out of 103 tasks, ninety-seven
were leamt to the desired criterion by the handicapped infants and 11 infants in the
experimental group attained success in all the skills set during the training period.
'■:
In sum, the childhood disabilities are prevalent but the data related to their
incidence, prevalence, causative factors and the services provided is extremely
treatment, education and rehabilitative care and the magnitude of the problem, at)
comes to the conclusion that only a few could be helped and receive the facility
available. The common childhood disabilities are either physical, mental/g
psychological. Extensive, studies have reached the conclusion that most oftjj
impairments occurring among children can be prevented as they are: caused\|B
inadequate nutrition, faulty child rearing practices, preventable diseases anj
avoidable accidents.
?
x,
<«■
U
inadequate. There is a need to promote research in this area.
at
fe;
Children at risk : Low birth weight is the single most crucial determinant of the
chances of the newborn to survive and experience healthy growth and development.
Low birth weight babies (weight below 2,500 g) are at risk duringthe entire periodof
t^le*r childhood. The other important indicators of childrenatriskare malnutrition,,
more than five siblings in a family, recurrent diarrhoea and respiratory infections,
Worm infestations were detected by using special techniques. The Formal Elli
Sedimentation Technique was found to be the best method of stool examinational
gave high positive percentage (78.6%) as compared to Direct Examination (6919?
and Salt Floatation Technique (72.2%) (Aswath, 1983).
.'j&S
i;
•;
sk
£;
more than two infant deaths in the family, one of the parents sterlized, failure
breast-feeding, twins, parental deaths, etc.
There is enough research evidence to indicate that low birth weight remains tl
leading cause of perinatal and infant deaths. Low birth weight is mainly attributed
maternal malnutrition and anaemia. The other contributing factors are close
spaced pregnancies, antenatal infection, shorter gestation period, etc. Sunder L
(1984) observed that low birth weight was high in economically weaker sections
the community and in high birth order.
Only a few research studies on ICDS have reported the birth weight of the habit
In an ICDS block. 3.4 per cent infants weighed less than 2,000 g, 23 per cent less thr
2,500 g and 43.5 per cent weighed between 2,500-3,000 g. On an average the rate;
growth was favourable upto six months and thereafter it faltered (Sunder Lal, 198f
In two ICDS blocks the mean birth weight of infants reported were 2.8 kg and 2.71
respectively (Nasir, 1986; Sunder Lal, 1984). Nasir also identified 183 high-ris
neonates, of which 70 had low birth weight and 15 per cent were of fifth or high
birth order. The mortality risk was found to be five times more in infants weighir
less than 2000 gas compared to infants weighing 2,500 gor more (Sunder Lal, 1984
It was reported that about 48 per cent deaths occurred in low-birth-weight habit
(Sunder Lal, 1984).
‘
Sunder Lal (1978) identified 43.4 per cent children at risk due to severe PEM ani
56.6 per cent due to other factors, like more than five siblings in a.family, recurren
diarrhoea and respiratory infections, etc.
S
Nutritionally at-risk expectant mothers are likely to deliver low-birth-weigl
babies. Mohapatra (1981) evolveda simplified scoring system to identify expectai
mothers at risk and observed a significant direct correlation between high-risk scon
and perinatal mortality.
—
. , $ulus of expectant and nursing mothers : Pregnancy and lactation are the
'Lriodsof physiological stress with an increased req
*
tirement for most of the essential
'
I*
i- xuet tant mothers need to be given regular health cherk-up and dietary
■ . niemcntation as foetal growth and development puts a great strain on the
«uirrnal nutrition resources. Nutrition constraints during this period have direct
ta-ring on the birth weight of the infants which is a major factor responsible for high
Perinatal and infant mortality and impaired physical growth. Similarly, adequate
nytriiional status of nursing mothers has the desired impact on the development of
Infants. Under ICDS scheme, expectant and nursing mothers are given regular
health check-up and supplementary nutrition.
A review of the research available indicates that very few researchers have assessed
j}ie health status of expectant and nursing mothers. It was observed that a majority of
(Mothers were aware of the significance of antenatal care (Natrajan) and most of the
deliveries were conducted in the hospitals. (Kamla. 1984; Mohapatfa. 1981; Aswath.
1884; Natrajan. Joshi, 1985- Sunder Lal, 1983). However, in another ICDS block.
expectant mothers had only 2-3 antenatal examinations instead of five (Kamla. 1981.
TBAs were mainly responsible for natal care in the rural areas and in many cases
unhygienic delivery practices were followed due to lack of appropriate facilities and
equipment (Joshi. 1985). Sunder Lal (1983) observed that over 90 per cent TBAs
•washed their handsand sterilized the equipment required during child birth but only
,J0 per cent TBAs tied the cord with sterilized thread.
ICDS functionaries are trained to identify expectant mothers at risk so as to provide
them therapeutic nutrition and timely referral services. Yajnik(1984) prepared a slide
3d showing mothers at risk to guide paramedical workers in identifying such cases.
These slides were found to be effective and the author had already supplied 12 sets to
tICMR.
There is hardly any data available related to low birth weight babies. Researc
should be undertaken to assess the number of children at risk, their growth patten
the causative factors, skills of ICDS functionaries in identifying at-risk children an
the impact of services available to reduce low birth weight. Constant monitoring/
^^low-birth-weight babies and other children at risk can help in introducing effectiv
^^preventive measures.
Referral Services : The aim of referral services is to provide adequate medicql care to
.the beneficiaries depending upon the seriousness of their disease and also to follow
Population education : In this era of population explosion, a child welfare an
(diseases were also referred to the hospital as the health personnel at the grass-roots
: level lacked adequate knowledge regarding their treatment (Natrajan, 1985).
survival programme can be successful only if services in family planning an
maternal and child care are delivered to the community in an integrated manner;'
When the parents are ensured of the survival of their children, the number of births,
gradually decreases.
-if?
ICDS functionaries impart population education to the mothers during Hh
sessions and home visits. In a study conducted by Bhatnagar (1982) efforts were mat
to integrate population education with functional literacy classes, HNE classes ar
home visits after training ICDS functionaries. Jain (1986) reported that due
training of ICDS functionaries, in integration of population activities.
anganwadis, community members developed a positive attitude towards the fami
planning programme. There was an increase in the number, of family planner
acceptors and a majority ofcommunity members preferred to have small families;
that they could fulfil the basic needs of their children. -i
•Jip cases that have been treated or given medical attention at appropriate levels.
s? Referral services provided in ICDS programme have not been surveyed by
Ijesearchers. In an ICDS block, the major referral services rendered were related to
' PUO, LRTI and health and antenatal check-up. Children suffering from common
Medical Officers were of the view that at the village level the referrals between
•ANMs and AWWs for malnutrition and ailing cases should bedone through referral
cards. ANMs must refer the cases to the doctors incase there is no improvement rather
r an persist with their own treatment. Severely malnourished children should be
referred to MOs at PHCs or to specialized hospitals. (Ramniyata. Kumar. 1978).
f? As is evident, many crucial indicators of health status have been surveyed but there
* hardly any studies that give complete health status of the beneficiaries. Thereare
p
^Certain areas like referral services, delivery and cost effectiveness of services rendered,
prevalence of deficiency diseases, incidence of vaccine preventable diseases, etc.
Byhich need the attention of the researchers. Further, the health status of expectant
nursing mothers has not been reflected adequately.
There is a need to have more qualitative and quantitative data on all the
indicators to assess the impact of the programme and to introducemodifications in the delivery of services to enhance child survival rate.
■
HEALTH STATUS OF ICDS BENEFICIARIES
An Epidemiological Survey to Assess the Health and Nutritional
Status of Pre-school Children in a Rural Community of Kathura
Block, District Rohtak
V S Joshi, V P Sood, Y L Vasudeva, * Sunder Lal
KEY WORDS
Health and nutritional status, Immunization, Rural ICDS block
Objectives : The study was undertaken to assess the health and nutritional status of
.-pre-school children in a rural community.
Duration : July 1976-February 1977
Methodology : The study was conducted in the rural ICDS block Kathura, district
- Rohtak, Haryana. A sample of 632 children below six years of age was selected
■: randomly. The health and immunization status, including parasitic infestations and
■/haemoglobin level, were assessed by clinical and laboratory examinations. The
? nutritional status of the children was assessed by using weight-for-age index and the
nutritional grading was done as per the Harvard Standard. Parents of the children
■were interviewed to find out their economic status and literacy level.
Major findings and conclusions : The immunization coverage for DPT and polio
was 16.2 per cent and 0.1 per cent respectively.
’.a
2. Mean weight for various age groups was much below the standard
measurements. Only 27.8 per cent children were found to be normal and the
percentage of children suffering from PEM Grade I, II and III + IV was 32.0,28.7 and
1.8 respectively. The intake of protein was also found to be low.
3. About 58 per cent children were anaemic and 46 per cent had parasitic
mfestations, the most predominant being E-histolytica, giardia, round worms and
hookworms.
Recommendations : Adequate supplementary nutrition and nutrition education
. should become an integral part of ICDS. Deworming and iron supplementation
programmes should be undertaken on a regular basis as short-term measures.
Publication Details : Unpublished.
Health and Nutrition Education : An Overview of
Research Findings
jjtalih and nutrition education (HNE) is a tool to enhance the level of awareness
individuals and thereby bring about a change in their behaviour for the protection
j promotion of their health and well-being. It has been well accepted that increase
i})e health and nutrition knowledge of the community is an effective strategy to
_,nt malnutrition and enhance child survival rate. HNE, an integral part of
OS, is imparted to expectant and nursing mothers and women in the age group 15vtars by [CDS functionaries, Medical Officers and ANMs.
liis very important that these messages should be simple, appropriate and downgrth based on the needs of the people so that they could be easily adopted. In the
text of 1CDS, HNE aims at effective communication of certain basic health and
rition messages with a view to enhancing the mother’s awareness of the child’s
land her capacity to look after him within the family environment. The various
E messages imparted to ICDS beneficiaries are related to infant feeding practices,
lunizauon, utilization of health services, family planning and environmental
taiion. In spite of the fact that HNE is an important service provided under ICDS
has the potential of bringing about a directional change in the attitude and
rices in the community, it is not being implemented effectively. It has not yet
ived due emphasis in the job curriculum of ICDS functionaries. As is evident, the
rexarch conducted in this area is quite inadequate but the research findings available
have supported the fact that HNE can make the community aware of their health and
nutrition problems.
.It was observed that the mothers who had received health and nutrition education
Showed significant improvement in their knowledge, attitude and practices
^regarding infant feeding, deficiency diseases and hygiene and sanitation as compared
to mothers who had not received HNE (Mushtari Begum).
‘-'The health and nutrition practices in a community were affected by level of
^education, income and types of occupation of the respondents (Nair, Mushtari
Begum). In an urban ICDS block, use of ORS and.management of diarrhoea was
•influenced by literacy rate and. traditional beliefs and taboos prevalent in society
((Rajagopal. 1985).
Health education was imparted to mothers mainly by doctors, neighbours and
■pnmary health workers. It was found that the messages given by private practitioners
rivere more effective (Rajagopal, 1985). It was felt that when local leaders were
involved in the programme the public was, more receptive to health education
ISunder Lal, 1978).
-To a large extent, successful delivery of HNE component depends upon the
attitudes and skills of ICDS functionaries.. It. was reported that HNE was rarely
conducted, hy AWWs, Only a. small percentage-of AWWs were rated satisfactory on
^tills in planning and implementation of HNE (Sharma, 1986). Sunder Lal (1978)
209
found that only 15 percent AWWs were imparting HNE with enthusiasm whifcji^.performance of others was either average or they had indifferent attitude toward,'
work. Pramila in her study also corroborated the fact that tremendous efforts were •
required to motivate ICDS functionaries to organize methodical health educating
Nutrition Knowledge, Attitudes and Practices o£ Rural Mothers
Trained by Anganwadi Workers
programme. Il was observed that the time spent by tribal AWWs on HNE was less
than 10 per cent of the total time spent in other activities. Of the various message
recommended by ICDS, the two commonly given messages were 'use the availajSfc
health services’ and ‘improve personal hygiene’ (Seshadari, 1986). Experience says
that teaching aids enhance the learning process. Anganwadi workers are provided"
with training kits to impart HNE effectively. Sunder Lal (1978) reported that 50per I
cent ANMs and AWWs did not use any aids for imparting HNE in spite of the-faathat adequate educational material was available in the anganwadis. HoweveSKi
Seshadri (1986) was of the view that teaching materials with AWWs for HNE were;
inadequate and ineffective as aids.
o
•jjjg'
ICDS functionaries and ANMs are given job training and in-service trainingfronv'"'
time to time to improve their knowledge and skills. Sunder Lal (1978) observed thst
in his study the basic training imparted to ANMs was not satisfactory. Of the fotiiRg:
• J Mushtari Begum, V Malathi
KEY WORDS
Health and nutrition education, KAP, Training, Urban ICDS block
;
Objectives : The study was undertaken to assess the knowledge, attitudes and
practices of mothers who had received training in health and nutrition education
from AWWs and compare it with those who had not undergone any training.
mostly in preparing educational aids rather than developing communication skilMR
Moreover, the trainers of ANMs had no knowledge about their job responsibilities^®!
the rural areas and the training imparted was more medical oriented whereasdflj®
- Duration : Not available.
£■■ Methodology : The study was conducted in the urban ICDS block Anekal, district
r!r Bangalore, Karnataka. The sample comprised 80 mothers. Health and nutrition
■ education was imparted by AWWs to mothers whose children were attending the
Sr. anganwadis. AWWs in turn were trained by Department of Community Medicine,
St. John’s Medical College, Bangalore. A pretested questionnaire covering both
work in the village was field oriented. Supervisors and AWWs also reported that the®®
had not received anv in-service training in nutrition and health education (Seshaa^H
1986).
r.L ■'
p
In sum, we may conclude that the HNE component of ICDS needs toc|^H
strengthened. The assessment of the component needs to be done both qualitativd^B
and quantitatively. The role of training, use of mass media and the contents needlM®
be further reviewed and analysed to make the component effective.
fifr
MBj deficiency
2. There diseases.
was also a significant difference in the attitude of the trained and
K” untrained mothers on certain aspects like dietary habits of the family, deficiency
month training period, only 15 days were spent on HNE and this time was spewR
Ki
nutrition and health aspects was administered to all the mothers.
Major findings and conclusions: There was a significantdifference in the knowledge
of the trained and untrained-mothers on certain aspects like hygiene, sanitation and
diseases and infant feeding practices.
3. There was a significant improvement in general health practices, hygiene and
HK., sanitation after the training.
4. Nutrition knowledge and practices were influenced considerably by associated
■t. socio-economic factors in both the trained and untrained mothers. Attitude towards
K;
nutrition was not associated significandy with any socio-economic factor.
. 5.
Nutrition knowledgeandpracticesweresignificandycorrelated with each other.
MbHence, the training imparted by AWWs had some impact on mothers.
®' ■ Recommendations : Incentives should be provided to AWWs so that they have job
®'■ ■■■ satisfaction.
Rty ■ 2. Refresher training in nutrition should be given to AWWs from time to time.
K'-,
Publication Details : Unpublished.
E
Assistant
Professor, Depanmeu of Home Science, College ofAgricnlnirec University of Agricultural
L■*
—
-________________________
_
V . Science. Hebbal. Bangalore-560024, Karnataka.
’210
Early Childhood Development and Education: An Overview o£
Research Findings
'Catch them young' is the proverb for inculcating the appropriate traits in children
as early childhood is the period of rapid growth and development. The faculties of
child's physical, mental, emotional and social development are all at their peak
growing curve in the first 2-3 years of the child’s life span. The period is more
commonly known as the pre-school years, the most formative stage and, therefore,
also the most important span to inculcate the desirable traits for the child’s balanced
£ overall development. Therefore, the National Policy on Education has placed high
priority on Early Childhood Care and Education and has emphasized on its
integration into ICDS programme. Thus, pre-school education, has become an
: important intervention in programmes for pre-school children. ICDS is the largest
:■ programme of early childhood development with non-formal pre-school education
as its most important social component. It not only emphasizes on all round
; development of the child but also prepares the child for formal schooling and helps
in reducing the wastage and stagnation at the primary stage. Pre-school education is
imparted to the children in the anganwadis by AWWs using non-formal play-way
methods of learning. With the expansion of ICDS, the number of children attending
pre-school has increased from 74, 564
*
in October 1976 to 56,86,310 in December
k. 1988.
•
i
’
,
'
Only a few research studies have been conducted in relation to pre-school
education and child development in ICDS blocks. One of the reasons may be that it is
comparatively difficult to assess the psycho-social development of children.
However, the studies related to the subject have indicated improvement in the
educational and developmental status of children in ICDS areas.
The role of pre-school education in improving scholastic performance was
reflected in the study conducted by Sunder Lal (1981). It was observed that pre-school
education resulted in higher enrolment as 70 per cent children who had received pre
school education were enroled in the primary school. The enrolment of male
'■ children and those from higher castes was slightly better than female children and
those from lower castes. Once in school, the majority of these children were well
adjusted as compared to other children.
E- j
Pre-school education also brings about an improvement in the various inter
related dimensions of child development such as social, emotional and cognitive
development. Although there is some evidence to show that malnutrition hampers
cognitive development, yet it is difficult to determine the extent of its^dverse effects.
Muralidharan. found that in the age group 3-5 years, there were significant
'
:
* Source ; India,, Ministry o£ Human Resource Development,. Department of Women and Child
Development,. Status Report of the ICDS as on. 30th December 1988.
differences between cognitive and language abilities and anthropomq
*
-3
measurements of children, such as weight, height, mid-arm circumference andht
circumference. Sanni reported that the cognitive abilities of children could;.
improved with intervention programmes. Hunshal (1979) observed that cogrug
and social development of urban children was comparatively better than that ofruo
children and it was related to variables like educational and occupational levels oft
parents.
Play has its own importance in the life of a child. It enhances physical, intellect^
emotional, social, aesthetic, motor, language and attitudinal development It;
through play that children leam to explore, construct, create and also destroy.The
is only one study to report that play was considered extremely essential by pre-scHra
teachers in various types of pre-schools like anganwadis, nursery schoolsia®
laboratory nursery schools. All the laboratory nursery schools, 37 per cent nuraa
schools and 40 per cent anganwadis had sufficient space to play (Seshama, 19®
Socialization, education and training facilitates acquisition of socially desirahl
behaviour in children. Behaviour problems arise in children generally becausetc
conflicts and experiences during early childhood. The number of childxe
exhibiting behaviour disorders is increasing and these problems are as numerousa
diverse. Abrol (1985) found that on an average three children per anganwaa
exhibited symptoms of behaviour problems and they were more among girls (54%
than boys (46%). It was also reported that to reduce the severity of these problems the#
is a need to educate parents to enable them to identify the signs and causes of deviaS
behaviour in their children and seek timely treatment. The major problaii
identified were speech, slow learning/mental retardation, shyness/witiidrawM
PRE-SCHOOL EDUCATION
? ••
6,
A Comparative Study of Routine and Modified Anganwadi
Programme under Integrated Child Development Services in a
Selected Block
Rashmika Gupta, * S P Rahgir
KEYWORDS
Pre-school education, Curriculum, Rural ICDS block
4.. Objectives : The study was undertaken to (i) assess the effect of pre-school education
; ; on the development of children; and (ii) ascertain the impact of modified pre-school
education programme on the progress of their education.
Duration : Not available
r Methodology : The studv was conducted in 10 anganwadis of the rural ICDS block
K Fatehpur Sikri, Agra. One hundred and fortyfive children from five anganwadis
constituted the experimental group and 125 children from the other five anganwadis
K ■ formed the control group. All the children were in the age group 2-5 years and were
aggressiveness, .hyperactivity, hearing problems, temper tantrums, bed wetting
thumb sucking, physical problems, visual and poor motor coordination.
■
few matched for their performance in the anganwadis.
Kf A modified pre-school education programme was developed and implemented in the
Ki?experimentai group anganwadis for one month while the control group children
had their routine pre-school education programme. The ability and performance of
fey■ ' the children of both the groups was assessed by the teachers concerned by awarding
To sum up, it can be said that non-formal pre-school education, a crucial
Kl scoi’es. The “t” test was applied to see the level of significance between the two groups.
component of ICDS has improved the enrolment and scholastic performance;®
children,and has had positive impact on their cognitive and language developments
If strengthened, it can help in reaching children from the most vulnerable strati®
society and enhance their all round development.
KMajor findings and conclusions : The children of the experimental group showed a
E; significant improvement and progress in their learning activities after receiving the
E; modified pre-school education programme whereas those in the control group did
)
The research conducted in this area is not adequate. Studies undertaken haw
mostly reviewed the programme in a psychological perspective. There is a need'tffl
conduct more qualitative research on all the areas related to pre-school education!
including training, enrolment, retention, achievement, school dropout, facilities
and equipment available, time management of anganwadis, etc.
>
TjsJ
Kj not show any significant improvement.
K Recommendations : Action-oriented activities and audio-visual aids should be used
E;
By
to teach pre-school children.
Publication Details : Published: Regional Seminar on Pre-school Education
^■. Component of ICDS, Nov. 1984, NIPCCD Regional Centre (Lucknow).
Khandari Road. Agra 282002. U.P.
Community Participation : An Overview of Research Findings
people’s active participation and cooperation is the key to the success of a social
jnd developmental programme which is aimed al bringing about a change in the life
a! the people. To ensure people’s participation to the maximum, it is imperative that
ihey are involved in the programme right from its inception and the objectives and
jervices of the programme are interpreted in a manner that enables them to perceive
the programme as the one based on their felt needs. Community participation is not
automatic process. It moves at its own pace and requires systematic planned
efforts on behalf of the social workers to stimulate and motivate people to actively
participate irf
it.
*
In ICDS programme, community participation is an essential built-in
component. The anganwadi-worker is expectd to elicit community participation in
running the programme, not only to minimize the operational cost, but also to make
the people aware of the special needs of children and their mothers, and enhance their
capabilities in taking care of them in the family environment.
-
■ Community participation, a social component of ICDS, is not subjected to
evaluation very easily. The findings of the limited research studies indicate that
L participation of the community is only marginal or low in most of ICDS blocks and
needs special efforts on behalf of ICDS functionaries to elicit community
■i; participation to make ICDS programme a success. In the research available,
eb- community participation has been mostly assessed by the knowledge of the
Spy beneficiaries about ICDS, their perception and extent of participation in the
p:. programme. The data available from the research studies is not given in a systematic
B. manner and is also inadequate.
is. Community members can fully participate in ICDS only when they are awareof the
E- objectives and services provided and have full knowledge of its beneficiaries and
K
fc
a
g
mode of implementation. It was observed that women and community leaders had
low level of awareness regarding ICDS programme (Sharma Sushma, 1986). In a
community only 4 per cent respondents could link the scheme with child welfare and
only 9 per cent respondents knew that women in the age group 15-44 years were also
among the beneficiary group. They also had limited knowledge about ICDS
functionaries and their job responsibilities. However, AWWs and helpers were better
known than CPDOs. Further, the level of knowledge was comparatively higher in a
. niral area than in an urban area (Paranjpe, 1984). The awareness of the community
members was maximum regarding supplementary nutrition followed by pre-school
education and immunization and that of health functionaries was of immunization
followed by supplementary nutrition and prophylaxis programme. (Sharma
Sushma, 1986).
'k;
However, other researchers (Ramdev, 1982;. Sharma A., 1986) found that people
were aware of the scheme and had fairly adequate information regarding ICDS
’ functionaries and various categories of beneficiaries Biit had low knowledge about
g; the activities of other voluntary organizations- Variables like age. caste- type of
253
in
*
However,,
15 per cent anganwadis the community did not participate due to
inefficiency of AWWs and negative attitude of pradhans and members of mahila
family and literacy level had a significant effect on the knowledge of respqi
about ICDS (Bhatnagar).
A majority of ICDS functionaries were not able to perceive the imports
community participation (Sharma Sushma. 19861. It was reported th;
community perceived non-formal pre-school education as learning of counts tl
AWW considered pre-school education as a better way to acquire good habi
moral values. It was found that ANMs and LHVs had not understood the purpu
pre-school education (Rajesh Kumar, 1984). In another study, it was observed;
pre-school education was the most liked service in all the three blocks surveyed
inculcated good habits and children could get admission in schools easily (Parai
1984). Community leaders considered supplementary nutrition only
supplementing the diet of
* the beneficiaries. However all AWWs, ANMs,.-F
found HNE more useful than supplementary nutrition. In an urban ICDS prajt
per cent beneficiaries felt that their children did not benefit by supplant
nutrition (Paranjpe, 1984). In another ICDS block the community members;
favourable attitude towards health check-up and immunization. (Rajesh Ki
1984).
The level of participation of both the beneficiaries and community leaders wi
in rural, urban and tribal ICDS blocks, the highest being in a tribal ICDS bloc
the lowest in an urban project (Sharma S.,1986). Shanna A. (1986) also observe
participation and involvement of beneficiaries and local organizauon in ICD
minimal. A majority of ICDS functionaries had no concept of the importat
community panicipation. They were of the view that the community cot
involved in giving accommodation or motivating people for immuniz
However, Paranjpe (1984) observed that participation by way of e
accommodation and assistance was totally absent. According to comm
members, participation in ICDS was limited to utilization of services renc
Gandhi (1984) was of the view that in an ICDS block, mahila mandals andy
clubs were actively involved in implementing ICDS programme. Thev werehel
AWWs regularly in all theactivites. ButSl&rma A. (1986) found that very few vic
were members of mahila mandals and those who were, did not attend the mee
regularly. Ramdev (1982) found that community’s involvement in relatio:
anganwadi activities was minimal although ICDS functionaries agreed t
^community participation was essential for effective implementation of?;,
programme. According to CDPOs, there was a higher level of commur
participation in 40 per cent anganwadis, moderate in 20 per cent and low in 25•;
cen anganwadis.
ICDS functionaries felt that low level of community participation wasattribu
to lack ofawareness and knowledge of ICDS scheme, ignorance, poverty, lack oEr
on the part of the villagers, inadequate training of AWWs, lack of nans port facili
etc. (Ramdev, 1982).
The factors considered crucial for strengthening and promoting commu
participation were skills of the worker in eliciting community participa
existence of coordination committees, frequency of their meetings arid
involvement of local organizations (Sharma A., 1986).
.
tnandals (Ramdev, 1982). Over 50 per cent of the potential beneficiaries wetenot
availing the benefits of ICDS scheme because women in the age group 15-44 years were
not utilizing the services, anganwadis were at a greater distance from their homes,
lack of regular supplies, lack of time, ignorance, poverty, negative attitude of parents
towards supplementary food and anganwadis. (Paranjpe, 1984; Ramdev, 1982).
To sum up, the research conducted in this area is too meagre to come to any
conclusion. There is a need to draw the attention of researchers towards this
important social component of ICDS. There are certain constraints which restrict
community participation in ICDS and there is lack of clanty about the concept of
community participation. It is important to develop an operational definition of
community participation %nd identify the indicators to measure this social
component of ICDS to enable ICDS functionaries and researchers to promote and
analyse it effectively. There is also a need to have constant feedback from the
community to strengthen this component.
Impact of ICDS: An Overview of Research Findings
•pje ultimate aim of ICDS is to produce an impact in the form of lasting benefits to
community by bringing about changes in the well-being of children and their
[pothers. Impact of a programme is assessed by evaluating the programme
objectively and systematically with the help of a set of indicators. It is not an easy task
to undertake impact analysis. This is particularly difficult in the absence of dearly
tjefined indicators required to assess the changes which take place in children in the
community as a result of the programme inputs; and involvement of various
variables which do not yield easily to quantification. Besides this, impact analysis
stresses on assessment of the programme at regtfiar intervals, including its costjtfectiveness, utilization of services and welfare of beneficiaries; and highlights the
success or failure of the programme.
The Planning Commission and a few researchers have made an attempt to evaluate
■ICDS as a whole or its isolated services; sometimes even providing conflicting results.
ftom the findings of these studies, it is difficult to generalise the actual impact of
/ICDS. Nonetheless.’the experience of thirteen years of ICDS has indicated that it has
the potential to improve the status and well-being of the target population.
| In the research available, the researchers by and large have used before-after or
“-.experimental-control designs to assess the impact of services. Very few longitudinal
5 studies are available in this section. An attempt has been made to analyse these
findings and integrate them. The trends arrived at collating the findings service-wise
i are presented below.
; Impact of ICDS on the Nutritional Status of Beneficiaries
Research studies reviewed under the Nutrition section have
V malnutrition was prevalent in ICDS blocks and wasattn ut
» P<“
■. economic conditions. Poverty, ignorance of the special needs o
i
.
weaning practices, inappropriate beliefs, etc. have often resu t
in p
children with inadequate and poor quality diet by fannies.
ns
. .
; environmental sanitation combined with limited knowledgeo nutnuon
/ further contributed to the high incidence of infectious diseases. w
blocks
.adversely affected the utilization of nutrients. In almost
u,«no<been
. supplementary nutrition was provided but its acceptability and quality
ifully assessed.
(iCDS programme has certainly brought about
^tin Wa.it
malnutrition. I lean be said with confidence that though PhM
P
is comparatively less in ICDS blocksXMehendale, 1982; Masood,
. an
.
'
Gupta; J.P.. 1978; Krishnamurti, 1983). Further, studies have
£
conclusively that nutritional
status
of children
in ICDS areas
•tjon2i status
:.®°ndCDSareas?5rhe
scheme has
brought
sig^ificantchan^
inisthe nutntionalstatus
children amThas the potential to enhance it furtht^
though themeah values Srilthe anthropometric measurements of children
271
1
l
'
and non-lCDS groups were lower than ICMR Standard, the values in non-fQv
group were the lowest. Devadas (1982) found significant improvement in thebe^
and weight of children during a repeat survey. Tandon (1978) and Mehendale
reported that in areas where ICDS was already functioning there was a definfip
improvement in the nutritional status of children.)
’
practices prevalent in ICDS and non-ICDS areas. Prasad’s (1985) study has suppoit;..
the fact that mother’s milk was the main source of nutrition for infants as 99:5 ip?. ;
cent infants in the baseline survey and 98.8 per cent during the repeat survey w.:-s
breast-fed. Gupta (1982) found that the mean duration of breast-feeding wasTRffi
months in an ICDS area and 17.4 months in a non-ICDS area, and age of weani^jt
was 11.2 months and 15.4 months in an ICDS and a non-ICDS area respective!-.
Prasad (1982) further pointed out that the percentage of children weaned belovst^
age of six months increased from 3.6 per cent during the baseline survey to 12-5pel
cent during the repeat survey but a majority of children were weaned during-tbiS
second year of their life only.
' '^1
Inspite of the fact that expectant and nursing mothers are vulnerable to the effect^
of malnutrition and special services are being provided to them under ICDS, there®:
hardly any study to assess the impact of ICDS on their nutritional status, intakes ’
food and ’their attitude, beliefs and practices related to infant feeding and child'
rearing.
As is eviaent, nutrition component has received due attention of ICDS researchers
Most of the studies available are related to coverage of beneficiaries and thei
nutritional status but there is hardly any study related to quality, acceptance aijt
cost-effectiveness of supplementary feeding. There is a need to continuously monitn
the nutritional status of beneficiaries and prevalence of deficiency diseases in-al
ICDS blocks to assess the total impact of this component. Management of severet
malnourished children, infant feeding practices, training of ICDS functionaries,etc
are few of the areas which may be considered for future research.
272’-
CM —
o o
'
zz
on cm
**
________ N l ___________________ ____
infective properties specially during the first six months. Infant feeding is fuhfiv
affected by the type of supplements given, age of weaning, and the manner in
j
. w they are given. There are only two studies available to compare the infant fradftnSj
Numbers in the parentheses arc as per the List of Classified Research Studies.
Poor infant feeding practices have a direct bearing on malnutrition and isoneof
the major problems in social and economic development. Breast-feeding favourably
affects child survival by its role in nutrient intake, in birth spacing and in itsiaj|H
Table
7.1
Impact of ICDS on the
nutritional
status of children
(Experimental-control design studies)
The findings presented in Table7.1 and Table7.2 support the claim of pash., . •
impact of ICDS on nutritional status of children. Figs. 6 and 7 further endorse higf^
increase in the percentage of normal children and Figs. 8 and 9 indicate decrease in
the percentage of severely malnourished children in ICDS areas.
children (%),
Table 7.2
Impact of ICDS on (he nutritional status of children
PERCENTAGE OF NORMAL CHILDREN IN
ICDS AND NON-ICDS AREAS
FIGURE-6
FIGURE - 7
J
PERCENTAGE OF NORMAL CHILDREN DURINi
BASELINE AND REPEAT SURVEYS
32.5
BASELINE SURVEY
59.5
REPEAT SURVEY
non-icds area
50.3
23.1
ICDS AREA
45.5
41.5
---------------3X2—B
H
35.8
34.0,
34.6
B 32.0
------- ■ 21.0
18.0
36.1
32.3
27.8
25.1
CHILDREN (%)
10.6
research studies
RESEARCH STUDIES
SERIAL NUMBER OF STUDIES LISTED IN TABLE 7.
numbers indicate
NUMBERS INDICATE THE SERIAL NUMBER OF STUDIES LISTED IN TABLE 7.2
Impact of ICDS on the Immunization Status of Beneficiaries
The research available regarding impact of ICDS on immunization status is very
inadequate. The studies reviewed earlier under the Immunization section hardly
assess the immunization status of the beneficiaries. However, there are studies to
support the fact that immunization coverage improved by 60 per cent or above for
FIGURE - 9
COMPARISON OF SEVERELY MALNOURISHED CHILDREN
DURING BASELINb AND REPEAT SURVEYS
BCG, DPT and Polio in ICDS blocks and it was significantly more in ICDS than
non-ICDS blocks during the corresponding period.
*
Studies reported in Table 7.3 corroborate the fact that the percentage of children
immunized in ICDS blocks was comparatively higher than that in non-ICDS areas.
21.7
The repeat surveys conducted in various ICDS blocks further revealed that there
was an increase in the percentage of children immunized over a period of time during
which ICDS was being implemented (Table 7.4). Figs. 10-15 illustrate the
improvement in the immunization coverage of BCG, DPT and OPV in ICDS blocks
as reported in the studies. However all these studies do not give much indication of
the decline in the incidence of vaccine preventable diseases.
BASELINE SURVEY
REPEAT SURVEY
i
•
The available studies on immunization hardly give data on immunization
coverage of expectant mothers. However, a few studies revealed that ICDS has
improved the immunization coverage of expectant mothers. Table 7.5 gives the
impact of ICDS on the immunization status of expectant mothers.
Insufficient data on immunization suggests that there is a need for greater
attention of the researchers on this aspect. Immunization programme, however,
should be subjected to constant monitoring and evaluation to assess its impact in
■' terms of change in the incidence and prevalence rates of vaccine preventable diseases.
There is a need to find out what factors contribute to universal immunization.
Further, the data collected on immunization should be independent and not part of
the data related to other health indicators which may or may not be co-terminus with
research on immunization coverage, incidence and prevalence rate of diseases, factors
associated with acceptance or rejection of vaccines, skills ofhealth functionaries and
impact of training imparted to them.
Q
i
o
RESEARCH studies
numbers INDICATE THE SERIAL. NUMBER OF STUDIES LISTED IN TABLE 7.2
I'1... * Source: India, Ministry of Human Resource Development, Department of Women and Childp: .■ Development. Integrated Child. Development Services. New Delhi. 1988. p. 16.
278
&
279
Table 7.3
Impact of ICDS on ipiniunizaiion status of children
(Experimental-control design studies)
S. Auihor
No. Year
Aiea of die study
ICDS (I)
Non-ICDS (NI)
Immunization coverage
Smallpo
BCG
DPT
OPV
Children (%)
Mehcndale (7.2)
*
1981
1
NI
—
Mehendale (7.2;
1982
I
NI
52.2
11.9
52.7
2.
61.6
25.7
—
5.
Gupta (7.6)
1982
I
NI
81.1
27.7
66.2
19.1
58.2
2-1.2
Khanna (2)
1983
•16.3
31.9
I
NI
11.0
8.7
47.3
4.8
54.3
0.3
—
5.
Jamal Masood (7.1)
1984
77.3
32.7
I
NI
65.8
22.4
79.6
21.4
—
6.
Sinha (7.3)
1984
1.5
8.4
I
7.3
3.0
25.9
22 3
. —
33.9
—
17.1
I 36.1
II 32.1
III 18.0
1 22.6
II 18.4
III 11.5
1 38.7
II 18.4
111 15.1
I 18.2
11 20.9
III 12.8
I 67.0
II 52.0
Hl 32.0
I 36.0
Il 24.0
III 12.0
I 92.0
Il 72.0
HI 61.0
1 80.0
II 20.0
HI 10.0
1.
1
NI
7.
Subramaniam i7.1)
1984
I
83.0
600
8.
Measles
Thakur (7.1)
29.2.
10.3
;
68.?
21.4
■
_
—
36,o
|o.o
8|.2
-56.6
...
-
-
Table 7.4
Impact of ICDS on immunization status of children
(Before-after design studies)
Author
S.
. N°'
Immunization coverage
Period ol thomudy
Baseline survey (B)
„
..
Smallpox
arc
BCG
DPT
err
Measles
OPV
Repeal survey (R)
Children (%)_________________ -—
63.0
79.5
11.3
49.3
6.3
17.6
—
—
85.3
79.4
15.1
51.0
—
—
—
B (1976)
R (1978)
47.4
74.1
B (1976)
R (1978)
60.1
74.1
20.9
55.4
1.0
15.2
—
—
—
3. Tandon (7.2)
(Tribal)
B(1976)
R (1979)
93.8
94.5
18.2
48.5
6.7
69.9
0.0
44.0
—
4, Sunder Lal (7.2)
B(1977)
67.4
37.5
5. Patel (7.2)
I 18.1
II ‘18.1
92.7
84.4
I 18.1
11 18.1
III 18.1
I 74.2
II 52.8
III 38.3
III 18.1
I 74.2
Il 52.8
HI 39.3
25.2
27.8
47.0
60.0
—
—
35.9
37.3
37.3
47.0
3.1
48.3
—
—
I, Tandon (7.2)
*
(Rural)
B(1976)
R(1978)
2, Tandon (7.2)
(Urban)
R (1980)
6. Bhandari (7.1)
B <1978>
R (1979)
7. Bhandari (7.1)
B (1980>
R(1984)
8. Mehendale (7.2)
B(1981)
R(1982)
—
61.6
81.1
52.2
66.2;
52.7
68.2
9, Prasad (7.2)
B (1981)
R(1985)
20.7
10.2
19.0
29.0
4.8
29.8
18.3
57.0
15.0
98.0___
(............ .. 5.0.......... ;••)
... 9L0............. )
(...........
|0. Kothari (7.5)
BO984)
R(1986)
• Numbers in parentheses are as per the List of Classified Research Studies.
—-
_
0.0
60.0
:a
Table 7.5
Impact of ICDS on immunization status of expectant mothers
FIGURE - 10
PERCENTAGE OF CHILDREN IMMUNIZED
IN ICDS AND NON-ICDS AREAS: BCG
Author
Year
. sj
<|
Place of study/
__ __________________ ______________
Expectant ratal
Period of study
Experimental-control design studies
ffl ICDS AREA
||h|! NON-ICDS
I AREA
Meh endale (7.2)
*
1982
J
Mehendale (7.2)
81.1
1982
Khanna (2)
1983
Bejore-ajler design studies
B (1981)
R (1982)
B(1984)
R(1986)
Sunder Lal (7.2)
B (1976)
R(1979)
CHILDREN (%j
Mehendale (7.2)
• Numbers in parentheses are as per the List of Classified Research Studies.
I = ICDS: NI = Non-ICDS; B = Baseline survey; R = Repeat survey.
research studies
* NUMBERS INDICATE THE SERIAL NUMBER OF STUDIES LISTED IN TABLE
283
FIGURE - 12
PERCENTAGE OF CHILDREN IMMUNIZED
IN ICDS AND NON-ICDS AREAS: DPT
FIGURE - 13
FIGURE - 14
BASELINE AND REPEAT SURVEYS': DPT
PERCENTAGE OF CHILDREN IMMUNIZED
IN ICDS AND NON-ICDS AREAS: OPV
BASELINE SURVEY j
•
REPEAT survey
69.9
CHILDREN (%)
66.2
29.8
RESEARCH STUDIES
1*
2
1
3
4
5
8
RESEARCH STUDIES
‘numbers indicate the serial number of studies LISTED IN TABLE 7.3
286
287
p
FIGURE
15
baseune an^re^eIt SUMRvpvI°
PURVEYS: O PV
jfc'
frn0acl
ICDS °n
$tatus °f Beneficiaries
K In spite of integrated health servicesand intersectoral approach to maternal and
f child health care, the findings reviewed under the Health section indicated that the
f. status of health of beneficiaries was far from satisfactory. IMR was high; childhood
■ diseases including diarrhoeal diseases and worm infestations were prevalent
t abundantly, immunization coverage was not optimal; many infants were low birth
[ weight babies; utilization of health services was not satisfactory and referral services
BASELINE SURVEY
|> were either not provided or mothers were reluctant to hospitalize their children. Poor
E sanitation and unhygienic surroundings further compounded the problem.
REPEAT SURVEY
g.
A careful analysis suggests that ICDS has the potential to enhance the survival rate
of children since health services provided under the scheme have certainly improved
E
the health status of children, which though is not optimal but is better than that of
children not covered under ICDS.
The impact of ICDS on the health status of the beneficiaries can be assessed
5
H through indicators like mortality and morbidity, service coverage, use of servicesand
HI
•-
•<r
a
changes in the knowledge, attitude and practices of the community.
ICDS has brought a positive change in IMR, the most important measure of health
status. The impact studies (Table 7.6) have revealed that IMR in ICDS areas was low
as compared to that in non-ICDS areas.
Table 7.6
Impact of ICDS on IMR
(Experimental-control design studies)
S-No
1.
IMR
ICDS-(I)
Non-ICDS (NI)
Per thousand
live births
I
NI
36.0
63.0
Gupta (7.2)
1982
I
NI
74.1
lll.l
3.
Shah (7.2)
1983
I
NI
70.4
129.0
4.
Jugal Kishore (7.3)
1983
I
NI
93.0
111.1
£
Sunder Lal (72)
1983
I
NI
93.0
111.1
6.
Thakur (7.3)
(1984)
I
NI
88.2
133-S
7.
Chandra (7.3)
1985
.
I
NI
80.6
94.2
the serial number OF studies
LISTED in TABLE 7.4.
Area of the study
Chhikaia (7.3)
*
1982
z
RESEARCH studies
Author
Year
_________
289
During the rep^tsurveys also, it
&
;
FIGURE - 16
observed
,MR had
af(er
implementation o
E!?^mrnA'^a^e"•?.sives thecomparison of IMRduring
baseline an repeat surv ys. igs. 16 and 17 further illustrate the impact of ICDS
on IMR-
IMPACT OF ICDS ON IMR
(EXPERIMENTAL-CONTROL DESIGN
Table 7.7
Impact of [CDS on IMR
(Before-after design studies)
NON-icds
area
S.N'9
ICDS AREA :
129.0
133.3
94.2
Author
Year
Period of the study
IMR
Baseline suney (B)
Repeat survev (R)
Per thousand
live births
113.0
101.0
L
Sunder Lal (7.3)
*
B (1977)
R (1981)
2.
Khushwaha (1.3)
B (1980)
R (1981)
153.7
147.1
1
Vidya Prakash (7.3)
B (1981)
R (1983)
110.4
94.5
£
Desai (7.3)
B (1982)
R (1984)
82.8
69.0
5.
Kothari (7.3)
B (1984)
R (1986)
78.0
62.0
88.2',
K>
- • Numbers in parentheses are as per the List of Classified Research Studies.
Age-specific and sex-wise variations were observed in the incidence of infant
. mortality. It was greater in the age group one month to one year with whom AWWs
had hardlv any contact (Chhikara, 1982). The female infant mortality rate had
declined considerably in ICDS areas though it was much higher (142) as compared to
the male (130). The major factor responsible for the decline was better delivery of
health and nutrition services to infants and expectant and nursing mothers (Tandon,
etal; 1985)
63.0
IMR was influenced by many factors like poor environmental sanitation, low
socio-economic status, illiteracy, malnutrition, age of mothers, birth order, birth
interval, income of parents, cultural constraints, etc. (Vidya Prakash, 1984; Kishore,
1983; Sunder Lai, 1981).
The causes of IMR had been analysed by researchers but only a few studies had
brought out a comparative assessment of causes of IMR in ICDS and non-ICDS areas.
Tables 7.8 gives the causes of IMR in ICDS blocks. In non-ICDS areas, tetanus
neonatorum, PEM, diarrhoea and respiratory diseases were the leading causes of
infant mortality (Gupta, 1982; Thakur, 1984; Chandra, 1985).
research studies
.■' .'-V
■.
..
-------------------
.
A few research studies also reported varied causes of childhood mortality in ICDS
and non-ICDS blocks. In ICDS group respiratory infections and marasmus and in
the non-ICDS group diarrhoea and marasmus were found to be the major killers
(Gupta 1982). Jugal Kishore (1983) observed that early childhood mortality was
mainly due to malnutrition (28%), diarrhoea (20%), respiratory diseases (16%) and
unspecified causes (36%), but according to Sunder Lal (1983) childhood mortality
290
291
IMR
Table 7.8
was attributed to fever followed by malnutrition, diarrhoea, respiratory infrrif^^ S
and accidents. In a study conducted byThakur(I984) the major causes of deathirifiu 1
age group 0-6 years were respiratory infections (8.6%), diarrhoeal diseases (21
1
severe malnutrition (17.9%), prematurity with asphyxiation (7.1%), neorbiS*
.!
septicaemia (7.1%) and tetanus (3.6%). When compared with a non-ICDS bia<4.''
severe malnutrition (35.3%) was found to be the major cause of IMR followed it .S
diarrhoeal diseases (17.6%) and respiratory infections (17.6%).
■ '
A comparison of maternal mortality rate in ICDS and non-ICDS areas
reported in studies conducted by Chandra M.R. (1985) and Chhikara (1982). The fix® ■J
study reported MMR to be 1.8 in an ICDS area and 3.0 in a non-ICDS area whemw^K'.'
the second research study it tyas 20.0 in an ICDS area 21.0 in a non-ICDS araTSS.
major causes of MMR as reported by Chhikara (1982) were child birth
pregnancy, fever and disorders of circulatory and central nervous system. .
■ ,T.
ICDS had a positive impact on reducing the morbidity pattern of chikfrea
Childhood diseases were prevalent both in ICDS and non-ICDS areas but marbufij
was comparatively more in non-ICDS than in ICDS areas. A decline in the prevalent
of diseases was also observed in areas where ICDS was being implemented. TablrfJ
gives the impact of ICDS on the prevalence of early childhood diseases.
/.'•a
■
It was reported that the incidence of sickness was 1.3 in an ICDS block and I.4S1
non-ICDS area (Gupta, 1982). In another research study the incidence of morbidS
was reported to be 4.2 per cent/child in a non-ICDS area and 3.2 per cent/childinai
ICDS area. Morbidity was influenced by social class, sex, family size and age-oEt|
child (Sinha, 1984). The causes of morbidity as reported in the research stiidie
differed from one ICDS block to another. Chhikara (1982) found that fever, cauji
peculiar to infancy and disorders of digestive, circulatory and central nervous systH
were responsible for childhood morbidity in an ICDS block. Gupta (1981) waso£t|
view that diarrhoea, skin infections and eye diseases were the leading causes<
morbidity. Kothari (1980) reported that malnutrition, GIT, respiratory infectui
and fever were responsible for morbidity during the baseline and repeat, sune
conducted in an ICDS block. However after two years of implementation of ICE
there was reduction in the percentage of children suffering from GITiaf
malnutrition.
-sS
On the other hand, Prasad (1985) found that in an ICDS block, morbidity pattei
did not show any significant change during the repeat survey after four year
Approximately two-thirds of the chidren suffered from one illness or the otherS
the maximum sickness load was observed in 2-4 years old children. Dues!
unhygienic and insanitary conditions prevailing in the block, diarrhoea.,al
respiratory tract infections were the major causes of morbidity.
Studies available have reported that parents from both ICDS and non-ICDS are
were not awareof the various childhood diseases. Common ailments like cold, couf
and diarrhoea were taken lightly and treatment was taken to some extent from AW1
'*
294
•' 1.$■
Table 7.9
childhood diseases
Impact of ICDS on the prevalence of early <
In a study conducted by Tandon (1983) IMR was found to be higher in an
i
ICDS project (80.2) as compared to the national figure (65). It was probably due tk ,1
location of the project in a slum area, where malnutrition, insanitation, povertvars
infections were widely prevalent.
tec doctor's advise was taken only when
condition o(
child became critical.
Lfjuldren were referred to hospitals only when doctors failed to cure them (Patel,
Chhikara. 1982).
■ Utilization of services is another important impact indicator which may be
• sponsible for better health status of ICDS beneficiaries. There was a significant
difference between an ICDS and a non-ICDS block in the utilization of health
i^vices, immunization, antenatal services, deliveries by trained staff, and intake of
riuunin A, iron and folic add tablets (Gupta 1982). Table 7.10 gives the utilization of
jflvices by children in ICDS and non-ICDS areas as reported in the studies.
' Information on utilization of health services by expectant and nursing mothers is
available in very few studies. Tandon (1978), Gupta (1982) and Sunder Lal (1979)
(bund that the percentage of expectant and nursing mothers receiving health and
nutrition services improved considerably during the repeat surveys. Nearly 70.4 per
.. .cent women in an ICDS block and 34.9 per cent and 59.9 per cent in two non-ICDS
areas were given antenatal care and were immunized against tetanus (Shah 1983).
■ The utilization of health and nutrition services by expectant mothers was
’ comparatively better in ICDS areas as may be seen in Table 7.11.
Table 7.11
Utilization of services by expectant mothers
Author
B':Year
Place of study/
Period of study
Services utilized
Iron and folic add
Antenatal care
Expectant inothers (%)
B?. Experimental-control design studies
|
Mehendale (7.2)
1981
Gupta (7.6)
E-
1982
s?.
B
Mehendale (7.2)
1982
56.3
33.3
I
NI
I
NI
sV
61.3
19.3
a
I
NI
58.6
36.4
42.8
30.4
56.3
58.6
49.1
428
—
' Before-after design studies
Mehendale (7.2)
49.1
28.3
B (1981)
R (1982)
Kothari (7.2)
B (1984)
25.0
R (1986)
90.0
Ru>------------------------------------------------------------------------------ -----------------~
I?;.. • Numbers in parentheses are as per the List of Classified R-searrh Saidies.
13.0
95.0
)? ■ I = ICDS; NI ■ Non-ICDS; B = Baseline survey; R = Repeat survey.
j .. Non-formal education imparted to mothers in ICDS blocks raised their level of
^ knowledge regarding supplementary feeding, growth monitoring, infant feeding,
(. environmental hygiene, family planning and immunization (Snhramaniam. 1987).
h-This was further corroborated by Deb (I982).who.found that knowledge of mothers
^.regarding immunization increased considerably after the implementation of ICDS
L Programme in a rural ICDS block.
Although family planning programme is not directly linked with ICDS w ;
observed that the acceptance of family planning was comparatively high-i't^pS
launching of ICDS; it was higher among the beneficiary couples (4.1%) than*
—:.
non-beneficiary couples (21.1%) (Vasundhra).
In some of the areas, ICDS programme had negligible or no perceptible ininS^
the beneficiaries. Phogat (1982) found no significant differences in the health s^
nutritional status and pre-school abilities of children in an ICDS and a non-jrju
block. It was due to wrong distribution and sharing of supplements, poordiaenn
of ailing children and inability to provide cognitive experiences. There was
difference in the health and nutrition knowledge of women in both the area: a
another research study the nutritional and immunization status and nisi-j
development of non-ICDS children was found to be better than those in ICDS bfoj
(Adhish, 1985). Tandon (1980) also reported in a study that a proportion ofchikjjjij
remained unimmunized and malnourished and did not benefit horn ICDS’Ama
because of non-acceptance of immunization by the parents, lack of safe HrWlRa
water, frequent intestinal infections and interruptions in feeding programriiedwj
difficulties in transporting nutritious food to villages.
As is evident, the health statusof ICDS beneficiaries has been assessed by reseasfis'
to some extent. There is a need to pay attention to other related areas like
incidence and prevalence of major diseases, maternal mortality rate, nrilii jlaM
services, etc. Efforts should be made to evolve reliable and realisticchild survival)^
developmental indicators to constantly monitor and evaluate the health serVibffl
Impact of ICDS on Non-formal Pre-school Education and Child Development
C^The existing monitoring system of ICDS does not give suffident infonnib
on the Pre-school Education component. It was only in 1985, thatafewstudiesaas
impact of pre-school education on children were conducted. However, the.limi
research conducted supports the fact that effective delivery of pre-school educati
promotes the development of children in the right direction. It was observed that:
intellectual status of children in an ICDS area was better than that of children!
non-ICDS area; this was attributed to the better nutritional status of childrens
impact of pre-school education (Adhish, 1985; Chaturvedi, 1985).
Pre-school education influences the progression of higher-order cogriil
fadlides was reported by Khosla (1985). It was found that children attend)
anganwadis scored significandy on language tests like Object Vocabulary. a
Listening Comprehension and cognitive tests like Sequential Thinking andTj
Perception. Paranjpe (1985) found that in the rural areas, children from an I®
block were willing to attend school and performed Better than their counterparts;]
non-ICDS area. ICDS also had a positive impact on their enrolment, retention]
and dropout rate. Sunder Lal (1981) was also of the view that over 80 per cent child
who had received pre-school education were well adjusted in school and ti
scholastic performance was better as compared to other children.
Some studies reported an interesting change in parent’s attitude towards educat
of their children as a by product of ICDS. Parents of the children who atteni
anganwadis. were willing to continue their education and send them to prim
schools. Paranjpe (1985) found that 90 per cent children, from ICDS blocks'
298
admitted to primary schools, faced no problems in getting admission and were
adjusted.
The findings of the research studies also revealed that IQ, enrolment andretetf
rates of ICDS children were better than those of non-ICDS children (Tabled
Area-wise differences on a few education indicators were observed. In a rural H
area, enrolment and retention rates were better than in a non-ICDS area, but
tribal area there was not much difference. In an urban ICDS block, enrolmeiit
retention rates of children were lower and dropout rates were higher as compart
children in an urban non-ICDS area (Paranjpe, 1985).
.
I
Recent evidences suggest that early intervention programmes are effectiffe
produce long lasting results. In the intervention studies conducted by Muralidl
in urban and tribal ICDS blocks, it was found that well-planned early chile
education fosters the development of children. It helped in arousing enthusia
AWWs and enhanced their capabilities in bringing about changes in the lanj
and cognitive skills of children.
It has been observed that utilization of services in anganwadis is influenced!.
location of an anganwadi. A majority of the beneficiaries and functionaries;,
satisfied with the pre-school education services provided by AWWs. However. it,
observed that anganwadis were not organizing any creative activities. In most of
anganwadis, children did not appear to enjoy the activities as these wereg
towards rote learning, were repetitive in nature and rendered in monotone. Alth
most of the parents felt that the anganwadi centres were places where children5
to read, write and develop good social habits, food appeared to be diemajor n
motivating parents to send the children to the anganwadis. This was evident I
significant increase in the attendance of chfldrtrrat meal time (Khosia, 1981
1
i
The major problems faced by anganwadi workers in organizing pre-s,
education activities were inadequate space and equipment and lack of skill;
training (Khosia. 1985). In an urban ICDS block, it was difficult for AW1
conduct outdoor games and activities. Most of the anganwadis did not havedrii
water facilities and, therefore it was not possible to feed the children at the c
(Muralidharan).
•
In the light of the above findings, it is evident that research on non-formal
school education in ICDS needs utmost priority as this is a crucial compohet
k ICDS which is related to the total development of a child. There is a need to coni
” studies on the status of pre-school education, techniques of delivery of sent
available facilities, time management activities of AWWs, effectiveness of trainin
workers, etc. Longitudinal studies should also be undertaken to assess theimpat
this component on enrolment, retention, achievement and dropout rates in’ prim
schools. Efforts should be made by ICDS administrators to draw the attentibn
researchers and experts in the area of child development and early chile
education towards the research gaps in this area and motivate them to undi
more extensive and qualitative research related to this component.
Monitoring and Evaluation Division in NIPCCD is in the process of finalisii
indicators to monitor the pre-school education component of ICDS. Tht
generated through constant mopitoring will no doubt help in assessing the imp
' this component both, qualitatively and quantitatively.
300
\
man
development
social change
^ensxonai progranu... - ------------■ ltTo
sum
up, ICDS isand
an ambitious
multia& <ame set of children, expectant and ? InteSraledJervic“ Provlded converge
2'ir qualttv of life. There is enough reseat
"S W,th a" a™ tO 'mprove
definite tmpact on its benefXitSTT7 I fa“lhat ICDS
durvival rate and bringing about a positive rh S e?°lhn- a n en an°ng thechild
(tXrch findings indicate definitef1* round d-elopment.
., flUtn[1
Kcseaiv;
on indicators
&
like IMR, nutritional
““movement
s(atus> morbidity
in some ofpatlern
the crucia health a
anrl
"d
. ^ge. utilization of services etc ICDS has also brought about chang^TnTe
; cognitive developmen of pre-school children and IQ of ICDS beneficiaries£t«
■ ‘ton ‘hart
t 'r'5; ^'eVe[' ‘here is a need lo strengthen the deliver^
i.yrrucis like i E and referral Though community participation is built into the
y programme, m many ICDS blocks either AWWs have failed to elicit communit
■^cipanon or the community is notawareof the services rendered under ICDS and
their role in making the full use of these facilities.
t; . On the whole the research conducted to assess the impact of ICDS is not
^equate, but there is a need to have more qualitative and quantitative data to
;jissess the total impact of the programme and introduce modifications at various
levels of implementation from time to time.
"^Monitoring and Evaluation of ICDS: An Crerview of
Research Findings
F
K;
t-
Monitoring and Evaluation are regarded as crucial processes arc integral part of a
planned developmental programme as they provide the needed t-rdback to assess the
impact of the service provided and the efficiency with which th— ire implemented.
Monitoring and evaluation though identical in many wa- are two distinct
fe
processes.
h
Evaluation determines systematically and objectively the reevance, efficiency,
!v. effectiveness and impact of activities in the light of their miectives. It is an
K. organisational process for improving activities still in proras and for aiding
|" management in future planning, programming and decision madng. On the other
L hand, monitoring is a management process for a continuous oroeriodic review and
s?
|
surveillance at every level of hierarchy of the implementation o inactivity to ensure
that input deliveries, work schedules, targeted outputs and the oner required actions
|. are proceeding according to the plan. The process helps ne management in
| identifying lacunae and obstacles so that mid-course correction-, nn be introduced in
p
implementation of the programmes.
i
t
ICDS scheme started in 1975 comprising only 33 projects, wasirst evaluated by the
Planning Commission in 1976. The results of the evaluation cd to the successful
expansion of the programme. Since then ICDS has been subject- :oevaluation from
time to time. Most of the research studies have evaluated one anect of ICDS or the
other, but there are very few studies that give the total evaluatin of the scheme at
regular intervals. ICDS has been evaluated by a few researches inly. An effort hast
been made to collate the research findings andevaluatelCDS uruirvarious headings!
such as beneficiaries coverage, ICDS functionaries, physical se :p of AWs. services,
rendered, etc.
Evaluation of ICDS
!■:
■
,
'
Beneficiaries coverage: The research findings available supper he fact that ICDS
.
programme has considerably improved its 'capadty to reaci r.e children in the
vulnerable age group. The highest percentage of children attendr-ganganwadis was
in tribal blocks (63.2%) followed by urban areas (49.7%). A sicstantial number of
these children were from Scheduled Castes and Scheduled Trees and the poorer
sections of society. Similarly, a large nuber of expectant anthers also availed
themselves of the services (Krishnamurthy, 1983). However, fcixar (1982) reported
that the percentage of beneficiaries receiving services was smaL This was attributed
to the shortage of AWWs, low literacy rate and"lack of interns among community
people. It. was also observed that though.angartwadis were funarming satisfactorily,
beneficiaries had a low awareness of the scheme (Sharma, 196c
. _____ ;_______ '. ■_____ . • ?..
ujT-T-.'
* Under this,, research findings of section 8 and 9 are summarised./
ICDS Functionaries: ICDS functionaries were not satisfied with the trainingrfflaSs
k,T‘.
imparted to them. A majority of ICDS functionaries felt that the job training rec -ii 'A.
was too theoretical and did ,.ot equip them with enough skills to cope with (!»•'..’
situation. As a result. ICDS was not being implemented effectively.
It was reported that though AWWs were aware of all the objectives of
scheme, yet while implementing the programme their focus was on nutritidbriti^
health component. About 50 per cent CDPOs visited anganwadis once a months®^
these visits were more of an inspection and the training inputs were tat<dC
introduced. Supervisors visited AWWs once in 15 days and. they were nortaRyt
*
action to implement the suggestions made in the visitor's book. To enabljs/ji
,
*
Supervisors to provide back-up support and on-the-spot job training to AWWsjhft,,,
is a need to impart appropriate supervisory skills to them and to modify thesylJ^^j^ •
the job training to promote utilization of services and to enhance capahiliriffiaBj
project functionaries to elicit community participation (Sharma, 1986)- '■ :?*^S
Physical set up of Anganwadis: It was observed that accommodation for
CDPOs office and anganwadis were in accordance with ICDS specifications (KiiitV
Most of the anganwadis were located in areas easily accessible to the beneficiaries)}^)
the surroundings were unhygienic (Sharma, 1986). Some anganwadis did notilaME
separate kitchen and the roofs of most of them leaked during rainy season
f.
There was a perceptible problem in appointing the grass-roots lev el workersinibri&.j
and tribal areas due to inadequate transportation, long distances and'sbcaj. constraints. (Krishnamurthv, 1983).
Supplementary Nutrition : The coverage of children under supplementary nutriftde)",
programme had increased and the beneficiaries were satisfied with the variOTgHn
quantity of food. In 73 per cent anganwadis food was available for 250daysaridjp^mSj7
and only 24 per cent anganwadis used fresh vegetables in cooking whichfyid#,'-;.
provided by the community (Krishnamurthv, 1983). Though the percentaffiffijjj
malnourished children was not very high, no efforts were made by the doggennH
develop special diets for malnourished children. Rice and ragi preparations wegSHM
given as supplementary food to children and mothers (Nair).
"i,r
The programme of supplementary feeding through take-home system was nqtabS!&?
to demonstrate its effectiveness although it was less costly. The suppiriSSHn
distributed was sufficient to augment the energy intake of the beneficiaries, still'tfifflffigS
was no improvement in the nutritional status of the children because die tpo«?;i4.
distributed failed to reach them as there was sharing of the supplement on'iTajH^:
scale (Mittal, 1976).
Health Check-up and Immunization : In ICDS blocks heakh-services wertgi®S8B
delivered .effectively. It was observed that out of all the services availabfe^^PA^
immunization received adequate attention (Nair). Though the immuni^^BBS
coverage was 50 per cent, there was high dropout rate in vaccinations administfOUjUBiM
a. series (Krishnamurthy, 1983). This may be attributed’toTacic of’tfairnmHMj.
orientation to ICDS. Moreover, the vita) statistics collected. by AWW^Sgt^M
inadequate. AWWs were maintaining health and antenatal cards
expectant mothers who were registered for supplementary nutrition. They '* e*JsS
\
maintaining cards for children below five years. There was also aAIacSM^B
coordination between the health staff and AWWs (Nair). It was also r ported that die
visits of the medical and paramedical staff were irregular as most of the time they
were busy in tamily planning and other campaigns (Krishnamurthy, 1983).
”
Further. Sharma s (1986) study revealed that in rural areas the beneficiaries werenot.
utilizing immunization and health check-up services though they had adequate
knowledge and were aware of the services provided under ICDS. However, in urban
and tribal ICDS blocks, there was optimum utilization of healdi services.
As a result, the childhood morbidity was high, specially in rural areas where fever
and diarrhoeal episodes recurred most frequently (Krishnamurthy, 1983). The various
diseases leading to morbidity in children were URI, diarrhoea, fever, kwashiorkor.
marasmus and bronchopneumonia (Kubde, 1985).
o
The health status of expectantand
nursing mothers wasalso not satisfactory. Most
of them were anaemic. The diseases leading to morbidity were URI, UTI, etc.
(Kubde. 1985).
{Non-formal Pre-school Education : Most of the respondents were aware of the pre
school education programme. However, the concepts of mental growth and early
stimulation were not fully understood (Krishnamurthy, 1983). The findings of the
study conducted by Sharma (1986) corroborated the fact that the enrolment of 3-6
years old children had improved considerably due to implementation of ICDS. But it
was observed that children were notstaying in the anganwadis for the full duration; a
majority of them were coming only to collect food. Moreover. AWWs by and large did
not have the requisite skills needed for planning and conducting pre-school activities
and most of them were not adequately equipped with teaching aids and play
materials. While imparting education, there was more emphasis on formal teaching
than play and other activities.
)
Health and Nutrition Education : HNE activities were rarely conducted in a group
and only covered areas like immunization, child care, family planning and hygiene.
Discussion was the major technique used for imparting education. Expectant and
nursing mothers were reported to be attending the classes in higher number as
compared to older women and girls in the age group 6-14 years (Sharma, 1986).
Referral Services : Referral services were not satisfactory (Sharma, 1986). AWWs had
not referred expectant and nursing mothers with serious problems to any referral
centre. Only 20 per cent AWWs were advising parents to take their children to PHC
doctor when the illness was severe (Mandowara). In some of the blocks, beneficiaries
were not aware of referral services (Krishnamurthy, 1983).
Utilization of Services by Expectant and Nursing Mothers: The utilization of services
by expectant and nursing mothers had not been reported in. most o£ the evaluation
studies. In two ICDS blocks, supplementary nutrition was taken by 80percentand5
per cent mothers respectively (Nair; Ketkar, 1982). Only 46.4 per cent mothers in this
group were receiving HNE (Sharma, 1986). Iron, and folic acid was taken by 11.0 per
cent and 22.7 per cent expectant mothers in two ICDS blocks (Kubde, 1985; Ketkar,
1982). Only 27.2 per cent expectant mothers were immunized against tetanus (Kubde,
1985).
....’
Community Participation : Community participation had not received
emphasis in ICDS programme (Nair). There was a tremendous scope for enhantit-.
. iew crucial and relevant indicators related to social components were identified
3 system was evolved to monitor social components of ICDS (Sharma, 1986). In
envisaged system, NIPCCD would be entrusted with the overall responsibility of
si
monitoring the social inputs and analysing, interpreting and reporting the
communty participation to make the programme successful (Sharma, 1986). ;<<y
observed that participation and involvement of the beneficiaries and itscjV
organizations was minimal. Contribution by the Panchayats and families ®
programme was in the form of land, building, firewood, equipment and (■>.<• ■
commodities. Urban poor were unwilling or were not able to con tribute anythsn^^T.;;
kind to the cenue. Even AWWs lacked skill in involving the communits
: •!
utilizing the community resources (Sharma. 1986: Knshnamurthy, 1983).
The factors considered crucial for strengthening and promoting communy.i j
. formation. The other partners in this exercise would be collaboratinginstitutions,
■ yoject functionaries and community members who would record the needed
"■^formation on a proforma known as Social Monitoring Report. In order to have
Ojable and objective data, the information would also be supplemented by
Enervations made by research investigators and community representatives. These
Ijchedules would have two parts, one for forwarding the information upward and the
f .jiher for recording the specific instructions for the follow-up action. The support of
£ jnte Governments and Department of Social Welfare would also be sought as they
participation were skills of the workers, existence of coordination commrenAij..
frequency of their meetings and the involvement of local organizations. It
t-bok
after
maintenance
activities.
K Phase
II administrative
of the research and
project
was launched
in 1987 to establish the feasibility of
felt that a nominal contribution if taken from the community may ensure t)
P. the system and to operationalizeother processes of integrating it into ICDS scheme at
interest and involvement (Sharma. 1986).
jriS
In sum, ICDS has been successful in reaching the poorergroups in isolatedasj
as urban areas. The effectiveness and efficiency of the programme has to beevalifi
in terms of degree and cost-effectiveness in achieving the objectives. Krishnannii
(1983) reported that despite a wider range of services and larger coverage, ICDq
less expensive compared to other child welfare programmes. Using 1982 esturri
die estimated operating cost for 1.000 ICDS projects was 0.66 per cent of GDi
India. Thus there is a scope both to extend the coverage of the scheme, as welja
allocate more resources to the existing projects.
Monitoring of Social Components of ICDS
<
.-«■
The mechanism for monitoring ICDS programme is built into the scheme to sew
extent. The Ministry of Human Resource Development is responsible for theoyeH
monitoring of the programme through a central cell established in the DeparinS
of Women and Child: Development. A Management Information System ensures
regular flow of information upwards from each anganwadi to the project, andfra
the project to the State Government and to the Govemmeiit of India. ThisiissB
through a Monthly Progress Report and a Monthly Monitoring Report.
'U$sg
The Central Cell at AIIMS assists State Health Departments in momtonngne^
and nutrition components and continuing education activities of ICDS;, Ifta
evaluates the flow of services and their impact through annual surveys andpenc
research studies.
’ ’.’.ril
Experts are of the view that social inputsofa welfare programme do notlendeal
to quantification. In the existing system of monitoring of ICDS also, sqi
components do not get due emphasis although community-based approach'd
social mobilization of resources is built into the programme. A need for monfttg
social components of ICDS, i.e. Pre-school Education, Nutrition and Efe
Education and Community Participation was felt to further strengthen thijscljj
and enhance the process of social change being brought out by this program!!
In 1980, NIPCCD was. entrusted with the responsibility of- develojMg|
comprehensive system of monitoring and evaluation of social componeruj
collaboration with technical institutions. A research project was initiated/inJs
396
B- ICDS is the most important means to reach millions of children and mothers and
I; ahas
national
level. of bringing about a change in their quality of life. A review of the
K
the potential
* research available indicates that there is a need to evaluate ICDS continuously. The
B: present system of monitoring of ICDS is reporting the process of delivery of services
and does not highlights the quality of services rendered. Information obtained is not
K disseminated effectively for introducing necessary modifications.
»,
For effective implementation of the programme and utilization of services, it is
imperative that a comprehensive system for monitoring and evaluation should be
Re built into the programme. The dam thus generated can determine systematically and
ft objectively the effectiveness of services renderedand their impact on the beneficiaries.
Monitoring Social Components of Integrated Child development
Services : A Pilot Project
• Adarsh Sharma
KEY WORDS
Monitoring of ICDS, Social components, Indicators,
Monitoring system, Evaluation of ICDS, Utilization of services,
Rural, Urban and Tribal ICDS blocks
Objectives : The study was undertaken to (i) evolve a comprehensive system for
monitoring the social components of ICDS; (ii) identify empirically relevant
indicators pertaining to implementation of social components; and (iii) develop
effective feedback system for introducing corrective measures at the various levels of
ICDS project implementation.
Duration : January 1985-May 1986
Methodology : Monitoring of social components of ICDS, i.e., pre-school education,
community participation and health and nutrition education was undertaken by
NIPCCD along with 11 academic/technical institutions. On the recommendations
of the Central Technical Committee, 13 centrally sponsored ICDS Hocks located in
the neighbourhood of the collaborating institutions were selected for the.study of
which seven were urban, three rural and three tribal.
Each institute selected a representative sample of 15 anganwadis from the block
assigned to it. From each anganwadi 70 women beneficiaries were identified. First,
from the beneficiaries registered at the anganwadi, 30 children were selected by
drawing lots. Visits were made to their houses to include their mother; and other
members of die family belonging to sample respondents. The remaining requisite
number of respondents were selected by drawing lots from the list of the respective
beneficiary' category.
The sample of each anganwadi and the total sample of the pilot project was as shown
in the following table.
Information on the delivery of services at anganwadi, physical set-up, profile of
AWWs, administrative support and-role played by various units involved in the
implementation of ICDS programme was collected with the help of five specifically
formulated schedules duly pretested. They were Household schedule, Social
component schedule. Local support schedule, Investigator's Observation proforma
and Administrative support schedule. Comparisons were made across rural, tribal
and urban projects. Chi square analysis was done to establish relationship between
variables. Bivariant tabulation was done for finding out the distribution trends.
* Deputy Director (Monitoring and Evaluation),.NIPCCD. 5, Siri Institutional Area. Hauz Khas, New
Delhi-110016.
-i
<
.
jp order to introduce timely corrective measures in ICDS scheme, the consultants
tfeIe asked to identify weak links in the implementation of ICDS in their respective
yocks based on their experience andreview of data collected. Two day workshops for
die project functionaries were organued by the collaborating institutions every six
months to take remedial action regarding the lacunae identified and to improve the
dulls of the functionaries to implement the scheme effectively.
gased on the findings of the study, all the indicators considered relevant empirically
[or monitoring social components of ICDS were identified and a system was
developed.
Major findings and conclusions: AH the variables related to implementation of ICDS
were studied and analysed. The following important findings emerged.
Physical setup:— The anganwadis were located in the areas easily accessible to the
beneficiaries but the surroundings were unhygienic. In spite of adequate indoor and
outdoor space, the space utilization was poor.
Profile of AWWs:—The married AWWsin theage group 25-44 years tended to work
in a particular anganwadi for a longer duration. Their educational level and training
were positively related to their performance and they had adequate time for various
activities. Only a small proportion of workers were not trained. The frequency of
contact with the community and regularity in conducting services was found to
enhance the participation of beneficiaries in the programme.
Administrative Support:— Fifty percent CDPOs visited anganwadis once a month.
These visits were more of an inspection and the training inputs were rarely
introduced. Supervisors visited AWCs once in 15 days and were not taking action to
implement the suggestions made in the visitors’ book. A majority of the
functionaries felt that the job training received did not equip them with enough
skills. The performance of the workers improved significantly with the support and
guidance received from the Supervisor and CDPOs particularly with regard to inputs
such as organization of meetings, demonstrations and efficiency of introducing
corrective measures to solve day-to-day problems.
Delivery of Services: Overall assessment by the investigators revealed that a majority
of anganwadis were functioning satisfactorily. There was a considerable rise in the
pre-school enrolment figures for male and female children although a majority of
them came only to collect food. A significant association was established between the
quality of pre-school activities and the duration of stay of children. Formal teaching
was emphasized and the existing pre-school programme lacked variety and
stimulation. AWWs by and large did not have the requisite skills needed for planning
and conducting the pre-school activities.
HNE activities, which were rarely conducted, covered areas like immunization, child
care, family planning and hygiene. Discussion was the major technique used for
imparting education and’ only a few AWWs possessed the necessary skills.
Discontinuation of Functional Literacy for Adult Women (FLAW) has adversely
affected the implementation of HNE component.
The coverage of children under supplementary nutrition programme had increased
and the beneficiaries were satisfied with the variety and quantity of food- However,
the referral' services were not implemented satisfactorily.
Participation and involvement of beneficiaries and local organizations was mil
although their coopera tionwas considered crucial for strengthening and proni
community participation.
The woman beneficiaries had misconceptions regarding pre-school educationThj.
A
parental expectations did not match with the objectives of pre-school education »
envisaged in the scheme. There was optimum utilization of health services' in
. tribal and urban blocks only. Despite their knowledge and awareness of health'
‘
services, the beneficiaries did not seem to make full use of health check-up and' '
immunization services.
- services
__ Frequency of contacting beneficiaries
__ Regularity and frequency of the services provided
i) Pre-school
— Frequency of conducting stories, rhymes, outdoor games, creative activities
— Variety in programme planning
__ Availability and utilization of teaching aids/play material
— AWW’s skill in planning and conducting PSE
2. The workshops meant for introducing corrective measures proved useful'its
orienting the project functionaries to take appropriate and timely actions and fis
exposing the functionaries to new and innovative methods and techniques >4 ''
conducting various activities. J-Iowever, it was found that the functionariesdidsti
*
•
implement the various suggestions probably due to lack of motivation andmiriwtSiWp
on their part.
.
' A-';'
3. Based on the findings of the study and the feedback received from theconsuIfiMfl^-'/g
a system of monitoring social components of ICDS had been developed.'
-'3
indicators considered relevant were incorporated in this system. The varias®’-:
indicators identified were classified as. input, output and outcome measures
below.
evaluated through
* observations by trained enumerators)
ii) Health and nutrition education
__ Number of formal HNE sessions conducted
— Specific messages covered
— Methods and techniques used
— AWW’s skills in planning and conducting HNE
D. Community participation
— Existence of coordination committees at AW level
— Frequency of holding meetings of coordinating committee
— Active involvement of mahila mandal/any other organization in AW
List of indicators identified for monitoring and evaluation
of social components of I CDS
e
* I
-_ _
— AWW’s skill in eliciting community participation
Input measures
E. Administrative support
A. Physical set-up of AW
— Frequency of the visit of the supervisory staff
— AW situated in clean and hygienic surroundings
— Kind of help or assistance provided
— Availability of safe drinking water source/stored at AW
— Functionaries' perception of the support received
— Availability of adequate indoor space (adequate=floor space for 30-40 chii<froitp>;
sit comfortably, space for storing and cooking)^
— Efficiency of introducing corrective actions
I — Availability of adequate outdoor space (adequate=play area for 10-15 childreifict',
play at a time)
— Utilization of the available space
— Availability of place for storage of rations
— Frequency of holding training sessions and demonstrations
Output measures
Utilization of services
— Number of beneficiaries registered in the centre category-wise
— Proportion of total target population utilizing services regularly
B. Functionaries
— -Age, marital status
— Educational background
— Experience
— Kind of training
— Attendance pattern categorywise for specific services
■ — Duration of time for which children remain in AW and engaged in pre-school
activities
— Level of involvement of children in ongoing activities ar AW
r — Distribution of beneCcfari.es/Iocal organizations in terns of help in kind, cash
—Adult/child ratio at AW
— Motivational level of the functionary (measured, through perception indie
and observation)
and propagation of the scheme
|J>.
'
/■’ -• ’-‘.i ■ ■•■ ■ ■ ’
*“■’ : '
- .
f.- — Number of community members involved in monitoring
f — Innovative ways tried ouz by functionaries to improve the functioning of AWs
4. After identifying the relevant indicators_ a comprehensive system for monitoring
■ [jje social components was evolved. In
envisaged system, NIPCCD would be
' entrusted with the overall responsibiliiy of monitoring of social inputs and
analysing, interpreting and reporting the information. The other partners in this
exercise would be collaborating institutions, project functionaries and community
members who would record the needed information on various proformae known as
Social Monitoring Report (SMR), either half yearly or quarterly depending upon the
purpose for which it is required. In order to have reliable and objective data, the
information would also be supplemented by observations made by Research
. investigators and community representatives. These schedules would have two parts,
one. for forwarding the informatiomupward and the other.for recording the specific
- instructions for the follow-up action. The support of State Governments and
Departments of Social Welfare would also besought as they look after administrative
and maintenance activities. The operationalization of the systerrfis presented below.
;
■
5. Phase II of the project has'been planned in order to establish the feasibility of the
system and to operationalize other processes of integrating it into ICDS scheme at a
; national level.
Recommendations : Community representatives should be involved in monitoring
certain aspects of the scheme. This would promote community participation and
provide objective information.
2.
The system should be tried out in selected blocks of various states to have a
representative sample at the national level.
3.
The collaborating institutions should evolve a process to cross-check the data to
ensure authenticity of information and records.
4. To give stability to the functioning ofanganwadis, AWWs in the age group 25-45
years should be recruited and they should not be allowed to rent a part of their house
for running AWCs.
•
5. To strengthen ICDS scheme, functional literacy for women should be
reintroduced; health referral services should be increased and network of mahila
mandals should be set up for mobilising community participation.
6. While imparting training to ICDS functionaries, emphasis should be laid on
practicals and field experiences, to improve their skills. Innovative training
technology techniques should be adopted for preparing training material and it
should be incorporated in job training.
7- The syllabi and curriculum of job training should be modified to strengthen
; utilization "and management of space, adequate information on selection and
preparation of appropriate play material, proper handling and management of
communication aids and enhancement of capabilities of project functionaries to
' elicit community participation.
Publication Details: Published: Sharma, Adarsh, Monitoring social components of
integrated’child development services: A pilot project, New. Delhi, NIPCCD, 1987.
Utilization of Services: An Overview of Research Findings
■'
Utilization of services is one of the important indicators to assess the impact of a
developmental programme. ICDS provides a package of six services envisaging that
die overall impact of the services will be much larger if they are utilized in an
integrated manner. The services provided are interdependent and are based on the
basic needs of the children and expectant and nursing mothers.
’
'
The various services provided under ICDS scheme are supplementary nutrition,
immunization, health check-up, referral services, non-formal pre-school education
and nutrition and health edcuation. These services are rendered through anganwadi,
the focal unit of ICDS, by an anganwadi worker. With the expansion of the
programme since 1975, the percentage of beneficiaries utilizing the services has also
increased considerably.
i-
;
■
From the research available, it is observed that utilization of services by the
beneficiaries has been reported in many studies compiled under various sections.
Under this section, studies related to utilization of services only are grouped. An
effort has been made to collate the research findings from the various studies to give
an overview of the utilization of services by ICDS beneficiaries.
The research findings do not give the utilization of each service in detail with
reference to the beneficiaries covered, the cost-effectiveness of the service, problems
faced while delivering the service, time spent, knowledge of functionaries, etc. So it is
not possible to come to any definite conclusion regarding the status of utilization of
services. Out of all the services provided, supplementary nutrition was availed by the
maximum number of children followed by immunization, health check-up and nonformal pre-school education. Utilization of HNE and referral services was reported
°in a very few research studies.
A few researchers have reported the impact of better utilization of supplementary
nutrition on the nutritional status of beneficiaries. It was found that the nutritional
status of children in an urban ICDS block was better than those in a rural ICDS block
due to better utilization of this service (Bawaskar). In another urban ICDS block, the
percentage of Grade IV malnourished children reduced from 2.2 to 1.1 after ICDS
project was started (Gupta J.P., 1978). On the other hand it was reported that
supplementary nutrition though provided in most of the blocks was not accepted
fully. About 32 per cent AWWs were of the view that the food offered under
supplementary nutrition was not liked by the mothers. Venugopal (1985) observed
that uppamau, a snack offered in an anganwadi was not accepted by 75 per cent
beneficiaries whereas varagula (ready-to-eat food) was accepted by 80 per cent
children, expectant and nursing mothers.
The main problems faced by AWWs in giving supplementary nutrition were
procurementof kerosene oil and foodarticles; distribution of foodat the anganwadis;
space for cooking and utensils for storage and cooking of food (Gupta. 1978).
ICDS functionaries are specially trained to identify malnourished children.!
giving supplementary nutrition. In a study it was reported that 77 J per cent chi
were receiving supplementary nutrition though there were only 30.5 per cent
malnourished children enutled for the
(<?up[a, 1978)
AWWs found it difficult to get the health check-up of the children done because
they had to carry the children to PHC at their own risk. Medical Officers/ LHVs did
not visit the anganwadis regularly. Medical care for diseases like respiratory
infections, skin and eye infections, diarrhoea and fever was received by children from
private practitioners, AWWs, PHCandsufa-centres to some extent. The utilization of
services from private practitioners by the villagers was by and large low because the
doctors were practising about three km away from the village and only a small
percentage of children availed medical aid from PHC/SC because of the absence of
the doctor (Gupta, K.B., 1977).
Table 10.1
Utilization of services
The percentage of children utilizing ICDS services as reported in research studies
may be seen in Table 10.1.
Only two studies have reported the utilization of services by expectantand nursing
mothers. Gupta J.P. (1978) reported that 37.3 per cent expectant mothers were
receiving supplementary nutrition. In another study, it was found that 10.3 per cent
expectant mothers and 18.7 per cent nursing mothers in a rural ICDS block and 28.8
per cent expectant and 49.4 per cent nursing mothers in an urban ICDS block
received supplementary nutrition. About 46 per cent expectant mothers in a rural
area and 33 per cent in an urban area were immunized (Bawaskar).
The various factors influencing the utilization of services were awareness and
attitude of beneficiaries, knowledge and skills of ICDS functionaries, effective
delivery of services, etc.
Awareness of beneficiaries regarding the services available and their satisfaction
has direct bearing on their utilization. It was found that the beneficiaries were not
fully aware of the services provided uner ICDS. Venugopal (1985) reported that only
25 per cent families were aware of ICDS and anganwadis. Further, though 75 percent
mothers were well aware of the immunization programme, only 10 per cent knew
about non-forma? pre-school education component. Raina found that 98 per cent
respondents were not aware of tetanus vaccination. In some ICDS blocks,
beneficiaries were satisfied with the services and in others they were not According to
Gupta J.P., (1978) about 97 per cent beneficiaries were satisfied with the services, 89
per cent found them very useful and 98.7 per cent were utilizing the services regularly.
The skill, knowledge and attitude of ICDS functionaries and the time spent by
them in delivering the services also influences their utilization. But no conclusion
could be drawn about the knowledge of ICDS functionaries as it was reported only in
one study that 43 per cent AWWs in the urban area and 55.5 per cent in the rural area
were having complete knowledge about their daily duties (Bawaskar).
In another study it was reported that AWWs spent nearly 21 per centof their time
on health services and 54.2 per cent on non-health activities including pre-school
education. The remaining 24.9 per cent time was not utilized (Gupta JT., 1978).
The coverage,, delivery and utilization of services are important links in the chain
of reactions leading to impact. Thestatusreports brought out by the Dpeartmentof
Women and. Child Development and the annual surveys conducted by CTCat AHMS
to monitor health and nutrition' component of ICDS report an increase in the
number of beneficiaries covered under various services. There is a need to cocduQ. national level longitudinal research studies related to utilization of ICDS services to .
assess the change in the status of beneficiaries. Conclusions should be drawn on the
basis of both qualitative and quantitative analysis of the data.
■.sriJ.j:
A Study of Some Aspects of Integrated
DcveIopment
Scheme m Projects Aurangabad (Urban) and Mota]a (
B 3 Bawaskar, • p y Sathe
KEY WORDS
Services, Utilization, Nutritional status. Morbidity,
Rural, Urban and ICDS block
f
;
Objectives : The study was undertaken«o compare urban and rural ICDS blocks
regarding (i) selected aspects of social and demographic data; (ii) health, nutritional
and immunization status of children and expectant and nursing mothers;
(iii) utilization of services by beneficiaries and (iv) profile of AWWs.
Duration : Not available
Methodology : The study was conducted in the rural ICDS block Motala, district
Buldana and in the urban ICDS block Aurangabad, district Aurangabad,
Maharashtra. The rural block was divided into three geographical sectors withequal
population. For each sector two lists were prepared, one of the villages having PHCs
nearby and the other at least five km away from PHCs. A total of six anganwadis were
selected randomly, one from each list and each sector respectively. The urban block
was also divided into three geographical sectors and two anganwadis were selected
■
from each sector using random number table. Thus there were 24 anganwadis from
. the rural block and six from the urban. Door-to-door visits were made by the research
team to collect information on the survey cards about socio-economic status of the
i
t
households; health, nutritional and immunization status of children and expectant
and nursing mothers and services received by them. The knowledge of AWWs
regarding day-to-day discharge of services was assessed through a questionnaire in
the local language (Marathi)
Major findings and conclusions : The social and demographic data of the rural and
f
urban blocks was as given in the table below.
'
Social and demographic data
Rural block
Urban block
Total population
6.151
5.401
4.987
5A42
Hindus
Social profile
Muslims
Scheduled Castes
Average family size
Literate population
Agricultural, cultivators
1.096
37
3.768
1.122.
5.1
5J
2.350
F.640
—
998
* Professor and Head, Department of Preventive and Social Medicine. Government Medical. College^
Aurangahart 431001 Maharachtra
Recommendations: The supply of supplementary nutrition and other inputs:
be regular.
2. Personnel of medical and social welfare departments should have i
coordination.
in the age
group
two
years and above
of I(“-DS and rjon-ICDS children
jfajor
findings
and
conclusions
: The Wa
m ?n
the national average. Again the mean
hlgher when compared with
non-ICDS group but the difference was n * •ICDS STOUP w^s more as compared to
and 3-4 years.
not stS"dicant in the age groups 1H-2 years
3. ' There should be adequate supervision of anganwadi centres and
community participation for effective functioning of the scheme.
all the
agewas
groups.
However,difference
there wasin,.,
a
2.
There
no significant
• , toflCDSand non-ICDS children in
group 3-4 years and 4-5 years when ICDS ancT
Weight in die age
with national average.
S
non'ICDS children were compared
Publication Details : Published: Indian Pediatrics, 18, March 1981: 187-188.
below.
was as given in the table
3.
The nutritional status of ICDS and non-ICDS
non rrr>c children
ktj
Nutritional status of children
Assessment of Impact of ICDS Scheme on Pre-school Childrt
Udupi Project, Karnataka
o Children
Nutritional grades
—
• B K Chakladar, R S Phaneendra Rao, Krishna Rao, Jyoti Kumari '
Non-ICDS
ICDS
N=321 _____N=547_____.
No. (%)
KEY WORDS
Impact of ICDS, Nutritional status, Immunization status, Rural ICE
Normal
102
(31.8)
128
(23.4)
PEM
Grade I
91
(28.3)
203
(37.1)
Grade II
94
(29.3)
176
(32.2)
Grade III
34
(10.6)
40
(7.3)
block
Objectives : The study was undertaken to (i) assess the health status of dr
attending anganwadis; and (ii) find out the extent to which they had benefitted
ICDS programme.
>J
Duration : September 1983-February 1984
Methodology: The study was conducted in 14 anganwadis, of which 12werela
4. The children from ICDS area were immunized with OPV (66.4%), DPT (68%) and
BCG (41.6%),vacdnes. The immunization coverage was good but considering that
the registered anganwadi children constituted only 25 per' cent of the child
in the rural ICDS block Udupi and two in the rural ICDS block Karkala, d£
Dakshina Kannada. Karnataka. Three hundred and seventyeight children in th
group 1-6 years were examined from a total of 560 children registered ii
anganwadis. Of these 186 were male and 192 female. A majority of children!?
were in the age group 3-5 years.
- jSj
population, the benefits of immunization were derived by only 10-16 per cent
children in the age gorup 0-6 years.
5. The findings indicated that most of the beneficiaries had not benefitted from
ICDS scheme although the per capita expenditure was Rs. 110/- per year. This was
due to (i) anganwadis being located at a distance leading to restricted attendance of
The control group comprised 547 children below the age of five years selected
non-ICDS area, of which 260 were male and 287 female.
Anthropometric measurements of all the children such as height and weight:'
children; (ii) lack of community participation; (iii)lack of coordination between
health and social welfare departments; (iv) lack of proper supervision; and (v) good
recorded and compared with national average. Their nutritional status was
assessed and the malnourished children were graded according to?
recommendations of the Nutrition Sub-committee of the Indian Acad
Pediatrics. The immunization status was assessed from the records mainta
AWWs.
nutritional status of children
. Recommendations : ICDS programme should be based on the needs of the people
■
and services provided should be changed accordingly.
2. The scheme should have an information system to provide direct means of
i
surveillance and evaluation.
3. The planners should identify the cost benefit indicators for evaluating the
The services provided in the anganwadis were not utilized by expectant and.i
mothers as they were not registered.
'■
j
lege
306
programme periodically.
4. Supervisory system needs, to be streamlined.
Publication Details : Unpublished.
307
____
NATIONAL INST A. JTI OF PUBLIC COOPERATION & CHILD DEVELOPMENT
No. of working days
:
12 days
No. of working Hours
:
72
Role of' AWWs in
achieving ICDS
objectives support
from CDPO,s up ervisor,HeIp er and
Medical functionaries
Preschool Education
- r aye r
.9.15Activities for promoting physical,social
JO ,Oo=.a.) and eactional development of children
Organising children for activities
storias
songs
language games
Listening sk"1
’
free converse
pattern makin
| P uo
mud & water play
Hq
m us c le. s
activities
Activities for promoting
a. language development in cnildren
b. reading- & writing readiness
00p.m. 2.00-p.30p.m. 3.50-5.00p.m.
Nature walk
as an acti
vity for
•) learning
from the
environment.
(10.CO-11.00
a.m.)
Activities for
promoting cogni
tive developmen
of children
using environ
mental resource
colour, size,
taste number
s naue we i gnt
smell etc. ,
Preparation of aids for organising
preschool activities
flash cards feely .bag masks
puzzles
converstory car
domihoas
sation
flannel
boars.
Discussion on utilisation’of kit
given during the job training cour
Preparing a weekly time table 5
school activities using
- mixed approach
— 'uHc.'ls s.ppzr’O a. ch
Practising activities using aids
prepared in tn= classroom foliowin
tne time table plans developed
Nutrition and Health
Assessment of sKills of AWs in
Monitoring
Enhancing skills of AWUs in wei
plotting and interpretation of
curves
J? " ■ ■ ' v
Use of growth cnarts for counselli
mothers about nutrition arc. nealth
aspects
Role Flay/Mock Sessions
- 3 10.00-11.30a.m.,.
11rpQa.m.-l,00p.m.
s essing s kills
ox AV. >7s in
i..preparation of
supplementary/
therapeutic
nutrition
ii. organisation
arc distribution
of SN to children
iii. storage of SN
Preparation of
six new/simpla
recipes for
SN our of raw
food items
supplied to
AV/ centres
:U00-2-^p,p.m. 2-.00-3. 30p.m. 3.3O-5.OOp.m.
•- Nutrition & Health Education
identification
Nutrition ana pane
Haaltn Edu
’(5.30- of area? and
cation for
5.-5 tanking points
p.m.) for NHnD
No the r: Need
and import
t3nc§ ’
Enhancing Knowledge of a'w'-s on Nutrition
8. Healer. Aspects for (discussion wizr. loaners
c-. Comm uni t v
ii) Dietary managementiii)
Song
i. Timely
in oiarrnoea care
stpplemen(11.30after acute dehy
tation of
11.45
dration
breast milk
a.m.)
Preparation of Oral
dehydration Solution
A,’~ n...
■
■
■ ■ ?
.WLu
Importance
of timely
immuni
sation of
children
1 L.y-tCi C *
Game iv)Care of
(5.50- the preg3.45
nant mother
p.m.)
before deli
very, durin
delivery &
after deli
very
Importance
of spateing
births and
the four
toos
pay
1(1.00—n.30a.m.
11.30a.m.—l.Oup.m. 1. uu— 2. OOn .m. -2.00-3.3 Op .m. 3 .3 0—5.00p.m.
Day 8 Public
Education of Mothers and Community on Nutrition T Session
speaking Health and Pre-school Education Asoects
Contd.
(3.3 6i. educating the
10.00
-i. Educating groups of
individual
a .m *)
mothers through mothers
mother through
meeting
K-l>Oj55me visits
Planning & Organising
Selection of
the mothers meeting U
Home, frequency
of visit
Role Play Exercises
Mode of discussion
Community -Particinatioi
Difficulties in invoivf
ing the community in
activities of anganwad:
Role of AW and supporfrom CDPO/Supervisors
Role Play Exercises
N
Strengthening
Public
sneakinc community partici(9.30paction through the
10.00
heln of Saroanch,
EDO’, Dai
' a.m.)
Utilising the Pri
mary school teacher/
youth club/adoloscent
girls for preschool
and tother AW activit
Session
Contd.
formation and activating
mahila manuals
Planning and conducting
mahila mandal meetings
Recording minutes and
planning follow up
action
"
c
Educating large commu
nity groups through
campaign.Planning and
organising campaign
for
Nutrition and
Health Awareness
ii. Awareness about
'A
iii. Awareness about
10.00a.m.-11. 30a.m. 11,30a.m.-1.00p.m.
.uup.m. 2.00-3.30p.m.
Practising camr aign, activitie s and
preparation of aids for the campaign
.u-/?•--/o,,
c
How to organise a -community meeting
selection of topic,arrangements points
for discussion
Manacement
Maintenance of records and registers
Identification of difficulties
Enhancing skills through exercises in
filling up records and registers
- p-La.nn2.ng worx/
service delivery
D is cd's s ion/s kil i
Training in an
area of special
inte---res t
- -aaly/weexly/monthly
activities- to be'
undertaken over
■cne .n.sxt oris yssz?
;30p.m.-o.uOp.m.
j
Problem areas in filling up MPR & HPR
forms
Exercises in filling up MPR & HPR forms
fc. ’iuCX-M d-vx, - ------
New Circulars/
developments in
Concluding session
FORM A i" Fuk STAic « RALn InG AC ! ION I’EA?^ FOR TILE YEAR
Name of the Staie/iinion Territory.
Name, designation & address of the Nodal Officer tor ICDS I raining Programme:
Assessment of functionaries to be trained
(a)
Number of 1CDS functionaries in the Statc/UT:
r "
1__________
l
J (i) Sanctioned
CDPOs
ACDPOs
Supervisors
Anganwadi Workers
Helpers
j
11
(ii) In position
I
Ii
ii
(iii) Vacancies
(i - ii)
II
j
(iv)Anticipated
recruitment
during the year
15 of 41
(b)
L'ctaiss of functionaries requiring Jeb, Refresher or Orientation Training with reference to i(a)(ii)
i
i
CDPOs
ACDPOs
(i) Job
Supervisors
Anganwadi Workers
Helpers
j
I
sI
I
I
(ii) Refresher
1
li
^(iii) Orientation
1
|(iv) TOTAL_________
Note: Put a line wherever not applicable e.g. Orientation for CDPOs, etc.
moduli and mapping of training centres
(a)
Details of existing AWTCs
k
| Name of the District
1
01
a.
I(i)
| (ii)
Name and precise address of the
AWTC
Name of lhe NGO/ Depit. running
the AWTC
Date on which AWTC
started, & whether the
Stale/UT Dcptt. have
inspected the AWTC in
lhe last one year
Remarks
(2)
(3)
(4)
(5)
0
1.
2.
3.
1.
2.
3.
1
| TOTAL:_____________
-
JI
Nott: Under rhe. Remarks column, Stales may like to comment on whether any AWTC is proposed io be relocated and it so, the proposed new
address, whether it is proposed to transfer the running of an AWTC to another NGO or Government Institute and if so, which one.
■„
1 Nome of ihc Disifici
i
An ICs proposed to be set up
Name and address of die proposed
AWTC
Name of the NGOZ
Deptt. who will run the
AWTC
Is this NGO/ Deptt.
running any other AWTC
in the State/UT?
(2)
(3)
(4)
(1)
(i)
1.
2.
3.
(ii)
1.
3.
1
i
1
----------------------------------- — .—---------Reasons for selecting the NGO/Deptt. to ■
run the AWTC
1
(5)
(c)
Details of existing ML’l’Cs
J
Name and precise addiess of the MLTC(s)
utilised by the State/UT
Name of the NGO/ Deptt. running the
MLTC
Date on which MLTC started
& whether the State/UT have
inspected the MLTC in the last
one year
Remarks
(1)
(2)
0)
(4)
1
1.
1.
'
1
1
1
KuuliES'I' FOR NEW AWTCtS)
/
The training capacities in all the
existing AWTCs are being fully ut '.scd. The question of utilising existing Government training
capacity in institutes such as DIETs, SIRDs, ATis, Colleges, etc, has been examined before proposing the new AWTCs. Tiie State DepaiUnent is
confident that the NGOs/Deptts. who are being proposed to run the AWTCs will do so satisfactorily.
Name of (he Director (ICDS) in capital letters:
Signature:
Date:
Note (i)
Note (ii)
11(a) and 11(b) are to be physically mapped on a map, with district boundaries. Existing AWTCs should be in red and proposed AWTCs
in yellow. This map should be annexed.
New AWTCs will be sanctioned only after receipt of the above signed statement.
III.
Suggested Strategies for Training (with details)
A.
Job Training
Functionary'
Strategy
Remarks
Strategy
Remarks
Anganwadi Worker
B.
Refresher Training
Functionary
CDPO/ACDPO
Supervisor
Anganwadi Worker
Details of new MLTCs proposed
(d)
i
Name and address of the proposed MLTC(s)
[including those in the neighbouring Stales, if
they are proposed to be utilised)
(1)
1.
11
Name of the NGO/ Depll. likely to
run the MLTC
(2)
Is this NGO/ Deptt.
running any other MLTC
in the State/UT?
Reasons for selecting this NGO/Deptt. to run u
the MLTC
=
aH
' (3)
(4)
I
--------------------------------------------------------------H
n
s
5
_________________________ !
!
11
1
s
9
8
1.
9
l
IV.
Training Calendar:
:
I Name of the
| Functionary
------ =q
TOTAl,
IIII
|
(6)
l
Number of Functionaries to be deputed for Training during
Apr-Jun 1999
(2)
(1)
Jul-Sep 1999
Oct-Dec 1999
Jan-Mar 2000
(3)
(4)
(5)
Job:
|| CDPO
Ref:
|
______ l
Total:
||
Job:
IaCDPO
Ref:
|
Total:
|
Job:
Supervisor
Ref:
1
1
______ 1
Total:
Job:
AWW
||
Ref:
Total:
1
____ 1
1
I
I
Orientation:
Helper
I
H
Ref:
Total:
-----
J!
|~ANNEXURir~- F
NORMS FOR JOB TRAINING COURSE FOR ANGANVVADI WORKERS
(3 months duration: 3 courses per year with 35 trainees per course per AWTC)
SI.
No.
Amount (Rs.
per annum)
Item
A.
Recurring
Fixed
1.
Honoraria of Staff
329,800
2.
Rent (/.verage)
[@ Rs. 6,000/- p.m. per AWTC in respect of ClassAl city; Rs.
5,000/- p.m.per AWTC in respect of Class A city; and Rs.4,000/p.m.per AWTC in respect of other cities/areas]:
60,COO
i
3,000
1.I)
II
S
3.
4
Electricity & Water Charges (Rs. 250/- per month)
.
ij
407,800
Total (Fixed Cost)
l|
II
B.
Variable /depending upon number of trainees)
5
Stipend to Trainees
Rs. 500/- p.m. to Matriculates & Rs. 438/- p.m. to Non
matriculates (assuming 90% matriculates and 10% non
matriculates)]
6.
Boarding to trainees ( Rs. 30 per day per trainee)
7.
Conveyance & Field Trips
(a)
TA/D.A to instructors
fellowship of trainees
(b)
Field Visits
155,826
for accompanying
8.
Training Material
9.
TA to trainees (Rs. 150/- per trainee)
1.
n
3.
283,500
trainees
&
12.000
20,000
3,000/-
15,750
Total (Variable):
490,076
Total (Recurring) per annum
897,876
Non-Raciirring
equipment & Furniture
Literature
liscellaneous
Total (Non-recurring)
60,000
15,000
10,000
85,000
GRAND TOTAL:
1;
i5,coo
Contingencies
___
___________ — : 982,876
—mu rx E3 — -xrxJ
zj
1
—-Ei-ui-m
K nn
wuBun
arrrarrr
annexujre -
0
.NORMS FOR REFRESHER TRAINING OF ANGANWADI WORKE1
(duration 15 days; No. of participants 40 per course)
Per Course
I SI.
No.
Item
1.
. Daily Allowance to AWWs to meet expenditure
on boarding (Rs. 30 per day per trainee)
18,000
2
■ TA to AWWs (Rs. 150/- per trainee)
6,000
3.
: Field visits
1,000
4.
Honorarium/TA to Guest Speakers
1,000
5.
Training Material (Rs. 50 per trainee)
2,000
6.
Contingency
Amount
(Rs.)
1
TOTAL:
■
500
_________ 28,500
[~ANNEXURE - f
NORMS FOR JOB TRAINING COURSE FOR ICDS SUPERVISORS
■ (Duration 80 days; No. of Participants 25 per course)
Per course
s.
Item
No.-
Amount
(Rs.)
1.
TA to trainees (Rs. 350 per trainee)
2.
Boarding and Lodging to trainees (Rs. 70 per
trainee)
1,40,000
3.
Honorarium to Guest Speakers (Rs. 200 per
session)
9,000
4.
TA to Guest Speakers (per course)
1,500
5.
Training Material (Rs. 150 per trainee)
3,750
6.
Field visit
15,000
7.
Contingencies
10,000
Total
1.88.000
8,750
ANNEXURE - V
NORMS FOR REFRESHER COURSE FOR SUPERVISORS
(Duration: 11 days; No. of participants: 25 trainees per course)
Per course
Item
SI.
No.
Amount (Rs.)
1.
TA tc trainees (Rs. 350 per trainee)
8,750/-
2.
Board and Lodging to trainees (Rs. 70 per day)
19,250/-
3.
Honorarium to Guest Speakers (Rs. 200 per session)
2,000/-
4.
Training Material (B.s. 150 per trainee)
3,750/-
5.
TA Ic Guest Speakers
1,500/-
6.
Conveyance including field visit
2,000/-
7.
Contingencies
2,000/-
TOTAL:
39.250
J
ANNEXURE -VI
NORMS FOR PROGRAMMES CONDUCTED IN MLTCS
Item
Amount
(Rs.)
Honoraria of Staff
415,100
Visit io AWTCs and ICDS
projects
10,000
3.
Newspaper, Magazine, etc.
for MLTCs (@ Rs. 250/p.m.)
3,000
4.
Electricity & Water.
scavenging etc.(@ Rs. 250
p.m.)
3,000
1.
Total:
431,100
_________________
28 of -11
ANNEXUIJE - VII
NORMS FOR JOS TRAINING COURSE FOR CDPOs/ACDPOs
(Duration 60 days; No. of Participants 25 per course)
Per course
s.
Item
Amount
(Rs.)
1.
TA/DA to trainees (Rs. 3,000 per trainee)
75,000
2.
Board ng and Lodging to trainees (Rs. 75 per
day per trainee for 46 days)
86,250
3.
Board ng and Lodging during field placement
(Rs. 100 per day per trainee for 16 days)
40,000
4.
Honorarium to Guest Speakers
5.
TA/DA to Guest Speakers (per course)
1,000
Field visit
15,000
7.
Training Material (Rs. 250 per trainee)
6,250
8.
Contingencies
No.
M■
r
1
Total
,
10,000
10,000
243,500
|
ANNEXURE NORMS FOR REFRESHER COURSE FOR CDPOs/ACDPOs
(Duration: 12 days; No. of participants: 25 trainees per course)
Per course
SI.
No.
11.
3.
1 4j 5.
1 6.
Item
Amount (Rs.)
TA/DA to trainees (Rs. 2,000 per trainee)
50.000
Board and Lodging to trainees (Rs. 75 per day)
22,500
Honorarium to Guest Speakers (Rs. 200 per session)
2,500
TA/DA to Guest Speakers
500
Field visits and local transport
2,000
Training Mater.al (Rs. 150 per trainee)
3,750
Contingencies
5,000
I7-
L==L TOTAL:
S6.2S0 _J
^ANNEX UIU
NOWS FOR ORIENTATION COURSE FOR HELPERS
(duralion 13 days; No. of participants 50 per course)
Per course
Item
SI.
No.
Amount
(Rs.)
1.
Boarding to Helpers (Rs. 30 per day per
trainee)
19,500
2‘
TA to trainees
7,500
3.
Honorarium/TA to Guest Speakers
4.
Training Material
5.
Praclicals/Field visits
500
6.
Contingency
500
TOTAL:
500
2,500
31,000
_______________
ANNEXURE
NORMS FOR REFRESHER COURSE FOR HELPERS
(duration 7 days; No. of participants 50 per course)
Per course
sr.
■
Item
Amount
(Rs.)
No.
1
Boarding to trainees (Rs. 30 per day
per trainee)
10,500
o
TA to trainees (Rs. 150 per trainee)
7,500
Honorarium/TA to Guest Speakers
250
4.
Training Material (Rs. 50 per trainee)
2,500
.5.
Practicals & Field visits
300
6.
Contingency
300
TOTAL:
!
21,351)
I
ANNEXUK.E - X
NORMS FOR ORIENTATION OF INSTRUCTORS OF AWTCs
(Dutation 22 days; No. of participants 15 per course)
Per course
Item
SI.
No.
Amount
. (Rs.)
1.
TA to trainees (Rs. .350 per trainee)
2.
Boarding and lodging to trainees
per trainee per day)
(Rs. 70
23,100
3.
Honorarium to Guest Speakers (Rs. 200 per
session)
2,000
4.
TA to guest speakers
1,500
5.
Training Material (Rs. 150 per trainee)
2,250
6.
Field Visits
3,500
7.
-ocal conveyance
2,000
S.
Contingencies
2,000
Total:
41,600
5,250
QnNEXUI^ XII ’I
NORMS FOR REFRESHER COURSE FOR INSTRUCTORS OF AWTCs
(Duration 8 days; No. of participants 15 per course)
___ Per course
Si.
No:
Item
A.mount
(Rs.)
1.
TA to trainees (Rs. 350 per trainee)
9
Boarding and lodging to trainees
per trainee per day)
(Rs. 70
8,400
3.
Honorarium to Guest Speakers (Rs. 200 per
session')
2,000
4.
TA to guest speakers
1,000
5.
Training Material (Rs. 100 per trainee)
1,500
6.
Field Visits & Conveyance
1,000
7
Contingencies
1,500
Total:
5,250
20,650
34 of? i
ANNEXURE - XU
NORMS FOR ORIENTATION COURSE FOR INSTRUCTORS OF MLTCs
(Duration 12 days; No. of participants 20 per course)
Per course
Item
SI.
No.
Amount
(Rs.)
1.
TA to trainees (including local conveyance
charges to local participants)(Rs. 2,000 per
trainee)
40,000
2.
TA to Guest Speakers
1,000
3.
Honorarium to Guest Speakers
2,000
4.
Boarding and lodging to trainees
per trainee per day)
5.
Local Conveyance
6.
Fjeld Visits
2,000
7.
Contingencies
3,000
Total:
67,000
(Rs. 75
18,000
'
1,000
NORMS FOR REFRESHER COURSE FOR INSTRUCTORS OF MLTCs
(Duration 8 days; No. of participants 20 per course)
Per course
SI.
No.
Amount
(Rs.)
Item
I.
TA to trainees (including local conveyance
charges to local participants)(Rs. 2.000 per
trainee)
40,000
2.
Boarding and lodging to trainees
per trainee per day)
12,000
3.
Honorarium to Guest Speakers
1,500
4.
TA to guest speakers
1,000
5.
Local Conveyance
1,000
6.
Field Visits
2,000
7.
Contingencies
3,000
Total:
60,500
(Rs. 75
[ANNEXUftE - XVj
Guidelines tor opening, continuing and closing down training centres
<i)
With the sanction of the new AWTCs/MLTCs, the total number of AWTCs/MLTCs in your
State will be
and
respectively. You are requested to intimate the location-wise
details and complete addresses of these AWTCs/MLTCs alongwith a clear map indicating their
locations.
(ii)
The existing locations of training centres in the State will be periodically reviewed, and
wherever necessary, AWTCs will be relocated wherever they are heavily clustered.
(iii)
The AWTCs/MLTCs will organise the training courses strictly in accordance with the training
curriculuir/syllabus and financial norms approved by the Government of India from time to
time. No deviation will be allowed without the prior approval of the Government of India.
(iv)
The State Government will be fully responsible for monitoring the training centres and for
sending progress reports (physical and financial) as stipulated from time to time. The State
Govemme.it w 11 develop a system for regularly monitoring/ inspecting the training centres and
will designate a nodal officer for this purpose. The nodal officer will also be responsible for
ensuring the deputation/reporting of trainees at the training centres so that the training facilities
are fully utilised.
I (l/)
The existing system of release of funds to State Governments and to ICCW for AWTCs run
by it, and to NIPCCD for MLTCs, will continue at present. .
(vi)
The MLTC(s) will approach NIPCCD for a formal agreement, release of grant-in-aid, supply
of training material and training of trainers. NIPCCD may also be approached for training of
instructors of AWTCs.
(vji)
The detail; of the training institutions may also be sent to UNICEF for supply of training
equipment.
' (viii)
I
All AWTCs/MLTCs are temporary in nature and will be continued on a year to year basis
depending upon the training needs and requirements of the State Government.
(ix)
The approval of the Government of India will be required for opening every AWTC and
MLTC.
fx)
States can relocate (change the location) of an AWTC, if required, if (a)
the organisation running it remains the same; or
9
(b)
\.<i)
the AWTC is proposed to be shifted trom an NGO to a Government institute/sector.
However, approval of Government of India will be required in all cases wheie
(a)
an AWTC run by a Government institute/sector is proposed to be shifted to an NGO,
(b)
or
is being shifted from one NGO to another.
ANNEXURE - X’1
No. 11-13/97-TR
Government of India
Ministry of Human Resource Development
Department of Women & Child Development
Jeevan Deep Building, First Floor
Sansad Marg, Nev; Delhi-110001
8th August 1997
The Secretaries dealing with ICDS Programme
All States/UTs
Sub:
Constitution of National/State ICDS Training Task Forces.
The Training component of the ICDS Programme has now been recognised as the mo"
important key to achieving the aims and objectives of the ICDS Programme. With the emphasis
now being on quality improvements and enrichment of the human resources available with the
mtimale aim of moulding die ICDS functionaries into agents of social and behavioural changes.
convincing communicators who can effectively bring about the attitudinal changes required,
.training, or human resource development or capacity building as it is otherwise known, assumes
tremendous significance. An in-depth assessment of the Training programme, it’s contents and
curriculum, the methodologies and the strategies has been carried out. One of the major points
which has emerged is the lack of coordination amongst all the players. This has led to a fairly
haphazard approach with lots of duplication and replication of efforts. I am directed to state that
it has, therefore, been decided that each State and Union Territory will constitute a State/UT ICDS
Training Task Force while a National. ICDS Training Task Force will be set up at the Government
of India level. The basic functions'of these Task Forces will be to integrate and coordinate all
aspects of ICDS Training at all levels and to recommend changes in the curriculum, strategies ".I
methodologies. The ultimate goal is to re-orient and re-vitalise ICDS Training to turn it intv a.
dynamic, responsive, human resource development programme, pulsating with innovations. All the |
recommendations of the Staie/UT Training Task Forces will be placed, before the National Training
Task Force and the Department of Women & Child Development, Government of India.
The composition of the National Training Task Force is as under:
til)
t.b)
•F)
fd)
le’i
<0
l.?)
(h)
■:d
j)
Joint Secretary (DWCD'i. Government of India
Additional Director, NIPCCD
Dr. B.N. Landon,. CTC
HOD Preschool Education, NCERT
Project Director, World Bank Unit, GO).
Deputy Secretary (CD), Government of India
Technical Advisor, FNB
Joint Director (Tig.), NIPCCD
Regional Director. NIPCCD. Lucknow
Regional Director, NIPCCD, Guwahati
Regional Director, NIPCCD, Bangalore
Chairperson
Member
Member
Member
Member
Member
Member
Member
Member
Member
Member
39 of dI
(xii)
After analysing the requirements of AWTCs, States can continue AWTCs. Intimation in
regard should be sent immediately to Government of India.
(xiiij
After analysing the requirements of AWTCs, States can close down AWTCs after giving .
reasonable notice period. Intimation in this regard should be sent immediately to Govern.
of India.
(>;iv)
The commitment of Government of India will be restricted to the financial norms appro
under the scheme or the actuals, whichever is less. The Government of India will have ■
liability on the staff engaged by the training centres under the ICD.S Training Program:.
except the honoraria provided under the scheme. The Government of India, will also haw :
liability in respect o:‘ service matters of such staff. This should be clarified to the staff wl>:
making their appointment.
(xv)
The other terms and conditions prescribed by the Government of India for release of gra
under Plar. schemes will also apply.
(wi)
The above conditions will also be made applicable to the existing AWTCs/MLTCs whi
communicating their continuation during the current year.
(1)
(in)
(n)
(o)
(P)
(••!)
(f)
(s)
(i)
Secretary-General, ICCW
State Directors dealing with ICDS (by rotation)
Project Officer (CD), UNICEF, New Delhi
Representative from CARE, Delhi
Representative from WFP, Delhi
Representative from MLTC (by rotation)
Representative from AWTC (by rotation)
Deputy Secretary (Trg.). D/WCD. GOI
Any other member which the Chairperson
may wish :o co-opt from time to time.
c.
...
Member
Member.
Member
Member
Member
Member
Member
Convener
The composition of the State Training Task Force will be as under:
Director ICDS
NIPCCD Regional Centre
Director
State Coordinator
CTC
Director, SCERT
Director Rural Development
Director Health
Director, Education
Project Manager, World Ban!; Unit
Government of India (where applicable)
State FNB representative (where applicable)
State Council for Child Welfare representative
)
(*
(b)
(c)
(cl)
(e)
(I)
(g)
(h)
(i)
(j)
Chairperson
Member
Member
Member
Member
Member
Member
Member
Member
Member
Representatives from
(k)
(1)
(m)
(n)
(o)
(P)
«1)
(>)
<«)
Member
MLTCs (by rotation)
Member
AWTCs (by rotation)
Member
UNICEF
Member
'
CARE (where applicable)
Member
WFP (where applicable)
Member
One good CE'PO (by rotation)
Member
One good Supervisor (by rotation)
Member
One good AWW (by rotation)
Convener
State Nodal Officer ICDS Training
Any other member lhe Director (ICDS) may like to co-opt.
4.
All State Governme.ats/UT Departments dealing with ICDS are requested to constitute the
Statc/UT Training Task Force and to send a copy of the Order to this Department. Detailed
uiforrnation on the functions etc. of the State Training Task Force will follow.
Sd/(RINA RAY)
Deputy Secretary to the Government of India
Copy to:
I.
All Members of the National ICDS Task Force.
All State Directors of ICDS Programme
■3.
5.
6.
7.
8.
9
10.
1 1.
12.
J3.
14.
J 5.
Dr. BN Tandon, Chairman, CTC, New Delhi
Professor Venita Kaul, HOD, Pre-Schocl Education, New Delhi.
Project Director, World Bank Unit, DWCD [Shri Gopal Krishna]
DS (CD) (Shri S.K. Bhargava]
TA, FNB, New Delhi [Sint. Shashi Prahha Gupta]
Director, NIPCCD [Shri D.P. Sethi]
Regional Directors of Regional Centres of NIPCCD at Lucknow, Guwahati and Bangalore.
President, ICCW, New Delhi [Smt. Habiba Habibulla]
Chief (CD & Nutrition Division), UNICEF, New Delhi.
CARE-India [Mr. Tom Alcedo, Country Director], E-28, Greater Kailash-I, New Delhi
WFP [Ms. Angela Van Rynbach, Country Director], 53, Jor Bagh, New Delhi
All MLTCs
All AWTCs
Sd/(R.S. Sharma)
Under Secretary to the Government di- India
;
I '•
.
i
!
No. 11-15/98-TR.I
Government of India
Ministry of Human Resource Development
Department of Women & Child Development
Jeevan Deep Building, First Floor
Sansad Marg, New Delhi-110001
19 May 1999
1.
2.
3.
State Secretaries, All State Governments/UT Administrations
Director, NIPCCD, New Delhi'
President, ICCW, New Delhi
Sub:
World Bank Assisted ICDS Training Programme - Project UDISHA - administrative
approval and guidelines for implementation - regarding
Sir/Madam,
The aim of ICDS Training is to develop all the functionaries of ICDS into agents of
social change. In order to develop the ICDS Training Programme into a dynamic, responsive,
comprehensive training-cum-human resource development programme which is flexible,
innovative and capable of achieving the objectives of the ICDS Scheme, the Department of
Women & Child Development undertook an in-depdi analysis and evaluation of die ICDS
Training Programme. As part of this evaluation, the Department organised a series of field
visits, workshops & seminars, and discussions with the State Governments, Programme
implementing agencies including NIPCCD and ICDS functionaries. Based on this evaluation,
the Department formulated the ICDS Training Programme - Project UDISHA which inter-alia
envisages the upward revision of financial norms, integration and coordination of training of
ICDS functionaries and revision of training syllabus. Keeping in' view the importance of die
programme and its likely impact on the quality of ICDS Scheme, the World Bank has also
agreed to provide financial assistance for implementation of a larger programme of ICDS
Training during a period of five years. This national training component will be part of the
overall World Bank Assisted. Women & Child Development project which will be called: ICDS
Training Programme - Project UDISHA. The existing UNICEF financial and technical
collaboration for the Piogramme will also continue.
2.
A series of meetings were organised with the State Governments, NIPCCD, other
implementing agencies, the World Bank and the UNICEF for the finalisation of the Project
Implementation Plan (PIP) of ICDS Training Programme - Project UDISHA. Based on the
information and the proposals received from the State Governments/Union Territories and
NIPCCD, the Department has come out with the final document of Project Implementation Plan
(PIP) which will be the basis for implementation of Project UDISHA. The PIP has been
formulated keeping in view the expansion of ICDS Scheme in the coming years. The PIP is a
working document and will be subject to further review/changes based on the annual State
Training Action Plans and physical and financial performance reported under the Project. A
copy of die final PIP will be sent separately for implementation of the Project UDISHA.
3.
It may be clarified that finalisation of the PIP does not construe approval of th
Government of India for implementation of Project UDISHA. The State Governments will hav
to formulate their Annual Plans in accordance with the instructions contained in this letter ant
submit die same to this Department for formal approval. The Department will fix a time
schedule for submission of Annual Plans and approval of the same by the Government of India.
However to begin with, the State Governments/Union Territories are requested to send their
Annual Plar for 1999-20C0 to this Department latest by 30 May 1999. This date may kindly
be strictly adhered to so as to avoid any delay.
4.
The ICDS Training Programme is a continuing Programme which is being implemented
through the State Governments/Union Territories, NIPCCD and certain programme
implementing agencies. Project UDISHA will cover all the existing and new Projects under
General ICDS,- ICDS-III, and Andhra Pradesh Economic Reconstruction (APER). Projects
sanctioned under ICDS-II will not be covered for the duration of that Project but would be
covered for the remaining period after closure of ICDS-II. Additional functionaries sanctioned
by Government of Tamil Nadu under the erstwhile TINP will not be covered.
5.
The existing strategies for training of ICDS functionaries have been reviewed in
consultation with the State Governments/Union Territories and NIPCCD. Keeping in view the
specific requirement of various States/UTs, an element of flexibility in the matter of training
has been introduced which has been discussed in the following paragraphs.
6.
The Government of India has approved the revision of financial norms under ICDS
Training Programme - Project UDISHA. I am, therefore, directed to convey the administrative
approval of the Government of India for implementation of the ICDS Training Programme Project UDISHA with effect from 1.4.99 for a period of five years as per details given below.
A.
TRAINING OF ICDS FUNCTIONARIES
7.
Training of Anganwadi Workers: Provision has been made for training of Anganwadi
Workers in Job Training and Refresher Training for which various options have been given tc
ihe State Gc vemments/Union Territories as under.
(1)
Job Training of Anganwadi Workers: Different options have been given for organising
job training courses for AWWs. The State Governments/Union Territories will be free
to adopt one or more options, depending upon their requirements and local conditions.
Following options are available for conducting job training of AWWs:
c
(i)
Institution based job training at the AWTCs for a period of three months in one
phase.
(ii)
Under the Sandwich pattern of job training, the State Governments/Union
Territories will have three options, as under:
Option 1:
Phase-I and Phase-Ill at the AWTCs
Phase-II in the field
Option 2:
Phase-I at the AWTC and Phase-Ill through training teams
(mobile/district/block training teams)
Phase-II in the field
Option 3:
Phase-I and Phase-Ill through training teams (mobile/district/blocl
training teams) and Phase-II in the field
Duration of various phases under Sandwich pattern will be as under:
Fhase-1
Phase-II
Phase-UI
Two months
Four months
One month
The existing duration of 3 months job training course for Anganwadi Workers
will continue until the duration of training is reviewed and a revised
syllabus/curriculum is devised under Project UDISHA.
(2)
Under Project UDISHA, additional AWTCs have been sanctioned to the State
Governments/Union Territories depending upon their training needs during the next five
years. Provision also exists for sanctioning additional AWTCs which will be considered
on the basis of requests received from the State Governments/Union Territories in the
prescribed proforma
(enclosed at Annexure-I).
Before that,
the State
Governments/Union Territories will be required to review the status of existing AWTCs
including their re-location, mapping and utilisation of the training facilities already
available. While doing so, it will also be specifically examined whether the surplus
facilities, if any, available with the State-run institutions like ATIs, SIRDs, DIETs, etc.
have been taken into account. The question of sanctioning of additional AWTCs will also
be linked with the oction(s) adopted by a State Governnient/Union Territory for
conducting job training courses. This will have to be communicated to this Department
while approaching for sanction of additional AWTCs.
(3)
The personnel component of tire AWTCs and the qualifications prescribed for instructors
will be the same as already provided under ICDS Training Programme. Under the
revisedJinaricial norms for AWTCs, additional funds have been provided for honorarium
of staff which includes provision for guest speakers/visiting faculty. This also includes
provision for a visiting Doctor and engagement of Craft Teacher, Music Teacher, Cook.
Sweeper, etc, on part^tjme basis. This is only a suggested list, th^AWTCs will havejo.
provide the staff according to their work requirements.subject to financial limit. The
rates of honorarium for staff of AWTCs have been revised as under:
S.No
Name of the post
For AWTCs:
Principal
Instructors
J.
Accounts Clerk
4.
Peon/Chowkidar
5_ Warden
1.
7
No. of
posts
1
2
1
2
1
Graded Honoraria (Rs. per month)
On initial
appoint
ment
On completion
of 5 yrs of
service
On completion
of 10 yrs of
service
4400
3600
2540
2050
750
5970
4789
3301
2274
750 .
7544 '
5980
4065
2500
750
S5 n===3 SISr=J ===.
Note: The increase in honoraria on completion of fivc/tcn year period will be on the basis of
performance.
(4)
As regards staff to be engaged on part-time basis by AWTCs, the rate o ' ho
a Craft Teacher, a Music Teacher and a Cook should not exceed Rs. 500 pc
for a Sweeper it will be not exceeding Rs. 300 per month. A provision h;
mace for a Visiting Doctor for which an amount of upto Rs. 500/- per nn
paic..
————
..—
_—.
(5)
Tra nine' Teams: The suggested composition of the Training Teams in lieu o'
will be as under:
•
•
One AWTC trainer, who will be the link person between the Training Te
trainee batch and will also ensure continuity of the training activity
training team.
One from DIET/Education Block Resource Group, Cluster Resource C
ECE);
MO/DIO (Immunisation Officer)/One from Health;
CDPO/ACDPO/Supervisor/Dy. CEO/DPO (District Programme Of
ICDS);
F&N Board/NGO/Mahila Samakhya/WDP/DWCRA etc.
DPEP Gender Trainers: and
H
•
Any other as per requirement.
•
•
.•
•
The overall responsibility for organisation, management, logistics, supervis;
monitoring will be that of the District Programme Officer, ICDS.
The suggested venue for training through training teams will be at any of the fol.
centres:
•
•
•
•
•
•
•
The ANM Centre;
The Rural Training Institute;
The B Ed Pre-Primary Training Institute;
DIET;
The DPEP-BIock Resource Centre Building; and
The Panchayat Building at District level
Any other as per requirement.
i
(6)
Refresher training of AWWs: Under the existing arrangement, the Anganwadi Wot’
is required to undergo refresher training after completion of two years of service. It
been noticed that refresher training has not been given to the AWWs in most of
States and there is no regular arrangement for this purpose. Refresher training is
important to keep the Anganwadi Workers update with the latest dcvelopnien
instructions in the area of child and mother care, etc. It has, therefore, been decided d
under Project UDISHA refresher training to AWWs will be given after every lyears at AWTCs or through training teams (mobile/district/block training teams). I
States/Union Territories will also have the option to organise refresher training
AWWs once every year by suitably reducing the existing period of tiaining, and also
reducing the cost of tiaining proportionately so that the cost of refresher training
course after a period of two years as per the existing provision is not exceeded.
(7)
Finmcial norms: The financial norms for conducting job training courses and reli
trai ling courses have been revised with effect from 1 April 1999. The details r
revised financial norms are given in Annexure II and III. As there are different options
for conducting training courses for AWWs, the allocation of funds to the AWTCs and
the State Governments where training teams arc involved in conducting the training will
be as under:
(a)
For conducting 3 months job training of AWWs at AWTCs under the traditional
method and for conducting sandwich training under option 1 (i.e. Phase-I and III
at the AWTCs and Phase-II in the field), each AWTC will be required to conduct
3 job training courses every year (in addition to refresher training of AWWs and
Orientation and Refresher training of Helpers) for which an amount of Rs.
897,876/- per annum will be made available as per details given in Annexure-II.
(b)
LTder option 2 of sandwich training programme for job training of AWWs
(Phase-I at AWTC, Phase-II in the field and Phase-Ill by training teams), the
AWTCs will be required to conduct 6 job training courses (Phase I and II) during
a year and the distribution of grant per job training course between the AWTC
and the .State Government will be in the ratio of 60:40 as under:
For Phase I & II
For Phase-III
;
:
Rs. 1.80 lakhs
Rs. 1.19 lakhs
On the basis of distribution of grant, each AWTC conducting 6 job training
courses (Phase I and II) during a year will, thus, be entitled to Rs. 10.80 lakhs.
The AWTC will be required to incur the expenditure in accordance with the
norms fi'ted for various items of expenditure including payment of honorarium.
The State Governments/Union Territories will also ensure that the funds
earmarked/allocated for conducting training courses by the AWTCs are released
to them as per the approved financial norms and under no circumstances grant
less than the approved norms will be released to the AWTCs. This will, of
course, be subject to actuals, whichever is less.
(c)
Under option 3 which provides for job training of AWWs through training teams,
the State Govcrnment/Union Territories will be entitled to claim an amount of
Rs. 2.99 lakhs per course. The quantum of grant payable to the State
Goverrurents/Union Territories for conducting job training courses for AWWs
will be worked out on the basis of Rs. 2.99 lakhs per course.
(d)
The salient features of the revised financial norms for conducting job training of .
AWWs are as under:
D
The number of trainees will be 35 with respect of AnganWadi Workers
Job Training for better interaction between trainee and trailer;
□
Enhanced rate of honorarium for full-time staff of AWTCs with
provision of increase after completion of 5 rind 10 years of service;
°
Provision of funds for engaging staff on part-time basis. They will be
paid honorarium from within the overall financial ceiling approved fbr
payment of "Honoraria of Staff"
5 of -I I
Enhanced rate of TA and boarding & lodging to AWWs (AnncxureII).
Rate cf stipend to AWWs during training period raised to the level of
honorarium payable to AWWs under ICDS Scheme The increase in rate
of stipend will be automatic with the increase in the rate of honorarium
under [CDS Scheme.
o
Provision for Electricity & Water charges.
a
Each AWW will be paid incentive equivalent to one month’s
honorarium on satisfactory completion of training.
Provision of rent for hiring of buildings for AWTCs revised depending
upon the classification of the city/area where the Centre is located as
indicated below:
For Class Al cities
:
Rs. 6,000/- per month
For Class A cities
:
Rs. 5,000/- per month
Ocher cities/areas
:
Rs. 4,000/- per month
(This is subject to actual rent, whichever is less)
(8)
Funds for conducting training courses for AWWs under Project UDISHA will
henceforth be released only to the State Governments/Union Territories which, in
turn, wif release the grant to the AWTCs depending upon the training targets and
financial .norms. The State Governments/Union Territories w.11 develop a mechanism for
release of funds to the training centres for conducting training courses for AWWs. It will
be ensured that adequate funds are made available to the AWTCs for conducting training
programmes and under no circumstances training will be allowed to suffer for want of
funds.
(9)
The funds in respect of AWTCs run by ICCW through State Councils for Child
Welfare will be released through State Governments/Union Territories where the
AWTCs are located. If required, the State Governments/Union Territories will finalise
the procedure for release of grant to AWTCs run by State Councils in consultation with
the State Councils/ICCW, New Delhi. However, the ICCW, New Delhi will continue
to get grant directly for the staff employed for monitoring and implementation of the
Anganwadi training programme. The revised rates of honorarium approved for the staff
sanctioned to ICCW, New Delhi under ICDS Training Programme will.be as under:
6 of 41
such as Distance Education Programme. The States/Union Territories will also have the
option to organise refresher training for Supervisors once every year by suitably
reducing the existing period of training, and also by reducing the cost of training
proportionately so that the cost of refresher training per course after a period of two
years as per the existing provision is not exceeded.
The financial norms for conducting job training and refresher training of Supervisors
have: been revised with effect from 1 April 1999. The details of the revised financial
norms for job training, refresher training and other components at MLTCs are given in
Annexures-rV, V and VI. The details of the staff and their honorarium are given below:
(4)
S.No.
Name of the post
«•*
1.
7
3.
4.
5
Coordinator
Instiuctor
*
Assistant Accountant
Typist-cum-Clerk
Peoiv'Chowkidar
No. of
posts
1
3
1
1
2
Graded Honoraria (Rs. per month)
On initial
appoint
ment
On
completion
of 5 yrs of
service
On
completion
of 10 yrs of
service
1000
4400
3120
2540
2050
1000
5970
4246
3301
2274
1000
7544
5365
4065
2500
Special Pay of Rs. 500/- per month to one Instructor to act as Principal of the MLTC.
Note: The increase in honoraria cn completion of five/ten year period will be on the
basis of performance.
(5)
The staff component of the MLTCs and educational qualifications prescribed for
Instructors will be the same as already provided under ICDS Training Programme.
Under the revised financial norms for MLTCs, additional funds have been provided .or
honcrarium of staff which includes provision for guest speakers/visiting faculty. This
also includes provision for a Warden, a visiting Doctor and to engage a Craft Teacher,
a Music Teacher, a Cook, a Sweeper, etc. on part-time basis. This is only a suggested
list, the MLTCs will have to provide the staff according to their work requirements
subject to financial limits. As regards staff to be engaged on part-time basis by MLTCs,
the rate of honorarium for the Warden will be Rs. 750/- per month, for a Craft Teacher,
a Music Teacher and a Cook it should not exceed Rs. 500 per month and for a Sweeper
it will be not exceeding Rs. 300 per month. A provision has also been made for a
Visiting Doctor for which an amount of upto Rs. 500/- per month can be paid.
(6)
Funds for conducting training courses for Supervisors under Project UDISHA will
henceforth be released only to the State Governments/Union Territories which, in
turn, will release the grant to the MLTCs depending upon the training targets and
financial norms. The State Governments/Union Territories will develop a mechanism for
release of funds to the training centres for conducting training courses for Supervisors.
It will be ensured that adequate funds arc made available to the MLTCs for conducting
training programmes and under no circumstances training will be allowed to suffer for
want of funds.
S.No.
Name of the post
No. of
posts
Graded Honoraria (Rs. per month)
On initial
appoint
ment
On
completion
of 5 yrs of
service
On
completion
of 10 yrs of
service
1
3
1
1
1
7780
5250
4400
2540
3120
9750
7103
5970
3301
4246
11720
8960
75444065
5365
11
11
4400
2540
5970
3301
Headquarter
1.
2.
3.
4.
5.
Sr. Programme Officer
Programme Officer
jSen. or Accountant
Typist
Steno-typist
Field
6.
* 7.
Field Officers
Typists
7544
1
4G65
Note: The increase in honoraria on completion of five/ten year period will be on the basis of
performance.
8.
Training of Supervisors: Under the existing system, 80 days job training course for
Supervisors is conducted at Middle Level Training Centres (MLTCs) for which grant was
released to the MLTCs through the National Institute of Public Cooperation & Child
Development (NIPCCD). The Regional Centres of NIPCCD were also conducting job training
of Supervisors. Under Project UDISHA, following modifications have been provided for
conducting training of Supervisors:
(1)
The State Gove.mmcnts/Union Territories have the option to conduct training of
Superv.sors through MLTCs which can also be established at the State-run Institution^
such as ATIs, SIRDs, etc. This will be subject to the condition that the duration
syllabus of training and qualifications of staff as prescribed by the Government of India
will be followed and State Govemments/Union Territories will be required to follow this
option in consultation with NIPCCD.
(2)
Additional MLTCs have already been sanctioned to the State Governments for
conducting job ..training and refresher training of Supervisors. There is a provision to
sanction more MLTCs depending upon the training needs of the State
Govemments/Union Territories. Under Project UDISHA, there is also a provision to
utilise one of the MLTCs as State Resource Unit for which separate instructions have
been provided in this letter.
(3)
Refresher training of Supervisors: Under the existing arrangement, refresher training of
Supervisois is required to be conducted after completion of two year's of service. There
is a need to organise regular refresher training of Supervisors to keep the abreast with
the new developments in the area of child and mother care. It has, therefore, been
decided that under Project UDISHA, refresher training of Supervisors will be conducted
after even' two years which will be institution based or through decentralised programme
9.
Traininc of CDPOs/ACDPOs: (1) At present, the training of CDPO.s and ACDPOs
being conducted only by NIPCCD on the basis of officers deputed by the Sta
Governments/Union Territories at NIPCCD Headquarters and Regional Centres. The preset
arrangement will continue under Project UDISHA. However, it the training requirement is not
met by NIPCCD and its regional offices, then the State Govemments/Union Territories can have
the option :o organise training at State Institutes like ATIs etc. A specific proposal need to be
sent to Government of India for its approval for this purpose.
(2)
Financial nonns for conducting job and refresher training courses of CDPOs/ACDPOs
have been revised with effect from 1 April 1999. Item-wise break up of the revised financial
norms for Job and Refresher training courses are given in Annexures-Vll and VIII
respectively.
(3)
Funds for organisation of training of CDPOs/ACDPOs will be available to NIPCCD. In
case the Government of India approves organisation of this training in other institutes then the
funds will be allocated to State Governments.
10
Training of Helpers: (1) At present, the orientation and refresher training of Helpers is
being conducted through AWTCs. It is recommended that the State Governments should
organise training of Helpers through Training Teams or at local/Government-run institutes. This
will ensure training of Helpers in their local language and will also help to clear the backlog of
training much faster. However, the State Governments will also have the option to conduct the
training of Helpers al tire AWTCs.
(2)
The financial norms for Orientation and Refresher.training of Helpers have been revised
as per details given in Anne.xures-LX and X. The funds for conducting training of Helpers will
be released to the State Govemments/Union Territories who will incur the expenditure in
accordance with the approved norms. In case training is organised at the AWTCs, the funds will
be released to the AWTCs by the State Governments/UTs as per the approved norms and it will
be ensured that adequate and timely funds are made available to the AWTCs.
11.
Join: Training with health : A provision of Rs. 1.5 crore per annum for Joint training
of ICDS functionaries with the medical and para medical staff such as Medical Officers, Local
Health Woikers, ANiVIs, Dais, has been provided. The Joint Training may be conducted by
State Governments or CTC-IMCD. Detailed proposals will be sought on this.
B.
TRAINING OF TRAINERS
12.
The.training of trainers for instructors of AWTCs/MLTCs and other institutions to be
involved by the State Governments for training of the ICDS functionaries, will be organised
only by NIPCCD and its Regional Centres. The State Governments/Union Territories will have
to ensure a proper liaison with NIPCCD in this regard. The Government of India will also have
an option to involve other institutions like the Lal Bahadur Shaslri National Academy of
Administration, Mussoorie, for organising training courses for the training staff, NIPCCD
faculty and oilier functionaries. Financial norms for training of trainers (instructors of
zkWTCs/MLTCs) through NIPCCD arc given in Annc.xurcs-XI to XIV. As regards training of
faculty of MPCCD, etc. through other institutions, grant will be released on case to case basis
depending upon the level of officers to be trained.
OTHER TRAINING PROGRAMMES
c.
13.
The oiher training programmes will cover the areas/functionaries, such as Sarpanch
Panchayat Members, Pre-School Teachers, VLWs, etc., which are not covered by the training
programmes mentioned above. This training component will cover an innovative training
programme relevant to the objectives of ICDS Scheme and may cover other Government and
Non-Government functionaries who contribute to the ICDS Scheme. No specific financial, norms
have been fixed for conducting innovative training programmes and all the State
. Govemments/Union Territories will be required to formulate proposals with detailed financial
requirements in their Annual Plans for approval of the Government of India.
UPGRADATION OF TRAINING FACILITIES
D.
14.
The Project UD1SHA has also a provision for upgradation of the braining facilities at the
existing AWTCs (except those sanctioned during 1998-99, for which a separate provision has
been made under the revised financial norms). Provision has also been made for upgrading the
facilities at MLTCs. It is also been decided to give additional MLTC Io the States (excep 1^
States covered under ICDS-1I, III and ICDS-APER) which will function as State Resour^
Units (SRUs) for monkoring of Project UD1SHA. The financial norms for State Resource Units
will-be the same as that of a regular MLTC. The State Resource Unit will function within the
Directorate of ICDS and the provision of staff under SRU will be proposed by the State
Government keeping in view the staff already available in the State Directorate and the World
Bank requirements on monitoring, reimbursement and other financial aspects under ICDS
Training Programme. These staff will be purely temporary in nature to be engaged on short
term contract basis for the project duration on the lines of staff employed in MLTCs. Following
provisions have been made for upgradation of training facilities:
(a)
An amount of Rs. 1,10,000/- will be given to each SRU as one time grant for
creation of basic facilities like purchase of computer, etc. The State Government
will furnish the details of the staff and the items to be purchased for each SRU
in their Annual Plan for approval of the Government of India.
(b)
Each MLTC will get a lumpsum grant of Rs. 50,000/- for upgradation, I
replenishment and creation of basic facilities. Items to be procured will be
decided in consultation with the State Government.
(c)
Each existing AVVTC, i.e. those which have been set up prior to 1.4.1998,
will get a lumpsum grant of Rs. 50,000/- for upgradation, replenishment and
creation of basic facilities. Items to be procured will be decided in consultation
with the State Government.
(d)
A total provision of Rs. 13.94 crores has been made under Project UDJSHA for
NIPCCD for upgradation/capacity building in training facilities/collaboration and
creation of new facilities. NIPCCD will include specific proposals in their
Annual Plan for this purpose.
E.
DEVELOPMENT, PRINTING, DISTRIBUTION OF TRAINING MATERIALS
AND SUPPLY OF KITS ETC. ON EARLY LEARNING AND IEC MATERIAL
15.
Under Project UDISHA. provision has also been made for release of grant-in-aid to the
State Government for development, printing, distribution of all training and IEC materials and
provision of kits for Anganwadi Workers on Early Learning, in consultation with NIPCCD. The
training materials etc. is required to be developed in regional languages/local dialects. The State
Government will include specific proposals in this regard in their Annual Plan to be submitted
to tire Government of India for approval.
F.
WORKSHOPS ETC. AND TRAINING IN INDIA & ABROAD
16.
Under Project UE’ISHA, provision has also been included for organisation of workshops,
inteiactive and convergent meets, seminars, training courses both in India and abroad. The
e?:penditure or.’training abroad will be incurred by Government of India only. As regards
Workshops, etc. State Governments and NIPCCD will also be eligible for grant for which
specific proposals will be included in the Annual Plans.
G.
CONTINGENCIES AND 0'1 HER ACTIVITIES
17.
Provision has also been made for Operations Research and Evaluation Studies, MIS on
training for which funds will be available to NIPCCD as well as to State Governments.
H.
13.
PROCEDURE FOR RELEASE
. REIMBURSEMENT CLAIMS
OF
FUNDS
AND
SUBMISSION
OF
(a)
Funds under Project UDISHA will be released to the State Governments/Umon
Territorieit/NIPCCD/CTC-IMCD in three instalments based on the Annual Plan
approved by the Government of India, physical and financial progress reported
by the State Governments, etc. A lumpsum amount has been released to tire State
Governments, during 1998-99 which will be adjusted on the basis of actual
claims received from the State Governments.
(b)
The Project UDISHA is being taken up with World Bank assistance. The terms
and cond lions for World Batik assistance provide for certain procedures for
submission of claims for seeking reimbursement from the World Bank. These
procedures are required to be followed strictly to get timely and full
reimbursement of the expenditure incurred under the Project from die World
Bank. For the sake of uniformity, smooth functioning of the Project UDISHA
and also for ensuring that World Bank reimbursement procedures are being
followed, it has been decided that funds under ICDS Training Programme for
running’ AWTCs/MLTCs and other training programmes will henceforth be
released through State Goveriunents/Union Territories. This will also be
applicable in the case of training centres being rim by the Indian Council for
Child Welfare, New Delhi. Training funds for other components like training
material and training kits, etc. will also be released to the State Governments. As
regards, training courses for trainers and for CDPOs/ACDPOs, etc. to be
organised by NIPCCD, funds will be released to NIPCCD directly. As regards
joint training for medical and para medical staff to be organised by CTC-IMCD,
the fund.; will be released to CTC-IMCD. Funds in respect of the posts
11 of 41
sanctioned to ICCW Headquarters and Field Offices for monitoring of training
programmes will be given to ICCW directly.
(c)
The State Governments/Union Territories, NIPCCD, CTC-IMCD, etc. will be
required to submit reimbursement claims in respect of the expenditure incurred
under Project UDISHA in accordance with the approved norms/pattern in die
prescribed proformae. Copies of these proformae applicable for seeking
reimbursement will be sent to all concerned separately.
(d)
It may be emphasised that timely incurring of expenditure and submission of
reimbursement claims in accordance with the prescribed norms will be very vital
for successful implementation of the Project UDISHA and seeking required grant
from the Government of India. In order to train the staff for monitoring.
preparation of reimbursement claims and maintenance of accounls under Project
UDISHA. the Government of India will organise training courses for various
levels of officers and staff through NIPCCD. It is requested that the staff to be
engaged for this purpose should be identified on priority basis.
g
I.
PROCUREMENT PROCEDURE
19.
(a)
The Project UDISHA piovides for purchase of equipment, materials.
development and printing of training materials/kits. etc. The World Bank has
prescribed certain procedures for making procurement under the World Bank
assisted projects. These procedures are different from Government procedures
and are required to be strictly followed. It has been decided that during the initial
stages of procurement by State Governments/Union Territories will be limited to
the upgradating/creating facilities in the State Resource Units, MLTCs and
AWTCs. Since each procurement plan has to be approved by the World Bank,
the 5 ICDS-I1I States (namely Uttar Pradesh, Rajasthan, Maharashtra, Kerala and
Tamil Nadu) and ICDS-APER States and ICDS-II States of Andhra Pradesh,
Bihar and Madhya Pradesh are requested to prepare their plan for procure,. nt
in respect of training component and submit the same to Government of India for
approval of the World Bank.
(b)
As regards other States/Union Territories, the Government will prepare a Central
Procurement Plan for these Statcs/UTs for the first year of the Project on the
basis of proposals from State Governments/Union Territories.
(c)
In order to train the State Governmcnt/UT staff in die World Bank procurement
procedure, the Government of India plans to organise training. courses drrough
NIPCCD. The State Governments/Union Territories are requested to please
ensure that the staff to be engaged for procurement under Project UDISHA are
identified on priority basis.
(d)
This will be done only after World Bank and Government of India finalise the
Procurement Plan in consultation with Statcs/UTs.
OTHER GUIDELINES FOR PROJECT UDISHA
J
19.
The State Governments/Union Territories are requested to kindly to review the existing
status of ICDS Training Programme in their respective States/UTs and finalise their Action Plan
for implementation of the ICDS Training Programme - Project UDISHA keeping in view the
above mentioned .financial norms and the information already submitted by them to this
Department in connection with the finalisation of the Project Implementation Plan (PIP). While
implementing the Project UDISHA, following instructions/guidelines may also be kept in mind:
(a)
The State Governments/Union Territories will also prepare Annual Training
Calendar (training centre-wise) for achieving the targets. This will be included
in the Annual Plan to be sent to this Department. The review of performance of
each State/UT will be done with reference to the training calendar.
(b)
As Project UDISHA provides for release of grant to the State
Governments/Union Territories for conducting various programmes and
activities, it is requested that necessary formalities for receiving Central Grant.
under ICDS Training Programme - Project UDISHA and for disbursement of the.
same to the implementing agencies may kindly be finalised so that there is no
problem to utilise the Government grant as and when released.
(c)
The Project UDISHA is being taken up with World Bank assistance. All
procedures relating to disbursement, submission of financial claims, procurement
cf stores, etc. will be applicable and will have to be followed strictly.
(d)
The Sta te Governments/Union Territories are requested to immediately send
the Letter of Undertaking duly signed by the competent authority of the
State/UT for which necessary instructions have already been given by this
Department. This action is immediately requested so as to start Implementation
cf Project UDISHA and release of grant.
(e)
The Government of India has already sanctioned additional AWTCs/MLTCs to
the State Governments. A copy of the guidelines/instructions issued for review
of the existing AWTCs/MLTCs and establishment of new AWTCs/MLTCs is at
Annexu.re-XV. It is requested that action in this regard may be taken on priority
basis. Il may also be ensured that these AWTCs/MLTCs start functioning at the
earliest.
(f)
State Governments/UTs will examine the possibility of starting a Anganwadi
Centre at each AWTC/MLTC under ICDS Scheme. Alternatively, the
AWTC/MLTC should adopt a neighbouring Anganwadi Centre for developing
such Atiganwadi Centres as model Anganwadis.
(g)
Each State Govcrnmcnt/Union Territory will appoint a Nodal Officer who will
he ovetall responsible for sending reports to this Department, deputation of
trainees to the training centres and also cnsuiing that the trainees actually report
at the training centres, release of timely and sufficient funds to the training
centres, submission of reimbursement claims, etc. to this Department.
(h)
Ths State Governments/UTs will also be required to develop a system for
physical inspection of training centres so that their performance is reviewed from
time to time Reports of these inspections should be sent to NIPCCD Regional
Centres for sending a consolidated report for each region to this Department.
(i)
NIPCCD will designate a nodal officer for each State/UT for monitoring and
inspection of their training activities. Similarly. ICCW which will continue to get
grant for Headquarters and Field Staff will also be responsible for monitoring and
inspection of AWTCs being run by State Child Welfare Councils and sending
reports to the Government of India.
G)
There are reports that Anganwadi Workers are sent for training in other areas
very frequently due to which they remain away from their duties for long
periods. It may please be ensured that the Anganwadi Workers are not sent for
training programmes other than those prescribed under ICDS Training
Programme - Project UDISHA. In any case and under no circumstance shorn.1
the ICDS functionaries be sent for training to other programmes without prior
approval of this Department. NIPCCD will develop and circulate a suitable
proforma for monitoring the training activities.
(k)
The monitoring of Project UDISHA is a very important component for its
success. The Government of India has already given instructions to the State
Governments for constitution of State Training Task Forces for regular
monitoring and evaluation of the ICDS Training Programme in each State/UT.
A copy of tie constitution of State Training Task Forces is at Annexure-XVI.
It is requested that the meetings of the State Training Task Forces (STTF.) should
be organised on a regular basis and their reports should be sent to this
Department It is also requested that Annual Plans to be formulated by the State
Governments/UTs should be got approved by the STTF before sending the same
to this Depa.rtment.
Kindly acknowledge receipt of this letter.
Yours faithfully,
(Gopal Krishna)
Director
Tele: 011-33S5192/FAX: 011-3381800
E-mail <pratnaparkhi@hotmail.com >
'py for information to:
Director (ICDS) al Siates/UTs
Secretaries, Finance Departments, All Statcs/UTs
Additional Director (TC). NIPCCD, New Delhi
PI’S to Secretary (WCD)/PS to JS (CD)
Director (CD)/US (CD)/PM (World Bank)-2
Suggested draft datedOctober 5, 2000
NUTRITION WORKSHOP:
PREPARATION FOR THE NEW HNP PROJECT OF THE GOVT, OF KARNATAKA
MORNING SESSION: CHAIR Dr. Devaki Jain
9.00
WELCOME
Mr. Abijit Sengupta, IAS, Principal Secretary, Health
Objectives of the Workshop
9.10
INAUGURAL ADDRESS Ms. Meera Saxena, IAS, Secretary, WCD
The Karnataka Action Plan for the Child
9.25
Dr. Farah Saiyed, UNICEF Hydeabad
KEY NOTE ADDRESS
The Functional Significance of Nutrition
9.40
WOMEN’S HEALTH
Dr. Thelma Narayan, Member Task Force on Health
The situation of women and potential for change
9.55
PRE-SCHOOL CHILDREN Dr Sabu George, Community Health Cell
Progress over 30 years and challenges ahead.
10.10
SCHOOL AGED
15
Mr. Vijay Bhaskar, IAS , Commissioner of Public Instruction
New Initiatives in improving Health Status of school children
10.25
CARE
X:
Care for Improved Nutrition
10.40
Tea
11.00-12.25
GROUP DISCUSSION
12.25-1.00
1 Strengthening ICDS Functioning: Chair Ms Vidyawathi, IAS,
Director, WCD.
UAiet CelicJUA
2. Reaching out to school Dropouts: Chair Mr. Antony L, IAS,
Director, DPEP.
3. Working with Panchayats, Chair, Dr. Sudarshan, Chairma Task
Force
Presentation of Group Discussions
1.00-2.00
LUNCH
CHAIR:
Mr. Sanjay Kaul, IAS, Commisioner of H&FW
2.00-2.15
Health
Dr. Nagaraj, Director-In Charge, Dept Of H&FW
Role of the Health System in Improving Nutrition
2.15-2.30
Dr. Devaki Jain, S. S. Foundation
Panchayats
2.30-2.45
NGOs
2.45-3.00
Collective Action
Sensitising Panchayat System and Improving
<
• Nutriti
onal
Outco
mes
Dr. Sudarshan, Chairman Task Force on Health
The Importance of NGOs in improving survival and well-being of Children
v’
Ms Revathix Head, Mahila Samakya
Improving Women’s Health Status thru Empowerment
3.15-3 30
Micro-Credit
Ms. Vidyavathi, Director ICDS
Harnessing Stree Shakti for Raisining Community Awareness on
Nutrition
3 30-3 45
TEA
3 45-4.15
GENERAL DISCUSSION
4.15-5.00
FINALISING RECOMMENDATIONS
Chairpersons: Mr. Sanjay Kaul Ms Vidyavathi & Thelma Narayan
J
kJ
/’\
Suggested list of participants; Want as many women as possible
Total Participants=not >40
CHC
TN, SG, RN, SK, CMF=5 + (Prahalad or Chunder) & Joseph
WCD
Secretary, Director, JD (Kanti) + 3 more women from Blore=6
ICDS
4 CDPOs (3 women + 1 men); 2 AWW, 2 Supervisors =8
Health
PS, Commissioner, Director + 2 other Directors=5
Others)
5
_
"T
r-2 -
Also want
FNB=1
NIPCCD=1
Health Inspector, Schools=l
Panchayats-EW^3,
CEO= only 2 from either Gulbarga, Bellary, Raichur or Koppal
Dr. Aquinas & Mita Deshpande (Raichur),
Want TARA??
iM cx-,‘'
GOVERNMENT OF KARNATAKA
No. HERSHP/O1/2000-2001
Directorate of Health & F. W.
Services. Bangalore-9,
26-02-2001. "
To,
The Commissioner,
Directorate of Health & F. W. Services,
Bangalore-9.
Sub: Submission of the Report & Review Report of School Health
Programme for the month of January 2001.
Sb’,
Please find here with enclosed the report ( part-I) of School Health Programme for the month of
January 2001 reviewed in the month of February 2001 in book let form including the notes both in
English & Kannada version on Page No.l to 8 and district summary statement on Page No. 9 for your
kind perusal.
The feed back report is being sent to each District Health & F. W. Officer to give the explanation
for the poor performance in the implementation of School Health programme in their respective
districts. They have been also requested gear up the programme so as to achieve the target by the end of
die March 2001.
Thanking you,
/
(Dr. S. B. Kurtakoti ),
Additional Director ( HET )
A copy is here with submitted for kind information to:
1. The Principal Secretary, Department of Health & F. WM. S. Building, Bangalore-1.
2. The Commissioner for Public Instruction, Bangalore-1
3. The Director of Health & F. W. Services, Bangalore-9.
G O VERN M ENT O F KA RN ATA KA
PROGRESS REPORT OF SCHOOL HEALTH PROGRAMME
FOR THE MONTH OF JANUARY 200i
(Documentation In Dr. S.B.Kurtakoti)
HEALTH EDUCATION & TRAINING
DIRECTORATE OE HEALTH & F. \V, SERVICES, BANGALORE-9
INDEX
1
SLNo.
SUBJECTS
01
02
Note on School Health Programme English Version
Note on School Health Programme Kannada Version
03
04
Statement showing the district wise summary report
Statement showing monitoring of receipt of the
monthly progress reports in scheduled dates
Statement showing the district wise performance of
Med. Exam, of School students
Statement showing the district wise performance of
D&T immunization of students
Statement showing the district wise performance of
1st dose of TT immunization of students
Statement showing the district performance of 2nd
dose of TT immunization of students
Statement showing the Dist. Wise performance of
teachers’ training
Statement
showing
the
percentage
of
defects/deficiencies found among the children
medically examined from July 2000 to January 2001
PAGE
NO.
1 -3
4-8
Monthly report for January 2001
05
06
07
08
09
10
9
10
11
12
13
14
15
16
SCHOOL HEALTH PROGRAMME
(Under Health Education and Training )
JANUARY 2001
Introduction:
The School Health Service is the Personal Health Service and is being
implemented for the last 15 years, from narrower concept of medical examination of
children to the present day concept of comprehensive care of Health and well being of
children throughout the academic year .
Objectives:
The School Health Program has been implemented in all the Primary and Higher
Primary schools in both Rural and Urban areas of the State . All the District Health and
F.W Officers are implementing the Program effectively as per the instructions of this
Directorate. The following are various activities:
1) Medical Examination of the students 1st, 4th and 7th Std.
2) Immunization of children with 1st booster dose of DT to 1st Std. Students & 1st
booster dose of TT to 7th Std. Students and 2nd booster dose of TT to 10th Std.
Students
3) Providing treatment for minor ailment
4) Students requiring specialist care are referred to nearest hospital regularly.
Health Education to teachers as well as students regarding personal hygiene.
environmental sanitation, drinking water, use of latrines are being taught regularly.
5)
This is the programme being implemented by two departments i.e., Dept, of public
Instruction and Dept, of Health & FW Services.
The progress report for the period from June 1996 to January 2001
Sl.No.
Kind of activities
a)
b)
Medical Examination of students
Medical defectives found among
the students examined
Immunization, D&T to the 1st Std.
Students
Immunization, TT to the 7th Std.
Students
Annual target
Cumulative
achievement
%
I. 1996- 1997
c)
d)
83,09,678
56,01,613
56,01,613
24,61,136
65.40
43.40
-
15,36,966
-
-
17,65,352
-
31,34,072
15,85,474
15,85,474
2,78,719
20.31
17.57
-
6,83,788
-
-
7,01,2254
II. 1997-1998
a)
b)
c)
d)
Medical Examination of students
Medical defectives found among
the students examined
Immunization, D&T to the 1st Std.
Students
Immunization, TT to the 7th Std.
Students
2
III. 1998- 1999
Sl.No.
__ a)
b)
c)
d)
e)
Annual target
Kind of activities
Medical Examination of students
Medical defectives found among
the students examined
Immunization, D&T to the 1st Std.
Students
Immunization, TT to the 7th Std.
Students
Teachers' Training
71,54,788
17,83,382
Cumulative
achievement
17,83,382
2,76,428
25.3
26.30
-
7,12,603
-
-
7,37,427
-
14,469
6,423
44.39
26,65,804
21,33,662
21,33,662
3,76,232
80.04
17.63
10,33,532
8,66,932
83.88
7,21,683
7,28,503
100.95
5,40,413
3,97,411
73.54
14,469
10,063
69.55
30,82,166
11,82,418
29,35,243
8,83,985
95.23
74.76
11,26,511
9,54,456
84.72
5,20,701
5,85,143
112.37
1,91,677
62,447
32.57
%
IV. 1999-2000
a)
b)
c)
d)
e)
D
Medical Examination of students
Medical defectives found among
the students examined
Immunization, D&T to the 1st Std
Students
Immunization, TT to the 7th Std.
Students
Immunization, TT to the 10th Std.
Students
Teachers' Training
V. 2000-2001
From June 2000 to January 2001
____ Medical Examination of students
Immunization, D&T to the 1st Std
b)
Students
Immunization, TT to the 7th Std.
c)
Students (1st Booster dose )
Immunization,
TT to the 10th Std.
d)
Students ( 2nd Booster dose )
Teachers' Training
e)
3
The statement showing the budget allocation and expenditure from the
period from 1997 to January 2001 for various schemes under Health
Education & Training.
SI.
No.
01
02
The name of the
programme
School
Health
Programme U/A/C
2210-03-800-0-08
Incentive to SC/ST
ANM
Trainees
u/a/c
2210-03-800-0-06
1997-1998
1999-2000
1998-1999
Expendi
Allotment
in laks
Expendi
ture
Allotment
in laks
Expendi
ture
Allotment
in laks
55.00
55.00
10.50
10.50
10.00
10.00
0.40
0.06
30.40
28.32
57.00
11.52
ture
Up to £h<s end of January 2001
SI.
The name of the
No.
programme
01
School
2000-2001
Allotment
in laks
Expend
iture
50.00
43.20
10.00
9.92
05.00
03.50
2001-2002
Allotment
in laks
2002-2003
Expendi
ture
Allotment
in laks
Expendi
ture
Health
Programme
U/A/C
2210-03-800-008
02
Incentive
to
SC/ST
ANM
Trainees u/a/c
2210-03-800-0-
06
03
Bureau of Health
Education
u/a/c.
2210-06-112-0-
01
( Dr.S.B.KURTAKOTI)
AddLDirector (HET)
SJ3J 33zJe3 aaaareo saga -cygfjae^ g^o&ry.sj
(zagsojoop j
aea^s
oas
ZS^crrtoiS asgos^gCc^Bj^rf j&o&sog 'zo&iszsrfrt
a?a^
g3o33J5^a g^raL^ear sj^yg^ 4ydjjer^ao3eaa ■sSjajeSe ajj<a^ crue^e®.
cruet©----------esryyjg
----am, aa,a5eea ssrva g33
s>or?y<^ asgjs^grt/ay&eS.
sacsa JsrfJWfa
s;t$e®t5 s^aos7 Soi,^ goBaS)
zgtJ^ ■«>a°ja-e^
getresg^oafts
s^c»
iFjujozj ff’e^ea ■ta&Fwmtoca
s^cjjrs^js)
oSy&^o^n 3^cddfff3^ygq)gJ3,t5^
g^ecds^gj 25-i3jgi3^’f)'yj •^^vb’ocsoss'j?,^.
o. o^e y^e 303^2.^5 3©f)3RVc^o5b s>Z5^ ^frw
33^grf.
J>. o^e 35<53 SC5^ CfftfH’ CJ&& Q, SJ3J, 13 83023^30^^^ 25J3^ 2.ge 35CT3
azs^ ^srswt st/aeso^e ai/^54 L3.L3.
z&^egg^
oo^e
33<53 sx5%QFrK?rt _9^e t3.13.
avs-^34
gjjay^. sjssgjj
a.
5^01)0 ffyrf ^^5-<?cdd z&^
y. sj^yr?
zJe^cyc^
23-^r^fi ^yjgogc^ffj^jesj.
2ot3f\5Jg)C5J.
gaoesj®
gJ03 33^3
w. a^s’od’ ®^3j ac5^
koks g^aurc^ <^33^3
3\J©a£DS 3C3J S^zJ^oaXjffyg^ au3;OJJ3engja &irto »3o33S»fi -cfd’js-e?^
&^eat58oX)c^ syjays
*
’
atftf’j^erC; JSJS'J, yJWJOZJ
■«>®,aX)t5c^
‘Sje^oJ’ S5^3J
^oDr^aosgjj 49gJS^grtj3Vgc»
5.
1996 Oog5
1996-97
sroai&xf£
aa<£ stfsaiatatfrfcb
tf>S$0
S3.
&>croJ®FK<sirt sl.rf deodb s>Oe3
______ iZ________ fl 16
-a__________________
s5,id,8eoi> E>Oe£ o±>£> tfot& wod oied.drte
*
U £
<>X
CO
a
amaFrttf ;3oM
AX
lc$e
60.
toWO
eJ
AiOC^cS
KdO
A)Ool3
a
357) Cfo
8309678
5601613
65.40
5601613
2461136
43.40
00
1536966
00
00
1765352
00
a
&>CTO.^Frt(?rt
8
ddrt&
a
sfcds
-D
83
S&S& c&C&>
a.
7?5e ddri^ acro^Frtort 83. 83.
1997-98
s^8tos383^Kl5t>
^>Sb
60.
a
to Wo
eJ
TocJ^cS
oX
rioO
^oa3.
Scsa.arrt^rt rf,rf.8eoi> e>©?3
a‘
e! a
<*x
oJ.CS.Seoid SjO^o OjO<£) oOCsd £00(3 <\>Jdc$rd>n&
v a
ox
co
<$
cOcJCb
3134072
1585474
20.31
1585474
278719
17.57
00
683788
00
00
7012254
00
5
£
Ax
lc5? 36K13
ziisiiM sijtsba
Q.
76$e ^drfe
a
83
&3.&3.«^
1998-99
aa<2 ?3!&>sft3tfrteb
^,3^0
SSfilFi
cX
rbd
a) Oo(5-
So8D
«J
A)t)^c3
S5x>d)
<s>.
Sera aFrt<?rt rf.<d.8eo±>
s30e3M
f) n
7154788
1783382
25.30
S3.
s5,ct8eo±> sjQ(# oi>© tfo<&> tood
y d
ex
co
*
acsa^rrt?
A>oa5x
1783382
276428
26.30
00
712603
00
00
737427
00
14469
6423
44.39
Ax
ic5e
ddrt.3
acro^Frt^rt
a
a
83
s£>zi> s±>ab
_______ ?j
a.
•a.
a______________________________________
7?5e ddrte ans^Friert 83.83. waS
tfdddeJea
gX
1999-2000
o,e&
83btoe&3£K'&
cOtJ&J F
*^
cA
r^o
7jo®5,
---a.
aero ©rrt^rt sS.e^aeodb ^e?S
83.
e5.d,8eccio £>0e3 oi><5 3oab
Co
u\
f)
aeroarrte s>oai
&
185?
a.
•a.
ddrts
acro^FrtS'rf
ejoCj
a
£
c±>d3
53
8i>83o Sbei>
______ £S_____ Q__________________________
78$? ednS aCTO.^Frt^rt 53.53. 8±>8±> sfoci)
__________________ a____________________ zj
q____
lOcS?
amarrf?rt 53.53.8&?&> sfocjb
_________________ a
___________ Zi
a
to Wo
«J
n)c)^cS
cOt?c5o
2665804
2133662
80.04
2133662
376232
17.63
1033532
866932
83.88
100.95
721683
728503
540413
397411
73.54
14469
10063
69.55
aS?'.
2000-2001
(2001
aa<£
^,350
cOOS?
CJ>
Ko©
jyoai.
a.
acro.arrtert rf,c35eo±i
&>o?3cj.
el f>
83.
icie
acro^Fri^rt
a
53
8uii>
oJ
sroqjrf
3082166
2935243
95.23
1182418
883985
74.76
1126511
954456
84.72
520701
585143
112.37
191677
62447
32.57
85083)Zd s±>nbC3
A.
7?Se ^dri^ acro^rri^rt 53.53.ex^
aero.^Frt'S'rt 53.53.8&8& sfodo
a.
lOcSe
at
So 3d 3de3eS
----------------------------------------------------------------
m Era era &&/ser(,& B?><xbFtf-J.atitf,-t siodi.»
200idsidrt ejafosfo
*
aOc&rf^
o
es&eeri°.s&di sbaoozj ^era.ra
taeraa3oi>
i
wo
aforaeaSd
□satortf.o&rt'M
i997Qotf
s*>dd -° rfai2J rt?f sort'd crfaeJ § k( 0 dra. ert*\ rt&£)
)
co/
6\c3d
a6?od>
*
ssabr^sforts
1997-98
A)Oal
D
art©
sjax)rf
1998-99
£te£>r
o
->
1999-2000
£>2&r
aria
0
Sra <>
Era era adUsert. 3sai>Fif,e&
01.
o)K©
&)2i>F
♦
Eora ❖
coraO
55.00
55.00
10.50
10.50
10.00
10.00
0.40
0.06
30.40
28.32
57.00
11.52
(oise&srf)
2210-03-800-0-08 dQabfi
3j.c332 E).S)O2 8©O±> SfoEoW
02.
fefdraert.
o
(idesras^
«553O^8o±>0rt
sxis.essso
-> <\J
co25b s30
3d
djasjirfe)
co
&£>' dedrf
s&ooSJ
O
(odeeBJof)
2210-03-800-0-06
?aafe$02001d ao^GSsSdrts
D
u^oi)
nao&F-^abrisi co^do
A) 0^1
2000-2001
aria
&
a)28br
2001-2002
aria
01.
sraera eydjaert, sao&rtf
3o^O
50.00
43.20
10.00
9.92
(odseesrf)
2210-03-800-0-08 rfao±>0
02.
S).Sti! Ei.ElOo 80Od) S5b&a«ra
eydjaeri.
o
A)5oao±>8o±i©rt
(jdfcZracdQ
edx>o3^
S5j3j€3e) 3o
djeJedcdsb,
aozi> si©
£>a>.s5edri
o
U
(oieeasj?)
2210-03-800-0-06
2002-2003
ada
4
♦
SoTO §
£)2&F
doK) O
a)285F
essfefo 2001 d eod.dsidrts
D
^,si)
eraoi>r3/&rttf coTJcb
2000-2001
r0Oci5
aria
a
£)2&r
2001-2002
art©
3oK)4
soca ♦
01.
(oi®e&4?$)
eJ^jSe^rS
05.00
2002-2003
aria
r
*
a)z
♦
♦
♦
ejduaert, S3 ra saoi>r3.51>
aOziiF
a6ra ♦
03.50
s
2210-06-112-0-01
aderstecb (
wdJaeri,<5 sbab-j
3ea,ra
<5 itfedrfcb
ESortstfiUb-O.
-s-
STATEMENT SHOWING THE PERFORMANCE REPORT IN % OF SCHOOL HEALTH
PROGRAMME FROM JULY 2000 TO JANUARY 2001 & REVIEWED IN FEBRUARY 2001.
SI.
No.
Name of the
District
Med.
Exam, of
Students
D&T
GULBURGA DIVISION
95.83
82.13
97.74
93.60
95.10
94.00
78.21
89.82
90.05
75.26
93.74
86.77
93.80
429.64
128.40
88.53
110.96
98.98
61.48
86.60
98.60
125.55
89.00
132.46
98.94
116.82
40.72
78.93
84.44
89.55
82.13
91.92
81.26
99.02
64.83
71.12
44.91
85.31
80.85
85.72
85.58
104.74
64.54
78.64
120.58
83.33
68.47
84.90
73.62
41.20
66.08
86.43
73.65
61.10
61.45
66.25
76.20
65.15
77.92
62.55
73.80
71.95
GRAND TOTAL
95.23
74.76
01
02
03
04
05
06
07
Mysore
Chamarajnagar
Mangalore(DK)
Udupi
Mandya
Kodagu
Hassan
Chikkamagalur
MYSORE DIVISION
16
17
18
19
20
21
22
Belgaum
Karawar(UK)
Dharwar
Gadag
Haveri
Bijapur
Bagalakote
BELGAUM DIVISION
23
24
25
26
27
Teacher'
Training
95.50
76.88
63.75
97.56
94.40
63.52
85.85
80.30
101.18
73.68
80.55
80.23
93.21
384.28
91.30
82.38
101.80
81.20
65.00
74.59
80.13
91.62
60.09
82.71
76.42
98.22
84.62
93.70
63.28
74.70
86.32
100.78
59.91
106.26
150.50
147.00
30.23
91.33
87.80
67.00
107.15
68.55
69.26
88.06
223.69
136.47
112.42
91.95
102.97
99.54
126.87
93.14
263.55
113.62
206.66
128.80
240.98
200.67
134.84
145.31
159.78
185.10
11.13
46.97
10.72
60.07
03.35
01.56
85.02
31.41
00.93
62.83
84.35
43.98
00.00
97.28
28.40
64.27
38.01
15.05
33.84
35.65
14.42
67.70
03.95
38.00
26.52
05.71
00.00
216.58
64.59
24.27
37.34
84
80
80
92
80
70
96
88
80
88
96
84
76
100
88
92
88
80
82
80
84
92
76
84
80
80
78
92
88
80
84
84.72
112.37
32.57
84
Marks
Bangalore(U)
Bangalore( R)
Kolar
Shimoga
Chitradurga
Davanagere
Tumkur
BANGALORE DIVISION
08
09
10
11
12
13
14
15
Remarks
"Marks /
Grade"
T. T.
1st dose
2nd dose
Gulburga
Bidar
Bellary
Raichur
Koppal
> Note : 'A' - Good , 'B' - Poor , 'C - Very poor, 'D' - Extremely poor, 'E' - Bad performance,
> Note : 'A’ - Marks- 81-100 , 'B' - Marks- 61-80 , ’C - Marks- 41-60, 'D' - Marks- 21-JOf'
'E' - Marks- 10-20 & less
\
(Dr S.B.Kurtakoti)
AddLDirector(HET)
7
Grade
|
A
1
B
B
A
B
j
B
A
1
I
A
B
A
A
A
B
1
j
A
A
A
1
a
B
;|
A
B
A
A
B
A
B
B
B
A
|
A
B
A
A
I
|
NO:AD/HET/SHP/01/2000-2001
Directorate of Health & F. W.
Services, Bangalore,
Dated:27-02-2001.
TO:
The District Health & F. W. Officer,
Sub:- Feed-back report of School Health Programme for the month of
January 2001, reviewed during February 2001.
Please find herewith feed-back report of School Health Programme of all the Districts iiW
the State for your information and for taking necessary action to achieve 100 % progress of the
School Health Programme by the end of March 2001. Action taken may please be intimated to
this Directorate by return of post.
(Dr S.B.Kurtakoti)
AddLDirector(HET)
Copy submitted for information to:
1) The Principal Secretary, Health & F.W.Department, M.S.Building, Bangalore-1.
2) The Commissioner, Health & F.W.Services, Anandarao Circle, Bangalore-9,
3) The Commissioner, Department of Public Instruction, Bangalore-1,
4 The Chief Executive Officer, Zilla Panchayat------------------------- .
Copy is marked for follow up action to:
The Divisional Joint Director, Health & F.W.Services,--------------------------- .
s
- 10 Statement showing the monitoring of receipt of the progress reports on the School Health
Programme for the month of January 2001.
jSheduled date: IO01 of every month)
Sl.No
Name of district
2nu WEEK
3rd WEEK
41U WEEK
REMARKS *
09.02.2001
01
Bangalore(U)
02
Bangalore( R)
03
Kolar
04
Shimoga
05
Chitradurega
06
Davanagere
07
Tumakur
08
Mysore
09
Chamarajnagar
10
Mangalore(DK)
11
Udapi
12
Mandya
13
Kodagu
14
Hassan
15
Chikkamagalur
16
Belgaum
17
Karawar(UK)
18
19
20
21
22
23
24
Dharawar
Gadag
Haven
Bijapur
Bagalakote
Gulbuarga
Bidar
12.02.2001
—
—
08.02.2001
14.02.2001
—
25
26
27
Ballary
Raichur
Koppal
09.02.2001
09.02.2001
—
12.02.2001
09.02.2001
08.02.2001
15.02.2001
13.02.2001
08.02.2001
14.02.2001
09.02.2001
14.02.2001
12.02.2001
08.02.2001
08.02.2001
12.02.2001
14.02.2001
—
17.02.2001
12.02.2001
07.02.2001
23.02.2001
20.02.2001
17.02.2001
..
17.02.2001
Whether the explanation is called for or not ? Write Yes or No
-11STATEMENT SHOWING THE PROGRESS REPORT OF MEDICAL EXAMINATION OF
STUDENTS ON THE SCHOOL HEALTH PROGRAMME FOR THE MONTH OF
JANUARY 2001 UNDER HET DIVISION OF DIRECTORATE OF HEALTH AND
_______________________ F. W. SERVICES, BANGALORE.__________________________
SI.
No.
Name of district
Annual
target
Monthly
target
Achievement
during the
month of
January 2001
Cumulative
from June to
January 2001
1
I
%
1
1
1
01
02
03
04
05
BangalorefU)
Bangalore( R)
Kolar
Shimoga
Chitradurga
71,392
1,46,352
1,65,950
99,544
1,03,818
11,899
24,392
27,658
16,591
17,303
4,502
47,463
920
19,618
5,867
68,419
1,20,209
1,62,208
93,165
98,723
95.83
82.13
97.74
93.60
95.10
06
07
Davanagere
Tumkur
1,10,344
1.72,417
18,391
28.736
21,254
50,444
1,03,727
1,34,859
94.00
78.21
Bangalore Division:
8,69,817
1,44,969
1,50,068
7,81,310
08 Mysore
09 Chamarajnagar
10 Mangalore-DK
11 Udupi
12 Mandya
13 Kodagu
14 Hassan
15 Chikkamagalur
Mysore Division:
1,26,453
57,066
95,307
67,771
99,739
30,538
80,293
64,804
6,21,971
21,075
9,511
15,884
11,295
16,623
5,090
13,382
10,801
1,03,661
8,565
4,795
21,001
4,233
16,363
50,390
9,674
10,497
1,25,518
1,13,872
42,952
89,334
58,805
93,549
1,31,206
1,03,098
57,371
6,90,187
89.82
__ |
90.05
75.26
93.74
86.77
93.80
429.64
128.40
88.53
110.96
16 Belgaum
17 Karawar(UK)
18 Dharwar
19 Gadag
20 Haveri
21 Bijapur
22 Bagalakote
Belgaum Division:
2,91,803
94,573
1,17,540
63,436
94,422
1,54,828
1,20,375
9,36,977
48,634
15,762
19,590
10,573
15,737
25,805
20,062
1,56,163
13,790
L968
16,875
288
37,703
31,164
00
1,04,788
2,88.803
58,142
1,01,790
62,544
1,18,538
1,37,783
1.59.449
9,27,049
98.98
61.48
86.60
98.60
125.55
89.00
132.46
98.94
23 Gulbarga
24 Bidar
25 Beilary
26 Raichur
27 Koppal
Gulbarga Division:
1,71,883
1,53,002
1,50,449
90,093
87,974
6,53,401
28,647
25,500
25,075
15,015
14,662
1,08,900
45,211
2,922
21,809
9,779
7,458
87,179
2,00,798
62,305
1,18.742
76,075
78,777
5,36,697
__ |
116.82 1
40.72
78.93
84.44
89.55
82.13
1
GRAND TOTAL
30,82,166 5,13,693
4,67,553
29,35,243
95.23 |
________________ I
1
- 12STATEMENT SHOWING THE PROGRESS REPORT OF D &T IMMUNIZATION COVERAGE
FOR THE MONTH OF JANUARY 2001 UNDER HET DIVISION OF DIRECTORATE OF
HEALTH & FAMILY WELFARE SERVICES, BANGALORE
SI.
No.
Name of the district
01
02
03
04
05
06
07
Bangalore(U)
Bangalore( R)
Kolar
Shimoga
Chitradurga
Davanagere
Tumkur
27,152
50,778
59,270
34,369
38.694
40,294
64,537
3,974
9,105
284
2,600
00
1,572
7,319
24,958
41,266
58,693
29,157
27,523
18,097
55.062
91.92
81.26
99.02
64.83
71.12
44.91
85.31
Bangalore Division:
Mysore
08
Chamarajnagar
09
10
MangalorefDK)
11
Udapi
Mandya
12
Kodagu
13
Hassan
14
Chikkamagalur
15
3,15,094
43,635
20,578
29,726
19,088
32,523
9,664
26,672
21,320
24,854
2,112
1,872
3,749
568
2,107
399
1,422
1,001
2,54,756
37,408
17,609
31,136
12,320
25,579
11,653
22 226
14,598
80.85
85.72
85.58
104.74
64.54
78.64
120.58
83.33
68.47
Mysore Division:
Belgaum
16
Karawar(UK)
17
Dharawar
18
Gadag
19
Haveri
20
Bijapur
21
Bagalakote
22
Belgaum Division:
2,03,206
1,16,636
38,678
43,737
22,724
36,571
63,210^
48,788
3,70,344
13,230
8,078
858
2,080
959
3,162
2,319
2,507
19,963
1,72,529
85,868
15,934
28,902
19,641
26,398
38,626
29,977
2,45,346
84.90
73.62
41.20
66.08
86.43
73.65
61.10
61.45
66.25
Gulburga
Bidar
Bellary
Raichur
Koppal
92,133
64,614
59,518
40,250
37,259
4,697
2,293
2,167
2,858
3,281
70,212
42,097
46,373
25,175
27,497
76.20
65.15
77.92
62.55
73.80
2,93,774
15,296
2,11,354
71.95
11,82,418
73,343
8,83,985
74.76
23
24
25
26
27
Gulbarga Division:
GRAND TOTAL
Annual
target
Achievement during
the month of
January 2001
2
Cummuiative
from June to
January 2001
Percent
age
(%)
STATEMENT SHOWING THE PROGRESS REPORT OF lrt BOOSTER DOZE OF TT
IMMUNIZATION COVERAGE FOR THE MONTH OF JANUARY 2001 UNDER HET DIVISION
OF DIRECTORATE OF HEALTH & FAMILY WELFARE SERVICES, BANGALORE.
25,141
50,943
60,185
34,969
36,790
39,585
59,518
Achievement
during the month
of January 2001
3,042
5,445
2,579
2,953
00
2,236
8,142
Cummulative
from June to
January 2001
24,008
39,166
38,370
34,116
34,729
25,145
51,102
M^angalore Division:
wT)8
Mysore
Chamarajnagar
09
10
Mangalore(DK)
11
Udupi
12
Mandya
13
Kodagu
14
Hassan
15
Chikkamagalur
3,07,131
44,656
21,040
36,122
25,637
34,899
10,528
27,204
23,133
24,397
1,958
765
2,241
535
2,112
11,039
1,350
1,292
2,46,636
45,184
15,504
29,094
20,569
32,531
40,457
24,838
19,059
80.30
101.18
73.68
80.55
80.23
93.21
384.28
91.30
82.38
Mysore Division:
Belgaum
16
Karawar(UK)
17
18
Dharwar
19
Gadag
Haveri
20
Bijapur
22
Bagalakote
2,23,219
1,04,140
32,973
43,657
25,497
35,744
58,321
43,711
21,292
4,941
806
2,633
833
2,611
2,946
1,979
2,27,236
84,560
21,432
3,262
20,431
32,751
35,046
36,154
101.80
81.20
65.00
74.59
80.13
91.62
60.09
82.71
FMgaum Division:
Gulburga
23
Bidar
24
Bellary
25
Raichur
26
Koppal
27
3,44,043
73,059
55,259
55,830
34,751
33,219
16,749
4,736
2,012
2,242
1,399
3,132
2,62,936
71,763
46,762
52,317
21,992
24,814
76.42
98.22
84.62
93.70
63.28
74.70
Gulbarga Division:
2,52,118
13,521
2,17,648
86.32
GRAND TOTAL
11,26,511
75,959
9,54,456
84.72
SI.
No.
Name of the
District
01
02
03
04
05
06
07
Bangalore(U)
Bangalore( R)
Kolar
Shimoga
Chitradurga
Davanagere
Tumkur
Annual
target
3
Percentage
(%)
95.50
76.88
63.75
97.56
94.40
63.52
85.85
- 14STATEMENT SHOWING THE PROGRESS REPORT OF 2nd BOOSTER DOZE OF TT
IMMUNIZATION COVERAGE FOR THE MONTH OF JANUARY 2001 HET DIVISION OF
DIRECTORATE OF HEALTH & FAMILY WELFARE SERVICES, BANGALORE.
SI.
No.
Name of the
district
01
02
03
04
05
06
07
Bangalore(U)
Bangalore( R)
Kolar
Shimoga
Chitradurga
Davanagere
Tumakur
10,264
33,231
25,842
16,276
14,888
29,384
30,083
Achievement
during the
month of
January 2001
2,702
8,318
1,619
3,059
00
1,061
12,047
■Bangalore Division:
r08
Mysore
Chamarajnagar
09
Mangalore(DK)
10
Udupi
11
Mandya
12
Kodagu
13
14
Hassan
Chikkamagalur
15
1,59,968
45,050
9,590
22,501
14,872
28,025
7,549
16,162
11,568
Mysore Division:
16
Belgaum
17
KarawarfUK)
18
Dharwar
19
Gadag
20
Haveri
Bijapur
Annual
target
Cumulative
from June to
January 2001
Percentage
(%)
10,345
19,912
27,461
24,495
21,886
8,884
27,477
100.78
59.91
106.26
150.50
147.00
30.23
91.33
28,806
2,574
683
3,129
1,052
4,932
8,969
2,168
1,414
1,40,460
30,181
10,276
15,425
10,301
24,679
16,887
22,057
13,005
87.80
67.00
107.15
68.55
69.26
88.06
223.69
136.47
112.42
1,55,317
43,012
15,564
20,294
16,246
8,836
18,795
24,921
4,081
1,969
2,133
1,660
3,687
3,114
1,42,811
44,292
15,493
25,749
15,133
23,288
21,356
91.95
102.97
99.54
126.87
93.14
263.55
113.62
Bagalakote
16,410
3,745
33,913
206.66
Belgaum Division:
Gulburga
23
24
Bidar
25
Bellary
Raichur
26
Koppal
27
1,39,157
20,419
12,797
14,816
9,260
8,967
20,389
7,039
2,595
1,982
1,834
2,684
1,79,224
49.206
25,680
19,978
13,456
14,328
128.80
240.98
200.67
134.84
145.31
159.78
Gulburga Division :
66,259
16,134
1,22,648
185.10
5,20,701
90,250
5,85,143
112.37
F
22
GRAND TOTAL
4
15STATEMENT SHOWING THE PROGRESS REPORT OF TEACHERS’ TRAINING COVERAGE
FOR THE MONTH OF JANUARY 2001 OF HET DIVISION OF THIS DIRECTORATE OF
HEALTH & FAMILY WELFARE SERVICES, BANGALORE.
SI.
No.
Name of the
District
Annual
Target
01
02
03
04
05
06
07
Bangalore(U)
Bangalore( R)
Kolar
Shimoga
Chitradurga
Davanagere
Tumkur
BANGALORE DIVISION
Cumulative
from June to
January 2001
Percentage
(%)
18,161
9,800
12,234
6,474
5,678
7,668
12,535
Achievement
during the
month of
January 2001
998
290
107
867
120
00
00
2,022
4,604
1,312
3,889
190
120
10,658
11.13
46.97
10.72
60.07
03.35
01.56
85.02
72,550
9,190
3,495
6,014
4,533
6,737
2,028
7,878
6,099
2,382
82
1,056
193
299
00
00
37
1,868
22,795
86
2,196
5,073
1,994
00
1,973
2,237
3,920
31.41
00.93
62.83
84.35
43.98
00.00
97.28
28.40
64.27
45,974
13,838
6,981
4,341
3,445
5,634
8,083
5,237
3,535
50
950
00
497
782
320
1,490
17,479
2,084
2,363
1,548
497
3,814
320
1,990
38.01
15.05
33.84
35.65
14.42
67.70
03.95
38.00
47,559
8,763
6,546
2,574
3,993
3,718
4,089
113
00
950
794
90
12,616
501
00
5,575
2,579
902
26.52
05.71
00.00
216.58
64.59
24.27
GULBURGA DIVISION
25,594
1,947
9,557
37.34
GRAND TOTAL
1,91,677
11,953
62,447
32.57
F 08
09
10
11
12
13
14
15
Mysore
Chamarajnagar
Mangalore(DK)
Udupi
Mandya
Kodagu
Hassan
Chikkamagalur
MYSORE DIVISION
16
17
18
19
20
1 21
22
Belgaum
Karawar(UK)
Dharwar
Gadag
Haveri
Bijapur
Bagalakote
BELGAUM DIVISION
23
24
25
26
27
Gulburga
Bidar
Bellary
Raichur
Koppal
5
Statement showing the defects / deficiencies found among the school children
Medically examined from July 2000 to January 2001.
SI.
No.
Defects/
Defici
encies
July
2000
Aug.
2000
Sept.
2000
Oct.
2000
Nov.
2000
Dec.
2000
Jan.
2001
TOTAL
01.
02.
Dental
Eye
Ear
Skin
Nutritional
Deficiency
6855
1741
1881
2701
4836
35041
3745
5775
6640
11218
34085
8682
8086
11840
20338
15742
3590
3791
5577
10463
38049
7032
7864
13138
26984
33580
7486
7615
13664
23490
38049
7032
7864
13138
26984
2,01,401
39308
42,876
66,698
1,24,313
Others
3831
8009
14648
5947
18016
7625
18016
76,091
05.
06.
Statement showing the percentage of defects / deficiencies found among the school
children Medically examined from July 2000 to January 2001.
tr-
Defects/Deficiencies
No.
01.
02.
03.
04.
05.
06.
Dental
Eye
Ear
Skin
Nutritional Deficiency
Others
TOTAL:
Total Children
Medically examined
24,67,580
24,67,580
6
Total Defects found
Percent
age
2,01,401
39,308
42,876
66,698
1,24,313
76,091
5,50,687
08.16
01.59
01.74
02.70
05.04
03.08
22.32
FOOD FOR THOUGHT:
s
/
I’nncin Caloric malnutrition is a predominant nutritional deficiency among the
children of the vulnerable group in developing countries. Due to inadequate intake
; of basic supplements such as pulses, milk and vegetables. vitamin deficiency
disorders also set in. thus impairing the physical and mental growth at such a
crucial and sensitive stage of their lives.
I
hi dcvelopir
Encrgx Food as a diet supplement, considerable thought has been
QUALITY CONTROL:
devoted to the selection of suitable raw materials conducive to growth in children.
*Tin major raw materials required for the manufacture of Energv Food arc Wheat/
Maize Gnts._ Bengal gram dhai .Jaggery and edible Groundnut cakc/Sova
*
Flour/Soya Dhal which arc easy to procure and arc cost-cfieeiiyc too.
PROCESS OF PRODUCTION:
The Indian Council of Medical Research has estimated the protein-calorie
Rigorous quality control is necessary in the manufacture of Energy Food at all
stages of production. Tins is done by AGRO CORN with the consultancy back up
arrangements with C.F.T R.I.. Mysore. Raw materials confirm to the PFA standards
wherever they arc applicable or to other specifications laid down.
PACKING:
Energv Food manufactured under expert technical supervision is machine packed
requirement of pre-school children (1-6 years) at 17-22 gms of proteins and 1200-
in flexible pouches of 1-5 Kgs capacity. Further protection is provided by the
. 1500 caloncs per day whereas the school going children need 33-41 gms of proteins
secondary patk used for even- 25 units for convenient distribution.
and 1 SOO-2100 caloncs per day.
Keeping in view the above factors. Central Food Technological Research Institute.
(CFTR1) Mysore, has designed and developed Energy Food so as to provide in a single
ration at least half the content ol proteins and 1/3 ol caloncs vital for a child's
i growth. Practically a rcadx to sen e food, this diet cnrichcr was extensively med out
|tin the nutrition programme of the Indian Population Protect of Karnataka.
One of the vanous activities that the Karnataka State Agro Com Products Limited
engaged m currently includes the manufacture of this ready-to-eat. processed
u caning food namciv Energy Food for Nuinnonal Intervention Programme
undenaken by the vanous Departments ol the Government of Karnataka. The
weaning food manufacturing Units have been set up at Mysore. Bclgaum.
Churadurga Raichur and Doddabalkipur with the technical collaboration of
C.F.T.K.I.. a pioneer Food Research Institute of Government of India These Five
UmtVhavr an installed capacity of 90 memo tonnes of weaning food per day“TFe
weaning lood is being supplied cunrriilylblhc Education Departnicnt lor
distribution to Prc-pnmary and Pnmaiy children undeTMid^hv Meals Scheme.
!’ is also being supplied to the Social Welfare and Women & Children Welfare
. Departments for distribution to vanous beneficiaries namely prc-pnmary children.
| regnant Mothers, lactating women, severely malnourished children and others.
’UNICEF has also assisted this project by way of supplying plant and machinery.
DISTRIBUTION STRATEGY:
To ensure that this health food reaches the under and malnourished segment of
the target population, it is now utilised for the school feeding programmes of the
Gon. of Karnataka and Nutrition Intervention Programmes of other states.
By adopting proper developmental market strategy. Agro Coni is also populansing
Energv Food as a consumer item as to give an indication ol the quanutv of
Weaning Food to br given to children. 55 gms of this Energv Food can substitute al
a cheaper cost. 2 slices of Standard Bread loaf and 112 ML of Milk.
The process consists mainly of pre-cleaning all the raw materials roasting them
under optimal conditions, powdering them to the required mesh size and mixing
them ultimately.
Energy Food is a sweet powder with a pleasant natural flavour 100 gms of Energy
Food provides 14 gms of protein and 380 calories of energv. which is about 40%
of the protein requirement and 18% of the energy needs of a 6 year old child. This
quantity of Energv Food provides upto 50':vof_the required essential Vitamins A.
B| B_». Niacin. Folic Acid as well as minerals like Calcium and Iron. Thus Energy
Food is a wholesome food supplying substantial pan of the daily nutritional
requirement of a growing child
The mix has a good acceptability. It can be consumed as such and docs not need
any pre-cooking as in the case of other high protein supplements, if desired it can
be mixed with water or milk to make a porridge or paste. It can also be used m
preparing Halwa. Pancake (Sweet Dosa). Chappathi etc.
HOW TO USE:
SPECIAL WEANING FOODS:
For children below 1 yean- Add Energy Food to boiling water. stir well for a minute.
cooi
spoon feed the gruel.
Besides Energy Food, with the
technical collaboration of C.F.T.R.I..
For •
ren above one year- Mix Energy Food with pre boiled and cooled water
or w..
•ater. roll into bails and serve.
Energ-
. ui can be consumed directly too.
Mysore. KSACP Ltd. is also
manufacturing Special Weaning
foods having a hieh calone density
per unit volume. By feeding this food.
an infant can consume a larger
amount of I rue food.in one sitting and
wall have adequate nutrition also. The
special weaning food is
recommended for infants at about 4-
6 months of age. This food is also in
powder form and wail have to be
reconstituted in pre boiled warm
water, see it thin and to spoon feed.
Special weaning food formulations
are being produced by the Company
at present havingeenam percentages
enzyme nch cereal flours with or
without skimmed milk powder.
HOW TO STORE:
Store Energy Food only in clean, dry rooms free from insects and rats. Do not store
Boar- Badus /p-ouiiity g-ood, /deeds
ueiw'ity find.
in damp rooms, or with moist materials. Avoid keeping the material directly on the
floor. (Use polythene sheet/Bamboo mat or wooden planks as dunnage). Energy
Food should also be stored away from infested materials and non-food items. If
stored under hygienic conditions, it can be preserved for 3 months from the date
of manufacture. The room m which the material is stored should be maintained
*
ven
clean. If possible, at intervals of 2 months, spray the walls of the room with
2% Malathion after emptying the room completely.
In the absence of suitable storage rooms, commercially available metallic bins may
also be used.
Do not open the packets till the time of actual use. If the left over material is to be
preserved for a short time, store in a clean tin container with a tight fitting lid. Do
not use food from opened or damaged packets that arc exposed to unhygienic
conditions.
PROXIMATE COMPOSITION AND NUTRITIONAL VALUE OF
ENERGY FOOD
r./inn a
Moisture
5-7
Protein (Nxo. 25)
14-15
Fat
2-4
Minerals
3-4
Fibre
Carbohydrate
Caloncs
Calcium
Phosphorous
Iron
Vitamin A
370-380
1 gm
0.5-1.0 gm
40 mg • 60 mg
1500 lu
Vitamin Bi
0.6 mg
Vitamin B»
0.8 mg
Niacin
L
1-2
68-72
Folic Acid
5 mg
0.01 mg
AGRO Educational Material presented with the Compliments of
CORN Karnataka State Agro Com Products Ltd
(A Govt.
K-inuiiak.i Undertaking)
I’.B. No. 2479. Bellary Road. Hvbbal.
Bamtaiorr-560 024.
51
e5;i)2ood-v
crazed
zSera^rocb
crasoeraS e>o& eso^rWo
D
Q
&Sai>
tie)n
sraelrWj
xJwrO
SoOcdj
UUJ
u
Zj&3$
xJirarO
d&d
- 1999-2000
sradrWj
wsbcra
esbcad
Xj
di>3
uw
esJxssri
xJ&>3
u
rfsse-0 essbcra
esbcrad
u
d&3
d&>tf
f
crv^d iJ^d
111171
4321
10606
126098
62865
3863
5555
72283
9594
26943
5645
42182
183630
35127
21806-
240563
to 579,0
198481
19614
24535
242630
88057
12121
11051
111229
22651
19333
9236
51220
309189
51068
44822
405079
Oedd
160854
40009
15321
216184
65941
26830
8024
100795
17051
13319
11605
41975
243846
80158
34950
358954
rbe^rtc
339000
42474
36999
418473
105998
26233
20448
152679
37615
16952
20170
74737
482613
85659
77617
645889
todjS?
128787
2207
10821
141815
45601
1851
4847
52299
15268
6566
3562
25396
189656
10624
19230
219510
Q9Cd»ix9d)
169159
7119
19509
195787
52015
5490
10539
68044
19897
6347
7781
34025
241071
18956
37829
297856
t59dxj9t3drid
70415
7734
6453
84602
39512
5348
4204
49064
12954
7572
5853
26379
122881
20654
16510
160045
d^storitfjxto
85111
4055
6930
96096
55972
4073
5102
65147'
16560
15242
4720
36522
157643
23370
16752
197765
dt,ra
97493
49979
19537
167009
67472
44948
12233
124653
21946
40552
9197
71695. .
186911
135479
40967
363357
?S59XJd
125931
7232
18789
151952
88763
6263
11542
106568
31545
24241
10825
66611
246239
37736
41156
325131
todrto
28045
2076
6993
37114
21951
2009
3929
27889
4865
11278
2660 ■
18803
54861
15363
13582
83806
stood,
119576
7992
20200
147768
86524
6136
12524
105184
37194
20883
13056
71133
243294
35011
45780
324085
rfjjXbad)
170966
27468
43085
241519
105394
19163
31396
155953
37951
31063
22455
91469
314311
77694
96936
488941
crudoJb
57043
38410
7910
103363
44687
36649
4798
86134
17306
20909
5296
4351 1
119036
95968
18004
233008
4050100
485062
739221 5274383 1 2116301 384607
447780
craa^d aHj,:
2948688 560035
755342 374255 1689632| 6726436
1625011. 1561256 9912703
Paae:
ite: 09:«/200J
ImakkMa SAMEEKSHE STATISTICS
4TEG0RY:ALL
(PROVISIONAL)
OUT OF SCHOOL CHILDREN
IN 6-14 AGE GROUP
BOYS
TOTAL
GIRLS
1053744
506481
547263
% OF OUT OF SCHOOL
CHILDREN WITHIN DISTRICT
GIRLS
TOTAL
BOYS
11.73
11.12
10.53
% OF OUT OF SCHOOL
CHILDREN TO THE STATE
GIRLS
TOTAL
BOYS
100.00
100.00
100.00
DISTRICT NAME
6 - 14 AGE GROUP POPULATION
1
KARNATAKA
BOYS
4811853
GIRLS
4667318
TOTAL
9479171
2
RAICHUR
219458
217917
437375
53637
63255
116892
24.44
29.03
26.73
10.59
11.56
11.09
3
GULBARGA
367314
354822
722136
88706
97291
185997
24.15
27.42
25.76
17.51
17.78
17.65
4
KOPPAL
131840
130253
262093
27017
31119
58136
20.49
23.89
' 22.18
5.33
5.69
5.52
5
BIJAPUR
225203
213713
438916
40891
40442
81333
18.16
18.92
18.53
8.07
7.39
7.72
6
BELLARY
207531
203585
411116
34512
39063
73575
16.63
19.19
17.90
6.81
7.14
6.98
7
BAGALKOT
167304
164956
332260
22978
27285
50263
13.73
16.54
15.13
4.54
4.99
4.77
8
BIDAR
176240
168306
344546
19819
22980
42799
11.25
13.65
12.42
3.91
4.20
4.06
71676
69880
141556
8548
8553
17101
11.93
12.24
12.08
1.69
1.56
1.62
9 CHAMARAJANAGAR
10
GADAG
91957
89469
181426
10085
11227
21312
10.97
12.55
11.75
1.99
2.05
2.02
11
HAVERI
133844
126746
260590
13339
13124
26463
9.97
10.35
10.16
2.63
2.40
2.51
12 KODAGU
42705
42401
85106
4198
4082
8280
9.83
9.63
9 73
0.83
0.75
0.79
DAVANAGERE
163191
156495
319686
14272
14724
28996
8.75
9.41
9.07
2.82
2.69
2.75
14 CHITRADURGA
135992
130547
266539
11144
12349
23493
8.19
9.46
8.81
2.20
2.26
2.23
15
BELGAUM
388843
374842
763685
30190
34336
64526
7.76
9.16
8.45
5.96
6.27
6.12
16
MYSORE
227023
220210
447233
18539
19232
37771
8.17
8.73
8.45
3.66
3.51
3.58
17
DHARWAD
109734
104903
214637
8977
8862
17839
8.18
8.45
8.31
1.77
1.62
1.69
IS
UTTARA KANNADA
117167
111420
228587
9335
9523
18858
7.97
8.55
8 25
1.84
1.74
1.79
19
KOLAR
228852
224957
453809
15641
17977
33618
6.83
7.99
7.41
3.09
3.28
3.19
13
1
1
jV/03/200 I
Page:
|MAKKALA SAMEEKSHE STATISTICS
2
|
CATEGORY: ALL_______________________________________ (PROVISIONAL)
6 - 14 AGE CROUP POPULATION
DISTRICT NAME
OUT OF SCHOOL CHILDREN
IN 6-14 AGE GROUP
GIRLS
TOTAL
BOYS
% OF OUT OF SCHOOL
CHILDREN WITHIN DISTRICT
TOTAL
BOYS
GIRLS
% OF OUT OF SCHOOL
CHILDREN TO THE STATE
BOYS
TOTAL
GIRLS
BOYS
GIRLS
TOTAL
20 CHICKMAGALUR
95780
93860
189640
6354
6537
12891
6.63
6.96
6.80
1.25
1.19
1.22
21
SHIMOGA
142380
138958
281338
9996
8822
18818
7.02
6.35
6.69
1.97
1.61
1.79
22 HASSAN
143777
143054
286831
8972
9155
18127
6.24
6.40
6.32
1.77
1.67
1.72
23 TUMKUR
222216
215545
437761
11814
12437
24251
5.32
5.77
5.54
2.33
2.27
2.30
24 BANGALORE RURAL
161084
155279
316363
8534
7902
16436
5.30
5.09
5.20
1.68
1.44
1.56
25 MANDYA
144929
141735
286664
7773
7082
14855
5.36
5.00
5.18
1.53
1.29
1.41
26 BANGALORE URBAN
462328
431347
893675
17552
15750
33302
3.80
3.65
3.73
3.47
2.88
3.16
27 DAKSHINA KANNADA
146707
148315
295022
2639
3113
5752
1.80
2.10
1.95
0.52
0.57
0.55
28 UDUPI
86778
93803
180581
1019
1041
2060
1.17
1.11
1.14
0.20
0.19
0.20
•
. .. _
— _—
teate: 09/03/2001
Page:
1
,A SAMEEKSHE STATISTICS
CATEGORY: ST
(PROVISIONA !
OUT OF SCHOOL CHILDREN
IN 6-14 AGE GROUP
GIRLS
TOTAL
BOYS
76758
144142
67384
' -------- --------- -------------% OF OUT OF SCHOOL
% OF OUT OF SCHOOL
CHILDREN WITHIN DISTRICT CHILDREN TO THE STATE
TOTAL BOYS
GIRLS
TOTAL
BOYS
GIRLS
100.00
19.18
100.00
100.00
17.69
20.71
DISTRICT NAME
6 - 14 AGE GROUP POPULATION
KARNATAKA
BOYS
381000
GIRLS
370685
TOTAL
751685
2 GULBARGA
19184
18524
37708
7386
8191
15577
38.50
44.22
41.31
10.96
10.67
10.81
3 RAICHUR
43334
43026
86360
15739
18251
33990
36.32
42.42
39.36
23.36
23.78
23.58
4
KOPPAL
17091
16880
33971
4765
5578
10343
27.88
33.05
30.45
7.07
7.27
5
KODAGU
3237
3212
6449
841
762
1603
25.98
23.72
24.86
1.25
0.99
1.11
6 BELLARY
41585
40791
82376
9362
10629
19991
22.51
26.06
24.27
13.89
13.85
13.87
7 BAGALKOT
9606
9468
19074
1881
2148
4029
19.58
22.69
21.12
2.79
2.80
2.80
8 BIJAPUR
5325
5049
10374
1079
965
2044
20.26
19.11
19.70
1.60
1.26
1.42
9 BIDAR
20062
19152
39214
3311
4066
7377
16.50
21.23
18.81
4.91
5.30
5.12
10 BELGAUM
25133
24224
49357
3570
5073
8643
14.20
20.94
17.51
5.30
6.61
6.00
11
9263
9027
18290
1462
1624
3086
15.78
17.99
16.87
2.17
2.12
2.14
12 MYSORE
25410
24643
50053
3328
3426
6754
13.10
13.90
13.49
4.94
4.46
4.69
13 GADAG
5601
5446
11047
654
788
1442
11.68
14.47
13.05
0.97
1.03
1.00
14 CHITRADURGA
26563
25496
52059
3025
3404
6429
11.39
13.35
12.35
4.49
4.43
4.46
15 DHARWAD
5297
5061
10358
651
623
1274
12.29
12.31
12.30
0.97
0.81
0.88
16 HASSAN
2996
2977
5973
369
360
729
12.32
12.09
12.20
0.55
0.47
0.51
17 UTTARA KANNADA
2256
2138
4394
248
256
504
10.99
11.97
11.47
0.37
0.33
0.35
18 DAVANAGERE
20772
19916
40688
2224
2342
4566
10.71
11.76
11.22
3.30
3.05
3.17
19 HAVER!
13233
12527
25760
1416
1442
2858
10.70
11.51
11.09
2.10
l.SS
1.98
1
CHAMARAJANAGAR
.
7.18
2
■9/03/2001
|makkala sameekshe statistics
CATEGORY: ST
DISTRICT NAME
6 - 14 AGE GROUP POPULATION
BOYS
GIRLS
TOTAL
I
JPROVISIONA __________
OUT OF SCHOOL CHILDREN
% OF OUT OF SCHOOL
IN 6-14 AGE GROUP______ CHILDREN WITHIN DISTRICT
GIRLS
TOTAL
BOYS
BOYS
GIRLS
TOTAL
% OF OUT OF SCHOOL
CHILDREN TO THE STATE
BOYS
GIRLS
TOTAL
20
MANDYA
8703
8506
17209
882
926
1808
10.13
10.89
10.51
1.31
1.21
1.25
21
SHIMOGA
5880
5734
11614
612
566
1178
10.41
9.87
10.14
0.91
0.74
0.82
22
KOLAR
20756
20398
41154
1797
2338
4135
8.66
11.46
10.05
2.67
3.05
2.87
23
CHICKMAGALUR
4415
4319
8734
394
405
799
8.92
9.38
9.15
0.58
0.53
0.55
24
BANGALORE RURAL
6259
6029
12288
412
519
931
6.58
8.61
7.58
0.61
0.68
0.65
25
TUMKUR
17374
16850
34224
1079
1178
2257
6.21
6.99
6.59
1.60
1.53
1.57
26
BANGALORE URBAN
11523
10745
22268
665
691
1356
5.77
6.43
6.09
0.99
0.90
0.94
27
DAKSHINA KANNADA
5859
5920
11779
135
125
260
2.30
2.11
2.21
0.20
0.16
0.18
4283
4627
8910
97
82
179
2.26
1.77
2.01
0.14
0.11
0.12
28 UDUPI
\
Datei7rS'03/2001
'
|MAI^\LA SAMEEKSHE STATISTICS
‘
CATEGORY: SC___________ _______________________________
(PROVISIONAL)
OUT OF SCHOOL CHILDREN
IN 6-14 AGE GROUP
TOTAL
BOYS
GIRLS
309763
145503
164260
|
%7Tf OUT OF SCHOOL
CHILDREN WITHIN DISTRICT
TOTAL
GIRLS
BOYS
15.55
16.79
14.36
% OF OUT OF SCHOOL
CHILDREN TO THE STATE
GIRLS
TOTAL
BOYS
100.00
100.00
100.00
DISTRICT NAME
6 - 14 AGE GROUP POPULATION
KARNATAKA
BOYS
1013134
GIRLS
978534
TOTAL
1991668
2 KODAGU
5916
5868
11784
2374
2184
4558
40.13
37.22
38.68
1.63
1.33
1.47
3
RAICHUR
47645
47306
94951
13916
17035
30951
29.21
36.01
32.60
9.56
10.37
9.99
4 GULBARGA
102175
98696
200871
29284
31189
60473
28.66
31.60
30.11
20.13
18.99
19.52
5
KOPPAL
23093
22810
45903
6316
6975
13291
27.35
30.58
28.95
4.34
4.25
4.29
6
BELLARY
43680
42846
86526
9683
11460
21143
22.17
26.75
24.44
6.65
6.98
6.83
7 BUAPUR
50223
47657
97880
11251
12499
23750
22.40
26.23
24.26
7.73
7.61
7.67
31820
31370
63190
6455
7904
14359
20.29
25.20
22.72
4.44
4.81
4.64
9 GADAG
16255
15812
32067
3189
3843
7032
19.62
24.30
21.93
2.19
234
2.27
10
HAVERI
19011
17997
37008
3260
3660
6920
17.15
20.34
18.70
2.24
223
2.23
11
BIDAR
42735
40807
83542
6783
7340
14123
15.87
17.99
16.91
4.66
4.47
4.56
12 DAVANAGERE
35866
34390
70256
4830
5690
10520
13.47
16.55
14.97
3.32
3.46
3.40
SHIMOGA
26768
26121
52889
3521
3896
7417
13.15
14.92
14.02
2.42
2.37
2.39
14 CHICKMAGALUR
21988
21543
43531
2891
2954
5845
13.15
13.71
13.43
1.99
1.80
1.89
DHARWAD
11271
10772
22043
1369
1506
2875
12.15
13.98
13.04
0.94
0.92
0.93
16 UTTARA KANNADA
10013
9518
19531
1154
1282
2436
11.53
13.47
12.47
0.79
0.78
0.79
17 HASSAN
31307
31147
62454
3671
4041
7712
11.73
12.97
12.35
2.52
2.46
2.49
18 CHITRADURGA
33563
32217
65780
3425
4197
7622
10.20
13.03
11.59
2.35
2.56
2.46
19 MYSORE
45742
44365
90107
4910
4889
9799
10.73
11.02
10.87
3.37
2.98
3.16
I
8
13
15
BAGALKOT
zOOl
'am
AKKALA SAMEEKSHE STATISTIC^ |
8
|
. YEGOR Y: SC
DISTRICT NAME
(PROVISIONAL)
6 - 14 AGE GROUP POPULATION
~BOYS"
"GIRLS
TOTAL
OUT OF SCHOOL CHILDREN
IN 6- 14 AGE G ROUP
BOYS " GIRLS
TOTAL
% OF OUT OF SCHOOL
CHILDREN WITHIN DISTRICT
’ boy’s
total"
GIRLS
% OF OUT OF SCHOOL
CHILDREN TO ' ’HE SI ATE
TOTAL
BOYS
GIRLS
20
BELGAUM
46355
44683
91038
4233
5130
9363
9.13
11.48
10.28
2.91
3.12
3.02
21
KOLAR
65532
64413
129945
5227
7183
12410
7.98
1 1.15
9.55
3.59
4.37
4.01
22
CHAMARAJANAGAR
2166!
21115
42776
1778
1746
3524
8.21
8.27
8.24
1.22
1.06
1.14
23
TUMKUR
46266
44873
91139
3385
4118
7503
7.32
9.18
8.23
2.33
2.51
2.42
24
MANDYA
21506
21029
42535
1493
1407
2900
6.94
6.69
6.82
1.03
0.86
0.94
25
BANGALORE RURAL
35684
34392
70076
2194
2297
4491
6.15
6.68
6.41
1.51
1.40
1.45
26
BANGALORE URBAN
78932
73638
152570
4072
4507
8579
5.16
6.12
5.62
2.80
2.74
2.77
27
DAKSHINA KANNADA
10631
10741
21372
539
505
1044
5.07
4.70
4.88
0.37
0.31
0.34
28
UDUPI
5643
6098
11741
116
126
242
2.06
2.07
2.06
0.08
0.08
0.08
48
cra^rf
?3erasja<±>
djoKvjacrod s^d esoB esodri^b - 1999-2000
o
a
n c \n c>fl
D. s\vu <
ds^rB
t
1 \PS £ S
U
d&i
di>3$
dti
sroeWsb
Bl't'n Schoo \ ( B -io)
i )
LADu
LADu
wsbcrod
Jj2o3$
-
&8oi) groid^ sraeJrisb
&8oi> srac3<a^ sraelrWj
'"’/-PsG A)
e<J
1
Zo&D
u
wsbcrasJ
xJsacO
LjLD
da=d
d&>3
i - •*
G Vi
do/Uted) cnj^d
520
104
122
746
2137
2016
3481
7634
559
1205
3971
5735
3216
3325
7574
14115
dorid/acb rodno^d
2783
11
101
2895
6277
228
987
7492
1236
867
678
2781
. 10296
1106
1766
13168
JojK’wib diu
•X
1079
|R->
228
1489
3027
1869
4799
9695
766
1386
2718
4S70
4872
3437
7745
16054
rMlwli
1729
13
131
1873
4878
261
477
5616
821
1168
614
2603
7428
1442
1222
10092
i. ..U
1279
20
116
1415
5372
556
870
6798
1232
758
262
2252
7883
1334
1248
10465
iwejad
3831
62
240
4133
7308
539
2192
10039
1728
618
1027
3373
12867
1219
3459
17545
adzioriO
1913
33
195
2141
5081
337
1147
6565
1288
709
797
2794
8282
1079
2139
11500
;i)dji/LCb
3673
5
152
3830
8354
363
1357
10074
1684
2220
1036
4940
13711
2588
2545
18844
MurioJjactS
1058
11
220
1289
4829
287
697
5813
712
821
536
2069..
6599
1119
1453
9171
tKVroo
2579
37
433
3049
12434
146
1503
14083
1307
3028
1324
5659
16320
3211
3260
22791
OtSddjd
1310
25
445
1780
5868
800
431
7099
635
1411
729
2775
7813
2236
1605
11654
padaad
485
28
138
651
4143
247
342
4732
395
518
441
1354
5023-
793
921
6737
ridri
516
4
73
593
3216
71
295
3582
487
730
345
1562
4219
805
713
5737
a,.->dcO
799
7
28
834
5082
130
452
5664
660
864
534
2058
6541
1001
1014
8556
49
esrfjzoori-a.
crazed zSejs^rod) djozuacrari
an
&8di) 533 j3<£d£ zraelrWo
<A
esoS esosMsi) - 1999-2000
sroeJri'A)
&>8ai eto^cSd^ sraeJritfj
2^L3J
u
l
2id
dfi2F0
edxjad wdxnad
d&>d
d&d
1_>UJu
^5if8
odjcrad
odxjad
d&d
d&d
taW
dear©
tsdjcrod
wdbnad
d&>d
d&d
daarO
wdonad
wd^crod
d&d
d&d
c/nJd jJ^gJ
2068
18
49
2135
5315
105
413
5833
711
1031
473
2215
8094
1154
935
10183
r »VJV0
786
0
331
1117
5965
55«
839
7362
915
609
432
1956
7666
1167
1602
10435
tkdd
508
40
111
659
4797
887
261
5945
1145
676
732
2553
6450
1603
1104
9157
rt^rte
2226
112
214
2552
7873
1205
1277
10355
2188
590
976
3754
12287
1907
2467
16661
804
15
118
937
2970
42
287
3299
725
221
199
1145
4499
278
604
5381
cQcd)t±©d)
1358
31
190
1579
3666
153
637
4156
831
203
411
1445
5855
337
1238
7480
uadxjatjdrtd
822
10
104
936
2457
206
224
2887
436
251
300
987
3715
467
628
4810
zJ^djri^jacb
1657
12
123
1792
4306
89
266
4661
899
687
358
1944
6862
788
747
8397
data «J^d
626
23
82
731
4397
1780
743
6920
1181
1223
502
2906 —■ 6204
3026
1327
10557
a^dd
3049
4
105
3158
5699
208
1096
7003
1787
873
765
3425
10535
1085
1966
13586
ixsdrt)
353
0
40
393
1716
131
336
2183
363
389
207
959
2432
520
583
3535
*..hod
1770
16
89
1875
5724
236
612
6572
1388
664
595
2647
8882
916
1296
11094
dj^xbad)
2081
91
157
2329
6370
744
1747
8861
1459
918
1165
3542
9910
1753
3069
14732
croabA
533
4
56
593
2697
2336
340
5373
748
719
191
1658
3978
, 3059
587
7624
oaziyd
42195
918
4391
47504
141958
16530
28108
186596
28286
25357
22318
75961
212439
42805
54817
310061
50
crazed
zSctostocl) croajeraS eso& escdri'A)
y
n
Disbntt^jisc-
- 1999-2000
W n^.nC
&>aai>
48ai> srad<3o= sraeJrWj
•u
*
__ Lh<;K Sc.hr £)
sradrWj
Vdear 0
fid
eixsad
UWu
d-id
»'
wsbera
wsberad
d&d
d&d
riwtrO
e?;bc»d
ed>c»d
d&d
dfed
-FT. U-. 1
d&d
d&d
t3ori^j»d) crodd
59946
56161
99026
215133
31564
40129
70532
142225
11450
36657
51427
99534
102960
132947
220985
456892
t5oritf.ocb rradraod
135832
6531
19768
162131
94046
5839
11572
111457
27375
29350
12616
69341
257253
41720
43956
342929
dortebwb dies
90489
47327
103874
241690
48135
33983
70835
152953
15471
47868
55763
119102
154095
129178
230472
513745
fidebdr
134067
10620
15627
160314
76064
8867
9286
94217
14951
31863
9643
56457
225082
51350
34556
310988
cadcartd
143551
20347
21873
185771
79429
15259
13758
108446
24786
18550
3634
46970
247766 '
54156
39265
341187
to<cn>d
191296
12201
44333
247830
112395
10156
26690
149241
43108
19135
14684
76927
346799
41492
85707
473998
idioriA
115119
9128
24389
148636
72721
7900
15124
95745
2524!
21113
11887
58241
213081
38141
51400
302622
abibifxb
200475
6168
■8795
225438
134144
8821
13059
156024
34179
59598
14325
108102
368798
74587
46179
489564
Eradotocd
169757
9401
23 960
203118
73190
6560
10568
90318
12183
26324
9440
47947'
255130
42285
43968
341383
ti^rpo
383019
6713
50823
440555
192636
13875
25917
232428
18157
91861
21162
131180
593812
112449
97902
804163
Oc^d
207193
21559
22612
251364
84851
12066
8168
105085
7758
35450
10792
54000
299802
69075
41572
410449
t^ddzrad
121257
12309
25843
159409
62144
12970
14295
89409
6727
30904
11992
49623
190128
56183
52130
298441
rtdri
94542
2816
10701
108059
48403
4007
5099
57509
7045
21598
5180
33823
149990
28421
20980
199391
a»deO
141525
3091
9909
154525
75827
3198
6685
85710
9207
23871
9649
42727
226559
30160
26243
282962
.cox-
&,
*
■
sosrt$civ a'JoA ro ocTasS, rf.sjdoori
d/j,
tJori^jsds
e)
-o
ai
■x'?-.’a 3000 de) Jd,?jd o-<w
*
^;<£»enc-A Cuood EOeScOOOd ctojadrto^ri
c’ )
^OaoPi cpjadiood mdrteb.
*
O
0L'.7i cSc5rtV0 vi SjO^ csscjiOn OjEjo crtjitfooj srocjfci cS/iOCi'rjsnS;.
10 u <ij 01./ (*i \> 0 c.
,d ooceiodK^ 6 aoc>
•3 C5O£'t5Oj|?T? cJcdd :-
14 we&Qfskradrf sadoDood cojsdri3%w
ioCD
ri:?w
nj£>£>Xc©rt
jL'jJrtsads
Zj3u,s’
STOSrxj
-’..
11.53
"ri.
6
ieSci.
Oorf
?•
11 72
2jCjJ239iij)
ci^rf. J
ai’uCj.
14
EjOjJSEjJS^Cj
GSttrfO
.<
v
42335
SjuSTn1!?
11.12
10,53,744,
r->
Sid-.'3
G
c3
53«5oj?ocj
i:Tl7;j
Zx)C5oIOOCj
ci.^riMcJ
nOCji
Jjja.v
6
Ooci
14
S. cijSc'"/
17.65
Soc£> woOrf.
l/OlEO
6 OOCf
C--
ci
14
jSolOSS53Ffa> EfcStfC dfjfcg
0 Cl
27L O’y. ^OC^ C6-? Jrb’J vjCjO UD£5CjC>
S53
ul-ii-SjJ
1 14
SUZ
'J
( 2060
6
14
(30961),
32.60
30.11
28.95
z:
ty
24.26
J
(
22.72
14359 ),
8 Z
6
175567
OoCj
14
« 56.67 uS
(
242 )
zsai.Cj;
s!,
eJ
6
37.22
O'
81
2.07
El
oi
‘Cur >
TSOjZZ
41.31
( 10343
),
*
Iracs
C..-3
(
19991
24.27
.ooj:
19.70
;
3
(
24 26
)
21.12
(
2044
),
a
18.81
cQSjOlOOi
*
!O7
6
OOw
1603 ),
2.01
(
179
),
7
3*
14
1.77
unicef
itigating
fluorosis
through safe
drinking water
jife
■ '
.y •? .*» '
if■
•
. ------— "
Contents
I
introduction
II
options for safe water supply
III
testing for fluoride
IV
health care
V
initiatives and challenges
VI
frequently asked questions
Fluorosis is caused by ingestion of excess fluoride over
a long period. It affects multiple tissues, organs and
systems of the body, and results in a variety of clinical
manifestations, culminating in a crippling condition and/
or damaged and discoloured teeth. Fluoride can enter
the body through drinking water, food, drugs, dental
products and industrial emissions.
Fluorosis appears in three forms-dental fluorosis, which
affects children, sets in if the foetus, infant or child is
exposed to fluoride during the period when its teeth are
developing. Persons with fully developed teeth will not
be affected by dental fluorosis, even if they are exposed
to fluoride. Skeletal fluorosis and non-skeletal (soft tissue)
fluorosis, affect people of all ages. Fluoride can damage
a foetus if the mother consumes water/food with high
fluoride concentration during pregnancy.
The damage caused due to dental and skeletal fluorosis
is irreversible. Only non-skeletal fluorosis can be
reversed. Dental and skeletal fluorosis have no treatment
or cure. Prevention is the only solution, provided the
disease is detected in the early stages. Non-skeletal
symptoms appear in a shorter span of time, and are
water in several countries, including Algeria,
Argentina, Australia, several African nations,
Bangladesh, China, Egypt, Iran, Iraq, Japan,
Jordan, Libya, Mexico, Morocco, New
Zealand, Pakistan, Palestine, Sri Lanka, Syria,
Thailand, Turkey and UAE.
Extent of the problem in India
The problem of excess fluoride in ground water
was detected in many states of India as early as
the 1930s. Till 1999, as many as 17 states have
been identified with the problem of excess
fluoride in ground water sources.
helpful in early detection of the poisonous
effects.
Occurrence of fluoride
Fluorine gas is a highly reactive element, and
is, therefore, not found in nature in its free form.
The main occurrence of fluorine in rocks is in
the form of fluoride-bearing minerals like
fluorite and fluoroapatite. India has among the
largest resources of these minerals. In such
areas, ground water drawn through wells,
handpumps and especially tube wells, is likely
to contain excess fluoride due to the dissolution
of fluoride from fluoride-bearing minerals.
Therefore, these areas are generally endemic.
Apart from India, high concentration of
fluoride has been detected in the underground
Rajasthan and Andhra Pradesh are the most
severely affected states. Rural populations,
which depend mainly on groundwater for their
drinking water supply are the worst affected.
Vulnerability to fluorosis is higher if the
nutritional status is poor-malnourished
children and pregnant or lactating mothers are
especittliyVulnerable. Social and economic
implications oFTTuorosis endemicity are
enormous, especially for the rural population
living below poverty line.
Prevention is the only
solution as there is no cure...
Early detection of fluoride toxicity
manifestations is crucial for introducing
preventive measures. Possible interventions for
prevention:
c
■
Use of safe water for drinking and cooking
with fluoride concentration as low as
possible, but not more than 1 mg/litre.
Intake of diet rich in calcium, vitamin C, E
and anti-oxidants.
Situation in Indian states
The problem of excess fluoride in ground water is endemic in 17 states of India. The level of endemicity,
however, varies in different states-from one affected district in Jammu & Kashmir and three in Kerala to all
32 districts affected in Rajasthan. An estimated 66 million people are at risk.
Fluoride Contamination in Drinking Water
mlation consuming fluoride-contaminated
)9) in the 17 endemic states
State
_
Total Population Rural Population
Rural pop. at risk
Percentage of
(million)
total pop. at risk
(million)
(million)
Andhra Pradesh
74.62
52.31
13.50
Bihar
98.12
83.67
na
na
Delhi
13.42
1.23
**
0.16
1-1.4%
Gujarat
47.56
29.45
4.78
10.1%
10.9%
18.1%
Haryana
19.83
14.57
2.17
Jammu & Kashmir
9.71
7.22
na
na
Karnataka
51.65
34.42
6.90
13.4%
Kerala
32.08
22.43
na
na
Madhya Pradesh
78.81
58.36
1.68
2.1%
Maharashtra
90.45
52.84
0.14
0.2%
Orissa
35.53
29.80
3.26
9.2%
Punjab
23.28
16.05
2.07
8.9%
Rajasthan
52.94
39.82
10.90
20.6%
12.4%
Tamil Nadu
61.43
39.19
7.64
Uttar Pradesh
167.66
130.83
11.77
7.0%
West Bengal
78.32
56.21
1.65
2.1%
Assam
v:All India
*
25.88
22.62
na
na
961.29
691.02
66.62
6.9%
options for
safe water supply
Nearly 90 per cent of the rural population in
India use ground water from open dug wells
and handpumps for domestic purposes.
Many of these sources are liable to contain
fluoride in excess of the permissible limit of
1 mg/Iitre.
Water supply options
If the fluoride level in a water source is
higher than the permissible limits, the
following alternative measures should be
considered:
o
A village usually has more than one
source of water and it is rare for all of
them to be contaminated by fluoride.
The spread of fluoride is not homogeneous.
roughing-cum-slow sand filter to remove
In many cases, it is found that a safe water
source is not very far-off from a
turbidity and bacteria from surface water.
contaminated source. Therefore, the first
thing to do is to test all water sources (both
private and public), mark the sources with
arsenic-affected areas in Bangladesh.
Such simple filters have been introduced in
•
excess fluoride and create awareness about
sources which are safe for drawing drinking
water. Water vending could be considered
if sources are far off.
o
o
Low-fluoride water may be obtained from
an aquifer strata in a location other than the
existing one. It may also be possible to
pump low-fluoride water from a distant
source. For example, many villages in
Ananthapur district in Andhra Pradesh, are
getting low-fluoride water from a distant
source. Availability of a sustainable lowfluoride water source nearby, ease of access
to villages/hamlets, affordable capital costs,
potential for recovery of operation and
maintenance costs from users and power
availability are the major factors to be
considered in this option.
In areas where deep tube wells with low
fluoride levels are not feasible, it is possible
to treat surface water and make it safe for
drinking and cooking, using a sophisticated
treatment plant (which requires regular
maintenance) or a simple horizontal
The concentration of fluoride can be reduced
by mixing low-fluoride water with high-
fluoride water in appropriate proportion, if
a suitable water source of acceptable quality
with regard to fluoride and other constituents
is available within reasonable distance. Such
an approach is being tried in a few villages
of Kolar district, Karnataka.
•
Rainwater harvesting has been practised
in many parts of India for centuries.
Rainwater can be collected from rooftops
at the household level during monsoon in
sufficient quantity for drinking and cooking
purposes. Studies have shown that properly
stored rainwater can remain free from
harmful bacteria for several months. The
artificial recharge technique can be used
to restore groundwater levels and decrease
fluoride concentration in wells.
The
harvested rainwater is transferred to
aquifers either through percolation tanks
or through dug or bore wells. Decrease in
groundwater fluoride level after artificial
recharge of the surface water from a pond
has been reported in two villages, in
Andhra Pradesh and Karnataka.
Defluoridation
Defluoridation is the removal of excess fluoride from water. It should be
considered only if none of the other solutions can be used. Defluoridation
methods can be broadly classified into two categories—precipitation and
adsorption/ion exchange.
Precipitation methods
These methods involve the addition of a soluble chemical to the water, which
leads to fluoride precipitation and/or adsorption of fluoride on the precipitate
formed.
1.
Lime treatment: Excess fluoride can be removed from water, which also
contains high magnesium hardness, by adding lime. This method is
economical only when removal of both fluoride and hardness are required.
Even then, this is effective only for waters with a fluoride concentration
in the range of 3-4mg/litre.
2.
Alum coagulation: The addition of high doses of alum results in the removal
of fluoride from water. Large alum doses, however, can lead to the
presence of high residual aluminium in the treated water, if proper
precautions are not taken. Though one of the earliest methods of fluoride
removal, alum coagulation is not very popular for drinking water treatment
in developed countries, mainly due to the large volume of sludge and
decrease in pH in the absence of adequate alkalinity.
3.
Nalgonda technique: This method was developed in India in 1975 by the
National Environment Engineering Research Institute (NEERI). It
involves the addition, in sequence, of lime, bleaching powder (optional)
and filter alum in the fluoride-rich water and rapid mixing, which results
in the formation of alum flocs (coagulation). These flocs are allowed to
settle (sedimentation) and the supernatant water, which is free of excess
fluoride, is filtered. Fluoride removal is probably due to the formation of
polyhydroxy aluminium complexes with fluoride and their adsorption
onto polymeric aluminium hydroxides.
This technology is simple and economical (cost of filter is Rs 700 only), and is
very popular in India. However, it requires periodic monitoring of water
quality to ensure that the fluoride is removed and no residual aluminium ions
are present in treated water. In the absence of effective hydrolysis of aluminium
salts, residual aluminium will remain in treated water. The alum and lime
dosage varies from source to source depending on the alkalinity and fluoride
level in the raw water.
depends on the iron and aluminium content
Adsorption/ Ion exchange methods
In these methods, the fluoride-rich water is
passed through a bed containing defluoridating
of the clay used.
5.
Activated alumina: Defluoridation of
drinking water by activated alumina is the
material. Fluoride is retained by the material
due to physical, chemical or ion exchange
interactions.
method of choice in developed countries.
Activated alumina’s affinity for fluoride is
1. Ion exchange resins: Generally, anionic
very high, and its fluoride uptake capacity
exchange resins have not been found
effective for fluoride removal due to the
competition from other anionic constituents
is higher at higher concentrations of
present in natural water. Ion exchange
plants, home units have also been
developed, which can be attached to taps.
systems have not gained popularity
because of cost considerations and the lack
of specificity of anion exchange resins.
2. Activated carbon: Although activated carbon
has a high fluoride uptake capacity, its major
limitation is the acidic pH optimum of 3 for
maximum removal. This method is costly,
as the pH of water has to be brought down
to 3 initially for defluoridation and raised to
neutrality again to make the treated water
suitable for drinking.
3. Bone char: Bone char is ground animal
bone that can be charred to remove all
organic matter, and is essentially tricalcium
phosphate and carbon. It has been used
successfully to remove excessive fluoride
from drinking water. The principle of this
method is the exchange of carbonate ion of
the bone char with fluoride ion present in
water. This method is constrained by the
culture among Indians who would not like
to consume water treated with bone.
4. Brick: A low-cost domestic defluoridation
unit has been developed in Sri Lanka, using
freshly burned brick pieces as the
defluoridation medium. Details on this
material are still to be studied but it is
probable that the defluoridation capacity
fluoride in water. In the USA and many
European countries, apart from full-scale
The Indian Institute of Technology (IIT)
Kanpur has developed defluoridation
systems based on activated alumina
technology, including a domestic
defluoridation filter and a handpumpattachable defluoridation plant. Domestic
filters using activated alumina have been
well received by users. The drawback of
this technology is that the fluoride uptake
capacity of activated alumina gets exhausted
after it has absorbed a certain quantity of
fluoride from the water. Exhausted activated
alumina can be regenerated, but dais must
be done in specialised centres by trained
personnel, as it requires the use of
aggressive chemicals. Therefore, in the
promotion of this technology at household
level, the challenge is to establish efficient
regeneration centres and mobilizing users
to bear full O&M costs which in most cases
could be Rs. 25 every 4-5 months. Use of
proper grade of AA is a must to obtain
satisfactory results.
In India, Nalgonda technique has been
extensively used in large-scale water treatment
plants. At the household level, both Nalgonda
as well as AA-based domestic defluoridation
units are in use.
testing for
fluoride
Considering the toxic effects of fluoride, each water source used
for human consumption should be tested for microbiological,
physical and chemical parameters, including fluoride. As per
the Bureau of Indian Standards (BIS) the current permissible
limit for fluoride is “Img/litre, but lesser the better, as fluoride
is injurious to health”. Malnourished children can be affected
even at fluoride levels below 1 mg/litre.
WHO’s guideline value for fluoride
The World Health Organisation has set 1.5 mg/litre as the
guideline value for fluoride content in drinking water. This
value is intended to be used as a basis for the development of a
national standard. In setting a national standard for fluoride,
however, it is particularly important to consider climatic
conditions, volumes of water intake, and intake of fluoride from
other sources (e.g., food, air) and other factors.
The guideline value of 1.5 mg/litre, which was set in 1984 by
the WHO, is under review, as part of an overall review of the
WHO guidelines for drinking water quality parameters. The
recent International Workshop on Fluoride and Defluoridation,
held in Chiang Mai, Thailand, 20-24 November 2000, has
recommended a reduction in WHO guideline value from 1.5
mg/litre to 0.5 mg/litre.
Fluoride-testing Ion meters
The most accurate and reliable method of testing for fluoride
is the Ion selective electrode method, using the Ion meter. In
WQM. It needs to be accorded a high
1989, the Rajiv Gandhi National Drinking
Water Mission took a decision to acquire
national priority, and suitable institutional
mechanisms at national, state, district and
fluoride-testing Ion meters to equip the water
quality testing laboratories in the endemic
•
states.
there is need to strengthen district water
testing laboratories for the refinement of
water-quality data. Water maps must be
One hundred and thirty-nine Ion meters have
so far been imported and personnel Rained on
the use, operation and maintenance of the
equipment. The Ion meters were handed over
only after training of water analysts from the
block levels need to be developed.
To facilitate informed decision-making,
prepared for all villages using geographical
•
information system (GIS) applications.
Improved coordination between state water
district laboratories. This programme was
sponsored by WHO and UNICEF.
supply agency and state health department
is a must to take informed decision and
Water-quality monitoring
target investment in rural water supply
more efficiently. In fact, the health
Water quality monitoring (WQM) is a weak link
and this programme component needs to be
strengthened as soon as possible. The
challenges and possible approaches to address
these challenges are discussed below.
o It is absolutely necessary to test and
periodically retest all water sources (private
as well as public). This, however, does not
take place as states do not accord the degree
of priority that WQM deserves. The
biggest challenge is to raise the profile of
o
department should play an active role to
prevent recurrence of water-borne diseases.
Considering the widespread sources of
water, it is not possible for district
laboratories to test and retest water
periodically. The panchayats and members
of the community, including teachers and
educated youth, need to be involved in
water-quality monitoring of water sources
in their village, with the help of reliable and
user-friendly field kits.
Methods of testing fluoride levels
Methods used for testing fluoride in drinking water
are:
• SPAND’s method using spectrophotometer,
measuring the colour developed at 540nm
• Alizarin red method, using photometer
• Titrimetric method
® Ion selective electrode method
• Portable kits of a wide range have been developed
by research institutions in India. An evaluation
of field test kits carried out by Sriram Institute
for Industrial Research, New Delhi, indicates that
the test kits developed by die Central Pollution
Control Board and Development Alternatives,
New Delhi, are considered user-friendly and
reliable.
As even marginally high fluoride levels can induce
the disease, a sensitive method of estimation is
extremely important. If the fluoride content in water
is high, the margin of error diat is likely to occur
due to the choice of method would be greater if a
sensitive method is not used.
The prolonged intake of water containing
excess fluoride causes the crippling disease
called fluorosis. The first case of endemic
fluorosis in India was reported from Andhra
Pradesh in 1937. By 1999, the disease was
known to be endemic in 17 states in 1999, and
an estimated 66 million people were assessed
to be at risk.
Nutritional deficiencies, combined with excess
fluoride intake through water, appears to
aggravate the manifestations due to fluoride
poisoning.
Clinical manifestations
Prolonged ingestion of high fluoride by
humans manifests itself as dental, skeletal and
non-skeletal fluorosis.
Dental fluorosis
Mottling of teeth in children is one of the earliest
and most easily recognisable features of
fluorosis. In mottled teeth, the enamel loses its
lustre and becomes rough, opaque and chalky
white. A yellow-white discolouration appears,
joints leads to deformities of hip, knee and other
which turns brown and presents itself in
joints, causing severe disability. Skeletal
horizontal streaks. In late stages, the teeth
become black. They will be pitted or perforated,
fluorosis usually becomes crippling in people
in the endemic regions.
and may even get chipped off. There is also
premature loss of teeth. Dental fluorosis is
irreversible and incurable. However, it does
Newcomers to an area with high levels of
not occur if there has been no exposure to
symptoms within a few years of their arrival.
fluoride in the first decade of one’s life.
Hard manual labour that necessitates higher
fluoride in drinking water may develop skeletal
intake of drinking water and poor nutrition are
Skeletal Fluorosis
factors which aggravate the development of
Early symptoms of skeletal fluorosis include
skeletal fluorosis.
pain and stiffness in the neck, back and major
joints. Restriction of movements commences.
The stiffness steadily increases until the entire
spine becomes one continuous column of bone,
manifesting a condition referred to as “poker
back”. Finally, various ligaments of the spine
become ossified. The stiffness that first appears
in the spine spreads to various joints in the
limbs. The involvement of the ribs gradually
reduces the movement of the chest during
breathing. The increasing immobilisation of
Non-skeletal fluorosis
Non-skeletal fluorosis affects the body’s soft
tissues: ligaments, muscles, red blood cells,
blood vessels, sperms and gastro-intestinal
system. Symptoms include:
° Gastro-intestinal problems: Acute stomach
pain, diarrhoea, constipation, bloated
feeling (gas), nausea (flu-like symptoms),
mouth sores and loss of appetite. These
complaints are considered early warning
Nutritional prophylaxis ■
A properly designed nutritional regimen can beneficially interfere with
the toxic effects of fluoride. Diets rich in calcium, vitamin C, E and anti
oxidants are beneficial. These can be obtained from various sources, which
are not very expensive They can be produced in the rural areas without
much investment.
Calcium: Milk and milk products, green leafy vegetables, jaggery
Vitamin C: Amla, lemon, oranges and tomatoes
Vitamin E: Vegetable oil, nuts, wholegrain cereals, green vegetables, and
dried beans
Anti-oxidants: Garlic, ginger, carrot, white onion, green leafy vegetables,
papaya, pumpkin
signs of fluorosis.
•
Neurological manifestations: Nervousness,
depression, tingling sensation in fingertips
and toes, excessive thirst and tendency to
urinate frequently.
®
Muscular manifestations: Muscle weakness,
stiffness and pain.
•
Allergic manifestations: Painful rashes on
the skin, prevalent in women and children,
which clear up in 7-10 days.
•
•
Urinary tract manifestations: Urine may be
much less in volume; yellow-red in colour,
and itching in the urinary region.
Headache
o
Ligaments and blood vessels calcify and
may show up in radiographs.
o
Sperm abnormality results in infertility.
°
Fluoride can damage a foetus if the mother
consumes water/food with high fluoride
concentration during pregnancy. It can
adversely affect the IQ of children.
The above-mentioned symptoms can also be
of fluorosis. People in hot climates and outdoor
labourers generally have a higher intake of
fluoride because of a larger intake of water.
Malnourished children, pregnant women and
lactating mothers are also especially
due to other reasons. Therefore, the challenge
before the medical officers is to differentiate and
distinguish the symptoms due to fluorosis from
vulnerable to fluorosis.
other reasons. Non-skeletal fluorosis can be
In people with exposure and those with clinical
and subclinical symptoms, tire only available
reversed within a short span of time if a person
Management of fluorosis
starts taking low-fluoride water.
measure as of today is eliminating the intake
of fluorides. No chemical till date is capable of
High-risk groups
extracting fluoride absorbed in the body. In
patients with disease symptoms, the following
Existing data indicate that some sections of the
population are more susceptible to the toxic
effects of fluoride. These include people with
deficient intake of calcium, vitamin C, E and
anti-oxidants, the elderly, and people with
cardiovascular and kidney problems. Poor
nutrition increases the incidence and severity
interventions should be practised:
o Reduce as much as possible the fluoride
intake though water and food
• Practice consumption of diet rich in
calcium, vitamins C, E and anti-oxidants
Public awareness and health
education
A massive campaign is required to spread
information about the importance of using safe
water, better nutrition for proper health. Even
doctors are not always able to identify fluorosis
symptoms correctly. There is a need for
training of medical and paramedical staff. The
media, especially television, should be utilised
to reach people who are at risk. Experts should
educate the people in their own language and
dialect about the following aspects:
o Fluoride in drinking water and its
relationship with fluorosis
e
Symptoms of fluorosis
o
o
Sources of fluoride
Preventive measures such as use of safe
water, defluoridation of water and
o
improved diet
Who are at risk and when to seek medical
o
advice
Impact of nutrition on severity of fluorosis
A successful awareness and health education
programme should lead people in endemic
areas to demand fluoride-free water from the
district/local and state government, use safe
water and take nutritious food. This will also
ensure active community participation in
intervention programmes.
initiatives
and challenges
Government and various official agencies,
organisations of the U.N, international donor agencies
and NGOs have taken the following significant
initiatives.
Government of India Initiatives
1.
In 1987, the Government of India (GOI),
established the National Fluorosis Control Cell at
the All India Institute of Medical Sciences, New
Delhi to implement human resource development
involving training of medical, para-medical staff
and engineers, and awareness generation among
grassroots levels functionaries. The cell also
carried out extensive R&D programme wherever
necessary.
2.
Around the same time, several R&D projects
were initiated by GOI to develop defluoridation
and water-testing technologies.
3. The Rajiv Gandhi National Drinking Water
Mission (RGNDWM), decided to support the
UNICEF’s Initiatives
UNICEF has been working closely with the
Government of India and other sector partners
to assess safety conditions and implement
specific fluorosis mitigation programmes. This
is part of a comprehensive effort to ensure safe
water environments.
Some of the key areas of intervention have
establishment of water testing laboratory
been in the strengthening of water-quality
in each district and implementation of
water supply projects in all water quality
monitoring systems, facilitating research and
affected states, by contributing 75% of the
systems and advocating alternative water
cost, leaving 25% to be borne by the state
governments. Seventy major water supply
supplies when necessary. Education is key to
schemes with a total outlay of Rs. 7173
million have been implemented, to cover
a population of 8 million, spread over
root implementation
4,625 habitations in 10 states under tine Sub
mission on Control of Fluorosis.
4. RGNDWM is also in the process of
establishing a Centre of Excellence for
Fluorosis to provide support to all states in
their fluorosis mitigation efforts.
development of household water treatment
UNICEF’s strategy, with emphasis on grass
of water safety
procedures. A number of demonstration
projects have been initiated in fluorosis-affected
areas. UNICEF accords high priority to water
quality related issues. Some of the initiatives
are listed below.
°
Strengthening district water-quality
laboratories by supplying Ion meters and
training of water analysts.
Rajiv Gandhi National Drinking Water Mission:
Guidelines for fluoride control
•
To identify and label any potable source (“SAFE”) and educate the
e
population to conserve/ use the source for drinking and cooking only.
To tap safe - low fluoride - aquifers
•
To arrange for blending of water from different sources to obtain
adequate quantities of safe water, and to supply this potable “mixture”
through designated “safe” stand posts.
o
•
To provide piped water supply schemes through distant sources; and
To provide community treatment plants to remove excess fluoride.
o
o
®
o
o
Development of activated alumina-based
domestic defluoridation by the Indian
with State Governments, users and NGOs.
These include Ananthapur in Andhra Pradesh,
Institute of Technology, Kanpur.
Evaluation of water field test kits by Sriram
Institute for Industrial Research, New Delhi.
Dungarpur and Tonk in Rajasthan, Kanpur
Dehat in Uttar Pradesh and Chandrapur in
Maharashtra. These projects are implemented
Development of an improved fluoride field
test kits by the National Chemical
through local NGOs, panchayats and
community groups, and include:
Laboratory, Pune.
Preparation of the State of the Art Report
on the Extent of Fluoride in Drinking Water
and the Resulting Endemicity and
preparation of a Handbook on Planning and
•
Implementation of Water. Supply Projects
in Fluorosis Endemic Areas by Fluorosis
Research & Rural Development Foundation
(FR&RDF), New Delhi.
Desk review of Impact of Nutrition on
•
the help of doctors to understand the
magnitude of the problem, as well as to
provide basic data on the health status of
the families in the area. This information
is vital for subsequent impact assessment
®
studies.
Testing of all drinking water sources in the
o
project villages.
Habitation contact chives to build rapport
o
with the communities and involve them in
project activities.
Domestic Defluoridation Units (DDUs)
o
introduced on cost sharing basis.
Training workshops for youth volunteers,
Fluorosis by Indian Toxicological Research
o
o
o
o
o
o
o
Centre, Lucknow.
Supply of over 100 Ion meters
Training of water analysis on the operation
and maintenance of Ion meters.
Training of medical, para-medical and
grassroots level workers.
DWCRA groups and village sarpanchs,
focusing on building awareness on
water quality, and means of removing
internal and external contamination,
followed by a demonstration on the use of
Standardisation and promotion of field
proven technologies.
Development of local manufacturing
capacity for activated alumina and AA-
based filters
Providing support to SWACH for the
effective implementation of GOI assisted
fluorosis control project in four districts of
Rajasthan
Desk reviews, evaluation studies, and
preparation of guidelines for use in the field.
Selection of beneficiaries on the basis of
an initial baseline survey.
Epidemiological surveys conducted with
o
the DDUs.
DDU promotional camps at the village
level, where the use, maintenance and
regeneration aspects are highlighted.
DANIDA’s initiatives
The DANIDA assisted Rural Drinking Water
Further, UNICEF has initiated demonstration
Supply and Sanitation Project (RDWSSP)
projects in fluoride affected states in cooperation
aims at improved and sustainable drinking
Facilitating Domestic Defluoridation
UNICEF has facilitated the design of a domestic defluoridation unit (DDU),
which can be used at the household level. The DDU is essentially a water
filter, which uses activated alumina (AA) to remove excess fluoride from
drinking water. UNICEF has introduced such filters in many affected
areas. Household pays part of the cost of the filter and meets full cost of
regeneration. The demonstration projects are in Tonk and Dungarpur
districts in Rajasthan, Kanpur Dehat in U.P., Ananthapur district in A.P.
and Chandrapur district in Maharashtra.
water supply to about 700 habitations (villages)
in the Kolar, Chitradurga and Bijapur districts
in Karntatka. The project is based on
decentralised,
demand-driven
and
participatory approaches, and aims at
strengthening of the lowest appropriate level
of Panchyat Raj Institutions. In addition to the
state-level line departments and the
organisations under the CEOs of Zilla
Panchayats, the project includes Danidasupported professionally competent Project
Advisory Group based in Bangalore, and
District Coordination Units at district level.
The DANIDA supported units provide
professional advice and assistance in project
implementation. As the project addresses the
technical needs in the context of the existing
social environment, it entails both hardware
solutions to excessive fluoride contents in the
groundwater” was adapted as one of the four
objectives of the project.
The
key
components
of
DANIDA
interventions include:
o A programme of dual water supply
(phase I: 1996-2002 ) in Kolar, Chitradurga
and Bijapur districts, in which low-fluoride
water is supplied for drinking and cooking,
while the water with high-fluoride content
is used for other purposes.
o
A study commissioned (1998) on the
technical options for fluoride-free water in
Sri Lanka and several African countries.
Other Initiatives
and software inputs from RDWSSP.
The Fluorosis Research & Rural
Development Foundation
Drawing upon experiences gained in the earlier
The Foundation established by Prof. (Dr) A.K.
Susheela is guiding the fluorosis mitigation
DANIDA supported Integrated Rural Water
Supply and Sanitation Project (1990-96) and
findings of ‘quick’ water-quality surveys,
programmes of the various state governments.
The Foundation is not only a diagnostic centre,
but also acts as a Global Consultation Centre
“development and testing of appropriate
for fluorosis mitigation programmes.
Key interventions are listed below:
•
provides the basic data for further study and
impact of the scheme on the health hazard
of the rural people who are using the kit.
Imparting training to doctors, public health
engineers, paramedical workers, grass-root
level functionaries, anganwadi workers,
o
160 Animators have been appointed for 220
villages, with 17 coordinators appointed for
supervision of the animators work.
o
4152 kits have been distributed in
the different household in 220 villages.
o
Regeneration rooms were established in
village sarpanchs, school teachers and other
NGOs.
°
Developing communication material for
professionals
functionaries.
and
grass-root level
167 villages. 1612 activated alumina kits
have been regenerated
A handbook for public health engineers entitled
A Handbook on Planning and Implementation
of Water Supply Programmes in Fluorosis-
o
4134 water samples have been analysed
with Elico meter and Ion meter.
Endemic Areas is under preparation by the
Foundation under the aegis of UNICEF.
o
Village contact drives in 220 villages were
conducted upto September 2000.
o
13 training workshops were organized
between November 1999 and August 2000,
covering various categories viz. public
health engineers, health workers,
A Treatise on Fluorosis, for the faculty of the
medical and dental colleges, as well as other
health professionals, is under preparation;
dealing with the medical aspects of the disease,
it is the first publication of its kind on fluorosis.
o
Sanitation Water And Community Health
The SWACH project was started by the NGO
in 1999.
Coverage: 220 villages in four districts of
Rajasthan - Dungarpur, Udaipur, Rajsamand
and Banswada.
Implemented by: SWACH with funding from
grassroots level workers, doctors,
animators and coordinators.
Five types of posters, flip books and songs
have been printed. All have been given to
animators. Eight cards on Fluoride and
Fluorosis and its Preventive Strategies for
Implementation by tire Community have
been designed by FR&RDF, Delhi and
distributed
to
all
animators
and
coordinators in 220 villages. 1159 wall
paintings have been painted on the main
locations of the villages.
the Rajiv Gandhi National Drinking WaterMission
Pilot project in Dungarpur
Coverage: Eight villages of Aspur block,
Key Components:
o House to house survey, water source
survey, village mapping etc., has been
completed in all the villages. The survey
Dungarpur district, Rajasthan.
Implemented by: The Society Affiliated to
Research & Improvement of Tribal Areas
(SARITA) and SWACH
their active involvement to ensure
sustainability.
Key Components:
•
»
®
o
o
o
e
o
Baseline survey (house-to-house survey to
identify fluorosis patients, dietary habits,
PRA mapping, collection of water samples
from potable sources, labelling of safe
sources).
Pre- and post-monsoon water analysis (in
Project in Ananthapur
state PHED laboratories).
Awareness generation and development of
IEC (wall paintings, slogans, posters, audio,
streetplays, etc)
Distribution of Nalgonda defluoridation
containers sets and AA filters, along with
the chemicals required, as well as training
on their use.
Pre- and post-intervention clinical
Panchyati Raj Department and the community
examination of patients.
Field testing of defluoridated water, as well
as monitoring.
Cost sharing by users.
Constitution of “Pani Panchayats” and
Coverage: 25 villages, targeting a population
of 18,256
Implemented by: the NGO MYTRY Social
Service Society, the Rural Development and
Achievements: 1540 DDUs introduced in 25
villages
• 3750 DDUs sold directly to households by
MYTRY’s Rural Sanitary Mart
• Innovation in design using clay and plastic
containers, so as to make the DDUs more
affordable to the poor
• Rural Development Trust (RDT), an NGO
working in nearby areas which there is a
fluorosis problem also adopted this
intervention and procured 1000 DDUs
from MYTRY for sale in their project area.
UNICEF has facilitated the implementation of
project SWACH and the pilot projects in
various ways.
Frequently
Asked Questions
1.
What are the main sources of drinking water?
Drinking water comes from various sources such as
groundwater, surface water (lakes, ponds, rivers, etc) and
rainwater. Surface water is heavily contaminated with bacteria
and has been a major cause in the past of morbidity and
mortality. Rainwater is not a seriously exploited resource in
India. Piped water supplies that rely upon surface water, treat
water for pollutants, including microbial pathogens before
supplying it to households. Nearly 90% of the people in rural
India depend on ground water.
What happens as a result of prolonged intake of
excess fluoride in drinking water?
Long term ingestion of fluoride beyond permissible limits can
cause mottled teeth (dental fluorosis) and debilitating bone
ailments (skeletal fluorosis). These are irreversible. A diet low
in calcium, vitamins C, E and anti-oxidants contributes to the
severity of fluorosis. Non-skeletal symptoms, which appear in
2.
a shorter span of time, affect the body’s soft tissues—ligaments,
muscles, red blood cells and gastro-intestinal system.
What is the extent of the problem of fluoride
contamination of drinking water in India?
The presence of fluoride in India’s water has been known for
six decades. Till 1999, as many as 17 states have been
3.
identified with the problem of excess fluoride in underground
water sources. Current estimates are that in India, nearly 66
million people are at risk. Rajasthan and
earth’s crust. Areas with fluoride-rich rocks are
Andhra Pradesh sire the most severely affected
prone to fluorosis endemicity.
states. Rural populations, which depend mainly
Is fluorosis contagious or infectious?
on groundwater as drinking water source, are
8.
the worst affected.
No, it is not. One cannot get fluorosis by being
with an affected person or by touching or
4.
What is the maximum permissible
embracing them.
limit of fluoride concentration in
drinking water?
The WHO guideline value is 1.5 mg/litre.
However, in 1992 the Bureau of Indian
Standards, in view of the serious health problems
prevailing in India due to fluoride contamination,
What should be done if a drinking
9.
water source contains excess
fluoride?
First, all nearby sources should be tested for
fluoride concentration. If a safe source exists,
has amended the limit for fluoride in drinking
water to 1 mg/litre, as tine upper limit which the
body may tolerate, but lesser the better as fluoride
people should be told about it and encouraged
to draw drinking water from the safe source.
is injurious to health.
using a safe source will be a good option. If no
safe source is available, the options are tapping
Even water-vending by a community member
Are there other chemical
of safe aquifer, pumping water from a distant
contaminants in the groundwater in
safe source, conventional treatment of surface
India?
Contamination due to other elements like
arsenic, nitrates, iron and salinity is also known
water before use, rooftop rainwater harvesting,
to occur in India.
10.
5.
6.
Where does the fluoride in
aquifer recharge and lastly defluoridation.
Can fluoride be removed from
drinking water?
Fluoride can be removed by various
groundwater come from?
In areas with fluoride-rich minerals and volcanic
rocks, groundwater sources such as wells,
defluoridation methods. In India, two treatment
handpumps and tube wells are likely to contain
filters (adsorption) are used for removal of
fluoride from drinking water.
excess fluoride due to the dissolution of fluoride
from fluoride-bearing minerals. India has
among the largest resources of these minerals.
7.
processes, namely the Nalgonda technique
(floculation and sedimentation) and AA-based
11.
Can people afflicted with fluorosis
be cured?
Why is fluorosis endemic in certain
In people with chronic exposure and those with
areas?
clinical and subclinical symptoms, the only
The presence of excess fluoride in groundwater
available measure as of today is eliminating the
is due to geo-chemical characteristics of the
intake of fluorides and prevent the disease. No
chemical till date is capable of extracting the
awareness about the health effects of fluoride,
fluoride already deposited in the body. In
the market demand is likely to increase
patients with overt disease, the following
measures should be taken:
substantially.The private sector will respond to
o
Fluoride intake to be eliminated
o
Promotion of better nutrition-diet rich in
calcium, vitamins C, E and anti oxidants
12.
Are some people more susceptible
to the disease?
Metabolism and capacity to excrete fluoride play
a role in susceptibility. In the same family, not
market demand and make available fluoride
removal filters.
15. Has fluoride any beneficial effects?
The research studies indicate that fluoride has
no beneficial health effects. Rather, fluoride
destroys the teeth. Fluoride has no role in
prevention of dental caries, which is basically
a bacterial dental disorder.
all are affected in similar fashion. Existing data
indicate that some sections of the population are
more susceptible to the toxic effects of fluoride.
These include people with deficiencies of
calcium, and/or vitamins C and E, the elderly,
and people with cardiovascular and kidney
problems. Poor nutrition increases the incidence
and severity of fluorosis. Besides, the body
UNICEF and Fluorosis
Mitigation Programme in
India
1.
What is UNICEF doing about
excess fluoride in India’s water
supplies?
physiology and hormonal status also determine
UNICEF has been working closely with the
who is more susceptible to the disease.
Government of India (GOI) and other sector
13.
What is the effect of nutrition on
partners to assess safety conditions and
implement specific fluorosis mitigation
fluorosis?
Malnourished children and pregnant or lactating
programmes. This is part of a comprehensive
mothers form a high risk group. A properly
should be noted that over the years the Indian
designed nutritional regimen can beneficially
interfere with the toxic effects of fluoride. Diets
Government has undertaken massive efforts to
provide the populations with access to low-
rich in calcium, vitamin C, E as well as anti
fluoride water and that work is continuing.
UNICEF has been strengthening water-quality
oxidants are beneficial. Thus, milk, green
vegetables and vitamin C-rich fruits appear to
be ideal in nutritional prophylaxis of fluorosis.
Are water filters, for removal of
fluoride, available in the market?
Filters are not generally available offthe-shelf
in the market. However, with the increased
14.
effort to ensure safe water environments. It
monitoring systems, facilitating household water
treatment and advocating alternative water
supplies when necessary. Education is key to
UNICEF strategy, with emphasis on grass-root
implementation of water safety procedures. A
number of demonstration projects have been
initiated in fluorosis-affected areas.
2.
What are the main elements of
UNICEF’s community-level
approach in India?
At present, the emphasis is on the introduction
of domestic defluoridation. UNICEFs current
plan of action includes creating awareness
about the dangers of excess fluoride intake and
the government programme involving of some
3 million deep-well handpumps during 1977-
1997, water-quality testing did not receive the
desired attention.
A result of UNICEF and WHO perseverance,
the first national workshop on water-quality
of a poorly balanced diet. UNICEF promotes
home sanitation, hygiene education,
monitoring (WQM) in rural areas was held in
strengthening community control over the
water supply and community monitoring, using
have been endorsed by the high-powered
field test kits. The organisation has sponsored
promising research on the use of Activated
are being taken by the government to strengthen
Alumina (AA) to remove excess fluoride from
water at the household level, promoted its use,
and supporting in the development of an
improved field test kit. UNICEF also works
consistently to develop new data on water
quality and health implications for children.
with the government on this important initiative.
1997. The recommendations of the workshop
committee of the GOI and specific measures
the WQM system. UNICEF is working closely
4.
Does UNICEF now advocate a halt to
drilling in areas where there is a risk of
excess fluoride?
No. In hard rock areas, where some borewells
may yield water with excess fluoride,
What is the history of UNICEF’s
work in areas with high fluoride in
groundwater still remains a major source of
groundwater in India?
During the 1970s and 1980s, UNICEF worked
closely with the Government to develop rural
water supplies, using water from deep
of millions. This underlines UNICEF’s
reasons for placing primary emphasis on
3.
borewells to improve access to safe water
within a reasonable distance in drought-prone
areas. The emphasis in 1970s and 1980s was
on bacteriologically safe water, as chemical
protected, reasonably safe water for hundreds
strengthening water quality monitoring and
awareness generation among users, so as to
ensure that water used for drinking and
cooking is safe. By the same token, monitoring
would reveal contaminated sources, which
problems were not so well recognised.
should be avoided. This approach allows not
only for the determination of unsafe fluoride
UNICEF has always advocated checks on
levels but also for awareness of other serious
potability of borewell water before handing the
source over to the users. However, due to the
inadequacy of water-quality monitoring
contaminants leading to water-borne diseases.
infrastructure and the supply-driven nature of
DRAFT for HNP
H~6-cI; 3
(for comments)
NUTRITION
Situation Analysis and identification of problems I gaps to be addressed
Background
Data from the National Nutrition Monitoring Bureau (NNMB) and the National Family
Health Surveys (NFHS) indicate very slow improvement in nutritional status in Karnataka
over the past three decades. The Karnataka Task Force on Health has recommended that as
food and nutrition is a basic determinant of health, the Department of Health should give
greater priority to improving nutrition stams particularly of vulnerable groups in society.
Through this project the Department of Health, GOK, is placing nutrition higher on its agenda
of strategic health planning and implementation. It will focus on improving the following
dimensions of nutrition interventions recognising that these have been some of the gaps in
services provided so far.
a)
b)
c)
d)
Effectiveness which is the extent to which a specific intervention or service, when
deployed in the field, does what it is intended to do, for a defined population, within a
given time frame.
Equity which will work to redress societal and economic disparities, by providing
affirmative action to those most in need - that is to dalits, tribals, women / girl children
and people living in poverty.
Quality of service which is multidimensional and will include technical quality, staff
capacity and staff attitudes and relationship between provider and people.
Intersectoral coordination with departments of WCD, Education, RD & PR and
Horticulture, PDS (Civil Supplies), and Agriculture.
Current Nutrition Status
1.
Preschool Children
a)
Reliable, research based data over 25 years indicate that a 91% of under-six children
remain underweight, with 50% of children suffering from moderate to severe
undemutrition. (Table 1) This is extremely serious with grave consequences to the
health and well being of the future generation. The time to act is now, and the age. to
focus is the under-two year period, which is when maximum growth of the brain
occurs.
.\p450\d'anni\HNP-NUT RJTION-18.09.0l.doc
I
Table -1
Year
1975-79
1988-90
1996-97
Percent weight for age distribution of children aged 1 - 6 years,
over time, in Karnataka (Gomez Classification)
Normal
4.6
4.8
9.5
Mild
31.1
38.1
38.6
Nutritional grade
Moderate
50.0
48.8
45.4
Severe
14.3
8.3
6.2
Source: NNMB Rural, 1999 (pooled data of boys and girls)
b)
Data regarding the nutritional status of tribal and urban preschool children indicates
a worse situation (see Tables 2 and 3)
Table-2
Year
1985-87
Percent weight for age distribution of preschool
tribal children (1-5 years), 1985 - 87
Normal
2.3
Mild
15.1
Nutritional grade
Moderate
49.7
Severe
32.9
Source: NNMB Report of the Tribal Survey, 1985 - 87.
Though dated, this is the only available data. This constitutes a public health
emergency. We arc unaware of any concerted response to this alarming situation.
Table - 3
Year
1993-94
Percent weight for age distribution of urban poor, pre-school
children (1-5 years) in Bangalore, 1993-94.
Normal
2.5
Mild
37.7
Nutritional grade
|
Moderate
l
53.5
Severe
6.3
Source: Report of Urban Slum Sumey. Bangalore 1993-94.
We do not have specific data for scheduled castes, but experience suggests that
nutritional status would be worse among them.
c)
Gender disaggregated data over two decades shows a reversal and slight shift in
favour of boys over girls. In the mid 1970s boys were slightly more malnourished.
whereas in the mid 1990s fewer girls are normal and more girls are severely
undernourished (see. Table'14).The rate of change in the two extremes (normals and
severe) is greater for boys than girls. This suggests that the situation for girls has
become more adverse during this period.
\\P450M\anni\HNP-NUTRITION-18.09.01 .doc
2
Percent weight for age of girls and boys aged
(12-71 months) (1-6 Years)
Table-4
Year
1975-79
1996-97
Normal
5.6
3.7
7.6
11.2
Sex
F
M
F
M
Nutritional grade
Mild
Moderate
31.9
47.8
52.1
30.3
45.5
•
40.1
45.2
37.9
Severe
12.5
13.9
6.8
5.7
Source NNMB Rural 1999
This is also seen in height for age data, a sensitive indicator of chronic malnutrition,
which shows that severe stunting is higher among girls (see Table - 5), balanced by
higher moderate stunting among box's. The overall high percentage of stunted girls
and boys is cause for serious concern. Repeated and specific educational inputs
regarding child feeding practices are required.
Table - 5
Percent stunting (height for age) among girls and boys below
4 years (1 - 47 months) in Karnataka, 1992-93
Stunting
-3Z to -2Z
-3Z
23.5
20.4
26.2
Sex
F
M
Year
1992-93
Source NFHS, 1992-93
d)
Interstate variations and trends
It is noted that nutritional deprivations among young children below 6 years are worse
in Karnataka as compared to the neighbouring states of Kerala and Tamil Nadu. The
decline in undemutrition and infant and child mortality in these two states has been
more rapid since the mid 1970s suggesting that nutrition gains can occur more
effectively. Comparative data with Tamil Nadu is given in Table - 6.
Table - 6
Percent weight for age (1- 5 years) over time between States
State
Karnataka
Tamil Nadu
.’P^50>d'anmAHX'P-NUTRmON-I8.09.01.doc
Year
1975-79
1996-97
1975-79
1996-97
Moderate
undemutrition
50.0
5.4
45.4
33.5
Severe
undemutrition
14.3
6.2
12.6
2.9
3
e)
Regional disparities
There are significant regional disparities in undemutrition of young children (see
Table-7).
Table - 7 Percent malnourished children under 4 years by region in Karnataka
Region
NE Plateau
NW Plateau
Central
South
Middle and Coast
Karnataka
Weight for Age <:-2 SD
’ 62.6
54.9
52.1
51.9
39.5
53.4
Source: Calculatedfrom NFHS 1 by Mari Bhat et al, EPW:3008-32, Oct
16-23, 1999.
Note: NE Plateau comprises Bidar. Bijapur. Bagalkot. Gulbarga, Raichur
and Koppal.
Anemia
The commonest cause of anemia is iron-deficiency due to dietary inadequacy. It is
widely prevalent in India and is described as 'hidden hunger’. Studies by the National
Institute of Nutrition (NIN), Hyderabad show that 63% of India's children below 3
years and 45% between 3-5 years suffer from iron deficiency anemia, with moderate
to severe anemia in 10-15%.
a)
Prevalence of anemia in young children
Levels of anemia in children in Karnataka are shown in Table No.8
Table - 8
Percentage of anemia in children
below 3 years in Karnataka
Age
(in months)
<12
12-23
24-35
Total
Hemoglobin levels (grams / deciliter)
Normal
Mild
Moderate Severe
>11
10-10.9
7-9.9
<7
43.8
20.8
33.7
1.7
20.2
48.7
9.2
21.9
16.4
37.8
36.8
9.0
19.2
34.2
40.1
6.6
Source: NFHS II, 1998-99.
\\P450Janni\HNP-NUTRJTION-18.09.01.doc
4
Table -10
Year
1975-76
1988-90
1996-97
Prevalence of Vitamin deficiency by time and
location in Karnataka
Percent prevalence of Bitots spots
in children 12-71 months
Rural
Urban
2.3
7-.1
1.1
NA
0.5
1.1
Source: NNMB reports, Rural 1988-90 and 1999. Urban Slum 1984
and 1993-94
b)
Tribals
Table - 11
Vitamin A deficiency in Tribal children in Karnataka
Survey and year
NNMB Tribal Survey 19S5-S7
NIN Jenu Kuruba, Tribal Survey 1989
Percent prevalence of
Bitots spots
1.4
0.7
It is to be noted that prevalence of Bitots spots of more than 0.5%/is considered
to be a problem of public health significance by WHO.
c)
Interstate variation
Comparison with neighbouring states is shown in Table - 12
Table - 12
Prevalence rate of Vitamin A deficiency in 0-6 years
population in Southern Indian States (percent Bitots spots)
State
Karnataka
Kerala
Tamil Nadu
Andhra Pradesh
Rural
1.57
0.49
2.03
2.78
Urban
4.9
1.45
10.10
1.36
Source: National Survey of Blindness Report, 1986-89.
The rates in urban poor children are worse. There are fewer ICDS projects and
balwadis for urban poor pre-schoolers. An organisational mechanism to reach
them will be evolved.
\T450\d-anni\HNP-NtJTRITION-18.09.01.doc
6
Overall 65% of under 3s are anemic, with the highest level of 78% occurring among
the 1-2 year age group. Moderate to severe anemia is found in 46.7% or almost half of
the children.
Specific data from districts and tribal communities are available, though scattered and
dated. The Bidar Integrated Rural Development Study reportedly estimates more than
90% of preschool children with anemia among whom 13.4% had severe anemia.
Chitradurga district reported anemia among 54% of preschool children (IPP, 1978).
Studies of Jenukuruba Tribals in Mysore and Kodagu districts found 99% of preschool
children anemic with 16.3% severe, 57.5 moderate, 25% mild. (NIN, 1989).
Interdistrict and intergroup variations are likely to occur. This needs to be regularly
surveyed and monitored and the program fine tuned accordingly.
b)
Prevalence of anemia in Women is also high (see Table - 9)
Table - 9
Percent Prevalence of anemia in women in Karnataka
Age in years
15-24
25-34
35-49
Mild
29.3
25.4
25.8
Moderate
16.4
12.5
12.2
Severe
1.7
2.4
2.7
Any Form
47.4
40.2
40.7
Source: NFHSII. 1999
19.B: At least one additional case ofsub-clinical iron deficiency occurs for each
case of iron deficiency anemia, when prevalence rates are <50'1 h.
Severe
< 7.0 gm/dl
Moderate
7.0-9.9 gm/dl
Mild
10.0-10.9 gm/dl children, pregnant
10.0-11.9 gm/dl non-pregnant
No anemia > 11 gm/dl
children, pregnant
> 12 gm/dl
non-pregnant
It must be noted that 10% prevalence is the cut offpoint, triggering the need for public health
action.
c)
3.
Various programmes including RCH programme have not made a dent in this important
problem. A public health approach based on public health ethics will be used to respond,
given the magnitude and health consequences of the problem. Immediate and urgent
intervention measures are being initiated and will be closely monitored, with regular
reporting to a public body.
Vitamin A deficiency
a)
Time-trend - Over the decades clinical Vitamin A deficiency has declined
(see Table - 10)
•.\P450'd'annf.HNP-NUTRJTION-18.09.01.doc
5
4.
Iodine Deficiency
There are four endemic districts with pitre prevalence rates of more than 10% (Goitre
Prevalence Study 1988-91). They are Chikkamagalur. (41%), Kodagu (23.1%),
Dakshin Kannada (14.2%), and Uttar Kannada (10.7%). Goitres are prevalent in all
districts with rates ranging from O.P^o to 6.9%. The prevalence is higher among
females and in the age group 12-18 years. A 1989 study of Jenukuruba Tribals found
a goitre prevalence of 4% in school age children and 10% of among adolescents in
Mysore and Kodagu districts.
5.
Status on Nutrition related issues
a. Breastfeeding (From NFHS 1992-93)
Though although almost all children were breastfed (>95%), only 5% were put io breast
immediately after birth (within 1 hour). Another 18% began breastfeeding within 24 hours of
birth. Majority of mothers (67%) who breastfeed squeeze out the first milk from the breast
before they begin breastfeeding their babies
The duration of exclusive breastfeeding i.- only 69% in the age 0 to 3 months However, a
majority' of women continue breastfeeding till 2 years (median is 21 months) Ideally food
supplementation should begin only from 6 months. Merely 40% of infants in the age group 6-9
months received both breast milk and soirn foods. Regrettably, bottle feeding is prevalent;
increasing from 7% in 2 months to 18% for children aged 12-13 months Infant formula as a
supplement is much rarer than other milk icow or buffalo). Males were breastfed for two
months longer and were initiated to supplementary food earlier.
b. Measles immunization
Only 67% of children aged 12 to 23 months w ere immunized against measles disease (NT1IS
1998-99). Sadly, girls were less likely to be immunised than boys. Measles immunisation is
the most important one time medical intervention which prevent deterioration of children's
Vitamin A status and for a significant proportion of children can prevent deterioration of their
overall nutritional status.
The RCH baseline surveys of 1998 and 199° also confirm that Measles immunization coverage
is particularly low in Northern Karnataka (see Table 3. 8).
Measles Immunization Coverage (%)
among children aged 12-36 months.
Table-13
District
Coverage
Bidar
57.2
Gulbarga
32.5
Raichur
44.0
Bellary
69.3
P450Vd\anni\HNP-NUTRJTION-l 8.09.01 .doc
7
Current Ongoing Nutrition Programmes
1.
Integrated Child Development Scheme (1CDS)
The Integrated Child Development Scheme (ICDS) functions under the WCD, with 175
rural projects (one per taluk) and 10 urban projects in Karnataka. It covers a population
of over 31 lakhs in the State, including Children, pregnant and lactating mothers and
adolescent girls. As a key strategy in Nutrition and Child Care, this project will work
with, support and strengthen the ICDS. Hence it is described and discussed in detail.
a)
Numbers As of 1999 - 2000 there were 40,012 Anganwadi Centres functioning out of
a sanctioned 40,170 (gap of 158). *
b)
Personnel - There were 39,469 anganwadi workers (gap of 601) and 39,926 anganwadi
helpers (gap of 244). There is an acute shortage of personnel at an important level
namely, supervisors, or Mukhiya Sevikas even as of September, 2001 with 574 in
position out of a sanctioned 1861 (gap of 1287). The WCD has initiated measures to
rectify this. This needs to be followed up urgently as a pre-project activity.
c)
Infrastructure - There is a shortfall in buildings. Forty percent of anganwadis (16.883)
function from their own building. Others function from community building (5289),
temples (4415). schools (4319), makeshift arrangements (2708), rented buildings (2933),
panchayat buildings (2662), youth association (502) and mahila mandal buildings (315).
A district wise break up is available. The estimated cost of a building is Rs. one lakh.
The state government is considering loans from NABARD for further coverage of
buildings. The location / siting of buildings should favour access to dalit, tribal and poor
children. Even in the short term availability of water for drinking, cooking and washing
and also of toilets needs to be ensured as basic facilities for hygiene and health. Enough
space for playing, for storage and cooking and for growing some vegetables and fruit
trees should be provided for.
d)
Coverage - In mid - 2001, twenty six lakh children of an estimated sixty - eighty lakh
under - 7 children in Karnataka were covered by the ICDS. Only 50% of under - twos
get supplementary food. Coverage of urban poor children is limited and needs
expansion.
* All numbers are based on information received from WCD, ICDS section.
'•.P450\dtanni\HNP-XLTRJTION-18.09.01.doc
8
e)
Training - Anganwadi workers (AWW) receive a 3 month training at 26 training
centres, located in 20 districts, the majority of which are run by NGOs (list is available).
The minimum qualification for an AWW is 7th standard for rural and Xth standard for
urban centres. The training is being improved and intensified through "UDISHA", a
World Bank assisted scheme all over India. Adequacy of content methodology, quality
of basic training as well as of continuing and on-going education of AWWs is to be
assessed, particularly with regard to nutrition and health related areas.
Refresher training is conducted every 2 years.
Supervisors whose minimum qualification is graduation are trained at the Middle Level
Training Centre (MLTC) at Ujire in Dakshin Kannada district. ACDPOs and CDPOs,
(Child Development Project Officers and Assistants) with a required post graduation in
Social Work or Home Sciences, receive a 2 month training at NLPCCD, Bangalore.
f.
Mobility / Transport
Vehicles are supplied by UNICEF. There is one four wheel vehicle per project, (i.e.
taluk)
g.
Equipment and Supplies.
❖ Shortages of weighing scales are being rectified by the WCD through procurement.
Replacement of old weighing scales and calibration needs to be done on an ongoing
basis. The estimated requirement is 6S30 weighing scales
❖ Shortages of growth charts are also being rectified by the WCD
UNICEF is
experimenting with new growth charts in Gulbarga and Raichur.
❖ Medical kits with supplies worth Rs.600 per annum are provided through local
purchase at district level through the Zilla Panchayat.
❖ Fuel money is now provided directly to the AWW and not through the gram
panchayat.
❖ Energy Food Supplies are through Karnataka State Agro Corporation. Amylase Rich
Food (ARF) in 1 kg plastic packets are provided for under twos. The CDPO at Taluk
level procures rice through the Public Distribution System (PDS). The contractor
directly supplies it to the anganwadi every month. Under a new scheme, through the
Prime Ministers Grameen Yojan (PMGY) 1 egg will be supplied thrice a week, to be
given to children as boiled eggs.
h.
Workload - In addition to their own work AWWs who are “volunteers” are involved in
the pulse polio programme, census, livestock census, leprosy and RCH programme.
Since 2000 every AWW is required to form and facilitates 3 self help groups, each with a
revolving fund of Rs. 5000.00. Since 2000, AWWs are also looking after the nonclinical responsibilities of ANMs. It started in category C districts and was later extended
to category B districts and parts of A districts A sum of Rs.250.00 per month is given for
this by the Department of Health. The workload of AWWs needs to be assessed in
relation to her remuneration (about Rs. 750.00 per month) and status.
\\P450Wnni\HNP-NUTRJTION-lS.09.01.doc
9
i.
Budgets and Expenditure
Currently Rs. 205 crores are spent annually in Karnataka on the ICDS. Being a Centrally
Sponsored Scheme (CSS), the establishment and administrative expenditure is borne by
GOI. During 1999 - 2000, Rs. 7813 lakhs were sanctioned and Rs. 5111.35 released,
against which Rs. 6424.15 lakhs were spent by the Zilla Parishads. The expenditure for
the nutrition supplement is borne by the State government through the Zilla Panchayats.
During 1999 - 2000, the GOK spent Rs. 3634 lakhs under plan, Rs. 6022. 76 lakhs under
Non-Plan, Rs. 962 lakhs under special Component Plan for Scheduled Castes etc and Rs.
289 lakhs under Tribal Sub Plan.
Expenditure per child was Rs. 1.25 per day and for children with grade III & IV under
nutrition it was Rs. 2.50 per day. According to the Pradhan Mantri Gramodaya Yojana
(PMGY), the amount available is to be increased to Rs.2/- to all children below three
years and severely malnourished children in the age group of 3 to 6 years: Rs. 1.25 would
come from the regular supplementary nutrition programme and Rs.0.80 to be met from
the PMGY funds. From September 2001 onwards children are to get eggs three times a
week.
An analysis of Revenue Expenditure on Social Services Sector (Subramanya and Reddy
PH, 1997) noted that during the decade 1990 - 91 to 1999 - 2000 expenditure on
nutrition declined in real terms at the rate of 4.3 percent per annum. Inadequate funding
for nutrition has affected the programme.
Given the importance of the work being done under the ICDS, there will be need for
increased expenditure to improve and maintain infrastructure, to improve the training and
supervision of staff and for better services including health and nutrition education, food
supplementation and child care and education.
j.
Outcomes
The ICDS started in 1975, Projects in taluks were started incrementally over the years
and all 175 taluks in Karnataka were covered in 1993. *
Recent data regarding the nutritional status of children in Karnataka reveals that the
impact of the intervention is inadequate and poor even through the scheme has other
gains. There is therefore need for a more specific and qualitative improvement in the
area of nutrition through the ICDS and other schemes. The Integrated Health Project
aims to fill this gap.
* The additional taluk formed in Bangalore Rural district in September 2001, will need to have a
project.
\\P450\d\anni\HNP-NUTRJTION-18.09.01.doc
10
2.
The Reproductive and Child Health Programme (RCH)
This programmes presently assisted nationally by the World Bank provides for:
a) Iron and Folic Acid (IFA) for young children and pregnant and lactating women.
These are supposed to be available throughout the state. Since the project was launched
in 1997, there have been shortages ofIF A for long periods of time. Levels of iron
deficiency anemia are high and is still of public health significance.
3.
The Inter State Border District Cluster Strategy (BDCS), is supported by UNICEF
during the period 1999 - 2002 in the districts of Raichur, Gulbarga, Bidar and Bijapur. It
aims to reduce child mortality and morbidity by strengthening and revitalizing sub centres
as a key strategy and to improve functioning of PHCs and FRUs. It attempts to build both
community and health worker capacity. For nutrition it includes nutrition education, joint
training of AWW, ANMs, TBAs and NGOs, the formation of health slid nutrition tennis at
village and sub centre level joint field visits and meeting by higher level officers and the
formation of Community Advisory Boards to enable community supervision, management
and accountability. It supports the RCH program and the Project Director, RCH is
responsible for implementation.
4. The Integrated Nutrition Project is being developed with the WCD as the nodal
department through a consultant linked to Micronutrient Initiative (MI), Canada, to cover
four districts namely Raichur, Gulbarga, Tumkur, Chikmagalur. The initial project
proposal has been developed in December, 2000 and district workshops have already been
held in mid 2001 in the 4 districts and have involved district health personnel. The project
has 7 proposed components.
a) IEC through women’s SHGs, schools and joint training of government and NGO
functionaries.
b) Food fortification of local cereals with iron, folic acid and Vitamin A.
c) Supplementation of 1FA to under 3s, adolescent girls, pregnant and lactating
mothers, Vitamin A supplementation also provided for.
d) Dietary diversification through promotion of micronutrient rich horticultural produce
through support to Department of Horticulture.
e) Health service linkages and establishing Nutrition Rehabilitation Units in Districts.
f) Project Management through a PMU and steering committee.
g) Monitoring and evaluation - ongoing, external and community using Triple A
approach.
Funding for this project has not yet been confirmed and hence work has not yet started. There
are overlaps in the districts and components covered.
5.
School supplementation, ’under the Department of Education, provides 3 kg of raw
uncooked rice, per child (? Only to SCs / STs) per month in government and aided schools
throughout the State.
\\P450\d\anni\HNP-NUTRJT10N-18.09.0I.doc
11
A school mid-day meal programme has been recently announced by the government.
The Integrated Health & Nutrition Project will need to fill in some of the gaps (other
gaps will be covered by Government of Karnataka's own funds), and to bring about
coordination and convergence between the various health and nutrition related
schemes at primary care level.
6. The Iodine Deficiency Disorders Control Programme provides iodized salt through out
the state.
7. The Vitamin A prophylaxes programme is a component of the National Programme for
Control of Blindness. Massive dose of an oily preparation of Vitamin A is given
orally to children from 6 months to 6 yearly at 6 monthly intervals through ANMs.
Goal
Recognising nutrition as a basic determinant of health, to incrementally improve nutritional
status of people of Karnataka especially those most vulnerable, by closer integration of
nutrition interventions with the primary health care system.
General objective
During the project period (2002-2007) to develop and implement nutritional interventions
particularly for under two children; adolescents, especially girls; and women; and
underprivileged social groups such as adivasis. dalits and the urban poor.
Specific objectives
1.
Develop and implement nutrition education and child care strategies in all 27 districts of
Karnataka through the four Departments of Health, Women and Child Development.
Education and Rural Development & Panchayati Raj, supported by other Departments as
an integrated part of health promotion, to positively influence people's knowledge.
attitude and practices regarding nutrition, especially use of low cost, locally available
foods.
2.
Reduce undemutrition of under six children and especially of under twos, by supporting
better technical capacity, quality, increased coverage, reach and effectiveness of
existing nutrition services, particularly through the Integrated Child Development
Scheme (ICDS), with close intersectoral coordination and joint training programmes at
different levels. To ensure better access to girls, underprivileged social groups, urban
poor and tribal children. Efforts towards institutional strengthening will focus on
anganwadis, health sub-centres, primary health centres and women's sanghas. Increased
community ownership will be promoted through community empowerment, particularly
of women through sanghas and self-help groups.
3.
Introduce a special package of nutrition intervention (complementary food) for under two
children in the seven classified category C districts ( Bidar, Koppal, Gulbarga, Raichur,
Bellary, Bagalkot and Bijapur) and for tribal children.
\\P450'd'anni\HNP-NUTRlTION-18.09.01 .doc
12
4.
By 2007, reduce iron deficiency anemia by 30 - 50% among children, adolescent girls
and women.
5.
By 2007, reduce Vitamin A deficiency in children under six years by 50% - 75%.
6.
To increase and sustain support to nutrition in Karnataka, through ensuring increased
budgetary allocation and by developing technical expertise at State and District level in
government institutions through capacity building, continuing education, supportive
supervision and monitoring and increasing awareness regarding importance of nutrition
in Panchayati Raj Institutions to enhance ownership and governance.
Strategies
Strategy 1 - Nutrition Education
I.
Nutrition Education is an integral part of heath promotion. This is a critical strategy
for better nutrition and will require close attention from the project management team.
Year One: Setting up Framework for Organisational Responsibility - at State &
District Levels.
♦
The Deputy Director/ Joint Director-Nutrition in coordination with the Joint Director.
1CDS in WCD; the concerned state officers in the Department of Public Instruction
and the RDPR will be jointly responsible and accountable for the Nutrition Education
Component in their respective constituencies. These will be the four major
participating government departments. * They will be reporting to the Additional
Director- HET (Health Promotion). The nodal officer initiating and facilitating work
will be the State Nutrition Officer (JD / DD) in DHFW.
♦ .4 state level consortium for nutrition education with approximately 12 members will
be set up in the first 3 months functioning within a loose, flexible frame as a
Technical advisory body. It will include the Regional Office of Government of
India's Food & Nutrition Board, the Karnataka Branch of the Nutrition Society of
India, Women's Development Corporation, Mahila Samakhya, VHAK, Medical &
Home Science Colleges, NGOs, experts / practitioners and district officers
representing the 4 divisions. It will meet every 6 months to advise planning and to
review progress.
* Other Departments such as Horticulture, Agriculture, Animal Husbandry and Fisheries will be
involved as required to support supplies to anganwadis and schools and to promote household / school
/ village based gardens / fish culture etc.
\.P450\d'anni\HNP-NUT RlTIOX-lS.09.0I.doc
13
♦
In the 3-4th month, responsible persons / organisations from the 4 departments,
NGOs, women's groups will be identified in all 27 districts to form district nutrition
bodies. A state level meeting will be held with district representatives to develop a
broad, year wise plan of nutrition education activities for the next 4 years.
♦ A specific detailed plan of action for the first year will be finalised.
♦ A collection / documentation of all the existing nutrition education material available
in the state / country will be made and continuously developed as a resource centre
for nutrition education in the Directorate of Health.
♦
Organisations / individuals who have expertise and experience in nutrition and health
education / promotion and communication will be short-listed. A selection will be
made from among them of an organisation of competent nutritionists for developing
materials and methods that need to be location specific for the four broad regions of
the State.
♦
Workshops will be held, facilitated by the above organisation.
a) to identify thrust areas and specific content of nutrition education for the
different regions (broadly 3-4 regions) of the State and for different age groups.
District / location specific fine-tuning can be done locally.
b) to develop communication strategies using different methods for different
content areas.
♦
Training programs will be planned and conducted to train trainers at slate level, and a
core group of district trainers in content and use of different methods. Over a two year
period a core group well versed in nutrition education will be developed in each district.
Focus in the first year will be on the 7 priority northern districts.
♦
The state and district core group of trainers will be multidisciplinary' and
interdepartmental. At district level these will be part of the district nutrition body and
may include the government District Nutrition Officer / DHEOs / District Health
Promotion Officers, District Nursing Officers, ADs / CDPOs from WCD, DDPIs /
Principals of DIETs, Saksharata Samitis, NGOs, academics etc.
♦
Nutrition education and health promotion will be linked to women's empowerment and
community empowerment for leaders involving WCD, WDC, Mahila Samakhya &
NGOs.
♦
A small group of mass communication experts will help to draw up a plan for nutrition
education using radio, Doordarshan / private channels and the mass media. The
Department of Information and Publicity (State and Central Government) and Song and
Dance Division of Government of India, and nodal persons from the private sector will
be involved.
\'J,450'4'anni'HXP-NLTrRlT10N'-18.09 0i.doc
14
♦
Nutrition and health education is person intensive. It will involve:
group work - through Mahila Sanghas, Yuwati Sanghas, Gram and Ward
Panchayats, parents associations etc.
b)
person to person interactions, implemented on a large scale, so that it will
bring about a social shift in food, nutrition and dietary practices. Schools,
colleges, sub- centers and health centres, PRI institutions will be the
institutions through which this education for better health and nutrition can
occur. The nutrition and dietetics / practical component in the curriculum
of training of teachers, health staff, WCD staff and panchayat members will
have to be reviewed and modifications made. A professional group may be
entrusted with this task in the first 4 months. After a 3 month study their
recommendations for
each specific
group will be considered and
implemented.
Studies regarding traditional knowledge regarding nutrition and local food practices,
besides area specific needs assessment will be carried out.
By the end ofyear one district plans to cover the different groups are to be developed.
Detailed plans for years 2-5, will be evolved by the 10lh month of the previous year.
following the objectives and principles of the project and guided by the groups that have
been set up.
The experience and expertise of voluntary agencies involved in nutrition education will be
availed of.
a)
•
o
•
®
Strategy 2-To support technical capacity, quality, coverage and effectiveness of
nutrition services for under six children, particularly under -twos, through
the ICDS, ensuring access to girls, urban poor, tribal and under privileged
social groups.
Broad principles for action
1.
2.
3.
4.
5.
Increase coverage of under -twos by the ICDS. House to house surveys conducted by
Anganwadi Workers will identify under-twos.
Increase coverage of children through increased projects / anganwadis especially in urban
poor areas and among under privileged social groups. Mapping of Anganwadis and
identification of areas requiring additional centres to be undertaken as a pre-project
activity.
Increase capacity for nutrition and health education of ICDS Supervisors (1861
sanctioned posts), supported by CDPOs, ANMs & PHCs through training and capacity
building.
Increase participation of ANMs in referral services, organising health checkups, home
visits, nutrition and heath education. Organising fixed day visits to Anganwadis for
health checks and Health Education for groups of mothers.
Increasing early diagnosis and treatment of infections and illnesses of under six children
at the PHC.
.P4j0danni.HNP-NUTRITION-18.09.01.doc
15
Increasing community participation by developing Anganwadi Workers skills in
communication and promotion of community participation.
b. Community mobilization by greater involvement of mahila mandals and self
help groups to enhance ownership. Participation is the programme as an
empowering process.
7. Improving caring of under - two (with gender and age sensitivity), with a focus on
psychosocial development, through supporting parenting, (using experience and material
from UNICEF and the parenting network from Tamil Nadu)
8. Conducting joint training programmes for ANMs, AWWs, Supervisors.
9. Joint-Planning, mobilisation and orientation programmes at cluster, taluk, district and
state levels.
10. Food, nutrition, health, childcare, pre school education components to be shared I
communicated through a quarterly or six monthly newsletter for Anganwadi workers.
11. Ensuring supply of growth charts, nutrition education material, food, fuel, firewood.
registers, equipment etc. The ICDS allocation by Centre and State may be supplemented
by the project to meet specific gaps after prior permission.
12. Training manuals in the local language that are focussed on region specific food habits
and options.
6.
a.
Pre-project Activities
1.
2.
3.
4.
5.
6.
7.
Vacancies of Anganwadi workers, helpers and supervisors to be filled up.
DHFW to identify / appoint District Nutrition officers or nodal officers inchargc of
nutrition. Their job responsibilities will need to be developed, especially for training of
(Doctors. LHVs, CDPOs, Supervisors. ANMs, AWWs. Panchayat members).
Supervision and Monitoring. Their administrative and financial powers will need to be
delineated and relationship to other district level officers.
Selected Directorate Staff may be deputed for training at National Institute of Nutrition
(NIN. Hyderabad). Ensuring continuation and further strengthening of nutrition
expertise in the Department.
Purchase and calibration of weighing scales at Anganwadis to be undertaken. (WCD).
Weighing accuracy of 2 100 g. to be ensured.
Nutrition content of all training programmes to be reviewed by JD (Nutrition). DHFW'.
Linkages to be established with WCD, other departments / groups dealing with nutrition.
Meet every 2 months to discuss evolution proposed.
Review of nutrition recording and growth monitoring systems. Periodicity of weighing
children to be every three months, rather than every month. Staff from academic
institutions to be involved in growth monitoring.
Massive health awareness programmes through a series of Kalajathas and mobile
exhibitions to build up the community involvement and stake in the programmes.
P450dannrHXP-NUTfUT10N-18.09.01.doc
16
Strategy 3 - Interventions to reduce iron deficiency anemia.
The following components need to be integrated into action points at different levels.
Operationalisation
Component
1 . To be emphasized in training of
1
Delayed ligation of umbilical
dais (TBAs), ANMs, LHVs, nurses
cord till it stops pulsating
and doctors
I 2
To be introduced in training
2
Exclusive breast feeding for 6
\ Supplementation through RCH
months
Iron supplementation for 6-18
months
1
Iron for low birth weight babies
for 2-18 months
Promote iron rich food (drumstick 3 , Health Promotion through AWWs,
3
ANMs, TBAs for dietary change to
leaves and jaggery, flesh food)
i
prevent the "hidden hunger" of iron
Use enhancers that increase iron
i
deficiency anemia.
absorption eg. Vitamin C in limes
i
/ amla.
Reduce inhibitors that decrease
iron absorption c.g. phytates and
tannin as in tea. coffee.
Fermented food (idlis) increase
i
absorption.
4
Helminth control by 6 monthly or 4
Through Anganwadis and schools provision of albendazole through
annual anti helminthic treatment
for children.
RCH, PHC drug supply and
through the project.
1
Also sanitation and footwear
1
1 5
1
Early diagnosis and treatment of
malaria, opportunistic infections
with HIV / AIDS and chronic
infections which increase anemia.
5
6
Universal supplementation
(weekly iron 200 mg ofFerrous
Fumarate) for adolescent girls (10
- 19 years). Adolescents form
21% of the total population in
India (2000), with adolescent
girls forming 10.5%.
6
P450d\anni\HNP-NLT‘IUTION-18.09.01.doc
Through the integrated water
supply and sanitation project
community and women's
empowerment.
Training of PHC doctors and
regular drug supplies.
(a) In schools and colleges through
Department of Education
(b) for out of school girls through
Sanghas, WCD, Mahila
Samakhya, WDC and NGOs.
17
7
Certain contraceptives like IUD
increase bleeding
7
Change of contraceptive and iron
supplementation.
8
Special attention to nutrition of
the girl child and women. There
is need for adequate dietary
protein for the globin component
of hemoglobin
8
Nutrition and Health Education
through the ICDs, schools and
families.
In summary, the operational strategies to combat iron deficiency anemia are:
Adequate coverage of anemia through in-service training of all health personnel as it is a
problem of public health magnitude.
b) Repeated coverage in health promotion.
c) Provision for iron supplementation for under twos, adolescent girls, pregnant and
lactating mothers, and non-pregnant anemia women, anemic boys I men.
d) Provision for anti helmenthics - through ICDS, schools, PHCs. (integrated, with one
agency, the Department of Health being responsible to avoid overlap and deficiencies.
e) Monitoring levels of anemia through surveys and regular hemoglobin.testing at
PHCs. to check if anemia levels are declining.
a)
Strategy 4
Special package of nutrition interventions (complementary food) for under-two children
in the seven category C districts. (Bidar, Koppal, Gulbarga, Raichur, Beilary, Bagalkot
and Bijapur) and for tribal children.
Concept
An external intervention is being made by the state, in a responsibility that is fundamentally
of the family. This is in order to correct the prevailing situation of high levels of
undemutrition, which is detrimental to the physical and menial growth of the child, with life
long effects. Undemutrition also adversely affects the family and community well being and
productivity. This intervention is not of a permanent nature, and is secondary' to the more
important one of nutrition and health promotion, of which it is an integral part. It is also a
response to the adverse economic circumstances that many households currently face.
The Principles outlined below, will be discussed with project managers and implementors
during the training.
a)
This supplementary feeding programme is not a charity or dole, but an attempt to fill a
gap in nutritional requirements. It is not a replacement of the food that needs to be
given by the family. The development approach of encouraging self reliance, self
sufficiency, and responsibility will be used. Every effort will be made to ensure that
families, implementors, decision makers, administrators and politicians do not view or
project this as merely a food distribution programme.
\\P450'tfanni HXP-NUTRITION-I8.09.01.doc
18
b)
The educational aspect of the activity will be emphasised, by demonstrating to
mothers and families the importance of and methods to reach optimal growth of
children. It will reinforce to mothers and families their role in providing an adequate
diet and care for growing children. Dependence will not be created.
c)
It will be a centre based programme. Workers will not provide food supplements at
people's homes.
d)
Cooked food will be made available, using local familiar foods that are palatable to
children and providing adequate variety. These are foo'ds that can also be prepared by
mothers at home.
Other directional points
a)
Good food hygiene will be maintained by the food handlers, with utmost care in the
handling of raw and cooked food and cleanliness in the cooking process. This will be
repeatedly stressed during the training and supervision of anganwadi helpers and
workers, along with the need to maintain good personal hygiene. This is to avoid
food bome diseases.
b)
Periodic checks and regular objective monitoring of the food distribution,
consumption and growth of children will be made by Supervisors, ANMs, taluk and
district level staff. Growth of the children will be discussed with the mothers.
c)
Sharing sessions about the nutrition and child care programme will be held among
peer workers to share problems, solutions, innovative approaches, successes etc.
d)
The number of children per worker will not exceed the norm.
Nutritional requirements of under-twos
Exclusive breast feeding is the best for the baby till six months. After six months the baby is
gradually weaned with the addition of supplementary / complementary' foods, though breast
feeding may continue upto two years. In practice the quantity and quality of supplementary
food is often inadequate to meet the nutritional requirements. The baby at that age does not
demand food and dietary inadequacy results in stunted growth. The supplementary food
should be soft, palatable, tasty and acceptable. Feeding is to be an enjoyable experience for
the child.
The recommended daily nutrient requirements of children are
Age
Calories
Proteins fgms)
6-12 months
1 - 3 years
900 - 1240
15-22
[Ref: NIN, 1991, RDA for Indians, in Nutritive Value of Indian Foods]
■.P450'd’anni\HXP-NUTRJT10N-l 8.09.01.doc
19
Supplementary food should provide 220 - 300 calories and 4-5 grams of protein per day.
This will be made available through a combination of the following foods:
Cereal
Greengram dhal
Jaggery
Nuts
Oil
-
0-40 gm
10-15 gm
20 gm
5 gm (for older children)
10 gm
For younger children the consistency of food is like porridge, with a transition to solids over
a period of time. Mothers will feed the infants until they can feed themselves.
The different preparations suggested are:
c)
a)
Rice-based:
(1) Kitchidi
(2) Pongal
(3) Vegetable bath
(4) Rice and Greens bath
(5) Rice butter milk
(6) Rice dhall mix with sprouted gram
b)
Wheat based:
(1) Rava Kichidi
(2) Dhalia Porridge with milk
(3) Vegetable bath
(4) Chappathi with methi leaves
(5) Wheat / Gram Undai
(6) Roti with dhall
Ragi-bascd:
(1) Ragi with Jaggery kungi
(2) Ragi Muddhe with leafy veg dhall
(3) Ragi Ambali with milk
(4) Ragi iaddu
(5) Ragi and wheat flour roti with tomato
(6) Ragi Bengal gram Porridge.
These could be used in different taluks and districts to suit local preferences.
Community participation will be actively encouraged through the anganwadi workers, who
will be prepared for this in their training. Mothers and families will be encouraged to bring
vegetables / any additions to enhance flavour, taste, content. They could also assist the AWW
in specific activities (cutting, cooking, feeding) through rota systems.
There will be fixed time on fixed days for group health education. The anganwadi worker
will also fix a time to discuss the progress of each child with the parents once in every month.
The participation of fathers in these meetings will be encouraged. Special attention will be
given to the feeding and care of girl children. The anganwadi workers will develop their Plan
of Action on an annual basis, with specific details about children, dates etc, with the support
and guidance of their supervisors and CDPOs.
\\P450'<l'anni HXP-NUTRIT10X-lS.09.0l.doc
20
Strategy 5 - Reduction in Vitamin A deficiency.
Despite the National Prophylaxes Programme for Prevention of Blindness due to Vitamin A
deficiency, this continues to be a problem of public health significance in Karnataka. It is
increasingly recognised that Vitamin A deficiency besides causing effects on the eye, also
increases morbidity and mortality in children. Vitamin A is anti-infective
Preventive measures will be taken through sub centres, primary health centres and
anganwadis. Urban poor children will need to be reached through existing and additional
channels.
1.
Health Promotion regarding consumption of food rich in Vitamin A and beta - carotene (
a precursor of Vitamin A) such as green leafy vegetables, yellow and orange vegetables
and fruits like pumpkin, carrots, papaya, mango, oranges and where feasible milk,
cheese, paneer, yoghurt, ghee, eggs, liver. Growing of these foods in home, anganwadi
and school gardens to be encouraged. Help to be sought from Department of
Horticulture.
Promotion of breast feeding, including colostrum, which among other beneficial effects.
also protects against Vitamin A deficiency.
This will be an integral part of the health promotion strategy.
2.
Periodic prophylactic massive dose of I 'itamin A
Every infant 6-11 months and children 1 - 5 years to be administered Vitamin A orally
every 6 months.
The recommended schedule is:
a) 6-11 months - one dose of 100,000 1U
b) 1-5 years - 200.000 IU every six months.
A child receives totally 9 oral does of Vitamin A by its fifth birthday. This is to be
entered into the child's growth card.
The first dose can be administered along with the measles vaccine, the second dose with
the DPT / OPV booster in mid second year. The remaining doses through the anganwadi
for the 28 lakh children covered by it. The remaining children to be covered by the
AN.M. Urban poor children will need to be reached through the Municipal . Corporation
bodies by the end of year one and where possible, before the project.
This project will cover gaps that are not met by the RCH programme.
Strategy 6 - Increase Technical expertise in nutrition at state, district and sub district
levels and increase budgetary allocations for nutrition from Government of Karnataka
and other sources.
a)
Appointment of District Nutrition Officers / or nodal officer in charge of nutrition
(preferably lady).
They will be nutrition specialists or health personnel with special training in nutrition.
They will be responsible for implementation of the nutrition component of the DHFW
including the project. They will organise or facilitate all district level nutrition training
programmes. They will ensure adequate competence in the theory and practice of
nutrition among CDPOs, district and taluk health programme officers, supervisors,
AWWs, Senior and Junior Health Assistants. S/he will also oversee nutrition assessment
and monitoring.
P450\d'anni\HNP-NUTRlTION-18.09 01 .doc
21
b)
Training Programme in Nutrition
District Nutrition Officers
The District Nutrition Officers may be given training as follows:
First year:
2 weeks in collaboration between Health Services and WCD
1 week at the Institute / Centre :
27 x 1 week
1 week in the field
:
27 x 1 week
Thereafter, 2 days annually.
2 days at Institute / centre
with field demonstration
:
27 x 2 days
Guest faculty drawn from institutions
Organised by J.D / D.D nutrition with help from WCD.
There is need for residential accommodation with food.
1.
2.
District Assistant Directors / State Officials
2 days in a year
:
35x2 days
Guest faculty drawn from institutions
Organised by J.D / D.D nutrition with help from WCD.
Need for accommodation with food.
3.
L’pgradation of functioning of Anganwadi Training Centres and NIPCCD.
27 ATCs - NIPCCD. Where? How long?
Guest faculty.
4.
CDPOs, Supervisors, ACDPOs
CDPOs
? Supervisors
ACDPOs
Batches of 20 for 2 days each.
Organised by District Nutrition Officers.
Accommodation
5.
Anganwadi Workers
AWWs are given 3 months orientation training when newly recruited, at 27 Anganwadi
Training Centres (AWTCs). It is necessary to have refresher courses of 3 days once in 2
years.
AWWs (40, 170) : 25 batches of 30 each x 27 centres x 3 days. Need for
accommodation with food.
c.
Ensuring Nutrition Competence
The project will generate enthusiasm for Nutrition in Karnataka, to achieve significant
reduction in infant and child mortality over the next five years.
The following workshops are to improve understanding of nutrition concepts and
strategies and to increase ownership and effectiveness and ownership of programmes.
WP450 d'anni’HNP-NUTRJTION-18.09.01 .doc
22
i.
Sensitization workshops for decision makers and Political leaders. Panchayats.
Period - One day for Officers, Panchayats (One Workshop in every Taluk and at
District level). And repeated every year. Similar event will be organised for the
media separately.
d.
Mobility- support for ICDS Staff
Since the ICDS Supervisors and CDPOs will be involved in the Projects new
components, there would be additional travel for organising and supervising the proposed
activities. Hence mobility support is essential. This would involve hiring of vehicles and
where required major repairs of existing ICDS vehicles. ’
e.
Project and finance managers will need to protect, increase and sustain budget
allocation for nutrition.
They could approach other schemes and public sources for additional funding. This is a
tangible area where private individuals, trusts and organisations would be willing to put
their funds. Project managers would need to champion the cause for nutrition and attract
funding. They would also need to ensure timely utilisation with accountability.
IMPROVING NUTRITION STATUS
SUMMARY OF INPUTS AND INTERVENTIONS FROM DIFFERENT SOURCES
i
Objective
Ongoing Programmes
Interventions
HNP Component
i
1. Nutrition Education as
part of health
promotion
ICDS through WCD
INP through WCD
(Proposal stage for 4
districts)
1. State Nutrition Officer.
2. State level consortium
on nutrition education.
3. District level nutrition
bodies.
4. Core group of trainers state and district.
5. Training of trainers.
workshops.
6. Development of
nutrition education
material.
7. Mass communication
strategy.
8. Resource centre for
nutrition education.
9. Partnerships.
10. Studies.
ICDS, BDCS, INP
1. Surveys by A WWs to
identify under 2s.
2. Increased cox erage /
projects / AWs for
urban and rural poor
coverage. Mapping
AWs / areas covered.
3. Training of ICDS
Supervisors. CDPOs,
ANMs, PHC staff. Joint
training.
4. Health checkups /
referrals / education
i
fixed day visits.
Early diagnosis and
treatment.
i
5. Training on
psychosocial
development and
parenting.
6. Community
Mobilisation.
!
i
|
2. Reduce under nutrition
of under six children and
particularly of under
twos.
1
D:’3nnf HXP-NUTRlTIOX-18.09.01.doc
I
'
24
3. Special package for
under 2s in 7 category C
districts (Bidar, Koppal,
Gulbarga, Raichur,
Bellary, Bagalkot,
Bijapur) and tribal
children.
4. Reduction of iron
deficiency anemia.
5. Reduction of Vitamin A
deficiency.
6.a) Ensure adequate
budgetary' allocation to
nutrition.
6.b) Develop technical
expertise in nutrition.
ICDS
RCH - IFA for pregnant,
lactating mothers.
Vitamin A prophylaxis
programes of National
Programme for Control of
Blindness
a) JD. Nutation, DHFW.
b) ICDS
1
1
|
i
1. Complementary food
programme using locally
available food involving
women's sangha's /
SHGS with intense
nutrition education.
2. Survey and monitoring.
1. Iron supplementation for
adolescent girls, non
pregnant women,
anemic boys and men.
2. Antihelmenthics - AWs,
schools.
3. Health promotion
1. Vitamin A supply to
meet gaps.
2. Health promotion
a) DHFW to take
responsibility for
adequate sustained
financial support from
GOK.
b) State and district
nutrition officers in
DHFW.
c) Training at different
levels of Health and
WCD staff for increased j
nutrition competence.
d) Sensitization workshops. |
ASSUMPTIONS AND RISKS
1.
Food and nutrition being an intersectoral issue, it is assumed that different departments
will collaborate, coordinate and work together at different levels (namely at 1685
PHCs, 175 taluk, 27 districts and state).
The risk is that any officers at these 1887 nodal points may due to personal
inadequacies, interpersonal reasons, or for maintaining turf or other reasons, not work
in collaboration. The leadership will have to be strong and lead by example.
2.
It is assumed that the complexities of improving nutrition status will be understood,
and that it will not be reduced to a food distribution progrmme with a few messages
thrown in.
D: anm HNP-NLTR1TI0N-IS 09.0! doc
25
3.
It is assumed that the Department of Health will take- greater responsibility for
nutrition, which it has not done in the past. If departmental and project leadership are
not pro-active, this objective and strategy will not work.
4.
It is assumed that in the pre project period steps will be taken to identify and put in
place a state nutrition officer and to appoint or send for training district nutrition
officers. The risk is that there will be a frequent turn over of district officers and if
officers are put in-charge and are not regular. The state and district officers will need
adequate administrative and financial powers.
5.
It is assumed that logistic arrangements for supplies will function with regularity, with
minimal political interference and corruption.
6.
Supervisory systems, if not functioning, will be a risk.
D: anni\HNP-NUTR!T10N-18.09.01 doc
26
- Media
 RF_COM_H_69_3_SUDHA.pdf
Position: 2250 (8 views)