HEALTH EXPENDITURES IN INDIA
Item
- Title
- HEALTH EXPENDITURES IN INDIA
- extracted text
-
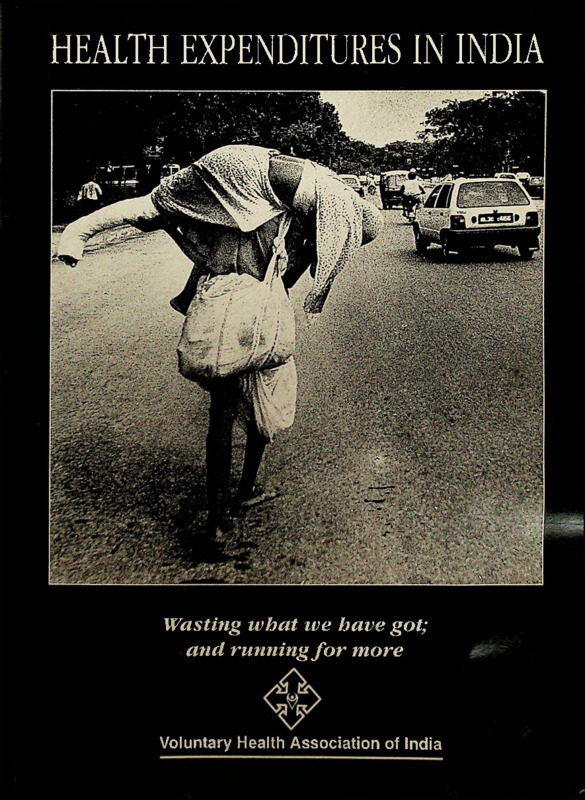
HEALTH EXPENDITURES IN INDIA
Wasting wbat ive have got;
and running for more
Voluntary Health Association of India
HEALTH EXPENDITURES IN INDIA
Wasting tvhat we have got;
and running for more
By
/
Dr. Bharat Jhunjhunwala
Voluntary Health Association of India
P
E
R
F
A
C
E
The considerable apprehension that we all had on the possible reduction of
financial allocation for the social sector was put to rest by the very encouraging
allocation of resources by the government in the recent budget. The present
government's seriousness ofpurpose to strengthen this sector is also indicated by the
fact that the country is willing to borrow moneyfrom International Institutions for
this so-called "non-profitable" sector.
For some time now, VHAI was looking into the current pattern of external
assistance to the health sector of this country and its utilisation. Unfortunately, the
findings of the study have revealed some startling facts. Across the board we see
extemely meagre utilisation of the assistance provided in the health sector. It is a
matter ofgreat shame and sorrow that on the one hand we find umpteen number
of Primary Health Centres and other health infrastructure are defunct due to
shortage of basic facilities and on the other, the valuable resources are being
squandered away.
Without putting the blame on any particular quarter we want to state as we have
done before through various other well-researched documents that the time has come
to clean up the Augean stables at the Ministry of Health & Family Welfare. A
feeble
Ministry cannot respond to the challenges of health care of 900
million people.
Alok Mukbopadhyay
Executive Director
Chapter I: Still a Long Way to Go
There is no doubt that the health of the people of India has been improving since the
beginning of this century. The two most important indicators of health are the Expectation
of Life at Birth (in years) and Infant Mortality Rate (Deaths per thousand Live Births). Both
these indicators have shown a tremendous improvement during this century.
Table 1
Health Indicators 1901-1991
Year
Expectation of life
at birth
(Years)
Infant Mortality
(per thousand live
births)
1901
23.8
N.A.
1911
1921
22.9
204
20.2
174
1931
1941
26.7
174
31.7
161
1951
32.1
146
1961
41.2
N.A.
1971
45.6
138
1981
54.4
119
1991
61.1
86
Source
Health Information of India, 1992, Ministry, of Health and Family Welfare,
1993- Tables 2.10, 2.11 & 2.04.
The expectation of life has increased from 20.2 years in 1921 to 61.1 years in 1991. Similarly
the Infant Mortality Rate has fallen from 204 deaths per thousand in 1911 to 86 in 1991. These
are no small achievements.
However, there is still a long way to go. We are still far behind the world standards which
have been shown in Table 2.
•
Table 2
Internationa 1 Comparison of Health Indicators, 1991
Country
Expectation of life
at Birth in 1991, (Years)
India
61
Developing World
67
Developed World
77
China
69
U.S.A.
76
Source : World Development Report, 1993-
1
It will be seen that India is not only far behind the developed world but even in comparison
to other developing countries.
Nearer home, Kerala has already achieved an Infant Mortality Rate of 17 deaths per thousand
live births. The Infant Mortality Rate for the best and the worst states is given at Table 3.
Table 3
Estimated Infant Mortality Rates
State
Infant Mortality
Rate, 1991
(Per thousand live births)
Expectation of Life
at Birth, 1981
(Years)
Best States
Kerala
17
68.5
Maharashtra
64
58.1
Punjab
66
62.8
Uttar Pradesh
105
46.8
Madhya Pradesh
120
50.2
Orissa
127
50.8
86
54.4
Worst States
All India
Average
Source : Health Information of India, 1992, Table 2.05, 2.12.
The Infant Mortality rate varies from a low of 17 deaths per thousand live births in Kerala
to a high of 127 in Orissa—more than 7 times. Similarly, the Expectation of Life is at a low
of 46.8 years for U.P. in 1980 against 66.5 years for Kerala. Thus, what has been achieved
leaves no place for complacency. We need to go much faster.
2
Chapter 2 : Utilisation of Funds
We have seen that the health scene leaves much to be desired. On ther other hand, a scrutiny
of various internationally funded programmes shows that the funds are not being utilised
well.
THE WORLD BANK
The World Bank has emerged as a major lender in the health sector. The World Bank has
two windows for lending. The International Bank for Reconstruction and Development
(IBRD) lends at commercial rates of interest which the International Development Agency
(IDA) lends at—concessional rates of interest. The typical IDA loan has 40 years maturity
period and an interest cahrge of 0.75 percent. Bulk of-the World Bank assistance in the health
sector comes from the IDA window. Considering that the value of money would have
depreciated to about 5 percent in 40 years and the loans would have to be repaid at that
value, the IDA assistance is virtually like a grant.
The commitment and utilisation of assitance by the World Bank in Health Sector is given
in Table 4.
•
SI.
Lending
No.
Agency
1.
IBRD
Project
Table 4
000 US s
•
Year of
Total
Sanction
Committme nt 1991-92
Utilisation
Total Utli-
Total
sation uptc
percent
Utilisation
31.3.92
Utilisation
per year
Percent
Industrial Pollution
Control
2.
IDA
Sixth Population
3.
IDA
Seventh Population
4.
IDA
Child Survival and
Project
Project
Safe Motherhood
1991-92
124,000
6,022
6,022
4.8%
4.8%
1989-90
87,200
4,387
19,027
21.8%
7.3%
1990-91
63,400
4,942
8,530
13.5%
6.7%
1991-92
160,900
13,146
13,146
8.2%
8.2%
Source . External Assistance 1991-92, Ministry of Finance.
It will be seen that the utilisation per year for World Bank Assistance has been in the range
of 5-8 percent.
The IDA has sanctioned another loan for National AIDS Control Programme in 1992-93. The
exact figures are not available but the total amount is reported to be in the range of USS 100
million, or Rs. 320 crores. The utilisation of funds till January 1994 is given in Table 5. It will
be seen taht only 3.4 percent of the money available was claimed from the IDA.
The result of the poor utilisation of funds is that the World Bank has been
progressively reducing its committments to India (see Figure 1). The commitments
were between USS 2500 to 3000 million during 1984-85 to 1988-89- The utilisation
(in all sectors) was only around 61 percent. Thus, the World Bank reduced its
committments to around USS 2000 million to match with the ability of the
3
Government to use the funds.
COMMITMENTS V/S DISBURSEMENTS
f million
National AIDS Control Programme
SI.
No.
Description
1.
IDA Commitment
2.
Grants Released to
the States
3.
4.
1992-93
Amount
Percent
1993-94
(Upto January
1994-10.months)
Amount
Percent
70.0
100
73.0
100
11.43
3.56
16.3
5.1
2.9
0.82
4.0
Expenditures reported
Reimbursement claimed
from IDA
2.35
3.4
N.A.
N.A.
1.1
As a result, according to Dr Anthony Mesham of World Bank, the undisbursed amount has
marginally come down from USS 14 billion 3 years ago to USS 10 billion presently.
Needless to say, in comparison to the overall utilisation the utilisation, in the health sector
was very poor. Taking the life cycle of a typical project at five years, the annual utilisation
should be about 20 percent. Against this, the utilisation in the health sector was around 67 percent and in all sectors it was around 12 percent.
A result of this non-utilisation has been that India has the unique distinction of being the
only country to be mentioned in the Annual Report of World Bank, 1993 where large loans
4
have been cancelled. To quote from the report: "The Bank is working closely with
borrowers to ensure more timely project start-ups and has adopted a more pro-active stance
towards project restructuring, cancellation and closure. This stance, for example, has
resulted in recent, large cancellations of IBRD operations (fifteen projects valued at $ 850
million) and redeployment of IDA funds (eighteen projects valued at S 379 million) in India”
(p 124).
According to Dr Mesham, the major difficulty in disbursements in the health sector was that
the State Government not understood the procedures for claiming reimbursement have. The
World Bank had been dealing with the Ministry of Health and Family Welfare (MHF), which,
in turn, was communicating the procedures to the states, obtaining expenditure statements
and submitting to the Bank. Somehow, the process was not being understood by the States,
leading to poor disbursements. Reportedly, under pressure from the Bank, the Ministry of
Health and Family Welfare has recently agreed that the Bank may lend directly to the states.
THE UN SYSTEM
Two agencies of the UN sysjem having significant presence in the Health Sector are The
United Nations Population Fund (UNFPA) and United Nations Children's Fund (UNICEF).
The UNFPA mainly funds programmes in the area of family planning and welfare. It held
a mid-term review of its programme for India 1991-95 in May 1993 with the Ministry of Health
and FAmily Welfare. According to the report submitted to the MHF for the review, the overall
performance of MHF appears to have been quite reasonable in 1992 with nearly 87 percent
utilisation of the Programme Allocations. However, there still were some projects which had
been lagging behind. The details of some of such projects is given in Table 6.
Table 6
•
UNFPA : Slow Moving Projects
SI.
No.
Programme
Allocation
1992
Actual
Expenditure 1992
Percent
Utilisation
1.
Monitoring Sterilisation
65
43
66
2.
Centres of Excellence
220
83
38
3.
4.
FW Area Project - HP
1935
1326
68
Study Tours
90
18
20
77
49
64
6
1
17
2
67
5.
Population Education
- Higher Education
6.
Programme Development
7.
Women Development
8.
Total Slow Moving
3
2396
1522
63
9.
Total, All Projects
11700
10259
88
Mission
(Haryana)
Although UNFPA assitance gives a better picture, it has to be seen under the backdrop of
reducing committments from the UNFPA. In 1990 the UNFPA allocation for India was US
$16.3 million. In view of the poor utilisation, UNFPA reduced its allocation to $ 11.2 million
5
in 1991 and $ 11.7 million in 1992. Moreover, UNFPA revises its allocations every six months
and provides more money to fast moving projects and takes away from slow moving projects.
IMPLEMENTATION PROBLEMS
While each project has a specific set of problems, there are many problems which are common
to all projects. These are refelcted at various stages such as project documents preparation,
project implementation and mid-course correction. The main prblem areas are given below:
1.
There is a considerable gap between the signing of a project document and its actual
implementation. This gap ranges anywhere betw'een six months to five years.
2.
At the time of implementation, all project components are not given equal importance.
Certain components get more preferene than others.
3.
Projects initiated by a particular person get affected if continuity in leadership is not
available. A new incumbent often would like to substantially or totally change the project
components.
4.
Projects initiated by the centre are often given to the state governments for implementation
whether the states are interested or not. State government preferences do not always
match with Central Government priorities.
5.
Too many projects sponsored by different donor agencies in a particular geographical
area often make it difficult for the state governments to absorb funds and to cope up with
workloads.
6.
Major projects, often measured in terms of budgetary allocations overshadow the minor
projects if taken up in the same state either by the same donor agency or by different donor
agencies.
7.
Inter-sectoral activities which call for coordination between various departments and
agencies often encounter difficuties in implementation. In most cases, it requires
herculean efforts to bring these departments together.
8.
Organisation structures and mechanisms created for speedy implementation of project
components, at times, become major hindrances. Too many committees, lack of clarity
on roles, functions and decision-making authority, and separate officers make the project
activities look different from mainstream activites.
9.
While all major projects have components of personnel to administer the project, posts do
not get filled in because of cumbersome rules, and at times due to blanket ban on
recruitment. What has been agreed at the time of project agreement is often over-ruled
later because of promulgation of general rules applicable to all departments.
10 Flow of financial resources is a major problem. Though budgetary sanctions are accorded
to all activities int he beginning, specific sanctions are required to spend money on each
activity. This results in considerable delay in flow of resources. Implementing agencies in
health and family welfare departments have hardly any authority or flexibility. Given this,
in recent times, state governments and donor agencies have, more often than not, created
flexible mechanisms outside the formal government structures to ensure regular and
timely flow of funds.
Source: UNFPA Mid-term Review Report.
6
Thus, the allocations for slow moving projects are gradually brought in tune with the actual
speed of expenditure. The importance of this fact is that if the utilisation was belter, UNFPA
may have been willing to allocate yet more funds.
The major problem faced by UNFPA was that the money had to often go through five
accounts to reach the actual user. For example, the money for school education project was
paid by UNFPA to the MHF, which paid to Ministry of Fluman Resources, whcih paid to
NCERT, which paid to the Slate Councils of Eduation Research and Training who were to
actually spend the money. The result was that often the State Councils were starved of funds
despite UNFPA having paid to MI IF. On one occasion the retirement of one person at NCERT
and the delays in appointment of the replacement had blocked the process for many months.
UNFPA has also not been able to obtain audited expenditure statements of the monies paid
by it. This was causing difficulty. Since all the money was first going into the Central
Government kitty, it could not be audited by and external' auditor.
In fact, one wonders if there is a need for a nodal ministry. In the above example, MHF came
into the picture only because it was the nodal ministry for UNFPA although the entire project
was being handled by the Education Ministry. The only explanation seems to lie in the fact
that MHF would not like to part with its 'influence' over UNFPA funds.
The result of this situation is that most MCH/FP projects are behind the stipulated time
schedule. UNFPA has suggested that it would like to drop "all projects pending for more
than 2 years”; and it has sought the assistance of MHF “to create a more responsive flow
of financial resources” (p 1-2 of Mid-term Review Report).
The various problems of implementation outlined by the Review are given in the box.
The UNFPA report goes on to mention that “there are several reasons for low expenditure
levels on projects: 1) New projects that are supposed to commence in 1992 could not begin
due to delays in government clearances; 2) Amount of expenditure incurred on on-going
projects was much less than estimated levels due to slow progress in implementation.” Thus,
the situation continues to be bleak if one looks at what could have been achieved by a little
more attention on the part of the Government of India.
The other important UN agency in the Health sector is UNICEF. Unfortunately, UNICEF office
was tight-lipped about discussing the problems. However, Health Ministry sources provided
a statement of the budgets and utilisation for the major UNICEF Scheme—The Expanded
Programme for Immunisation (EPI). UNICEF has an accounting system wherein the
unutilised budget of one year is automatically carried forward and added to the budget for
the next year. Hence, if some money allocated for 1991 was ultimately utilised in 1993, it
would appear in the budget of 1991,1992 as well as 1993- Precisely for this reason, the figures
give a correct picture of the funds available in any particular year whether by way of carry
forwards or fresh allocations.
7
Table 7
UNICEF : Funds Utilisation EPI
SI.No
No.
Year
1.
1991
2.
1992
1993
30,731
1991-93
113,973
3.
4.
Total
Utilisation
Amount
Utilisation
Percent
38,784
18,302
44,458
25,622
47.2
57.6
17,913
61,837
58.3
54.3
Budget
Amount
It will be seen that the utilisation of UNICEF funds has been in the range of 50-60 percent
only.
BI-LATERAL FUNDS
A large part of foreign funds comes through bi-lateral arrangements. The Aid and Accounts
Audit Division of Department of Economic Affairs publishers annual statistics of External
Assistance. The last year for which they are available are 1991-92. The details of projects in
the health sector are given in Table 8. All figures relate to grants, not loans.
The average rate of utilisation for 1991-92 was 7.8 percent for UK, 10.7 percent for Denmark,
24.5 percent for USA, 29.7 percent for Japan, and 64.0 percent for Norway. It must be
metnioned that these percentages have been calculated on the basis of total undisbursed
funds available as at 1.4.1991. This would include the amount to be utilised in subsequent
years. However, since break-ups for the amount budgeted for 1991-92 were not available,
the total amount has been used to calculated the percent utilisation. Nevertheless, they do
give us an overall feel of the situation.
The bi-laterial donor agencies are virtually disgusted with the state of affairs. In the opinion
of one donor, the situation in India was “the worst that I have seen".
The main problem repeated by the donors was that it took a tremendous amount of energy
to get anything done through the Health Ministry. In the words of one donor, the MHF was
the bottleneck between the donor and the state governments, which were the actual user
of the funds. According to him, “the relationship between the MHF and the state
governments is no mystery. The MHF wants to control the funds. The state governments
incur the expenditures and submit statements to the MHF. The Health Ministry consolidates
them and submits to the Donor. The Donor gives money to MHF which, in turn, re-imburses
the state government. The whole process gets stuck in the bureaucracy. We want to release
money to the states directly but the govenment would not let us.”
Then there are problems at the level of sanction also. Here the Department of Economic
Affaris (DEA) of Ministry of Finance comes into the picture. Any foregin assistance proposal
from MHF has to be routed through the DEA. Thus, initiation of a project requires yet another
stage. The state concerned approaches the Donor for funds and prepares a scheme. It sends
to MHF, which sends to DEA for approval. The whole process takes anywhere from 6 months
to five years! This can be seen most visibly in the bi-lateral grants fro USA. Most projects have
been negotiated and re-negotiated for over 3 to 4 years (see Table 8).
8
•
Table 8
Bi-lateral Grants in Health Sector, 1991-92
U.K.
Utilised in
1991-92
years of
Sanction
Amount
Authorised
upto
31.3.92
Amount
Utilised
upto
31.3.91
Amount
Available
in
1991-92'
Amount
Percent
3
4
5
6
7
8
18.0
0.2
7.8
17.9
17.9
1.4
1.4
0.2
7.8
SI.
No.
Scheme
1
2
1.
Orissa Family
welfare II
1990
Sub Total U.K.
18.0
MILLION POUNDS
• U|
I?'"-
■ A
_____________
DENMARK
Utilised in
1991-92
years of
Sanction
Amount
Authorised
upto
31.3.92
Amount
Utilised
upto
31.3.91
Amount
Available
in
1991-92-
Amount
Percent
3
4
5
6
7
8
205.0
92.5
42.5
0.5
0.5
NA
14.8
10.6
4.2
0.0
0.0
Health Care Project
M.P. I&II
NA
250.4
188.0
62.4
13.8
22.1
4.
Health Care
Project T.N., I & II
NA
223.3
152.0
71.3
18.7
26.3
5.
National Programme
for Eradication of
Leprosy
NA
81.5
28.6
52.9
0.0
0.0
Health Care & Family
Welfare Project,
Chandigarh, I & 11
NA
SI.
No.
Scheme
1
2
1.
National Programme for
Control of Blindness
I&II
NA
2
Health Care and
Family Welfare Project,
New Delhi I & II
3.
MILLION D KR.
6.
Sub Total Denmark
11.8
7.2
4.6
0.0
0.0
786.8
478.9
307.9
33.0
10.7
Presumably thisfigure includes amounts to be spent on subsequentyears. However,
since no break-up of amount budgettedfor 1991-92 has been give separately, the
totalfigure of balance amount available has been given.,
9
U.S.A
SI.
No.
Scheme
1
2
1.
Family Planning
Communication &
Marketing Grant
2.
Bio-medical Research
Support
3.
Contraceptive
Development and
hiproductive
Immunology
4.
Child Survival
and Health Support
1985 & 88
1986
1988 & 89
5.
Vaccine ImmunodLignostic Development
6.
Private Voluntary
Organisation for
Health
Sub-Total U.S.A
years of
Sanction
3
Amount
Authorised
upto
31.392
Amount
Utilised
upto
31.3.91
Amount
Available
in
1991-92*
Amount
Percent
4
5
6
7
8
Utilised in
1991-92
MILLION USS
1983
17.5
3.0
14.5
1.2
8.3
1985
1987- 88
9.3
0.9
8.4
0.0
0.0
3.2
0.2
3.0
0.01
0.3
41.1
22.2
18.9
8.0
42.3
1989
4.0
0.3
3.7
0.2
5.4
1987
6.5
0.5
6.0
0.4
6.7
81.6
27.1
40.0
9.81
24.5
Source : External Assistance 1991-92, Aid Accounts and Audit Division, Ministry
of Ftnace.
JAPAN
SI.
No.
Scheme
1
1.
2.
years of
Sanction
Amount
Authorised
upto
31.3.92
Amount
Utilised
upto
31.3.91
Amount
Available
in
1991-92*
Amount
Percent
2
3
4
5
6
7
8
Regional Cancer
Centre Madras
Regional Cancer
Centre (Grand Aid)
Sub Total Japan
1988
641.0
609.8
34.2
34.2
100.0
1989
616.0
13.0
603.0
154.8
25.7
1257.0
622.8
637.2
189.0
29.7
10
Utilised in
1991-92
Utilised in
1991-92
years of
Sanction
Amount
Authorised
upto
31.3.92
Amount
Utilised
upto
31.3.91
Amount
Available
in
1991-92-
Amount
Percent
2
3
4
5
6
7
8
Family Welfare PP II
Eradication of
Leprosy
Sub Total Norway
NA
NA
215.0
10.0
170.7
2.4
44.3
7.6
33.2
0.0
74.9
0.0
225.0
173.1
51.9
33.2
64.0
03.03.94
SI.
No.
Scheme
1
1.
2.
HGL
\OO
7? <
f
library
ANO
M\ BOCUMcNTATION
> ox
> 'r-
J r".
Chapter 3 : Suggestions
It is too much to expect this quick study to be able to come to any 'conclusions'. However,
this much can be stated that a problem does exist. The main difficulty seems to be that health
is a state subject under the Constitution. Thus, all programmes relating to health have to be
implemented by the state governments, or at least have their positive concrurence and
support. However, the international donor agencies have to primarily deal with the Central
Ministries of Health and Finance. In the words of Mr. R.K. Ahooja, former Jt. Secretary in
Ministry of Health, "the donors have no direct access to the state governments." Thus, "the
states do not understand the procedures.” This was the same remark as made by Dr Anthony
Mesham of the World Bank. The result is that the International Health Division of Ministry
of health is overburdened with gening the communicaton established between the State
governments and donors. The whole system gets slowed down here. The norms are set by
the Central Ministries and the State Governments have no say in it. There is no flexibility
at the state level. Any problem has to be sorted out with the donors only through MHF, and
gets stuck there. One of the donors explicity stated that the problem was that MHF was
unwilling to relinguish its influence and control over the funds.
The second major problem duly emphasised by Mr. Som Nath Som, Advisor (Health)
Planning Commission, was that according to the procedures set by MHF, the State
governments had to first incur an expenditure from their own funds and then seek re
imbursement from the donors. Often the States have had a problem of liquidity. They do
not have the funds to spend initially. Then, due to inadequate understanding of the
procedures often the expected re-imbursement does not take place due to non-adherence
to the norms. This makes the States hesitant to put in their own money. As a result the money
available from the donors does not get utilised.
Dr BbaratJbunjbunwala did his Ph.D in economicsfrom University ofFlorida in
1973- He taught at the Indian Institute of Management, Bangalore from 1973 to
1979. In this period be lived in a slum for two years and was active in the Trade
Union movement. He has been a free-lance consultant since then. Presently, he is
editing Legal News & Views, a Journal which aims to assist the NGOs.
12
The Voluntary Health Association of Ind ia (VHAI) is a secular, non-profit
federation of over 3000 organisations working in the field of health and
community development. VHAI strives to make health a reality for all,
especially the unreached and the oppressed.
VHAI fulfills these objectives primarily through training and by provid
ing information to the target groups. In support of its objectives, VHAI
also develops and distributes appropriate educational aids to the
organisations serving at the grassroots. Linking up these organisations
through its newsletters and journals also constitutes an important
activity of VHAI.
’
Tong Swasthya Bhavan, 40, Institutional Area
South of IIT, Near Qutab Hotel, New Delhi110016 INDIA
Phones : 652953, 655871, 665018, 668071, 668072
■
Voluntary Health Association of India
.ii. 7 i'k s
VHAI researches into and campaigns on relevant and important health
issues to ensure that a people-oriented health policy is brought about
and effectively implemented. VHAI also works to sensitise the large
public towards a scientific attitude to health.
- Media
 2836.pdf
Position: 1449 (14 views)