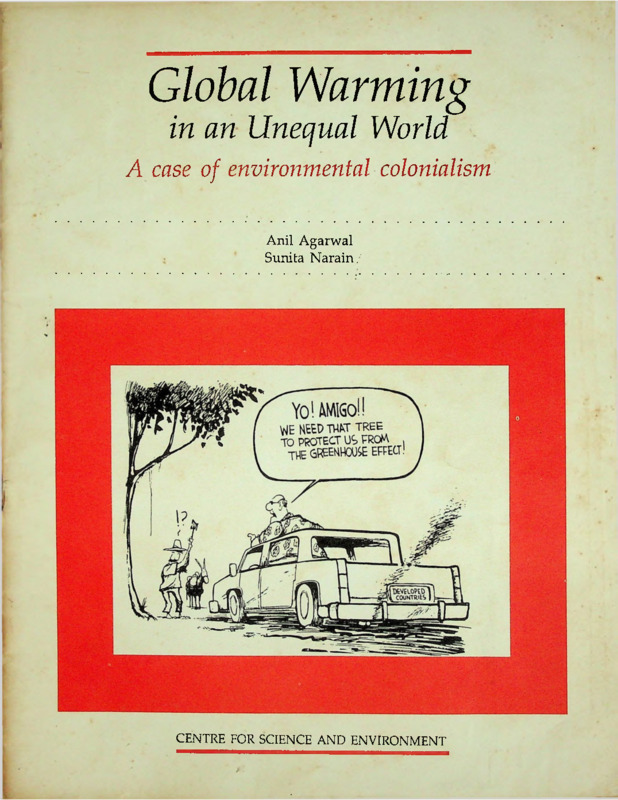
Global Warming in an Unequal World A Case of Environmental Colonialism
Item
- Title
-
Global Warming
in an Unequal World
A Case of Environmental Colonialism - extracted text
-
Global Warming
in an Unequal World
A case of environmental colonialism
Anil Agarwal
Sunita Narain .’
CENTRE FOR SCIENCE AND ENVIRONMENT
Global Warming
in an Unequal World
A case of environmental colonialism
Anil Agarwal
Sunita Narain
CENTRE FOR SCIENCE AND ENVIRONMENT
We would like to thank the following people who made this publication possible :
Tapan Chowdhury coordinated the work on the tables and figures and spent an
enormous effort in calculating and checking the figures. He was assisted in this
work by Urmila Chathli and K. Rajesh.
Leena Bhanot coordinated the production.
B.P. Cupta did the graphs and charts for the publication.
A.M. Jainamma and Rakesh Kumar typed and corrected the drafts.
We would like to thank, in particular, the Centre's documentation staff without
whose careful and assiduous collection of material from across the world, this
publication would not have been possible.
We are really very grateful to S. Sudha, books and magazine coordinator,
Mariamma Jim, newspaper coordinator, and their colleagues for their
painstaking work.
We are also very grateful to all ihose who spent time giving us comments,
particularly Dr. S.K. Sinha of the Indian Agricultural Research Institute,
Dr. V. Asthana of Jawaharlal Nehru University, Praful Bidwai of the Times of India
and Dr. R.K. Pachauri of the Tata Energy Research Institute. Several people in the
government who helped us cannot be named for obvious reasons.
January, 1991
© 1991 Centre for Science and Environment
Published by the Centre for Science and Environment,
807 Vishal Bhawan, 95 Nehru Place, New Delhi - 110 019.
Cartoons taken with grateful thanks from Scott Willis, BOS NiEuwslettcr,
Netherlands; State of India's Environment Report, India; Indian Express, New Delhi;
and, New Internationalist, UK.
Designed and printed by Design & Print, New Delhi. Ph: 6445895, 6448418.
List of Figures
1.
Total Emissions of Greenhouses gases of top 10 emitting nations.
2.
Permissible Emissions versus Total Emissions of Carbon Dioxide of select
countries on the basis of population.
?
Permissible Emissions versus Total Emissions of Methane of select countries
on the basis of population.
4.
Comparative figures of total emissions of Greenhouse gases of WRI's top
10 emitting nations.
5.
Percentage distribution of Net Emissions of Greenhouse gases by industrialised
and developing countries.
6.
Net Emissions of Greenhouse gases to the atmosphere (top 15 emitters).
7.
Comparative Net Emissions of Greenhouse gases to the atmosphere of select
developing countries.
List of Tables
1.
Natural sinks of Greenhouse gases.
2.
Comparison of CSE and WRI figures of Annual Net Emission of all
Greenhouse gases to the atmosphere (top 15 emitters).
3.
Percentage Distribution of Annual Net Emissions of industrialised and
developing countries of all Greenhouse gases.
4.
Comparison of CSE and WRI figures of per capita Annual Net Emissions of all
Greenhouse gases to the atmosphere (top 15 emitters).
5.
Trade amounts and damages payable by top 15 industrialised and oil-rich net emitters.
6.
Trade amounts receivable by top 20 countries which trade quotas of
permissible emissions of Carbon Dioxide and Methane.
Appendices
1.
Total Emissions of Greenhouse gases (as calculated by WRI).
2.
Permissible Emissions of Carbon Dioxide and Methane on a population basis
(as calculated by CSE).
3.
Annual Net Emissions to the atmosphere of Carbon Dioxide
(as calculated by CSE).
4.
Annual Net Emissions to the atmosphere of Methane (as calculated by CSE).
5.
Per capita Annual Net Emissions to the atmosphere of Carbon Dioxide
(as calculated by CSE).
6.
Per capita Annual Net Emissions to the atmosphere of Methane
(as calculated by CSE).
7.
Annual Net Emissions of all Greenhouse gases to the atmosphere
(as calculated by CSE).
8.
Per capita Annual Net Emissions of all Greenhouse gases to the atmosphere
(as calculated by CSE).
9.
Reasons why certain developing countries figure in top 20 list of net emitters.
Global Warming
in an Unequal World
he idea that developing countries like India and
China must share the blame for heating up the
earth and destabilising its climate, as espoused in a
recent study published in the United States by the
World Resources Institute in collaboration with the
United Nations, is an excellent example of environ
mental colonialism.
The report of the World Resources Institute (WRI),
a Washington- based private research group, is based
less on science and more on politically motivated and
mathematical jugglery1. Its main intention seems to be
to blame developing countries for global warming and
perpetuate the current global inequality in the use of
the earth's environment and its resources.
A detailed look at the data presented by WRI itself leads
to the conclusion that India and China cannot be held
responsible even for a single kg of carbon dioxide or methane
that is accumulating in the earth's atmosphere. Carbon
dioxide and methane are two of the important gases
contributing to global warming. The accumulation in the
earth's atmosphere of these gases is mainly the result of the
gargantuan consumption of the developed countries, par
ticularly the United States.
The WRI report is entirely designed to blame deve
loping countries for sharing the responsibility for
global warming. Global wanning is a phenomenon
that could lead to major climatic disturbances, drying
up of rain over large areas, and melting of the ice caps
leading to countries like Maldives disappearing
completely and India and Bangladesh losing a large
part of their coastline.
The WRI report is already being quoted widely and
its figures will definitely be used to influence the
deliberations on the proposed, legally-binding, global
climate convention. This kind of data will be used by
the US government to strengthen its position, which
it took during the ozone negotiations, that it will not
pay for ecological reparations. The US government
agreed to the paltry amounts negotiated at the London
1990 meeting for a global ozone fund only after
considerable pressure from European countries, par
ticularly the Scandinavian countries.
Many developing countries fear that the proposed
climate convention will put serious brakes on their
development by limiting their ability to produce
T
energy, particularly from coal (which is responsible
for producing carbon dioxide), and undertake rice
agriculture and animal care programmes (activities
which produce methane).
Behind the global rules and the global discipline
that is being thrust upon the hapless Third World,
there is precious little global sharing or even an effort
by the West to understand the perspectives of the
other two-thirds. How can we visualise any kind of
global management, in a world so highly divided
between the rich and the poor, the powerful and the
powerless, which does not have a basic element of
economic justice and equity. One American is equal
to, god knows, how many Indians or Africans in terms
of global resource consumption.
The entire debate on the prospects of impending
doom is, in many ways, an excellent opportunity for
the world to truly realise the concept of one world.
A world which is interdependent and which cannot
withstand the current levels of consumption and
exploitation, especially the levels now prevalent in the
West. We had hoped that Western environmentalists
would seize this opportunity to force their countries
to 'dedevelop' as they have used up the world's
ecological capital and continue to overuse it even
today. Sadly, instead, the focus today is on poor
developing countries and their miniscule resource use
is frowned upon as hysteria is built up about their
potential increase in consumption. For instance, in the
negotiations to reduce ozone destructive gases, the
common refrain has been that the future potential of
CFC production in India and China -- which together
produce only 2 per cent of the responsible chemicals
today — constitutes a threat to global survival. As their
consumption is bound to increase, the dream of every
Chinese to own a refrigerator, is being described as
a global curse.
The Washington-based Worldwatch Institute points
out in a recent paper : ".. . there remains the extraor
dinarily difficult question of whether carbon emis
sions should be limited in developing countries, and
if so at what level. It is a simple fact of atmospheric
science that the planet will never be able to support
a population of 10 billion people emitting carbon at,
say, the rate of Western Europe today. This would
1
imply carbon emission's of four times the current
level, or as high as 23 billion tonnes per year.2"
Gus Speth, WRI's president in an article in Environ
ment magazine puts it more bluntly "Deforestation
and other land use. changes now account for about
one-third of the carbon dioxide produced by human
activity and some of the methane. If just China and
India were to increase their greenhouse gas emissions
to the global average per capita rate, today's global
total would rise 28 per cent; if these two countries
matched France's per capita rate, the total would be
68 per cent higher". Speth, therefore, concludes: "As
a practical matter, developing countries expect indus
trial countries to take the first and strongest actions
on global warming. These developing nations want to
see the seriousness of the threat validated, and they
conclude correctly that industrial nations are largely
responsible for the problem and have the most
resources to do something about it. But carrying this
argument too far could lead to a tragic stalemate".3
It is constantly mentioned that the efforts of the
West to check pollution and global warming could be
torpedoed by a rise in coal burning in the developing
world. Why should we do anything if you are also
going to want cars, electricity or refrigerators is the
underlining statement. Recently, the head of the
environmental group of the International Energy
Agency (IEA) based in Brussels — an agency which
looks after the energy interests of rich countries — told
the press that the coal use in developing countries
could have very dramatic environmental implications.
"The levels of coal use predicted for India and China
could have a very dramatic environmental impact
indeed. If developing countries keep to the sort of
forecasts of coal consumption now being bandied
about, they would negate any effort by Western
countries to control emissions of greenhouse gases,"
the IEA official recently told Reuters.4
We consider such statements, now commonplace in the
West, both irresponsible and highly partisan. They consti
tute the worst form of preaching the world has ever seen
— literally amounting to blaming the victim. If anything,
the available figures show that the West must immediately
put its own house in order.
And this is when Western nations themselves are
talking, at most, about stabilising their current con
sumption of energy use or reducing them marginally.
The US has in fact rejected even discussions about
stabilising its consumption as US President George
Bush now considers the global warming debate a mere
myth. But even stabilising energy consumption means
maintaining the manifold inequity in resource con
sumption between the developed and developing
worlds. Does this mean that developing countries will
be "allowed" to reach these levels or is our quota of
the global atmosphere finished ?
India and China today account for more than one third
of the world's population. The question to be asked is
whether we are consuming one-third of the world's
resources or contributing one-third of the muck and dirt in
the atmosphere or the oceans. If not then surely these
countries should be lauded for keeping the world in balance
because of their parsimonious consumption despite the
Western rape and pillage of the world's resources.
The California based International Project for Sus
tainable Energy Paths (IPSEP) in its report on Energy
Policy in the Greenhouse has warned against any
trend towards "environmental colonialism in which
the climate issues is inadvertently or deliberately used
to reinforce traditional agendas that are in conflict
with the North-South com
bine".5 The report, which the
British newsmagazine, New
Scientist, called the first de
tailed formula for reducing
releases of carbon dioxide by
the year 2005, has argued for
substantial and urgent reduc
tions of emissions of indus
trialised countries, who de
pending on the mathematical
calculations, have already ei
ther used up their entire quota
of emissions to the atmos
phere until 2100 or will be
doing so by 1997.6
The manner in which the
global warming debate is being
carried out is only sharpening
and deepening the NorthSouth divide. Given this new
Stomach gas from cattle allegedly contributes to global warming.
found interest in the so-called
2
Our Common Future and future generations, it is time
for the Third World to ask the West, "whose future
generations are we seeking to protect, the Western
World's or the Third World's"?
WRI report reinforces this divide. By shifting the onus
onto the developing world, it whitewashes the role and the
responsibility of the West in destroying our "common
future". James Gus Speth, WRI's president says diplomati
cally about his report, "the new information means that
industrial and developing countries must work together to
begin reducing emissions of greenhouse gases and we need
a new era of environmental cooperation". Third World en
vironmentalists must not get taken for a ride by this highly
partisan 'one worldism'.
tation estimates have been overstated (see box). Even
though Brazil's deforestation did peak in 1987, several
Brazilian sources point out that they have reduced
substantially since then. Its carbon dioxide emissions
since 1987, and on average during the 1980s, are much
lower than those taken by WRI to calculate carbon
dioxide emissions. Similarly, in India, deforestation
rates do not seem to be the same as that of the 1970s,
that is, 1.5 million hectares a year — the figure taken
as the yearly average by WRI for the 1980s.
According to the Forest Survey of India, defores
tation rates have gone down in the 1980s. The latest
assessment based on satellite imagery over a four
period year between 1981-83 and 1985-87 shows that
the rate of forest loss has gone down to 47,500 ha each
year -- a mere 3 per cent of the earlier estimate7. These
figures may well be an understatement as most Indian
environmentalists would allege. But even if it is onetenth of the true figure, it will be nowhere near the
figures used by WRI. Increased public awareness,
relatively stricter implementation of forest legislation
and other measures have definitely driven down the
rate of deforestation in the country compared to the
1970s. And even though there is a lot still to be done
in this area, it is unlikely that India has the dubious
distinction of destroying 1.5 mha of forests each year
even in the 80's.
For other developing countries also, the accuracy
WRI's calculations: faulty and prejudiced
The figures used by WRI to calculate the quantity of
carbon dioxide and methane produced by each
country are extremely questionable. Heavy emphasis
has been placed on carbon dioxide production due to
deforestation and methane production from rice fields and
livestockas compared to carbon dioxide production from the
use of fossil fuels like oil and coal. Since developing
countries are more responsible for the former, the heavy
emphasis on deforestation and methane generation tends to
overplay their contribution while underplaying that of the
developed countries.
Brazil, for instance, is a clear case where defores
3
government-owned National Space Research Institute of
Brazil which has used satellite imagery to estimate de
forestation in different years (see table). The estimates vary
from 1.4 mha to 8 mha of forest loss in a single year. This
range is very large and has been explained in WRI's own
review. According to a satellite based survey by Alberto
Setzer of the National Space Research Agency, deforesta
tion in 1987 was around 8 mha. The very next year, how
ever, when he resurveyed the area he found that deforesta
tion had reduced drastically - by more than half. And, in
1989, the following year it had come down even further.
Thus, 1987 was clearly an aberration and in no way the
average.
WRI itself writes, "1987 may have been an anomalously
high year for deforestation in the Brazilian Amazon”. The
reasons being that it was the last year that tax credits were
available to land holders for clearance of the Amazon. This,
obviously, lead to extensive clearance of the forests as
people rushed to take advantage of this and other legislative
proposals which encouraged clearance and extension of cul
tivation. In 1988 and 1989, tax credits were, however,
suspended and later cancelled. And pushed on by interna
tional pressure, the Brazilian government started a cam
paign to slow down the burning. Wetter conditions over this
period also helped to dampen fires and encourage regen
eration.
Yet with amazing audacity, WRI takes the 1987 estimate
not for one single year but as an average for the entire
Brazil’s deforestation : what is the truth ?
The World Resources Institute (WRI) contends that
developing countries contribute almost half the green
house gas emissions leading to global warming. A major
share of the developing world comes, according to WRI,
from one country, Brazil, allegedly because of the
extensive deforestation of the Amazon forest over the
past one decade. Brazil’s total contribution ranks third
next to only USA and USSR, contributing as much as 15
per cent of the net carbon dioxide emissions of the world.
Brazilians, on the other hand, have strongly objected to
this unfair emphasis on deforestation as a cause of
climate change, particularly as the data base on defor
estation rates, unlike the rates of fossil fuel use, is very
poor. And it is also possible to calculate more accurately
carbon dioxide emissions from fossil fuel consumption
than from deforestation.
Leaving aside the lack of good data about deforesta
tion and its impact on climate change, a detailed look at
the figures presented by WRI shows clearly that assess
ments of Brazil’s deforestation vary enormously and may
not be as high as claimed or highlighted by it.
The total area of the Amazon legally under Brazil is
roughly 340 million hectare (mha) out of a total Amazonian
area of 500 mha, which it shares with its neighbouring
countries. There are different assessments for the rate of
forest loss in this area. Most have been done by the
Various Estimates for Forest Loss In Brazil’s Amazon (as found In the WRI Report)
Year
Sources
Estimated
extent of
annual
deforestation
(mha)
1981-1985 FAO
Percentage
of total
Amazonian
Forest in
Brazil lost
each year
(%)
0.4
1.4
Estimated
extent of
area
deforested
in last
decade
(mha)
% of legal
Amazon
deforested
in last
decade
(%)
14
4
1987
Alberto Setzer, National
Space Research Institute (INPE),
Brazil (using remote sensing)
8.0
2.4
80
24
1988
Alberto Setzer, INPE, Brazil
(using remote sensing)
4.8
1.4
48
14
1989
Alberto Setzer, INPE, Brazil
(using remote sensing)
2-2.4
0.6-0.7
22
7
1988
Philip Fearnside, INPE,
Brazil (Linear projection
based on 1978 survey)
3.5
1.0
35
10
1988
Robert Pereira da Cunha, INPE,
Brazil (survey in 1988 based
on 10 years data using Landsat
Thematic Mapper)
1.7
0.5
17
5
1988
Recalculation using INPE data,
personal communication with
Prof. Jose Goldemberg,
President, University of Sao Paulo
2.3
0.6
23
7
4
of the forest loss estimates used by WRI to calculate
carbon dioxide levels are very shaky. For instance,
estimates for Myanmar (erstwhile Burma) are based
on one paper estimating forest loss over 1975-81
presented in a workshop in Finland. The estimate is
5.45 times more than the FAO assessment of 1980 for
Myanmar. In the case of Indonesia, a World Bank
review paper on Indonesia's forest, land and water
issues has been used to estimate the rate of defores
tation which is 50 times more than the FAO estimate.
Interestingly, the US deforestation rate, which is
zero according to WRI, is based on personal commu
nications between WRI and the US department of ag
riculture. Similarly, there are, according to WRI,
absolutely no land use changes leading to deforesta
tion in any of the industrialised countries like USSR
and Australia. The effects of acid rain, which has
destroyed vast tracts of European and North Ameri
can forests, remains unaccounted. And this is when
WRI's own past reports have estimated extensive
damage to these forests.8 According to one estimate,
more than a fifth of the forested area in Europe had
been damaged by acid rain by 1986. This, together
with North America, equalled to roughly 10 per cent
of all the non-tropical forest area. Obviously, this
would have an impact on climate change as some
Western scientists have calculated. One estimate is
that 10 per cent of temperate forests, damaged by acid
rain, would together release as much as 35 billion
tonnes of carbon equivalent into the atmosphere —
equal to the effect of using fossil fuels for seven years
at current rates.6 The fact remains that forest loss data
in the world is still extremely poor and it is difficult
to use it for any set of calculations of carbon emissions
to the same level of precision as fossil fuel use data.
The methane issue raises further questions of justice and
morality. Can we really equate the carbon dioxide contri
butions of gas guzzling automobiles in Europe and North
America or, for that matter, anywhere in the Third World
with the methane emissions of draught cattle and rice fields
of subsistence farmers in West Bengal or Thailand ? Do
these people not have a right to live ? But no effort has been
made in WRI's report to separate out the 'survival emis
sions' of the poor, from the 'luxury emissions' of the rich.
Just what kind of politics or morality is this which mas
querades in the name of 'one worldism' and ‘high minded
internationalism’?
decade. For instance, its table titled Forest Resources
1980s takes 8 mha a? the average annual deforestation
in Brazil. This table and its assessments are later used
to calculate carbon dioxide emissions. Only footnotes in
miniscule type admit that this rate of deforestation is only
for one year.
If Brazil had indeed lost 8 mha each year, a staggering
80 mha, or about one fourth of country's total Amazon
forests, would have disappeared during the 1980s. A ten
year assessment by Robert da Cunha of the National
Space Research Agency found that the annual rate of loss
was 1.7 mha totalling to roughly 17 mha over the past
10 years or about 5.12 per cent of Brazil’s Amazonian
forests. Even if, as stated by WRI, this estimate is on the
low side, clearly it cannot be off the mark by as much 60
mha - almost the size of India's total forest land. WRI
has itself revised this figure after consultations with Prof.
Jose Goldemberg, president of the University of Sao
Paulo and put the annual rate of deforestation during the
1980s at about 2.3 mha. Then why this hoax while
calculating carbon dioxide emissions ?
All this may be pardonable if it was merely an exercise
in back of the envelope calculations to provoke govern
ments into action. But when it gets used to abrogate re
sponsibility for global warming and push for legally binding
conventions, it is no longer a joke. WRI can possibly justify
its action by saying that it used the assessment of forest
loss for 1987 to calculate the greenhouse index for 1987.
But then, this does not explain how it has used high
average rates of deforestation in the case of other coun
tries like India. Moreover, why doesn’t every press
statement and every contention, underline this fact ?
Taking the estimate of Alberto Setzer for 1988, Brazil’s
contribution to the carbon dioxide emissions will go down
from 1,200 million tonnes of carbon equivalent to 800
million tonnes. As a result Brazil’s contribution to the net
emissions of carbon dioxide to the atmosphere will go
down from nearly 15 per cent to 10.5 per cent.
Taking the average annual estimate for forest loss in
Amazon over the decade 1978 to 1988, the figure of
carbon dioxide emissions is further reduced to 380 million
tonnes of carbon equivalent. The net emissions of carbon
dioxide from Brazil will then go down to only 5.6 per cent
of the world’s total carbon dioxide emissions. The share
of developing countries of carbon dioxide and all
greenhouse gas emissions will also go down dramatically.
The accuracy of deforestation estimates for other
developing countries is also very uncertain. In many cases
, it is based on an independent estimate often originating
tfrom a paper presented at a conference or a lone survey.
/And while there is a tendency to overstate deforestation
rrates in developing countries there is also a clear case
of understatement'when it comes to the developed countiries. There was, thus, no forest destruction or damage
im any developed countries like USSR, USA or Australia.
Surely this, if nothing else, makes a mockery of WRI's
cHalm that “global warming is a truly global phenomenon
im both cause and potential effect”. It is indeed a global
plhenomenon in effect - all of us will suffer -- but caused
byy the wilful overconsumption of a few, particularly the
society that WRI comes from.
CSE's calculations
CSE's analysis presented in this report does not
question the data that WRI has used to calculate each
country's production of carbon dioxide and methane,
even though as argued above they definitely can be
questioned. Yet CSE's analysis shows India and China
cannot be blamed for any of the methane or carbon
dioxide that is appearing in the atmosphere.
5
Methane : problems in estimating a lot of hot air
each animal eats. The biggest eaters are dairy cows which
receive three times their maintenance level feed. Conse
quently, Crutzen estimates that the average methane pro
duction in the cattle of industrialised countries is higher -about 55 kg per animal per year - as compared to the
developing country cattle, which is about 35 kg per cattle
head per year. This is partly because a large portion of Third
World cattle are kept for draught purposes rather than meat
or milk, and are not fattened like dairy cows. But it is not
clear how Crutzen has estimated this average.
On this basis, Crutzen calculates that total animal
methane production is about equally large from developed
and developing countries. On the contrary, WRI calculations
show that livestock of developing countries account for
roughly 60 per cent of the total animal methane generated
in the world. This discrepancy in the two figures originating
from the same basic source is hard to explain.
The discrepancy may be the result of the cattle population
estimated by Crutzen as against that taken by WRI which
is from FAO. FAO puts the total cattle population in 1988
at 1,300 million but the percentage of industrialised country
cattle is roughly half that of developing country cattle, which
Crutzen takes as almost equal. According to FAO, indus
trialised country cattle numbered 404 million while develop
ing country cattle were 860 million. In 1988, developing
countries supported a total of 2,700 million heads of
livestock while industrialised countries had 1,400 million. But
the ratio of total cattle to livestock cattle was the same 30 per cent - in both cases. So, according to WRI, with
roughly 67 per cent of the world's livestock and 68 per cent
the world's cattle, developing countries generated 60 per
cent of the world’s annual production of animal methane.
Given the low methane yields of most livestock like goats
and sheep and the lower average yields of developing
country cattle, this does not seem right. But it is difficult to
say anything concretely unless details of WRI's calculations
are available.
Methane is released to the atmosphere through a variety
of human activities. According to the estimates in the
World Resources Institute (WRI) report, almost 40 per
cent is estimated to come from leakages during hard coal
mining and natural gas exploration and transportation as
well as from urban landfills and sewage plants. The rest
comes from anaerobic fermentation in irrigated rice fields
and from the enteric fermentation, or stomach gas, of
livestock.
How reliable are the estimates of methane emissions
from livestock or paddy fields unlike the leakages from
natural gas pipelines? Animal methane production is
dependent on both the type of animal and the quality and
quantity of feed fed to it. Most developing country
governments do not know how much and what their
animals eat. In India, for instance, the available figures
are at best a guesstimate, based on a few random studies
of how underfed cattle forage for their survival. Then how
do we find out how much the cattle, goats, and sheep of
the Third World emit in terms of gases that can affect
climate change ?
The WRI and the International Project for Sustainable
Energy Paths (IPSEP) reports depend on a single a paper
by P.J. Crutzen and others published in a journal called
Tellus for their methane calculations. WRI has used
precisely this one source to prepare global estimates of
animal methane production based, of course, "on the
specifics of each country's animal husbandry practices
and the nature and quality of feed available”. No details
have been given as to what these specifics are.
According to the details of Crutzen’s study published
by IPSEP, cattle are by far the most important source for
animal methane. Almost 75 per cent.of all animal related
methane comes from the world's 1,300 million heads of
cattle. Cattle dominate in methane production not only
because they eat more, but also because their digestive
system is such that a larger fraction of their feed and
fodder is converted to methane than other animals.
According to Crutzen, each head of cattle in the world
emits 45 kg of methane, on an average, every year. But
the yield depends also on the quality and amount of feed
Beef Consumption
Once it is accepted that animal methane does contribute to
global warming, the obvious question lies in what ought to
be done about it? Does action lie in reducing livestock
herds? If so, then on what basis? According to IPSEP, one
Table 1
Natural Sinks of Greenhouse Gases
IPSEP estimates2
WRI Estimates'
Greenhouse
Gases
Total Amount
Produced
million
tonnes of
carbon
equivalent
million
tonnes
of the
gas
Carbon dioxide
Methane
CFCs
Total
Notes :
31,100
255
772
-
8,500
4,800
1,400
Net Emissions
to the Atmosphere
Amount Absorbed by the
world’s Environment
million
tonnes
of the
gas
million
tonnes
of the
gas
million
tonnes of
carbon
equivalent
13,600
3,700
43
800
1,400
772
14,700
5,900
1 WRI: World Resources Institute.
1 IPSEP: International Project on Soft Energy Paths.
3 Natural sink available = Total natural sink - Production from natural sources.
6
million
tonnes of
carbon
equivalent
Natural sink
available3
million
tonnes
• of the
gas
17,500
4,800
15,000
212
4,000
213
Nil
Nil
Nil
-
8,800
-
carbon dioxide emissions from these countries. Keeping
all these factors in mind, IPSEP has, in fact, suggested
that a climate tax be imposed on beef consumption in the
rich countries.
Developing countries, on the other hand, cannot afford
to reduce their cattle populations as in these countries
cattle play a much broader set of functions than just giving
meat or milk. Cattle dung fertilizes the fields and provides
energy to cook food. Cattle, in fact, play a vital role in
maintaining soil fertility in many developing countries. The
draught power provides the farmer with a basic input for
agriculture, thus, replacing the tractor. In India, for
instance, the installed capacity of the animal labour force
equalled the total installed capacity for electric power
generation in the country in the early 1980s. In addition,
the cattle provide milk, hides and meat.
way to mitigate these emissions is indeed to reduce cattle
herds and beef consumption. But, it adds, the action lies
more in the industrialised countries and not so much in
developing countries. Per capita meat consumption is
currently six times higher in the former (78 kg/year) as com
pared to the latters (14 kg/year). Moreover, while per capita
consumption in the developed countries has risen by 20 per
cent in the last 15 years, it has stagnated in the Third World.
The idea of beef reduction in the industrialised world,
according to IPSEP is also realistic as people in these
countries consume several times more meat than the
minimum of about 30 gm per day recommended for a
balanced non-vegetarian diet. A 50 percent decrease in the
per capita consumption of beef would still allow ample
supplies of dairy products while reducing the total animal
methane production by 40 per cent. Moreover, reduction in
beef consumption would not reduce overall meat consump
tion very substantially. In West Germany, for instance,
people consumed about 90 kg of meat per person in 1984
on average. Only 25 per cent of this meat came from cattle.
But the same cattle consumed 75 per cent of the total feed
and fodder and emitted 75 per cent of the animal methane.
The IPSEP report also estimates that if beef consump
tion was replaced by pork then methane emissions would
drop dramatically as pigs produce very little methane. In that
case, meat consumption would not be affected at all.
Eating less beef by the rich can, thus, lead to better health
and a better atmosphere. It would also lead to better land
management because beef production is particularly land
intensive. As land is short in several developed countries,
a great deal of the feed consumed in these countries,
particularly in Europe, is purchased from developing
countries where global market pressures are forcing land
away from subsistence farming and into cash cropping a process attendant with enormous social and ecological
costs. For instance, Western Europe imports more than 40
per cent (21 million tonnes) of its feed grains from the Third
World. In addition, almost two thirds of the total domestic
grain production of this region goes to feed these methane
emitting animals. In Central America, beef production for
export to the hamburger shops of the US has lead to
extensive destruction of tropical forests, leading, in turn, to
Estimating methane production from irrigated rice fields
is equally tricky. Estimates of methane from rice fields in
the world are based on some two or three studies, and
all done in the developed countries. IPSEP, for instance.
depends on research done in 1984 by W. Seiler and
others in Spain. WRI depends on another paper coau
thored by W. Seiler in 1986 which estimates methane
emissions from Italian rice paddy. These figures have then
been extrapolated by WRI for developing countries.
But how exact can such an estimation be ? One, as
yet unpublished study done in India shows that these
figures could be well off the mark as there are various
factors besides water which lead to methane generation
in rice fields. For instance, the Indian study finds that
methane is highly dependent on the nature of the soil.
Preliminary data collected by the Council for
Scientific and Industrial Research (CSIR) has indicated
that methane emissions from wet rice cultivation in India
is three to nine million tonnes of methane each year
as compared to the WRI figure of 18 million tonnes and
the Intergovernmental Panel on Climate Change (IPCC)
estimate of seven to 49 million tonnes.
Obviously, a lot more scientific work is needed before
global values can be calculated and actions suggested.
As a senior UNEP official has put it, nature serves
two major economic functions — one, as a source of
raw materials and, two, as a sink for absorbing
wastes.’
Ideally, the approach should have been to prepare
each nation's budget of greenhouse gas emissions by
taking into account each nation sources of emissions
and its terrestrial sinks, that is, its forests, other
vegetation and soils. This exercise would have given
an idea of the true emissions of each nation. These
emissions would have to be further matched with
each nation's just and fair share of the oceanic and
tropospheric sinks — a common heritage of human
kind. Only then the net emissions of a nation that are
accumulating in the atmosphere could be calculated.
But nothing of this sort has been attempted by WRI.
The earth's environment has a considerable ability
to absorb wastes. The ocean is an important sink for
absorbing carbon dioxide produced through human
activity. According to the estimates of the Intergov
ernmental Panel on Climate Change, the ocean
absorbed, during the 1980s, carbon dioxide to the tune
of 1200 to 2800 million tonnes of carbon equivalent
every year. There could also be terrestrial sinks for
carbon dioxide but scientific knowledge about them
is still uncertain. The various model prepared world
wide for estimating the accumulation of carbon
dioxide in the atmosphere reveal a substantial 'miss
ing sink' which scientists now believe could be a
terrestrial sink. The predicted amount of carbon diox
ide increase in the atmosphere should be ideally equal
to the amount of carbon dioxide emitted by human-
Paddy Methane
7
Figure 1
Total Emissions of Greenhouse Gases of Top 10 Emitting Nations
(in million tonnes of carbon equivalent)
as calculated by WRI
Accumulation in
the Atmosphere
Total Emissions
of greenhouse gases
Portion of total emissions accumulating
in the atmosphere
Portion of total emissions absorbed
by natural sinks
Percentage of
World’s Population
8
Figure 2
Permissible Emissions vs Total Emissions of Carbon Dioxide
of select countries on the basis of population
(in million tonnes of carbon equivalent)
as calculated by CSE
a) Industrialised Countries
9
made sources less the amount absorbed by the oceanic
sinks. But models find that instead the predicted
amount is more than what is actually accumulating in
the atmosphere, indicating the presence of yet another
cleansing mechanism in the world. There is a growing
belief that various land processes like vegetation and
soil could possible account for this surplus. Some
preliminary models even suggest that these terrestrial
sinks could be possibly even larger than the oceanic
sinks. But much of this is still unknown.
Sinks for methane are also substantial. Methane is
primarily removed by a reaction with hydroxyl radi
cals (OH) in the troposphere. This reaction represents
a sink of about 400 to 600 million tonnes per year. Soils
may also be contributing in removing methane to the
tune of 15 to 45 million tonnes each year.
WRl's legerdemain actually lies in the manner that the
earth's ability to clean up the two greenhouse gases of carbon
dioxide and methane — a global common of extreme
importance — has been unfairly allocated to different
countries. According to WRI figures, the world pro
duces every year 31,100 million tonnes of carbon
dioxide and 255 million tonnes of methane. But in
reality, the increase in the atmosphere every year is
only 13,600 million tonnes of carbon dioxide and 43
million tonnes of methane. In other words, the earth's
ecological systems — its vegetation and its oceans —
absorbed 17,500 million tonnes of carbon dioxide and
212 million tonnes of methane every year. Global
warming is caused by overexceeding this cleansing
capacity of the earth's ecological systems.
The WRI report makes no distinction between those
countries which have eaten up this ecological capital
by exceeding the world's absorptive capacity and
those countries which have emitted gases well within
the world's cleansing capacity. India, for instance, has
been ranked as the fifth largest contributor of green
house gases in the world. But compared to its population
— 16.2 per cent of the world's in 1990 — India's total pro
duction of carbon dioxide and methane amounted to only
six per cent and 14.4 per cent, respectively, of the amount
that is absorbed by the earth's ecological systems. How can,
therefore, India and other such countries be blamed
even for a single kg of the filth that is accumulating
in the atmosphere on a global scale and threatening
the world's people with a climatic cataclysm ? In fact,
India can double its total carbon dioxide emissions
without threatening the world's climate. And if it
controls its deforestation, then it can increase its
carbon dioxide emissions from fossil fuels several
times.
On the contrary, the United States, with only 4.73
per cent of the world's population, emits as much as
26 per cent of the carbon dioxide and 20 percent of
the methane that is absorbed, every year. It is the
production of carbon dioxide and
methane by
countries like USA and Japan — totally out of
proportion to their populations and that of the world's
absorptive capacity — which is entirely responsible for
the accumulation of unabsorbed carbon dioxide and
methane in the atmosphere. In addition, these coun
tries emit large quantities of CFCs — chemicals which
do not get absorbed at all. Japan accounts for 7.4 per
cent and USA for 25.8 per cent of the world's
consumption of CFCs.
Not even one tonne of CFCs released into the
atmosphere can get absorbed because there is no
natural sink for them. As concerned environmental
ists, we should propose that no country should be
“allowed" to produce such chemicals which the
atmosphere has no ability to cleanse naturally and all
production of such chemicals should be added to the
net emissions of the individual countries.
But the WRI report does not take countries like USA
or Japan to task. On the contrary, it adopts a mathematical
technique which puts the blame on several poor countries.
WRI has calculated the proportion of the world's greenhouse
gases produced by a country like India and has then used
this proportion to calculate India’s share in the quantity of
gases that are accumulating in the atmosphere'
In other words, since India produces 12 per cent of
the total methane produced in the whole world in a
year, India is also responsible for, according to WRI,
12 per cent of the methane that has actually accumu
lated in the earth's atmosphere. This technique is such
that if a country like Maldives were to produce one
tonne of carbon emissions, it would, in proportion to
the world production which may even be as high as
several billion tonnes, be held responsible for global
warming.
The obvious result of this exercise is that the
responsibility of countries like Japan and United
States, who in the first place produce an extremely
disproportionate amount of carbon dioxide or meth
ane compared to their population size, gets substan
tially reduced. By these calculations, WRI has permit
ted 2,519 million tonnes of carbon dioxide and 35 mil
lion tonnes of methane prod uced by USA to be cleaned
away by the earth's environment. But India, with a
population 3.4 times that of USA, is only given a share
of 604 million tonnes of carbon dioxide and 26 million
tonnes of methane to be cleaned away by the earth's
natural 'sinks'. Why should USA and other industri
alised countries get such a disproportionate share of
the global sink ?
This set of calculations is, therefore, extremely unfair in
an interdependent world in which all human beings ought
to be valued equally. CSE is appalled by the fact that this
patently anti-poor and anti-Third World report has been
prepared in collaboration by United Nations agencies like
the United Nations Environment Programme and United
Nations Development Programmes and it has been signed
by UNEP's executive director, Mostafa Tolba, and UNDP's
administrator, William H. Draper III. CSE calls upon
10
Figure 3
Permissible Emissions vs Total Emissions of Methane
of select countries on the basis of population
(in million tonnes of carbon equivalent)
as calculated by CSE
b) Developing Countries
11
12
Third World governments to take these agencies to task for
sponsoring such a loaded report against the Third World,
which is based on bad data, politically motivated mathemat
ics, unjust politics and makes a mockery of human values.
We are equally appalled that the Ministry of
Environment in India has not yet pointed out to the
flaws in the report. By keeping quiet it is only
acquiescing to and sabotaging the country's and the
Third World's position in this crucial area. In fact,
even worse, it does not seem to- be aware of the
political motivations of such global reports. How can
the country's interests be safeguarded by such an
agency ?
have argued, and we argue ourselves, that in a world
that aspires to such lofty ideals like global justice,
equity and sustainability, this vital global common
should be shared equally on a per capita basis.
Using this principle, CSE has adopted the following
methodology to ascertain the net emissions which are
posing a threat to the world's climate:
1)
The natural sinks for carbon dioxide and methane
have been allocated to each nation on a population
basis. These quantities then constitute the permis
sible emissions of each country. As no natural
sinks exist for CFCs, no permissible shares for
CFCs have been calculated.
Sharing a crucial global common
2)
The total emissions of each country of carbon
dioxide and methane (as calculated by WRI) have
then been compared with its permissible emis
sions (as calculated by CSE) to ascertain the
quantity of emissions that are in excess of the
permissible emissions.
3)
The unused permissible emissions of countries
like India and China have been traded with the
excess emitters on a population basis.
4)
The permissible emissions, traded from low
How can we calculate each country's share of
responsibility for the accumulation of gases like car
bon dioxide and methane in the earth's atmosphere ?
It is obvious that the concept of sustainable develop
ment demands that human beings collectively do not
produce more carbon dioxide and methane than the earth's
environment can absorb. The question is haw should this
global common — the global carbon dioxide and methane
sinks — be shared amongst the people of the world ?
Several studies on the global warming problem
Table 2
Comparison of CSE and WRI figures of Annual Net Emissions of all
Greenhouse bases to the atmosphere (top 15 emitters)
W R I
CSE
SI.
No.
Country
1
United States
1000
United States
1532
2
U.S.S.R
690
Brazil
1017
3
Brazil
610
U.S.S.R.
730
4
China
380
Canada
252
5
India
230
Germany, Fed Rep
155
6
Japan
220
Japan
140
Net Emissions
of Greenhouse
gases
(million tonnes
of carbon
equivalent)
Country
Net Emissions
of Greenhouse
gases
(million tonnes
of carbon
equivalent)
7
Germany, F.R.
160
United Kingdom
132
8
United Kingdom
150
Australia
112
9
Indonesia
140
Saudi Arabia
97
10
France
120
Colombia
86
11
Italy
120
Cote d’Ivoire
82
12
Canada
120
German Dem Rep
82
13
Maxico
78
Myanmar
81
14
Myanmar
77
Lao People's Dem Rep
78
15
Poland
76
Poland
77
13
emitting countries have been subtracted from the
excess emissions of each country to obtain the
quantity of each country's net emissions to the
atmosphere of carbon dioxide and methane.
quotas. They actually provided space for about 1459
million tonnes of carbon equivalent to be released in
the form of carbon dioxide out of their permissible
quotas and be absorbed by the world's natural sinks.
Of this space India, China and Pakistan alone provide
unused permissible quotas for carbon dioxide amount
ing to 1015 million tonnes of carbon equivalent.
CSE has traded the natural 'sink space' left
available by countries like India and China with excess
users like USA and Japan in proportion to their
populations and, in this way, obtained the final list of
countries whose excess emissions are accumulating in
the earth's atmosphere — the true culprits of the threat
of global warming to humanity. The results of this
exercise are dramatic and it shows up the real dirty
nations of the world. USA's net contribution of
greenhouse gases which are accumulating in the
atmosphere goes up from 1000 million tonnes of
carbon equivalent to 1532 million tonnes of carbon
equivalent. Correspondingly, USSR's contribution goes
up from 690 to 730 million tonnes of carbon equiva
lent; and, of Canada from 120 to 252 million tonnes.
While contributions of Japan, West Germany and
United Kingdom go down, France and Italy no longer
The total greenhouse gas emissions have been
obtained by adding the net emissions of methane
and carbon dioxide (as obtained by CSE) with the
total emissions of CFCs (as given by WRI).
5)
CSE's calculations clearly show, that there is one set
of nations in the world which is emitting greenhouse
gases well within its share (or, in other words, its
permissible limits) whereas there is another set of
countries which is exceeding its permissible limits by
leaps and bounds.
Only two developed countries — Albania and
Portugal — are within their permissible limits for
carbon dioxide and 13 developed countries are within
their methane limits. Industrialised countries together
exceeded their permissible quotas of carbon dioxide
by 2839 million tonnes of carbon equivalent, that is,
58 per cent of the excess carbon dioxide emissions. The
world would have been truly worse off had the
developing countries used up their entire permissible
Table 3
Percentage Distribution ot Annual Net Emissions of Industrialised and Developing countries of all Greenhouse gases
(as calculated by CSE)
Percentage
of global
Net Emissions
(as per WRI)
Percentage
of global
Net Emissions
(as per CSE)
Region
Percentage
of global
Net Emissions
after modifying
Brazil's
estimates of
deforestation
(as per CSE)'
(%)
Percentage of
Permissible
Emissions
(as per CSE)
(%)
(%)
(%)
66.95
52.60
78.54
23.60
27.44
16.95
32.16
4.73
Japan
2.51
3.90
2.94
2.34
Western Europe
11.89
14.32
14.00
6.82
Eastern Europe
4.54
4.32
5.32
2.61
USSR
13.08
11.70
15.33
5.46
Australia
2.00
1.07
2.35
0.32
33.05
47.40
21.46
76.40
0.013
3.90
0.015
16.18
Industrialised Countries
USA
Developing Countries
India
China
0.57
6.44
0.67
21.53
Brazil
18.21
10.34
4.13
2.85
Asia (excluding Japan)
7.97
21.69
9.03
56.45
Africa (excluding South Africa)
3.04
4.69
3.61
11.56
Americas (excluding USA 8 Canada)
22.03
16.61
8.59
8.39
Note
:
1 Assuming the decadal annual average of deforestation (1978-88).
14
Figure 5
Percentage Distribution of Net Emissions of Greenhouse Gases
by Industrialised and Developing Countries
As calculated by WRI
As calculated by CSE
a) Before trading permissible emissions between countries
Industrialised Countries 91%
Developing Countries 9%
USSR & E. Europe
26.5%
b) After trading permissible emissions between countries.
India & China
0.6%
15
Figure 6
Net Emissions of Greenhouse Gases to the atmosphere of top 15 emitters
(in million tonnes of carbon equivalent)
a) Industrialised countries as calculated by WRI
USA
b) Industrialised countries as calculated by CSE
USA
16
Figure 6 (Contd)
c) Developing countries as calculated by WRI
Brazil
d) Developing countries as calculated by CSE
Brazil
17
Table 4
Comparison of CSE and WRI figures of Per capita Annual Net Emissions of all Greenhouse Gases to the atmosphere
W R 1
CSE
Per capita
Annual Net
Emissions of
Greenhouse
gases
(tonnes of
carbon
equivalent)
Per capita
Annual Net
Emissions of
Greenhouse
gases
(tonnes of
carbon
equivalent)
SI.
No.
Country
1
Lao People's D.R.
10.00
Qatar
27.01
Country
2
Qatar
8.80
Lao People's Dem Rep
19.06
3
United Arab Emirates
5.80
Canada
9.51
4
Bahrain
490
Oman
8.79
5
Canada
4.50
United Arab Emirates
8.53
6
Luxembourg
4.30
Bahrain
8.42
7
Brazil
4.30
New Zealand
7.13
8
Cote d'Ivoire
4.20
Kuwait
7.11
9
United States
4.20
Saudi Arabia
6.88
10
Kuwait
4.10
Brazil
6.76
11
Australia
3.90
Australia
6.70
12
German D.R.
3.70
Cote d'Ivoire
6.52
13
Oman
3.50
United States
6.15
14
Saudi Arabia
3.30
Luxembourg
5.62
15
New Zealand
3.20
German Dem Rep
4.94
million tonnes of carbon, respectively. India and China
do not account for even 0.5 per cent of net emissions
to the atmosphere where WRI claims they contribute
together about 10 per cent. CFCs constitute the only
gases as their net emissions. India, the CSE analysis
shows, is the world's lowest net.emitter of greenhouse
gases in per capita terms. Similarly, Mexico's and In
donesia's contributions fall from 78 and 140 to 9.1 and
9.5 million tonnes of carbon equivalent, respectively.
In terms of net emissions of greenhouse gases to the atmos
phere, one American is equal to 8150 Indians.
A mere 15 countries — nine industrialised and six
developing countries -- account for over 83 per cent
of the net emissions of all greenhouse gases which are
accumulating in the atmosphere. Action is, therefore,
urgently and, should we say, desperately needed in
these countries most of all.
As a group, however, the contribution of deve
loping countries does not fall dramatically mainly be
cause of Brazil which now accounts for over half of
all the greenhouse gas emissions from the Third
World. Nonetheless, the share of industrialised coun
tries goes up from 53 per cent, as calculated by WRI,
to 67 per cent -- that is, from about one-half to onethird.
appear in the list of top 15 greenhouse gas emitting
nations. In CSE's analysis, these countries appear to
be relatively efficient economies which are keeping
their emissions closer to their global population share.
Australia and East Germany take the place of France
and Italy in the top 15 greenhouse gas emitting na
tions. These dirt emitting nations are clearly profligate
in their emissions well beyond their global population
share. Australia, with only about 0.3 per cent of the
world's population, is contributing to 1 per cent of net
emissions of carbon dioxide and 7 per cent of net emis
sions of methane. Australia is a country, which in just
200 years of its existence, has destroyed half of its
forests and woodlands.10 Just two-countries, USA and
USSR, which have about 10 per cent of the world's
population are responsible for about 40 per cent of the
world's net emissions of carbon dioxide. Again, just
two countries, United States and Canada, together ac
count for two-thirds of the net emissions of methane.
As far as developing countries in WRI's list of top
15 emitters are concerned, India, China, Mexico and
Indonesia go out of the list completely. The contribu
tion of Brazil and Myanmar goes up. China's and
India's total net emissions to the atmosphere fall from
380 and 230 million tonnes of carbon to 35 and 0.7
18
Figure 7
Comparative Net Emissions of Greenhouse Gases
to the atmosphere of select developing countries
(in million tonnes of carbon equivalent)
As calculated by WRI and CSE
Brazil(1)
as calculated by WRI
Note :
1)
2)
3)
as calculated by CSE
Brazil’s net emissions using deforestation data for 1987 which shows rampant deforestation
(total carbon emissions = 1200 million tonnes)
Brazil’s net emissions using deforestation data for 1988 which shows reduced deforestation
(total carbon emissions = 800 million tonnes)
Brazil’s net emissions using annual average deforestation data for the period 1978 to 1988
(total carbon emissions = 380 million tonnes)
But when Brazil's deforestation rate is changed and
taken to be the annual average for the decade from
1978 to 1988, the contribution of greenhouse gas
emissions by the Third World drops to only about onefifth of the total and the industrialised countries, with
about a quarter of the world's population, account for
80 per cent of the world's greenhouse gas emissions
even after receiving carbon dioxide to the tune of 922
million tonnes of carbon equivalent and methane to
the tune of 549 million tonnes of carbon equivalent as
tradeable permissible quotas.
to its degradation — the well-known 'tragedy of the
commons'. In order that all those countries which are
overusing or misusing the world's environment pay
a price, CSE proposes a two-tier system — one set will
consist of charges and another of fines — to bring
rationality into the global use of the atmosphere.
In all market economies of the world, pollution
control economists are now talking about the concept
of tradeable emission quotas, which allow low-level
polluters to trade their unused permissible emissions
with high-level polluters. Overall, this system leads to
better economics as it provides an economic incentive
to the low-level polluters to keep their pollution levels
low and an economic disincentive to the high-level
polluters to reduce their emissions. Expecting every
one to adhere to a standard pollution limit does not
Tradeable Emissions
The latest literature on management of common
property resources shows clearly that an exploitation
system based on gifts and a free for all inevitably leads
19
provide any incentive to low-level polluters to keep
their pollution levels low. In other words, what the
world needs is a system which encourages a country
like India to keep its emissions as low as possible and
pushes a country like USA to reduce its emissions fast.
CSE believes that a system of global tradeable
permits should be introduced to control global
greenhouse gas emissions. All countries should be
given tradeable quotas in proportion to their popula
tion share and the total quotas should equal the
world's natural sinks. The quantity of unused permis
sible emissions can be sold by low-level greenhouse
gas emitting countries to high-level greenhouse gas
producers at a certain fixed rate.
But any excess discharges which lead to an
accumulation in the atmosphere and, thus, constitute
a global threat for climate destabilisation, should be
fined at a higher rate and given over to a 'global
climate protection fund'. The fund can be used to
assist those countries which are affected by climate
destabilisation and to develop technologies that will
reduce greenhouse gas emissions. These technologies
can then be used by all humankind. Such a system
should provide an incentive to countries like India to
keep their share of greenhouse gas emissions low and
force countries like USA to reduce their emissions
rapidly — and, thus, all will join the race to save the
planet.
What charges should low emitters levy on high
emitters for a share in their tradeable emissions ? The
IPSEP study, which was carried out for the Dutch
government, suggests that such the charge could be
pegged at $ 15 per 1000 tonnes of carbon emitted into
the air (which is equivalent to 3.7 tonnes of carbon
dioxide and 0.5 tonne of methane). This amount in
1986, taking into account the global fuel mix in that
year, would have been roughly equal to a ten per cent
increase in that year's crude oil prices.5
Using the same figure, CSE finds that India would
be able to charge excess emitters a sum of US $ 8.3
billion per year for its share in permissible emissions
(or about 50 per cent of the country's annual
investment in the power sector during the Seventh
Plan) whereas USA would have to pay US $ 6.3 billion
to purchase unused permissible emission quotas.
Twenty developing countries together would receive
Table 5
Trade amounts and damages payable by top 15 industrialised and oil-rich net emitters
(as calculated by CSE)
Country
Trade amounts payable
to other Countries
(at $ 15 per '000 tonnes
of carbon equivalent
for purchasing
tradeable quotas
of Permissible
Emissions
(million $)
Total Trade
amounts and
damages
payable
(million $)
(million $)
United States
6,305
38,293
44,598
U.S.S.R
5,421
18,252
23,673
Canada
670
6,302
6,973
Japan
1,427
3,499
4,926
Germany, Fed Rep
730
3,868
4,598
1,243
3,307
4,550
Australia
423
2,798
3,220
France
1,183
1,725
2,908
357
2,426
2,783
Poland
670
1,929
2,599
Italy
662
1,915
2,577
German Dem Rep
192
2,050
2,242
Netherlands
374
1,439
1,814
United Kingdom
Saudi Arabia
Spain
166
1,200
f,366
South Africa
706
616
1,322
. 20,529
89,619
1,10,149
Total
20
L
Damages payable to
a Global Fund (at
$ 25 per '000 tonnes
of carbon equivalent
for Net Emissions
to the atmosphere
Table 6
Amounts receivable by top 20 countries which trade quotas of Permissible Emissions of Carbon Dioxide and Methane
(as calculated by CSE)
SI.
No.
Country
Trade amounts
receivable for
trading quotas
of Permissible
Emissions of
Methane (at $ 15
per '000 tonnes of
carbon equivalent)
Trade amounts
receivable for
trading quotas
of Permissible
Emissions of
Carbon Dioxide
(at $ 15 per
*000 tonnes of
carbon equivalent)
(m $)
Total Trade
Amounts
recevable
(m $)
(m $)
1.
China
6561
4747
11308
2.
India
7228
1057
8285
1445
638
2083
3.
Pakistan
4.
Nigeria
439
1010
1449
5.
Bangladesh
1499
-434
1065
6.
Egypt
431
338
769
7.
Ethiopia
510
171
681
8.
Turkey
202
314
516
9.
Morocco
259
208
467
10.
Kenya
298
122
420
11.
Tanzania
292
106
398
12.
Uganda
215
140
356
13.
Zaire
•48
339
291
14.
Afghanistan
210
73
283
15.
Iran, Islamic Rep.
177
84
261
16.
Sri Lanka
193
59
252
17.
Mozambique
105
145
250
18.
Ghana
80
143
223
19.
Iraq
60
161
221
20.
Yemen Arab Rep
96
71
167
20252
9492
29744
Total
the same conclusion that the onus to curtail the global
warming problem lies largely on industrialised coun
tries. The report argues that the average rate of global
warming should be limited, as closely as possible, to
0.1°C per decade and, as an outer limit, to an increase
of 2°C by 2100 over the present. In that case, the
earth's temperature would remain within the range
that human beings have seen in the period since their
evolution two million years ago. This would also re
strict the sea level rise to a moderate, and may be
manageable, level of about 1 m whereas a rise of 57 m would be absolutely disastrous. This means that
the maximum allowable concentration of all green
house gases (carbon dioxide, methane, nitrous oxide,
CFCs etc.) should not exceed 430-450 parts per million
about US $ 30 billion — China $ 11.31 billion, India $
8.3 billiop, Pakistan $ 2.08 billion, Nigeria $ 1.45 billion
and Bangladesh $ 1.06 billion every year.
But if the non permissible emissions that finally
accumulate in the atmosphere are fined at a higher rate
of US $ 25 per tonne of carbon equivalent emissions,
then a Global Climate Protection Fund of about US $
90 billion annually could be created from the contri
butions of developed countries and oil-rich countries
like Saudi Arabia. USA alone would have to pay a sum
of US $ 38.3 billion to the global fund.
IPSEP Study
It is interesting to note that the Dutch governmentsponsored IPSEP study, like the CSE study, reaches
21
(ppm) of carbon dioxide equivalent during the next
century (compared to about 400 ppm now) provided
these levels decline thereafter.
In other words,
concentration of carbon dioxide itself should not
exceed 380 ppm (compared to 338 in 1980 and 349 in
1985) while other greenhouse gases together add up
to another 50 ppm of carbon dioxide equivalent.
IPSEP's calculations show that this means that only a
total of 300 billion tonnes of carbon (btC) can be
released between 1985 and 2100 or roughly 2.6 btC
each year.
Carbon dioxide is accumulating in the atmosphere
both because of the burning of fossil fuels and forests.
The IPSEP study argues that increased afforestation
efforts and future controls on deforestation can ensure
that net additions of carbon dioxide to the atmosphere
because of deforestation become nil. Therefore, only
energy production as the major source of caibon
dioxide releases should be taken into account. The
question, therefore, is how' should this 300 btC global
carbon emissions budget (over period 1986-2100) be
shared ?
Like CSE, IPSEP also argues that global justice
demands that this budget be shared on the basis of
population (person-years). If the existing and pro
jected populations of industrialised and developed
countries between 1986 and 2100 are taken into
account, then developed countries will exhaust their
entire carbon release quota of 48 btC till 2100 by 1999
(that is, in the next seven years), if they continue to
release carbon dioxide at their 1986 levels. Developing
countries, on the other hand, will be able to emit
carbon dioxide at their 1986 rate until 2169 AD.
The IPSEP study further points out that it is im
portant to take into account the fact that developed
and developing countries have been pushing out car
bon dioxide into the atmosphere at vastly different
rates for a long time. If this historical inequity is taken
into account, and the permissible global carbon emis
sions budget of 428 bt from 1950 till 2100, instead of
the 300 btC global carbon emissions budget between
1986 and 2100, is distributed between industrialised
and developing countries, then developing countries
can continue to emit carbon dioxide at their 1986 rate
till 2241 AD. But industrialised countries had already
exhausted their entire quota by 1986. In other words,
they ought to stop all carbon dioxide emissions right
away.
The recent report of the South Commission also
states categorically that though the "protection of the
environment is a matter of global concern calling for
global measures . . . the manner in which the North
is attempting to define the issues introduces an
element of potential North-South conflict. . . . the
North is in effect demanding that the South should
give priority to environmental protection over devel
opment objectives. It is also attempting to put in place
mechanisms for Northern monitoring and control
over development policies in the South that could
have environmental implications. This is unacceptable
on several counts. Singling out developing countries as
a main source of the threat to the global environment
obscures the fact that the ecological stress on the global
commons has in large part been caused by the North. The
North, with only 20 per cent of the earth's population,
accounts for 85 per cent of the global consumption of
22
conditionalities to developing countries. They must first
set their own house in order.
non-renewable energy. The North has already used
much of the planet's ecological capital. It will have to
take important measures to adjust its pattern of pro
duction and consumption in order to mitigate the clear
threat to the earth's environment. It will also have to
reduce its consumption of certain key natural re
sources, such as non-renewable fossil fuels, to accom
modate the industrialisation and economic develop
ment of the South”''
The IPSEP report concludes that the call of the 1988
Toronto World Conference on the Changing Atmos
phere to reduce world emissions of carbon dioxide
from energy production by 20 per cent by 2005 AD
"should be understood as a target for industrialised
countries". By 2015, they should reduce their carbon
release levels by 50 per cent and by 2030, 75 per cent.
While endorsing the IPSEP conclusion, CSE would like
to point out that it does not, however, mean that developing
countries should not undertake steps to make a better world.
Deforestation should definitely be controlled and afforesta
tion rates should match the rates of wood use and burning.
As an environmental pressure group, CSE firmly believes
that there are a variety of reasons — like poverty, injustice
and inequality — that demand that governments of devel
oping countries promote environmentally-harmonious
development strategies, and in which all people have equal
access to the precious resources of the environment for their
survival. But it also believes that it is immoral for devel
oped countries to preach environmental constraints and
Impact of Western media
The manner in which the WRI report has been flashed
across the world raises serious questions about the
role of the Western mass media. It is strange that the
IPSEP report received no publicity as compared to the
WRI report even though the IPSEP study was
undertaken by well-known energy analysts. IPSEP's
main authors were Floretin Krause, an energy analyst
at the Lawrence Berkeley Laboratory in the US, and
Wilfrid Bach, a climatologist who is a member of the
West German parliament's special commission on
preventing global warming.6
The media blitz of the WRI report has been so
powerful that even several Indian commentators and
environmentalists have accepted the report unques
tioningly and have called upon the Indian people to
accept their share of the blame.12 India's Doordarshan
even showed, on its prime time news programme, the
press conference in Washington DC at which the WRI
data was released. It did not care to ask Indian
scientists about the veracity of the data, as one of them
complained at a recent CSE meeting.
Lack of Third World research
The entire episode also emphasises the fact that
Third World nations must undertake their own re-
The Third World: sink for the West’s dirt
be emitted by the two new coal fired electricity plants to
be built between Amsterdam and Rotterdam.2
Charity is also good business for the Dutch as it costs
12 times more to plant trees at home as compared to poor
developing countries.2 Otherwise why not plant trees in
the developed world. In fact, according to one estimate
if 75 per cent of the non forested land in the US was under
forests it would be enough to fix all the excess emissions
of carbon dioxide in the air every year?
The fate of the Third World in this garbage business
is now clear. As far as the West is concerned it can live
to fix its carbon or plant cheap trees or dispose its toxic
wastes as has been the case in the past. A World Bank
staff paper has even given this garbage business a high
sounding new name; "intergenerational compensation
project”.4 Whose generations are they talking about ?
Solutions for global warming are becoming more and
more ludicrous. The latest is to plant trees in the countries
of the Third World to fix the dirty carbon thrown out into
the air by Western nations to that the West can continue
to expand its fleet of cars, power stations and industries
while the Third World grows trees.
The first such schemes started in the US. A power
generating company, Applied Energy Services of Arling
ton, Virginia which is building a power plant in Connecti
cut has entered into an agreement with a US voluntary
agency to plant trees, not in the US but in Guatemala.
The company has meticulously calculated that the new
180 megawatt power plant will emit 387,000 tonnes of
carbon each year during its 40 year life. And that planting
52 million trees will absorb this dirt. It has undertaken a
project with the international relief and development
agency, CARE to plant trees in Guatemala and "help”
the poor farmers. It will pay US $ two million for this
exercise. A UNEP magazine even describes this dubious
exercise as " an interesting scheme to attempt to reverse
or balance the greenhouse effect of its powerhouse emis
sions".’
This concept has now been accepted by the govern
ment of Netherlands. It has budgeted as much as US $
0.5 billion to plant 250,000 hectares of trees in Bolivia,
Peru and Colombia. These "Carbon sink forests" will
offset the six million tonnes of carbon dioxide which will
References :
1.
2.
3.
4.
23
Anon 1989, Plant Trees, Conserve Energy to Counter Greenhouse
Effect, in Our Planet, March 1989, United Nations Environment
Programme, Nairobi.
Robert Goodland et al 1990, Tropical Moist Forest Management: The
Urgent Transition to Sustainability, paper presented at a Seminar on
Economics of the Sustainable Use of Forest Resources, April 1990,
Centre for Science and Environment, New Delhi.m/meo.
Robert A. Sedjo 1989, Forest: A Tool to Moderate Global Warming?,
in Environment, Volume 31. No. 1, January-February. Heldref Publica
tions, Washington.
John Pezzey 1989, Economic Analysis of Sustainable Growth and
Sustainable Development, Environment Department Working Paper No.
15, March 1989, The World Bank, Washington.
search in this crucial area. They cannot depend on
Western institutions to present a true picture of the
global situation and safeguard their interests. The
manner in which the methane and carbon dioxide
emissions of several developing countries have been
calculated is itself open to questions. The data base
on contributions from deforestation, irrigated rice far
ming and livestock management is still poor. It is vital
that a reliable system of measuring deforestation an
nually on a global and national basis is developed
urgently.
house gas emissions (resulting from for example,
natural gas transport and exploration or deforesta
tion) essentially arise out of not Third World con
sumption but Western consumption. For example,
Algeria's methane emissions are directly related to its
export of natural gas to Europe.
Now that five per cent to 15 per cent of the vote
in Western countries goes to green issues, Western
politicians are falling over themselves, including those
with extremely conservative and erstwhile anti-envi
ronment credentials, to portray themselves green and
capture the green vote. For many of them international
environmental issues are easier to divert attention
away from domestic environmental issues. Margaret
Thatcher did not have a particularly great record on
the domestic environment front but she waxed elo
quent about saving the ozone layer. Third World
politicians and environmentalist must beware of such
Western politicians ready to shed crocodile tears.
They must insist with Western leaders that global
environmental concerns cannot be chosen on an adhoc
basis by the rich and powerful actors in the world. We
too believe that the world is one and we welcome this
belated realisation within the all-powerful, all-con
suming West. But if issues like climate change have
to put on the global agenda, then it is equally
important to put environmental problems like deser
tification, land and water degradation, and deteriorat
ing terms of trade of biomass products that are
discounting the future of both present and future
generations in the Third World, on the global agenda.
The global environmental agenda, as it is being framed
by the West, must be questioned. The agenda itself has
become politics. Global citizenship demands global
caring and sharing not global hysteria and fiats.
Given the East-West detente, and the growing
power of the global market system, it is unlikely that
Political sagacity and farsightedness
But most of all, the Third World today needs
farsighted political leadership. For the first time, the
Western world and its environmental movements are
arguing that we have to manage the world as one
entity. But the same Western politicians — from
Margaret Thatcher to George Bush — who talk so
glibly about an interdependent world show no interest
in the travails of the Third World. Through quotas,
embargoes and subsidies to their own farmers, and
through emerging biotechnology, they consistently
depress Third World commodity prices. The West has
never been prepared to pay the true ecological costs
of the goodies it consumes — from bananas, tea, coffee
and cocoa to prawns.
All over the world, there is growing consciousness
about 'Green Economics' and the need to incorporate
ecological costs of production into national income
and wealth accounts. But what is the point of doing
this in a developing country if the rich and powerful
consumers of the world are not prepared to pay the
true cost of their consumption ? That is not an economic
issue but an intensely political issue.
In fact, a close look at WRI's figures on a lot of what
this American institution calls Third World green
C?c Free Deodorant
Fiee Petrel
24
Interest free 3 vkdd loans
the expected changes in the global climate will become
somewhat manageable. But if, as today, our land and
water resource base remains highly stressed and
degraded and even normal conditions constitute a
near crisis situation, climatic perturbations will throw
the society into a state of total emergency.
But to carry out this strategy to improve land
productivity and meet people's survival needs devel
opment strategies will have to be ecosystem-specific
and holistic. It would be necessary to plan for each
component of the village ecosystem and not just trees
— from grasslands, forest lands and crop lands to
water. To do this, the country will need much more
than just glib words about people's participation or
wastelands development. It will demand bold and
imaginative steps to strengthen and deepen local
democracy by creating and empowering democratic
and open village institutions. Only then will the people
get involved in managing their environment. It will
mean dismantling the inefficient and oppressive
government apparatus and changing laws so that
people can act without waiting for a good bureaucrat
to come along. As laws exist, planting trees on
government wastelands can land villagers in jail. The
government is the biggest and the worst land and
water owner in the country.
Those who talk about global warming should con
centrate on what ought to be done at home. The chal
lenge for India is thus to get on with the job at hand
and leave the business of dirty tricks and dirtying up
the world to others. In this process, we will help our
selves and may be even, the rest of the world.
the Third World can ever disassociate itself from it.
The Third World, therefore, has to fight and insist
upon better terms of trade, acceptance of its own
ecological concerns, and a fair share in the global en
vironmental commons. Third World politicians can
not afford to negotiate badly and cheaply or in
ignorance and, thus, forsake the interests of their
future generations for some Meryl Streep-kind of
mushy environmentalism that is today being beamed
into India's homes in the name of environmental
education.
Environmental issues are discussed regularly now
at all summits of Western leaders, the so-called Group
of Seven. It is high time that Third World leaders
showed the courage, imagination and understanding
to come together — possibly in the form of a Third
World forum on international environmental issues —
to understand and present their developmental issues
in the new environmental language and context. They
cannot simply sit back and oppose the West's agenda.
Their inaction will not be able to withstand the
Western media blitz. They have to propose an agenda
of their own — an agenda that responds to the eco
nomic, political, cultural and resource realities of the
Third World. If presented in environmental terms,
there is a definite possibility that the youthful green
lobbies in the West which today criticise the Third
World, could become its allies. The Third World
leadership must now present its own concept of a
sustainable future to win the support and the hearts
and minds of the green youth across the world -- in
the Third World itself and in the West.
All this will demand enormous steadfastness and
personal costs from Third World leaders and environ
mentalists and an effort to understand the environ
mental roots of their own countries. The Western
media will fete any Third World politician who is
prepared to speak on environmental issues as the
Westerners do and accept their brand of high-sound
ing but, as yet, hypocritical 'one worldism'. There will
be no dearth of TV appearances and programmes,
newspaper interviews, invitations to international
conferences, Western style money, and personal name
and fame across the globe. But it is equally easy to sell
out the interests of the future generations of the Third
World in the glib name of global environmentalism
and global charity. For the poor it will remain a harsh
and vicious world which is not prepared to give them
a fair place.
References
1.
World Resources Institute 1990, World Resources 1990-91 : A Guide to
the Global Environment, Oxford University Press, New York.
2.
Christopher Flavin 19fi9, Slowing Global Warming: A Worldwide Strategy,
Worldwatch paper 91, Worldwatch Institute, Washington, D.C.
3.
James Gustave Speth 1990, Coming to Terms : Toward a North South
compact for the Environment, In Environment, Vol. 32, No. 5, June 1990,
Heldref Publications, Washington D.C.
4.
Michael Stott 1989, Third World Fossil Fuel Pollution Prompts Worries, In
Los Angeles Times, November 19, Los Angeles.
5.
Floretin Krause, Wilfrid Bach and Jon Koomey 1989, Energy Policy in the
Greenhouse. Vol. 1. International Project for Sustainable Energy Paths,
El Cerrito.
6.
Roger Milne 1989, Industrialised countries ‘must make deepest carbon
cuts’, In New Scientist, December 2, London.
7.
Forest'Survey of India 1989, The State of Forest Report 19S9, Dehra Dun
8.
James J. Mackenzie and Mohamed T. El-Ashry 1988, III Winds: Airborne
Pollution's Toll on Trees and Crops, World Resources Institute, Washing
ton, D.C.
9.
Yusuf J. Ahmad 1990, Energy Issues In Environmental Economics, paper
presented at a Seminar on Economics of the Sustainable Use of Forest
Resources, April 1990, Centre for Science and Environment, New Delhi,
mimeo.
10.
Anon 1989, One Billion Trees : Our Country, Our Future, Department of
the Aris, Sports, the Environment, Tourism and Territories. Canberra.
11.
Anon 1990, The Challenge to the South : The Report of the South
Commission, Oxford University Press, New York.
12.
Darryl D'Monte 1990, Environment on UN Agenda : Fissures show up,
In Times of India, September 30, New Delhi.
Action in India
None of this means that India should not regenerate
its environment or that it should not be efficient in its
use of energy. This will also be our best defence
against any possible impact of global warming. As
only if the diverse ecosystems of India are functioning
at the optimum levels of productivity, the effects of
25
Appendix 1
Total Emissions of Greenhouse Gases as calculated by WRI
Country/
Continent
Population
Anthropogenic Additions to the Carbon
Dioride Flux (c 1987)
("000 tonnes ol Carbon)
Cement
Solid
Liquid
Gaa
Raring
Anfiropogerwc Additions to the
Methane Flux (c 1987)
Total
Carbon Oiov'de
( 000 tonnes
of carbon
equivalent)
Land Use
Change
fOCO tonnes ol metiiane)
Solid
Waste
Livestock
Hard
Cos’s
Wet
Rice
Total
Meth on*i
(-000
tonnes)
Pipeline
Leakage
Total 1986 CFG Use
Mett
( 000 tonnes
ol cor bon
equivalent) Equiivalont
Carbon donde
heating effect
( 000 tonnes
of Carbon)
i66000 00 53000 00 255610.00 4785711 00 1358128 00
WORLD
5273 93 140000 00 2300000.00 2300000 00900000 00 50000 00 2800000 008238659 00 44000 00 76000 00 16000 00
AFRICA
644 SO
6600 00
74000 00
64000 00
16000 00
11000 00 390000 00 558068 00
1800 00
9000 00
91000
1700 00
4500 00
17998 00 336971 29
42000 00
Algeria
Angola
Banin
Botswana
Burkina Faso
Burundi
Cameroon
Cape Varda
Central African Rap
Chad
Comoros
Congo
Cote dTvcure
Djibouti
Egypt
Equatorial Guinea
Ethiopia
Gabon
Gambia. The
Ghana
Guinea
Gunea-Biscau
Kenya
Lesotho
Liberia
Libya
Madagascar
MWaws
Mak
Mountama
Mauritius
Morocco
Mozambque
Mger
Nigeria
880 00
48 00
41 00
000
0 00
000
0 00
000
000
0 00
000
8 00
89 00
000
1400 00
000
34 00
19.00
0 00
37 00
0 00
000
180 00
X
12 00
370 00
500
10 00
3 00
000
000
520 00
61 00
500
480 00
0 00
51.00
000
0 00
1700 00
27.00
0 00
41 00
50 00
460 00
300
54 00
51 00
0.00
820 00
000
000
420 00
000
4 00
1 00
000
000
000
000
0 00
000
0 00
800 00
0 00
0 00
000
000
200
000
000
67 00
X
0 00
1 00
1000
1900
000
4.00
52.00
1200 00
46 00
48.00
79 00
0 00
000
0 00
5800 00
450 00
99 00
000
120 00
41 00
1600 00
900
71 00
56 00
1300
420 00
1300 00
72 00
16000 00
19 00
700 00
660 00
49 00
780 00
260 00
33 00
1100 00
X
170 00
4600 00
220 00
11000
100 00
860 00
270 00
3800 00
21000
150 00
• 6900 00
99 00
580 00
150 00
260 00
9300 00
870 00
000
520 00
75 00
2300 00
190 00
700 00
410.00
590.00
9000 00
81 00
000
000
000
0 00
000
000
0 00
000
000
1 00
000
000
2300 00
0 00
0 00
90 00
0 00
0 00
000
000
000
X
000
1900 00
0.00
0.00
000
000
0.00
45 00
000
0.00
1900 00
000
000
0 00
0.00
0.00
0 00
000
000
0 00
400 00
000
000
0 00
0.00
2800 00
X
19303 00
6739 00
660 00
5500 00
2500 00
2640 00
0.00
000
700 00
1120 00
4200 00
4320 00
000
45 00
0.00
(2).
0 00 34000 00 35601 00
0.00
9 00
X
3571 00
000
3500 00
4200 00
4256 00
0 00
000
X
1300
3200 00
3675 00
46.00
000 100000 00 101389 00
0 00
72.00
X
X
20500 00
0.00
000
250 00
269 00
8534 00
000
7800 00
3179 00
610.00
1800 00
249 00
0.00
200 00
7500 00
8319 00
000
8700 00
8960 CO
0 0-0
3000 CO
3033 00
000
2947 00
000
1600 00
000
X
X
7500 00
7682 00
000
7291 00
420.00
X
000 23000 00 23235 00
0.00 16000 00 16139 00
0 00
2100 00
2203 00
864 00
0 00
X
x
322 00
0.00
5565 00
0.00
X
000
7000 00
7317 00
1803.00
0 00
1600 00
6200 00 58000 00 73559 00
290 00
389 00
000
000
2900 00
3531.00
0 00
990 00
1140 00
1250 00
000
990 00
X
78000 00
000
27897 00
0.0027090 00
000
X
120.00
5364 00
0.03
4800 00
690 00
81500
000
3254 00
X
28 00
2200 00
2393 00
000
000 35000 00 35964 00
4941 00
4200 00
0.00
8290 00
000
4100 00
52 00
20 00
9 00
2 00
1600
11 00
22 00
1 00
600
1200
1 00
3 00
23 00
1 00
11000
1 00
84 00
300
1 00
31 00
1300
200
46 00
X
5 00
900
23 00
16 00
18 00
4 00
2.00
S3 00
33 00
14 00
220 00
14 00
1500
8 00
1300
630 00
50 00
200
50 00
7 00
17 00
36 00
79 00
14 00
19 00
150 00
120 00
42 00
11000
120 00
25 00
150 00
1 00
58 00
170 00
3 00
4 00
41 00
900
200 00
000
1200 00
1 00
1200
49 00
69 00
9 00
530 00
X
4 00
47 00
380 00
36 00
300 00
130 00
200
220 00
4900
210 00
61000
30 00
97 00
14 00
580 00
950 00
1000 00
23 00
560 00
17 00
64 00
200 00
52 00
86 00
2C0 00
000
X
X
6 00
1 00
X
11.00
200
800
X
4 00
7 00
500
1 CO
11000
X
230 CO
X
3700 00
3902 CO 73056 00
146 00
2733 52
973 58
52 00
2096 94
11200
2752 24
147 00
33 00
711 46
3370 09
180 00
200
37.45
1273.14
68 00
189 00
3538 59
9.00
168 50
149 78
8 00
174 00
3257.75
187.23
10.00
1000 00 18722 71
1 00
18.72
1284 00 24039 96
74 89
4 00
318 29
1700
97.00
1816 10
282 00
5279 80
63 00
1179 53
584 00 10934 06
000
000
56 00
1048 47
416 00
7788 65
833 00 15596 02
111 00
2078 22
356 00
6665 28
136 00
254 6 29
74 89
4 00
5204 91
278 00
120 00
2246.72
230.00
4306 22
981 00 18366 98
842 52
45 00
128 00
2396.51
1722.49
92 00
594 00 11121 29
2490 00 46619 54
1051 00 19677.57
25.00
468 07
730.00 13667 58
524 24
28 00
1516 54
81.00
4605 79
246 00
4718 12
252.00
2003.33
107.00
4474.73
23900
4100 00
X
Tanzania
Togo
Tunisia
Uganda
Zaire
Zambia
Zimbabwe
25 40
10 00
4.70
1 30
900
5 50
1120
0.40
2 90
5 70
0 so
200
1260
0.40
54 10
0 40
46 70
1 20
0.90
1500
690
1 00
25.10
1.80
260
4.50
12.00
8 40
9.40
200
1 10
25.10
15 70
7.10
113 00
7.20
7.40
4 20
7 60
35 20
25 20
0 SO
27.30
3 50
8.20
18 40
36 00
850
9.70
NORTH & CENTRAL AMERICA
421.30
16000.00 470000.00 680000 00 280000 00
6300.00
90000.00 1542300.00
18000 00
0 00
1400 00
0.00
0.00
0.00
0.00
000
0.00
000
0.00
1200 00
0.00
0.00
1900 00
1800 00
1 00
X
249 00
1700 00
000 110100 00
6 00
15000 00 15731 00
24 00
49 00
9261 00
1849 00
14 00
99 00
73300
1300
180 00
1900
10000 00 10950 00
26.00
21300
1200
900
9800 00 10314 00
58 00
1692 00
500
32000 00 113600 00
180 00
17000 00 17574 00
800
5400.00
6152 00
500
87.00
4870 00
3 00
6000 00 1 227600.00 16000 00
Rwanda
Senegal
Sierra Leone
Somalia
South Africa
Sudan
Swaziland
o.oo
67000 00
000
120 00
300
000
66 00
000
210 00
280 00
3600 00
x
X
X
X
000
X
X
X
X
X
X
X
X
X
X
x
X
X
X
X
X
X
X
X
X
X
X
X
X
4 00
000
000
1 00
X
X
X
X
880 00
X
X
4 00
17.00
200 CO
52.00
600
X
47.00
X
430 00
9 00
38.00
200
X
1 00
38 00
6 00
150.00
1 00
16 00
70 00
1 00
000
X
X
X
X
X
X
X
X
X
X
X
X
X
460 00
X
X
X
X
X
X
X
X
X
X
360 00
X
50 00
X
X
X
X
X
X
X
X
X
X
X
X
X
X
X
X
X
X
X
X
X
X
X
2000 00
X
5100 00
X
X
X
X
2400 00
X
X
X
X
410 00
X
X
X
X
X
X
X
X
X
18000 00
X
1200 00
X
X
5800 00
X
X
1 co
100
3 00
20 00
X
120 00
4 00
X
1000
120 CO
4 00
X
10000 00
3900 00
700.00
1 00
760 00
92 00
240 00
77 00
3500
97 00
61 00
89 00
14 00
1500.00
75 00
55 00
300
7000 00
X
150 00
X
X
X
X
X
X
X
X
42 00
X
X
X
3700 00
X
X
X
6 00
83 00
48 00
2.00
2.00
500
JOO
000
22 00
11 00
1300
0.00
510.00
7800.00
X
X
X
X
X
X
X
4 500 00
X
X
X
15000.00
130 00
37.45
2.00
10410.00 194903 38 36000 00
1947.16
490 00
104 00
1800.00
6496.78
347.00
1200 00
2602.46
139 00
860 00
50 00
936 14
2209 28
X
11800
146037
X
7800
350
00
1890
99
101 00
420.00
355.73
19 00
9100
00
116904
59
6244 00
61000
1759 93
94 00
400 00
1366 76
73 00
640 00
112 34
600
42210.00 790285 48 350000.00
X
X
X
X
X
X
X
X
X
27000.00
000
210.00
1200
27.00
1700.00 26000 00 52000 00 29000 00
660 00
0 00
71 00
0.00
6600 00
12 00
120 00
480 00
0 00
1600 00
0.00
150 00
470 00
000
83 00
0 00
000
180 00
000
770.00
160 00
000
000
27.00
ooo
54 00
460 00
000
0.00
1600 00
000
34.00
2700 00
5700 00 58000 00 14000 00
000
560 00
000
14 00
400
700 00
000
48 00
740.00
2100.00
43.00
000
9800 00 430000 00 540000.00 240000 00
SOUTH AMERICA
296 60
6700 00
16000 00
92000 00
27000.00
3700.00 240000 00 385400 00
620 00
13000 00
100 00
850 00
2300 00
17235 00 322685 86
Argenona
BoLvia
Brazil
32.30
7 30
150 40
1320
31 80
1080
1.00
4 30
22 30
860 00
41.00
3500 00
200 00
810.00
270 00
000
20 00
27000
1000 00
000
10000 00
1300.00
3400 00
000
000
000
160 00
17000 00
840 00
38000 00
5100 00
7200 00
3600 00
280 00
430 00
5600 00
10000 00
160 00
1500.00
450 00
2300 00
36 00
0.00
000
340 00
1300 00
X
30160 00
78.00
6800 00
7919 00
540 00 1200000 001253540 00
98 00
X
7148 00
240.00 120000.00 133950 00
220 00 39000.00 43126 00
0 00
340.00
620 00
0 00
7400.00
7850 00
94.00 45000 00 51464.00
70 00
1500
320 00
29 00
68 00
22 00
200
8 00
45 00
3100.00
220 00
7500.00
180 00
890 00
140 00
1200
193 00
190 00
2 00
X
37 00
SCO
53.00
X
18.00
14 00
490 00
6 00
180.00
21 00
14 00
600
36 00
540 00
50 00
51000
130 00
11000
3730 00 69835 70
5598 09
299 00
8857 00 165827 02
6609
12
353 00
1301 00 24358 24
26
3426
183 00
524 24
28 00
3819 43
204 00
5092 58
272 00
X
X
1.00
X
X
X
X
X
X
X
X
1300 00
X
X
X
1500 00
59995.00 1123268 83 400000 00
030
26 50
300
1030
7.20
5 30
9 20
6 50
5 10
2.50
88 60
390
2 40
1 30
249 20
Colomba
Ecuador
Guyana
Paraguay
Peru
X
X
oco
Barbados
Canada
Costa Rica
Cuba
Dominican Rep
El Salvador
Guatemala
Haiti
Honduras
Jama ca
Meiico
Mcaragua
Panama
Tnnidad and Tobago
United Slates
CM*
X
34000 00
5500 00
X
16000 00
2200 00
5200 00
1700.00
X
X
X
Contd.
26
Liquid
Gas
Flaring
Land Use
Change
330 OO
890 00
12000 00
000
000
12000 00
000
OOC
1100 00
350 00
X
18000 00
Solid ,
('000 tonnes of methane)
Total
Meth ar. e
(-000
. tornes )
Livestock
Hard
Coals
Wet
Rce
Pipeline
Leakage
695 00
946 CO
4 3960 GO
X
X
0.00
35 00
1300
1900
X
X
980 00
711 46
9005 62
27878 11
68 00
540 00
3200 CO
S8 8
Solid
Waste
Total 1986 CFC Use
Methane
('COO tonnes
of corbon ____________
OQjrvalent) Equivalent
Carbon <Sor>de
heaSng effect
('000 tonnes
of Carbon)
32S
('000 tonnes of Carbon)
Cement
Anthropogenic Addions to the
Methane Flux (c 1987)
Total
Carbon Diovide
(000 tonnes
of carbon
equivalent)
Anthropogenic Additions to the Carbon
Dioxide Rux (c 1987)
Population
888
Country/
Continent
200
460 00
450 00
ASIA
3100 53
60000.00 770000 00 480000 00
90000 00
19000 00 870000 00 2289000 00
8700 00
23000 00
5 SCO GO
62000 00
8300 00 1C8330 00 2023230 90 190000 00
Afghanistan
Bahrain
Bangladesh
Bhutan
China
Cyprus
In <4 a
Indonesia
Iran. Islamic Rep
Iraq
Israel
Japan
Jordan
Kam pu the
Korea, Dem People's Rep
Korea. Rep
Kuwait
Lao People s Dem Rep
Lebanon
Malaysia
Mongolia
Myanmar
Nepal
On an
Pakistan
Philippines
Qatar
Saudi Arabia
Singapur
Sri Lanka
Syrian Arab Rop
Thailand
Turkey
United Arab Emirates
Viet Nam
Yeman Arab Rep
Yemen. People's Dem Rep
1660
0 50
11560
1.50
1135 50
0 70
853.40
180 50
56 60
18 90
4.60
123 50
4 30
8 20
22 90
43.60
2 10
4.10
300
17 33
2 20
41 70
19.10
1 50
122.70
62.40
0 40
14 10
2.70
17.20
12 50
55.70
55.60
1.60
67 20
8 00
2 50
14.00
550 00
120 00
000
000
2100 00
42 00
34 00
1500 00
0.00
800
1 00
24000 00 480000 00 84000 00
870 00
120 00
110 00
5000 00 110000 00 35000 00
1600 00
2200 00 21000 00
1700 00
1100 00 26000 00
1400.00
1 00
8600 00
28000
5300 00
2500 00
9500 00 75000 00 140000 00
31000
000
2400.00
000
120.00
0.00
1100 00 36000 00
2800 00
3500 00 23000 00 20000 00
140 00
0.00
4 500 00
000
000
56 00
2200.00
120 00
0.00
390.00
360.00
7700.00
27.00
1800.00
670.00
53.00
7900
730 00
14.00
62 00
150 00
4500.00
0.00
000
6700 00
930.00
1800 00
480 00
1200.00
8200.00
580.00
41.00
000
1300.00
0.00 32000.00
210.00
11.00
7600 00
1000 00
81 00
000
6700 00
570 00
1.00
2100
00
1200.00
10000.00
3000.00 18000.00 16000.00
4700 00
340 00
000
210.00
3700 00
1200 00
100 00
0.00
81000
1500.00
0.00
0.00
320 00
2300 00
1800 00
000
7300 00
000
3200 00
3400 CO
8400 00
520 00
21 00
23000 00
0M
0 00
X
1096 00
92 00
0 00
X
4400 00
000
1900 00
5276 00
220 00
229 00
000
810.00
X
596110 00
000
X
1100 00
1700 00 140000 00 294900 00
6700 00 220000 00 254900 00
2500 00
X
39700 00
2700 00
X
13221 00
000
X
8101 00
24 00
X 247524 00
OCO
X
271000
000
4800 00
4920 00
39900 00
000
X
X
47700 00
0 00
X
360 00
9100 00
0 00 85000 00 85056 00
X
2320 00
000
610 00 38000.00 49360 00
X
2497 00
0 00
27 00 150000 00 151439 00
000
6700 00
6926 00
X
5920 00
320 00
420 00
770 00 15320 00
0.00 68000 00 77880 00
0 00
X
3121.00
1000 00
X
46300 00
000
X
7821 00
0.00
17C0 00
2781 00
X
7560 00
190 00
000 94000 00 109500 00
37150 00
000
X
1900 00
X
14040 00
0.00 58000.00 63110.00
000
X
91000
000
X
1500 00
42 00
1 00
230 00
300
2500 00
2 00
1800 00
380 00
100 00
36 00
120 00
2400 00
600
17 00
47 00
96 00
4 00
1000
500
36 00
4 00
89 00
38.00
3.00
220 00
130 00
1 00
26.00
6 00
37 00
23.00
120 00
11000
3 00
140 00
15.00
500
270 00
0 00
1400 00
1300
4400 00
6 00
10000 00
430 00
540 00
130 00
22 00
260 00
1000
83 00
42 00
83 OO
8 00
66 00
4 00
37 00
250 00
4 50 00
490 00
14 00
1500 0-3
230 00
1 00
59 00
200
11000
100 00
470 CO
980 00
8 00
220 00
57 00
22 CO
1 00
X
X
X
4200 00
X
830 00
9 00
4 00
X
X
80 00
X
X
200 00
120 GO
X
X
X
X
3 00
0 00
X
100 00
X
4600 00
1800
18000 00
X
18000 00
4900 00
250 00
25 00
X
1200 00
X
840 00
430 00
630 00
X
240 00
X
320 00
X
230-3 00
660 GO
X
970 GO
1800 00
X
X
X
70 00
X
X
X
X
180 00
400 GO
1100 00
X
X
X
X
X
X
X
580 00
X
X
50 00
X
X
X
640 00
X
X
480 00
4 6 CO 00
x
340 00
X
4500 00
26 00
X
2800 00
X
X
X
X
X
X
X
X
X
X
X
41300
7732 48
160 0-3
71 00
1329 31
6230 00 116642 47
X
X
34 00
636 57
29100 00 544830 79 32000 00
149 78
X
800
70C CO
3C31000 576846 62
9500 00
6119CO 114564 25
1394 00 37333 G8
9000 00
3GGC00
3576 04
191 00
2 6 58 62
54CC 00
142 00
3940 00 73767 47 100000 00
299 56
X
16 00
X
940 00 17599 34
71900 13461 63
X
5400 00
920 00 17393 40
1603 00
592 00 11083 84
X
316 00
5916 38
168 50
9 CO
X
2500 00
44300
8294.16
481 1.74
X
257.00
X
2839 CO 53153.77
X
1188 CO 22242 58
657 00 12300 82
X
2700 00 50551 31
X
2166 0-3 40553 38
X
9024 34
482 00
X
6600 00
4385 00 91460 43
3700 00
8 00
149.78
X
487 00
9117.96
X
12300
2302 89
3500 00
5-OSO CO 95298 53
1134.00 21231.55
9200 OC
2300 CO
11 00
205 95
X
3183 00 59687 99
72 00
1343 03
X
X
27.00
505 51
EUROPE
497 20
33000.00 550000.00 440000 00 170000 00
5100 00
0.00 1198100.00
9200.00
9200 00
2300 0-3
220 00
6300 00
27102 00 507928.33 480000 00
Albania
Austria
Belgium
Bulgaria
Czechoslovakia
Denmark
Finland
France
German Dem Rep
Germany. Fed Rep
Greece
Fkrngary
Iceland
Ireland
Italy
Luxembourg
Malta
Netherlands
Norway
Poland
Portugal
Romania
Spain
Sweden
Switzerland
United Kingdom
Yugoslavia
3 20
750
9.90
900
15.70
5 10
500
56 20
16 60
60.50
10.00
10 60
0.30
3.70
57 30
0 40
0.40
14 80
4 20
38 40
10 30
23 30
39 30
8 30
6 50
56 90
23.80
1000 00
120 00
620 00
3900 00
790 00
8900 00
770.00 16000.00
1400.00 46000 00
270 00
8500 00
220 00
4800 00
3200.00 21000.00
1600 00 71000 00
3400 00 79000 00
1800 00
7100 00
560 00
8800 00
15.00
61 00
190 00
3800.00
4900 00 15000 03
1000 00
42.00
0 00
130 00
420.00
7300 00
230 00
840 00
2200.00 110000 00
1900 00
790 00
1900 00 21000 00
3200 00 17000 00
300 00
3000 00
540 00
460 00
1800.00 71000.00
1200.00 19000.00
200 00
2600 00
4100.00
2900.00
5200 00
81000
820 00
140C0 00
4300 00
26000 00
70.00
5300 CO
000
840 00
19000 00
21000
0 00
21000 00
84000
5500 00
000
22000 00
1600.00
150 00
870 00
31000 00
3203 00
000
000
000
0.00
0 00
600
0 00
0 00
000
0 co
000
000
000
0.00
000
0.00
0 00
45 00
3500 00
000
0 00
460 00
38 00
000
000
1100.00
000
0.00
2620.00
0.00 14820 00
0.00 26790 00
000 33670 00
000 65600 00
0.00 16886.00
0 00 14640 00
0 00 94200.00
0.00 89900 00
000 181400 00
0.00 16170.00
000 20860 00
0 00
496.00
oco 7730.00
0.00 101900 00
000
2242 00
0.00
380 00
000 36065 00
0.00 1231000
000 128700.00
8490 00
000
0.00 58360 00
000 46838 00
000 15450 00
0.00 10870 00
000 156900 00
0 00 34400.00
47 00
150 00
210 00
X
250 00
100 00
97 00
1100 00
300 00
1200 00
200 00
170 00
500
70 00
1100 0-3
7 00
8 00
290 00
82 00
600 00
200 00
370 00
770 00
170 00
130 00
1100 00
460 00
47 00
160.00
140 00
200.00
300 00
170 00
96 00
1500 00
360 0-3
920 00
140 00
150 00
11.00
360 00
590 CO
41 00
1 00
350 OO
76 00
800 00
100 00
560 00
450 00
11000
120 00
950.00
420 00
X
X
28.00
1 00
130 00
X
X
82 00
X
440 00
X
1200
X
000
X
X
X
X
3.00
950 00
1.00
44 00
80 00
0.00
X
540 00
200
200
X
X
9 00
X
X
X
7 00
X
X
1000
600
X
X
100 0-3
X
X
X
X
X
17.00
23.00
42 00
X
X
X
500
X
X
X
X
X
X
X
1500 00
X
X
X
220 00
X
X
20.00
X
X
2200 00
51000
X
X
X
X
X
1800 00
X
96no
310.00
378 00
21000
680 00
270 00
193.00
4189 00
660 00
2560 00
350 00
558 00
16 00
4 30 OO
1510.00
48 00
9.00
2340.00
671.00
2360 00
31800
997 CO
1342 OO
280 00
250 00
4390 00
887 00
19000 00 370000 00 340000.00 300000 00
5100 00
0 001034100 00
Suriname
Uruguay
Venezuela
0.40
3 10
19 70
7.00
55 00
730 00
800
1 00
130 00
1300 00
7700 00
13000 00
12000.00
13000 00
7300.00
8800 00
56000 00
13000.00
73000 00
7200.00
6200 00
420 00
2900 00
63000 00
990 00
250 00
7300 00
6900.00
11000 00
5800.00
13000 00
25000 00
12000 00
9000 00
52000 00
11000.00
oco
1200 00
4103 00
000
0.00
2300 00
000
600 00
000
1100 00
4700 00
000
2500 00
12000 03
000
000
99 00
2200.00
150 00
7100 00
0.00
000
0 00
x
1000
600
X
X
X
X
x
X
18 00
X
28 00
X
1797 38
53C4.04
70 77 1 8
3931 77
12731.44
5055.13
3613 48
78429 42
12356 99
47930 13
6552.95
10447 27
299 SO
8050.76
33833 10
898 69
163 50
53172 49
12562 94
44185.59
5953 62
18666 54
25125 87
5242 36
4680 6-3
82192 69
16607.04
X
9100 0*3
1200300
1600 CO
2700 CO
6300 00
6100 00
69000 CO
20000 00
75000 00
12000 00
19-00 00
170 00
4500 00
71000 00
450.CO
X
1800-3 GO
1200 00
13000 00
13OOOO-3
X
48000 00
6300 00
10000 00
71000 00
8200 00
U.S S.R
288 00
4400.00
81C0 00
2600 00
320 00
3700 00
19120.00 357978 17 180000 00
OCEANIA
25.10
960 00
36000.00
26000 00
9800 00
27 00
2700.00
75487.00
110-3 00
2900 00
680 00
59 00
1100 00
5333 00 109153 38
25000 00
Australia
Fiji
Now Zealand
Papua New Guinea
Solomon Islands
16.70
0.70
3 40
4.00
0 30
81000
13.00
120.00
0 00
0 00
35000 00
12.00
1200.00
1.00
0.00
21000 00
130.00
2600 00
640.00
37.00
7900 00
0 00
1900 00
0 00
000
000
000
X
000
000
27.00
0 00 2700 00
X
000
64710 00
155 00
594 7 00
3341 00
37 00
1000 00
2 00
64 00
9 00
1 00
1900 00
7 00
960 00
600
1 00
67000
X
11 00
X
X
52 00
6 OO
X
X
1 00
77000
X
370.00
X
X
4392 00
1500
1405 00
15.00
300
21000 00
130 00
3500 00
X
X
Note :Certain totals given above do not match those given in the WRI repot! because of the extensive rounding oil done in the WRI report
27
82230 13
280 34
26305 40
280 84
56 17
Appendix 2
Permissible Emissions of Carbon Dioxide and Methane (on a population basis) (as calculated by CSE)
Country/
Continent
Percentage
of World's
Population
Permissible
Emissions of
Carbon Dioxide
Actual Emission
of Carbon Dioxide
Emissions of .
('000 t of Carbon
equivalent)
('000 t of Carbon
equivalent)
Loss (-) or
Excess (•)
Methane
Carbon Dioxide
over Permissible
Emissions
('000 t of Carbon
equivalent)
Permissible
Emissions of
Emissions of
Actual Emission
of Methane
Less (♦) or
Excess (•)
('000 t of Carbon
equivalent)
( 000 t of Carbon
equivalent)
Methane
over Permissible
Emissions
('000 t of Carbon
equivalent)
Algeria
Angola
Benin
Botswana
Burkina Faso
Burundi
Cameroon
Capo Verde
Central African Rep
Chad
Comoros
Congo
Cote d'Ivoire
Djibouti
Egypt
Equatorial Guinea
Ethiopia
Gabon
Gambia. The
Ghana
Guinea
Guinea-Bissau
Kenya
Lesotho
Liberia
Libya
Madagascar
Malawi
Mali
Mauritania
Mauritius
Morocco
Mozambique
Niger
Nigeria
Rwanda
Senegal
Sierra Leone
Somalia
South Africa
Sudan
Swaziland
Tanzania
Togo
Tunisia
Uganda
Zaire
Zambia
Zimbabwe
0.48
0.19
0.09
0.02
0.17
0.10
0.21
0.01
0.05
0.11
0.01
0.04
0.24
0.01
1.03
0.01
0.89
0.02
0.02
0.28
0.13
0.02
0.48
0.03
0.05
0.09
0.23
0.16
0.18
0.04
0.02
0.48
0.30
0.13
2.14
0.14
0.14
0.08
0 14
0.67
0.48
0.02
0.52
0.07
0.16
0.35
0.68
0.16
0.18
23119.24
9102 06
4277.97
1183.27
8191.86
5006 13
10194.31
364.08
2639.60
5188.18
455.10
1820.41
11468.60
364.08
49242.16
364 08
42506.63
1092.25
819.19
13653.09
6280.42
910.21
22846.18
1638.372366.54
4095.93
10922.48
7645.73
8555.94
1820.41
1001.23
22846.18
14290.24
6462.46
102853.31
6553.49
6735.53
3822.87
6917.57
32039.26
22937.20
728.17
24848.63
3185.72
7463.69
1674 7.80
32767.43
7736.75
8829.00
19300.00
6739.00
2640.00
1120.00
4320.00
45.00
35601.00
9.00
3571.00
4256.00
13.00
3675.00
101389.00
72.00
20500.00
269.00
8534.00
3179.00
249.00
8319.00
8960.00
3033.00
2947.00
0.00
7682.00
7291.00
23235.00
16139.00
2203.00
864.00
322.00
5565.00
7317.00
1803.00
73559.00
389.00
3531. '
1140.00
1250.00
78000.00
27897.00
120.00
5364.00
815.00
3254.00
2393.00
35964.00
4941.00
8290.00
3819.24
2363.06
1637.97
63.27
3871.86
4961.13
-25406.69
355.08
-931.40
932.18
442.10
-1854.59
-89920.40
292.08
28742.16
95.08
33972.63
-2086.75
570.19
5334.09
-2679.58
-2122.79
19899.18
1638.37
-5315.46
-3195.07
-12312.52
-8493.27
6352.94
956.41
679.23
17281.18
6973.24
4659.46
29294.31
6164.49
3204.53
2682.87
5667.57
-45960.74
-4959.80
608.17
19484.63
2370.72
4209.69
14354.80
-3196.57
2795.75
539.00
19266.03
7585.05
3564.97
986.06
6826.55
4171.78
8495.26
303.40
2199.67
4323.48
379.25
1517.01
9557.17
303.40
41035.13
303.40
35422.19
910.21
682.65
11377.58
5233.69
758.51
19038.48
1365.31
1972.11
3413.27
9102.06
6371.44
7129.95
1517.01
834.36
19038.48
11908.53
5385.39
85711.09
5461.24
5612.94
3185.72
5764.64
26699.38
19114.33
606.80
20707.19
2654.77
6219.74
13956.50
27306.19
6447.29
7357.50
73056.00
2733.52
973.58
2096 94
2752.24
711.46
3370.09
37.45
1273.14
3538.59
168 50
149.78
3257.75
187.23
18722.71
18.72
24039.96
74.89
318.29
1816.10
5279.80
1179.53
10934.06
0.00
1048.47
7788.65
15596.02
2078.22
6665.28
2546.29
74.89
5204.91
2246.72
4306.22
18366.98
842.52
2396.51
1722.49
11121.29
46619.54
19677 57
468.07
13667.58
524.24
1516.54
4605.79
4718.12
2003.33
4474.73
■53789.97
4851.54
2591.39
•1110.89
4074.31
3460.32
5125.17
265.96
926.52
784.89
210.75
1367.23
629941
116.18
22312.42
284.68
11382.24
835.32
364.37
9561.48
-46.12
-421.03
8104.42
1365.31
923.64
-4375.37
-6493.95
4293.22
464.67
-1029.28
759.46
13833.57
9661.81
1079.16
67344.11
4618.72
3216.43
1463.23
•5356.65
-19920.16
•563.23
138.74
7039.62
2130.53
4703.20
9350.71
2288.07
4443.96
2882.77
Barbados
Canada
Costa Rica
Cuba
Dominican Rep
El Salvador
Guatemala
Haiti
Honduras
Jamaica
Mexico
Nicaragua
Panama
Trinidad and Tobago
United States
Argentina
Bolivia
Brazil
Chile
Colombia
Ecuador
Guyana
Paraguay
0.01
0.50
0.06
0 20
0.14
0.10
0.17
0.12
0.10
0.05
1.68
0.07
0.05
0.02
4.73
0.61
0.14
2.85
0.25
0.60
0.20
0.02
0.08
273.06
24120.47
2730.62
9375.12
6553.49
4824.09
8373.90
5916.34
4642.05
2275.52
80644.27
3549.80
2184.50
1183.27
226823.40
29399.66
6644.51
136895.02
12014.72
28944.56
9830.23
910.21
3913.89
249.00
110100.00
15731.00
9261.00
1849.00
733.00
10950.00
213.00
10314.00
1692.00
113600.00
17574.00
6152.00
4870.00
1227600.00
30160.00
7919.00
1253540.01
7148.00
133950.00
43126.00
620.00
7850.00
24.06
•85979.53
-13000.38
114.12
4704.49
4091.09
-2576.10
5703.34
-5671.95
583.52
. -32955.73
-14024.20
-3967.50
-3686.73
-1000776.60
-760.34
-1274.49
-1116644.98
4866.72
■105005.44
-33295.77
290.21
-3936.11
227.55
20100.39
2275.52
7812.60
5461.24
4020.08
6978.25
4930.28
3868.38
1896.26
67203.56
2958.17
1820.41
986.06
189019.50
24499.72
5537.09
114079.18
10012.27
24120.47
8191.86
758.51
3361.57
37.45
194903.38
1947.16
6496.78
2602.46
936.14
2209.28
1460.37
1890.99
355.73
116904.59
1759.93
1366.76
112.34
790285.48
69835.70
5598.09
165827.02
6609.12
24358.24
3426.26
524.24
3819.43
190.11
-174803.00
328.35
1315.82
2858.78
3083.94
4768.97
3469.91
1977.38
1540.53
-49701.02
1198.24
453.65
873.72
-601265.98
-45335.98
-61.00
-51747.84
3403.15
-237.78
4765.60
234.27
•557.86
Contd.
28
Country/
Continent
Percentage
of World's
Population
Permissible
Emissions of
Carbon Dioxide
Actual Emission
of Carbon Dioxide
Emissions of
('000 t of Carbon
equivalent)
('000 t of Carbon
equivalent)
Less (♦) or
Excess (-)
Methane
Carbon Dioxide
over Permissible
Emissions
('000 t of Carbon
equivalent)
Actua1 Emission
of Methane
Less (♦) or
Excess (-)
('000 t of Carbon
equivalent)
('000 t of Carbon
equivalent)
Methane
over Permissible
Emissions
('000 t of Carbon
equivalent)
Permissible
Emissions of
Emissions of
Peru
Suriname
Uruguay
Venezuela
0.42
0.01
0.06
0.37
20297.60
364.08
2821.64
17931.06
51464 00
695.00
946.00
43960.00
-31166.40
-330.92
1875.64
-26028.94
16914.67
303.40
2351.37
14942.55
5092.58
711.46
9005.62
27878.11
11822.09
-408.06
-6654.26
-12935.56
Afghanistan
Bahrain
Bangladesh
Bhutan
China
Cyprus
India
Indonesia
Iran, Islamic Rep
Iraq
Israel
Japan
Jordan
Kampuchea
Korea, Dem People's Rep
Korea, Rop
Kuwait
Lao People's Dem Rep
Lebanon
Malaysia
Mongolia
Myanmar
Nepal
Oman
Pakistan
Philippines
Qatar
Saudi Arabia
Singapore
Sri Lanka
Syrian Arab Rep
Thailand
Turkey
United Arab Emirates
Viet Nam
Yemen Arab Rep
Yemen, People's Dem Rep
0.31
0.01
2.19
0.03
21.53
0.01
16.18
3.42
1.07
0.36
0.09
2.34
0.08
0.16
0.43
0.83
0.04
0.08
0.06
0.33
0.04
0.79
0.36
0.03
2.33
1.18
0.01
0.27
0.05
0.33
0.24
1.06
1.05
0.03
1.27
0.15
0.05
15109.42
455.10
105219.84
1365.31
1033539.20
637 14
776770.02
164292.23
51517.67
17202.90
4186.95
112410.47
3913 89
7463.69
20843.72
39684.99
1911.43
3731.85
2730.62
15773.87
2002.45
37955.60
17384.94
1365.31
111682.31
56796.87
364.08
12833.91
2457.56
15655.55
11377.58
50698.49
5060747
1456.33
61165.86
7281.65
2275.52
1096.00
4400.00
5276.00
229.00
596110.00
1100.00
294900.00
254900.00
39700.00
13221.00
8101.00
247524.00
2710.00
4920.00
39900 00
47700.00
9100.00
85056.00
2320.00
49360.00
2497.00
151489.00
6926.00
5920.00
15320.00
77880.00
3121.00
46300.00
7821.00
2781.00
7560.00
109500.00
37150.00
14040.00
63110.00
910.00
1500.00
14013.42
-3944.90
99943 84
1136.31
437429.20
-462.86
481870.02
-90607.77
11817.67
3981.90
■3914.05
-135113.53
1203.89
2543.69
-19056 28
■8015.01
-7188.57
-81324.15
410.62
-33586.13
-494.55
-113533.40
10458.94
-4554.69
96362.31
-21083.13
-2756.92
-33466.09
-5363.44
12874.55
3817.58
-58801.51
13457.47
-12583.67
-1944.14
6371.65
775.52
12591.19
379.25
87683.20
1137.76
861282.67
530.95
647308.35
136910.19
42931.40
14335.75
3489.12
93675.39
3261.57
6219.74
17369.77
33070.83
1592.86
3109.87
2275.52
13144.90
1668.71
31629.67
14487.45
1137.76
93068.59
47330.73
303.40
10694.92
2047.96
13046.29
9481.32
42248.74
42172.89
1213.61
50971.55
6068.04
1896.26
7732.48
1329.31
116642.47
636.57
544830.79
149.78
576846.62
114564.25
37333.08
3576.04
2658.62
73767.47
299.56
17599.34
13461.63
17393.40
11083.84
5916.38
168.50
8294.16
4811.74
53153.77
22242.58
12300.82
50551.31
40553.38
9024.34
91460.43
149.78
9117.96
2302.89
95298.58
21231.55
205.95
59687.99
1348.03
505.51
4858.71
-950.06
-28959.26
501.19
316451.88
381.17
70461.73
22345 94
5598.32
10759.71
830.50
19907.93
2962.01
-11379.60
3908.14
15677.43
-9490.98
-2806.50
2107.01
4850.74
-3143.02
-21524.10
-7755.13
-11163.06
42517.28
6777.34
-8720 94
-80765.50
1898.18
3928.33
7178.42
-53049.84
20941.34
1007.66
-8716.44
4720.01
1390.75
Albania
Austria
Belgium
Bulgaria
Czechoslovakia
Denmark
Finland
France
German Dem Rep
Germany, Fed Rep
Greece
Hungary
Iceland
Ireland
Italy
Luxembourg
Malta
Netherlands
Norway
Poland
Portugal
Romania
Spain
Sweden
Switzerland
United Kingdom
Yugoslavia
U.S.S.R.
0.06
0.14
0.19
0.17
0.30
0.10
0.09
1.07
0.31
1.15
0.19
0.20
0.01
0.07
1.09
0.01
0.01
0.28
0.08
0.73
0.20
0.44
0.75
0.16
0.12
1.08
0.45
5.46
2912.66
6826.55
9011.04
8191.86
14290.24
4642.05
4551.03
51153.59
15109.42
55067.48
9102.06
9648.19
273.06
3367.76
52154.82
364.08
364.08
13471.05
3822.87
34951.92
9375.12
21207.81
35771.11
7554.71
5916.34
51790.74
21662.91
262139.40
2620.00
14820.00
26790.00
33670.00
65600.00
16886.00
14640.00
94200.00
89900.00
181400.00
16170.00
20860.00
496.00
7730.00
101900.00
2242.00
380.00
36065.00
12310.00
128700.00
8490.00
58360.00
46838.00
15450.00
10870.00
156900.00
34400.00
1034100.00
292.66
-7993.45
-17778.96
-25478.14
-51309.76
-12243.95
-10088.97
-43046.41
-74790.58
-126332.52
-7067.94
-11211.81
-222 94
-4362.24
-49745.18
-1877.92
-15.92
•22593.95
-8487.13
-93748.08
885.12
-37152.19
-11066.89
-7895.29
-4953.66
-105109.26
-12737.09
-771960.60
2427.22
5688.79
7509.20
6826.55
11908.53
3868.38
3792.53
42627 99
12591.19
45889.57
7585.05
8040.16
227.55
2806.47
43462.35
303.40
303.40
11225.88
3185.72
29126.60
7812.60
17673.17
29809.25
6295.59
4930.28
43158.95
18052.42
218449.50
1797.38
5804.04
7077.18
3931.77
12731.44
5055.13
3613.48
78429.42
12356.99
47930.13
6552.95
10447.27
299 56
8050.76
33888.10
898.69
168.50
53172.49
12562.94
44185.59
5953.82
16666 54
25125.87
5242 36
4680.68
82192.69
16607.04
357978.17
629.84
-115.25
432 02
2894.78
-822.91
-1186.75
179.04
-35801.43
234.20
-2040.57
1032.10
•2407.12
-72.01
-5244.29
9574.25
-595.29
134.90
-41946.61
-9377.21
-15058.99
1858.78
-993.37
4683 38
1053.24
249.61
-39033.74
1445.38
•139528.66
Australia
0.32
0.01
0.06
0.08
0.01
15200.44
637.14
3094.70
3640.83
273.06
64710.00
155.00
5847.00
3341.00
37.00
■49509.56
482.14
•2752.30
299.83
236 06
12667.04
530.95
2578.92
3034.02
227.55
82230.13
280.84
26305.40
280.84
56.17
-69563.09
250.11
■23726.49
2753.18
171 38,
100.00
4800000.00
8238659.00
-3438659.00
4000000.00
4785711.24
-785711.24
Fiji
New Zealand
Papua New Guinea
Solomon Islands
WORLD
29
Appendix 3
Annual Net Emissions to tho atmosphere of Carbon Dioxide (as calculated by CSE)
SI.
No.
Country
Excess emisssions
ol carbon dioxide
over permissible
limits
(‘000 t of carbon
equivalent)
1
Brazil
1116644.98
2
United States
3
U.S.S.R.
4
Permissible
emissions
of carbon dioxide
obtained through
tradeable quotas
('000 t of carbon
equivalent)
Net emissions
of carbon dioxide
to the atmosphere
( 000 t of carbon
eouivalent)
Percentage
of total net
emissions of
carbon dioxide
inthe world
(%)
115868.85
1000776.13
29.10
1000776.60
191984.82
1192761.42
34.69
771960.60
221876.52
550084.08
16.00
Myanmar
113533.40
32125.87
81407.53
2.37
5
Colombia
105005.44
24498.87
80506.58
2.34
6
Cote dlvoire
89920.40
9707.10
80213.30
2.33
7
Germany, Fed Rep
126332.52
46609.48
79723.04
2.32
8
Lao People's Dem Rep
81324.15
3158.66
78165.50
2.27
9
Canada
85979.53
20415.72
65563.81
1.91
10
Poland
93748.08
29583.54
64164.54
1.87
11
German Dem Rep
74790.58
12788.72
62001.86
1.80
12
United Kingdom
105109.26
43836.02
61273.24
1.78
13
Japan
135113.53
95144.97
39968.56
1.16
14
Czechoslovakia
51309.76
12095.35
39214.41
1.14
15
Australia
49509.56
12865.76
36643.80
1.07
16
Ecuador
33295.77
8320.37
24975.40
0.73
17
Saudi Arabia
33466.09
10862.70
22603.39
0.66
0.59
18
Malaysia
33586.13
13351.11
20235.01
19
Romania
37152.19
17950.43
19201.77
0.56
20
South Africa
45960.74
27118.24
18842.50
0.55
21
Bulgaria
25478.14
6933.64
18544.50
0.54
22
Cameroon
25406.69
8628.53
16778.16
0.49
23
Thailand
58801.51
42911.54
15889.98
0.46
24
Peru
31166.40
17180.02
13988.38
0.41
25
United Arab Emirates
12583.67
1232.65
11351.02
0.33
26
Netherlands
22593.95
11401.99
11191.96
0.33
27
Nicaragua
14024.20
3004.58
11019.62
0.32
28
Venezuela
26028.94
15176.97
10851.97
0.32
29
Costa Rica
13000.38
2311.21
10689.17
0.31
30
Denmark
12243.95
3929.06
8314.88
0.24
31
Finland
10088.97
3852.02
6236.95
0.18
32
Italy
49745.18
44144.18
5601.00
0.16
33
Kuwait
7188.57
1617.85
5570.72
0.16
34
Norway
8487.13
3235.70
5251.43
0.15
35
Belgium
17778.96
7627.01
10151.95
0.15
36
Bahrain
3944.90
385.20
3559.69
0.10
37
Oman
4554.69
1155.61
3399.08
0.10
38
Liberia
5315.46
2003.05
3312.41
0.1
39
Singapore/
5363.44
2080.09
3283.35
0.10
~ .
.
*
’’■»
.\ \
12312.52
9244.85
3067.67
0.09
11211.81
8166.29
3045.53
0.09
3686.73
1001.53
2685.21
0.08
2756.92
308.16
2448.76
0.07
7993.45
5778.03
2215.42
0.06
Panama
3967.50
1848.97
2118.53
0.06
46
Malawi
8493.27
6464.77
2028.50
0.06
47
Honduras
5671.95
3929.06
1742.88
0.05
48
Luxembourg
1877.92
308.16
1569.76
0.05
40
Madagascar.*
41
Hungary
.
*•
t
'•
'
42
Trinidad and Tobago*
•'.*
43
Qatar
-
44
Austria
’ _*■
45
e
' .
. Z’*
’i ✓
' \
’
Contd.
30
SI.
No.
Country
Excess emisssions
of carbon dioxide
over permissible
limits
('000 t of carbon
equivalent)
Permissible
emissions
of carbon dioxide
obtained through
tradeable quotas
('000 t of carbon
equivalent)
Net emissions
of carbon dioxide
to the alnxxiphere
('000 t of carbon
equivalent)
Percentage
of total net
emissions of
carbon dioxide
inthe worid
(%)
49
Ireland
4362.24
2850.50
1511.74
0.04
50
Sweden
7895.29
6394.36
1500.93
0.04
51
Korea, Dem People's Rep
19056.28
17642.26
1414.01
004
52
Guinea-Bissau
2122.79
770.40
1362.39
0.04
53
Gabon
2086.75
924.49
1162.27
0.03
54
Paraguay
3936.11
3312 74
623.37
0.02
55
Israel
3914.05
3543.86
370.19
0.01
56
Congo
1854.59
1540.81
313.78
0.01
57
Now Zealand
2752.30
2619 38
132 92
0.00
58
Suriname
330.92
308.16
22.76
0.00
59
Libya
3195.07
3195.07
0.00
0.00
60
Mexico
32955.73
32955.73
0.00
0.00
61
Indonesia
90607.77
90607.77
0.00
0.00
62
Guinea
2679.58
2679.58
0.00
0.00
63
Sudan
4959.80
4959.80
0.00
0.00
64
Bolivia
1274.49
1274.49
0.00
0.00
65
Guatemala
2576.10
2576.10
0.00
0.00
66
Zaire
3196.57
3196.57
0.00
0.00
67
Mongolia
494.55
494.55
0.00
0.00
68
Argentina
760.34
760.34
0.00
0.00
69
Central African Rep
931.40
931.40
0.00
0.00
70
Iceland
222.94
222.94
0.00
0.00
71
Cyprus
462.86
462.86
0.00
0.00
72
Malta
15.92
15.92
0.00
0.00
73
Switzerland
4953.66
4953.66
0.00
0.00
74
Greece
7067.94
7067.94
0.00
0.00
75
France
43046.41
43046.41
0.00
0.00
76
Korea, Rep
8015.01
8015.01
0.00
0.00
77
Yugoslavia
12737.09
12737.09
0.00
0.00
78
Viet Nam
1944.14
1944.14
0.00
0.00
79
Spain
11066.89
11066.89
0.00
0.00
80
Philippines
21083.13
21083.13
0.00
0.00
WORLD
4898845.23
1460178.16
3438667.07
100.00
Us^ij
31
Appendix 4
Annual Net Emissions to the atmosphere of Methane (as calculated by CSE)
SI.
No.
Country
1
2
3
4
5
6
7
8
9
10
11
12
13
14
15
16
17
18
19
20
21
22
23
24
25
26
27
28
29
30
31
32
33
34
35
36
37
38
39
40
41
42
43
44
45
46
47
48
49
50
51
Excess Emisssions
of Methane over
permissible
limits
('000 t of carbon
equivalent)
Permissible
Emissions of
Methane
obtained through
tradeable quotas
from other
countries
('000 t of carbon
equivalent)
Net Emissions
of Methane
to the atmosphere
('000 t of carbon
equivalent)
United States
Canada
Saudi Arabia
Australia
Algeria
Netherlands
New Zealand
Argentina
Oman
Qatar
Kuwait
Norway
Kampuchea
Uruguay
Thailand
Ireland
Mongolia
Bahrain
Libya
Luxembourg
Suriname
Botswana
U.S.S.R.
Bangladesh
France
Venezuela
Hungary
Somalia
Mexico
Denmark
Nepal
Czechoslovakia
Guinea-Bissau
Austria
Madagascar
Guinea
Iceland
Bolivia
Lao People's Dem Rep
Sudan
Romania
Paraguay
Colombia
Poland
Viet Nam
Germany, Fed Rep
United Kingdom
South Africa
Mauritania
Brazil
Myanmar
601265.98
174803.00
80765.50
69563.09
53789.97
41946.61
23726.49
45335.98
11163.06
8720.94
9490.98
9377.21
11379.60
6654.26
53049.84
5244.29
3143.02
950.06
4375.37
• 595.29
408.06
1110.89
139528.66
28959.26
35801.43
12935.56
2407.12
5356.65
49701.02
1186.75
7755.13
822.91
421.03
115.25
6493.95
46.12
72.01
61.00
2806.50
563.23
993.37
557.86
237.78
15058.99
8716.44
2040.57
39033.74
19920.16
1029.28
51747.84
21524.10
228350.77
24282.89
12920.33
15299.95
23274.92
13559.24
3114.96
29597.63
1374.50
366.53
1924.30
3847.89
7513.95
2840.64
51039.88
3390.39
2015 94
458.17
4123.51
366.47
366.53
1110.89
139528.66
28959.26
35801.43
12935.56
2407.12
5356.65
49701.02
1186.75
7755.13
822.91
421.03
115.25
6493.95
46.12
72.01
61.00
2806.50
563.23
993.37
557.86
237.78
15058.99
8716.44
2040.57
39033.74
19920.16
1029.28
51747.84
21524.17
372915.21
150520.11
67845.17
54263.14
30515.05
28387.38
20611.53
15738 35
9788.56
8354.41
7566.68
5529.32
3865.65
3813.62
2009.96
1853.91
1127.09
491.89
251.86
228.82
41.53
0.00
0.00
0.00
0.00
0.00
0.00
0.00
0.00
0.00
0.00
0.00
0.00
0.00
0.00
0.00
0.00
0.00
0.00
0.00
0.00
0.00
0.00
0.00
0.00
0.00
0.00
0.00
0.00
0.00
0.07
47.46
19.16
8.63
6.91
3 88
3.61
2.62
2.00
1.25
1.06
0.96
0.70
0.49
0.49
0.26
0.24
0.14
0.06
0.03
0.03
0.01
0.00
0.00
0.00
0.00
0.00
0.00
0.00
0.00
0.00
0.00
0.00
0.00
0.00
0.00
0.00
0.00
0.00
0.00
0.00
0.00
0.00
0.00
0.00
0.00
0.00
0.00
0.00
0.00
0.00
0.00
World
1672753.21
887034.04
785719.17
99.99
32
Percentage of
total net
Emissions of
Methane
in the world
(%)
Appendix 5
Appendix 6
Per capita Annual Net Emissions to the atmosphere of Carbon
Dioxide (as calculated by CSE)
Per capita Annual Net Emission to the atmosphere of Methane
(as calculated by CSE)
SI.No
Net
Country
1
2
Lao People’s Dem Rep
Bahrain
3
United Arab Emirates
4
5
SI. No
Country
Per capita
Net Emissions
of Methane
to the atmosphere
(tonnes of carbon
equivalent)
9.06
1
Qatar
9.06
7.12
2
Oman
7.12
7.09
3
New Zealand
7.09
Brazil
6.65
4
Canada
6.65
Cote d'Ivoire
Qatar
6.37
5
Saudi Arabia
6.37
6
6.12
6
Kuwait
6.12
7
Luxembourg
3.92
7
Australia
8
German Dem Rep
3.74
8
Netherlands
3.92
3.74
Per cap ita Annual
Emissions
of Carbon Dioxido
to the atmosphere
(tonnes of carbon
equivalent)
9
Costa Rica
3.56
9
United States
3 56
10
United States
3.25
10
Norway
3.25
11
Nicaragua
2.83
11
Uruguay
2 83
12
Kuwait
2.65
12
Algeria
2.65
13
14
Colombia
2.53
2.53
2.50
13
14
Bahrain
Czechoslovakia
Luxembourg
2.50
15
Canada
2.47
15
Mongolia
2.47
16
Ecuador
231
16
Ireland
17
Oman
2.27
17
•Argentina
2.31
2.27
18
Australia
2.19
18
Kampuchea
2.19
19
Trinidad and Tobago
2.07
19
Suriname
2.07
20
Bulgaria
2.06
20
Libya
2.06
21
Myanmar
1.95
21
Thailand
1.95
22
U.S.S.R.
1.91
23
Poland
1.67
24
Denmark
1.63
25
Saudi Arabia
1.60
26
Cameroon
1.50
27
Guinea-Bissau
1.35
28
Germany, Fed Rep
1.32
29
Liberia
1.27
30
Norway
1.25
31
Finland
1.25
32
Singapore
1.22
33
Malaysia
1.17
34
United Kingdom
1.08
35
Belgium
1.03
36
Gabon
0.97
37
Panama
0.88
38
Romania
0.82
39
Netherlands
0.76
40
Peru
0.63
41
Venezuela
0.55
42
South Africa
0.54
43
44
Ireland
0.41
Honduras
0.34
45
Japan
0.32
46
Austria
0.30
47
Hungary
0.29
48
Thailand
0.29
49
Madagascar
0.26
50
Malawi
0.24
51
Sweden
0.18
52
Congo
0.16
53
Paraguay
0.14
54
Italy
0.10
55
Israel
0.08
56
Korea, Dem People's Rep
0.06
57
Suriname
0.06
58
New Zealand
0.04
33
Appendix 7
Annual Net Emissions of all Greenhouse Gases to the atmosphere (as calculated by CSE)
Country
SI.
No.
Not Emissions
ol Carbon dioxide
('000 t ol Carbon
equivalent)
Net Emissions
of Methane
fOOO t of
Carbon
equivalent)
Not Emissions
of CFCs
( 000 t of
Carbon
equivalent)
Net Emissions
of all Green
house gases
( 000 t of
Carbon
equivalent)
Comulative
share of
world total
(*)
1
United States
808791.78
372915.21
350000.00
1531706.99
27.40
2
Brazil
1000776.13
0.00
16000.00
1016776.13
45.65
3
U.S.S.R.
550084.08
0.00
180000.00
730084.08
58.72
4
Canada
65563.81
150520.11
36000.00
252083.92
63.24
5
Germany, Fed Rep
79723.04
0.00
75000.00
154723.04
66.01
6
Japan
39968.56
0.00
100000.00
139968.56
68.52
7
United Kingdom
61273.24
0.00
71000.00
132273.24
70.89
8
Australia
36643.80
54263.14
21000.00
111906.94
72.89
9
Saudi Arabia
22603.39
67845.17
6600.00
97048.56
74.64
10
Colombia
80506.58
0.00
5200.00
85706.58
76.17
11
Cote d’Ivoire
80213.30
0.00
2000.00
82213.30
77.64
12
German Dem Rep
62001.86
0.00
20000.00
82001.86
79.11
13
Myanmar
81407.53
0.00
0.00
81407.53
80.57
14
Lao People’s Dem Rep
78165.50
0.00
0.00
78165.50
81.97
15
Poland
64164.54
0.00
13000.00
77164.54
83.35
16
Italy
5601.00
0.00
71000.00
76601.00
84.72
17
France
0.00
0.00
69000.00
69000.00
85.96
18
Netherlands
11191.96
28387.38
18000.00
57579.34
86.99
19
Spain
0.00
0.00
48000.00
48000.00
87.85
20
Czechoslovakia
39214.41
0.00
2700.00
41914.41
88.60
21
Algeria
0.00
30515.05
4100.00
34615.05
89.22
22
China
0.00
0.00
32000.00
32000.00
89.79
23
Ecuador
24975.40
0.00
1700.00
26675.40
90.27
24
South Africa
18842.50
0.00
5800.00
24642.50
90.71
25
New Zealand
132.92
20611.53
3500.00
24244.45
91.15
26
Malaysia
20235.01
0.00
2500.00
22735.01
91.55
27
Belgium
10151.95
0.00
12000.00
22151.95
91.94
28
Thailand
15889.98
2009.96
3500.00
21399.94
92.32
29
Argentina
o'.oo
15738.35
5500.00
21238.35
92.68
30
Bulgaria
18544.50
0.00
1600.00
20144.50
93.02
31
Romania
19201.77
0.00
0.00
19201.77
93.34
32
Nigeria
0.00
0.00
18000.00
18000.00
93.74
33
Cameroon
16778.16
0.00
0.00
16778.16
94.04
34
Kuwait
5570.72
7566.68
1800.00
14937.39
94.31
35
Denmark
8314.88
0.00
6300.00
14614.88
94.57
3200.00
14051.97
94.82
36
Venezuela
10851.97
0.00
37
Peru
13986.38
0.00
0.00
13986.38
95.07
38
United Arab Emirates
11351.02
0.00
2300.00
13651.02
95.32
39
Oman
3399.08
9788.56
0.00
13187.64
95.55
40
Portugal
0.00
0.00
13000.00
13000.00
95.79
41
Finland
6236.95
0.00
6100.00
12336.95
96.01
42
Greece
0.00
0.00
12000.00
12000.00
96.22
43
Norway
5251.43
5529.32
1200.00
11980.76
96.44
44
Nicaragua
11019.62
0.00
610.00
11629.62
96.65
45
Austria
2215.42
0.00
9100.00
11315.42
96.85
11179.17
97.05
46
Costa Rica
10689.17
0.00
490.00
47
Qatar
2448.76
8354.41
0.00
10803.16
97.24
0.00
0.00
10000.00
10000.00
97.42
9500.00
9500.00
97.59
9200.00
9200.00
97.76
48
Switzerland
49
Indonesia
0.00
0.00
50
T urkey
0.00
0.00
Contd.
34
SI.
No.
Country
Net Emissions
of Carbon dioxide
('000 I of Carbon
equivalent)
Net Emissions
of Methane
( 000 t of
Carbon
equivalent)
Not Emissions
of CFCs
( 000 t of
Carbon
equivalent)
Net Emissions
of aS Green
house gases
( 000 t of
Carbon
equivalent)
Co mutative
share of
world total
(*)
51
Mexico
0.00^
0.00
9100.00
9100.00
97.92
52
Iran, Islamic Rep
0.00
0.00
9000.00
9000.00
98.08
53
Yugoslavia
0.00
0.00
8200.00
8200.00
98.23
54
Ireland
1511.74
1853.91
4500.00
7865.65
98 37
55
Sweden
1500.93
0.00
6300.00
7800.93
98.51
56
Singapore
3283.35
0.00
3700.00
6983.35
98.63
57
Israel
370.19
0.00
5400.00
5770.19
98.74
58
Korea, Rep
0.00
0.00
5400.00
5400.00
98.83
59
Egypt
0.00
0.00
5100.00
5100.00
98.92
60
Hungary
3045.53
0.00
1900.00
4945.53
99.01
61
Uruguay
0.00
3813.62
540.00
4353.62
99 09
62
Bahrain
3559.69
491.89
160 00
4211.59
99.17
63
Kampuchea
0.00
3865.65
0.00
3865.65
99.24
64
Liberia
3312.41
0.00
410.00
3722.41
99.30
65
Trinidad and Tobago
2685.21
0.00
640.00
3325.21
99.36
66
Madagascar
3067.67
0.00
0.00
3067.67
99.42
67
Iraq
0.00
0.00
3000.00
3000.00
99.47
2118.53
0.00
400.00
2518.53
99.52
0.00
0.00
2400.00
2400.00
99.56
1569.76
228.82
450.00
2248 58
99.60
0.00
0.00
2200.00
2200.00
99.64
68
Panama
69
Ghana
70
Luxembourg
71
Chile
72
Honduras
1742.88
0.00
350.00
2092 88
99.68
73
Malawi
2021.87
0.00
0.00
2021.87
99.71
74
Cuba
0.00
0.00
1800.00
1800.00
99.74
75
Zimbabwe
0.00
0.00
1500.00
1500.00
99 77
76
Korea, Dem People’s Rep
1414.01
0.00
0.00
1414.01
99.80
77
Guinea-Bissau
1352.39
0.00
0.00
1352.39
99.82
78
Tunisia
0.00
0.00
1300.00
1300.00
99.84
79
Senegal
0.00
0.00
.1200.00
1200.00
99.87
80
Dominican Rep
0.00
0.00
1200.00
1200.00
99.89
81
Gabon
1162.27
0.00
0.00
1162.27
99.91
82
Mongolia
0.00
1127.09
0.00
1127.09
99.93
83
El Salvador
0.00
0.00
860.00
860.00
99 94
84
India
0.00
0.00
700.00
700.00
99.96
85
Paraguay
623.37
0.00
0.00
623.37
99.97
86
Jamaica
0.00
0.00
420.00
420.00
99.98
87
Congo
313.78
0.00
0.00
313.78
99.99
88
Libya
0.00
251.86
0.00
251.86
99.99
89
Iceland
0.00
0.00
170.00
170.00
99 99
90
Suriname
22.76
41.53
68.00
132.28
100.00
91
Barbados
0.00
0.00
130.00
130.00
100.00
92
FIJI
0.00
0.00
130.00
130.00
100.00
3438660.44
785719.24
1358128.00
5582507.68
WORLD
35
Appendix 8
Per capita Annual Net Emissions all Greenhouse gases to the
atmosphere (as calculated by CSE)
SI.No
Country
Per capita Net
Emissions of
all Greenhouse
gases to the
atmosphere
(tonnes of Carbon
equivalent)
SI.No
Country
Per capita Net
Emissions of
all Greenhouse
gases to the
atmosphere
(tonnes of Carbon
equivalent)
1
Qatar
7.01
59
Mongolia
0.51
2
3
Lao People’s Dem Rep
9.06
60
0.47
Canada
9.51
61
Kampuchea
Hungary
4
Oman
8.79
62
Barbados
0.43
5
United Arab Emirates
8 53
63
Honduras
0.41
6
Bahrain
8.42
64
Thailand
0.38
7
New Zealand
7.13
65
Yugoslavia
0.34
8
Kuwait
7.11
66
0.33
9
Saudi Arabia
6.88
67
Suriname
Madagascar
10
Brazil
6.76
68
Malawi
0.24
11
Australia
6.70
69
0.19
12
Cote d’Ivoire
6.52
70
Fiji
Cuba
13
United States
6.15
71
Jamaica
0.17
14
Luxembourg
72
Chile
0.17
15
German Dem Rep
5.62
4.94
73
Dominican Rep
0.17
16
Netherlands
3.89
74
Turkey
0.17
17
Costa Rica
3.73
75
El Salvador
0.16
18
Nicaragua
2.98
76
Senegal
0.16
0.47
0.26
0.17
19
Denmark
2.87
77
Ghana
0.16
20
Norway
2.85
78
Nigeria
0.16
21
Colombia
2.70
79
Iran. Islamic Rep
0.16
22
Czechoslovakia
2.67
80
Iraq
0.16
23
Singapore
2.59
81
Tunisia
0.16
24
Trinidad and Tobago
2.56
82
Zimbabwe
0.15
25
Germany, Fed Rep
2.56
83
Congo
0.16
26
U.S.S.R.
2.54
84
Paraguay
0.14
27
Ecuador
2.47
85
Korea. Rep
0.12
28
Finland
2.47
86
Mexico
0.10
29
United Kingdom
Bulgaria
87
88
Egypt
Korea, Dem People's Rep
0.09
30
2.32
2.24
31
Ireland
2.13
89
Libya
0.06
32
Poland
2.01
90
Indonesia
0.05
33
Myanmar
1.95
91
China
0.03
34
Belgium
2.24
92
India
0.0008
35
Switzerland
1.54
36
Austria
1.51
37
Cameroon
1.50
38
Liberia
1.43
39
Uruguay
1.40
40
Algeria
1.36
41
Guinea-Bissau
1.35
42
Italy
1.34
43
Malaysia
1.31
44
Portugal
1.26
45
Israel
1.25
46
France
1.23
47
Spain
1.22
48
Greece
1.20
49
Japan
1.13
50
Panama
1.05
51
Gabon
0.97
52
Sweden
0.94
53
54
Romania
0.82
Venezuela
0.71
55
South Africa
0.70
56
Argentina
0.66
57
Peru
0.63
58
<.
Iceland
0.57
0.06
Appendix 9
Reasons why certain developing countries figure
In top 20 list of net emitters
36
Country
Main Greenhouse
Gas Involved
Reason
Brazil
Carbon Dioxide
Saudi Arabia
Methane
Colombia
Carbon Dioxide
Cote d’lvorie
Carbon Dioxide
Myanmar
Carbon Dioxide
Lao Peop !e's Dem Rep
Carbon Dioxide *
Land Use Change
(Deforestation)
Pipeline Leakage
(Consumption by West)
Land Use Change
(Deforestation)
Land Use Change
(Deforestation)
Land Use Change
(Deforestation)
Land Use Change
(Deforestation)
Pipeline Leakage
(Consumption by West)
Algeria
Methane
China
Ecuador
CFCs
Carbon Dioxide
Land Use Change
(Deforestation)
- Media
 16593.pdf
Position: 1024 (21 views)